Abstract
Vibration mode of piezoelectric ultrasonic microsensors was investigated on buckled diaphragm structures from the viewpoint of higher order vibration modes than the fundamental one. Several vibration modes were generated on the diaphragms as the response to an ultrasound pulse, and their natural frequencies changed with increasing the buckling deflection in different rates. The natural frequencies of some modes approached each other, and the modes were accordingly superposed and degraded into a single mode in the large buckling ranges. The large buckling of the diaphragms consequently improves their vibration and thus the output waveforms.
1. Introduction
Piezoelectric ultrasonic microsensors have been fabricated on thin diaphragm structures. Figure 1 illustrates an example of the sensor structure with the piezoelectric diaphragm. Since the static deflection of the diaphragm structure enhances the mechano-electric energy conversion efficiency in vibration [1], the diaphragms were fabricated to have a static deflection by buckling due to the stress of the thermally oxidized silicon. The vibrating piezoelectric diaphragm has an in-homogeneous polarization distribution [2], and the top electrode of the sensor is designed to avoid cancellation of the positive and negative charges in the fundamental vibration mode [3]. A short pulse or burst waveform for ultrasonic measurement, however, has a wide frequency range far beyond the fundamental one, resulting in undesired interference by higher order vibrations. In the phased array ultrasonic measurement, the output signal from the sensors are synthesized by delay and summation [4], and the interference between the sensors detrimentally affects the measurement [5]. In this work, the vibration modes of the piezoelectric diaphragms with various buckling deflections were evaluated and the influence of the buckling to the vibration was investigated.
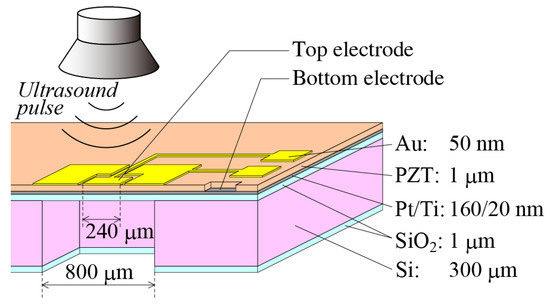
Figure 1.
A schematic illustration of the sensor structure: an example of one with a square diaphragm.
2. Experiments
The diaphragms having the buckling deflection in the range between 1.5 to 13 µm were fabricated. The buckling deflection was controlled by the stress of piezoelectric PZT film through its sol-gel preparation conditions [6]. Typical examples of fabricated square and circular diaphragm sensors are shown in Figure 2, as their top-view photographs and three-dimensional profiles measured by using optical profiler (Keyence, LT-9000, Osaka, Japan). A short ultrasound pulse was generated using electrical discharge and applied to the diaphragm sensors. Mechanical vibration of the diaphragm was measured by using laser Doppler vibrometer (Polytec Japan, MSV-400, Yokohama, Japan) and piezoelectric output waveform was obtained through a conventional amplifier (60 dB) and a storage oscilloscope (Yokogawa, DL850, Musashino, Japan). To evaluate the vibration modes in the transient response to the ultrasound pulse, the two-channel scanning vibrometry and velocity map synthesis technique was used [7]. We are interested in only centrosymmetric vibration modes because an anti-centrosymmetric vibration generates no piezoelectric output on the centrosymmetric top electrode. We evaluated the amount of contribution of each vibration mode by the vibration amplitude at the center of the diaphragm.
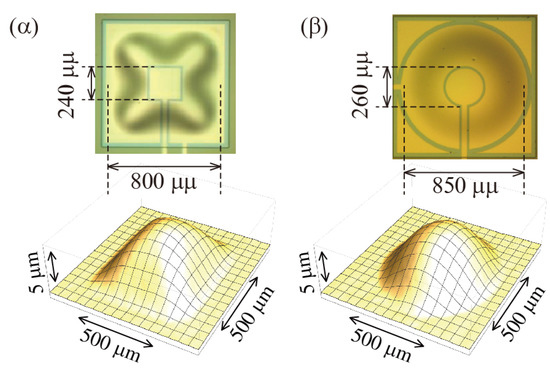
Figure 2.
Photographs and 3D profiles of (a) square, and (b) circular diaphragms.
3. Results and Discussion
Figure 3 shows typical examples of the pulse responses of four sensors having square {(a), (b)} or circular {(c), (d)} diaphragms with small {(a), (c)} or large {(b), (d)} buckling deflections. The square diaphragms show larger number of spectral peaks than the circular diaphragms because complicated centrosymmetric modes can be easily induced on the square shape vibrator whereas only radial nodes can be easily induced on the circular shape vibrator. In a comparison of the buckling deflection, the diaphragms having larger deflection generates smaller number of vibration modes in both cases of the square and circular shapes. The piezoelectric responses have smaller number of spectral peaks than the vibration spectra because the high order vibration modes (4), (5), (8) and (11) have both the positive and negative curvature (i.e., polarization) in the top electrode region and no contribution to the output voltage. One exception: mode (6) has a small vibration amplitude at the center of the diaphragm but has a large curvature on the electrode, and thus has a non-negligible contribution to the piezoelectric output. The sensors having smaller number of output spectral peaks, in general, show less distorted damping oscillation in their time course waveforms of the piezoelectric output as shown in Figure 3 (iv), as distortion: (a) > (b) > (c) > (d).
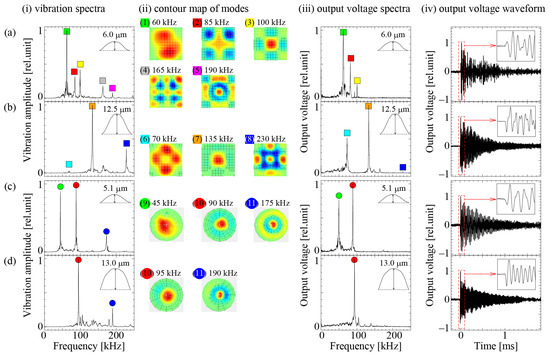
Figure 3.
Pulse responses of the sensors on buckled diaphragms; (a) square, 6.0 µm, (b) square, 12.5 µm, (c) circular, 5.1 µm, and (d) circular, 13.0 µm; (i) vibration spectra, (ii) contour maps of the vibration modes, (iii) output voltage spectra, and (iv) time course waveforms of the output voltage.
Why the large buckling deflection reduces the number of vibration mode? Figure 4 shows the natural frequencies of the vibration modes versus the buckling deflection. Each vibration mode changes its natural frequency to the buckling deflection in its own rate, which is partially similar to that theoretically explained [8]. As the result, mode (1) changes to mode (6), modes (2) and (3) are superposed into mode (7), modes (4) and (5) are superposed into mode (8), and mode (9) disappears, around the deflection 8 µm. As shown in Figure 3 (ii), the modes (2) and (3) have the same vibration phase near the center of the diaphragm whereas opposite phases in the surrounding area, and thus the superposed mode (7) has a large vibration amplitude only in the central region, resulting in a much simpler vibration shape. The similar superposition is also observed in the case of modes (4) and (5) into (8). Figure 5 shows the relative intensity of the dominant vibration mode versus the buckling deflection. In the large deflection region over 8~10 µm, the relative intensity of the dominant vibration modes drastically increases, and the circular diaphragms having the deflection around 13 µm have almost a single vibration mode with nearly 100% contribution of the dominant mode.
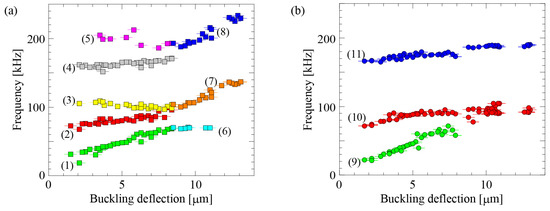
Figure 4.
Natural frequencies of the centrosymmetric vibration modes versus buckling deflection: (a) square diaphragms, and (b) circular diaphragms. Error bars indicate maximum and minimum values and plot marker indicates average value in 10-time measurement.
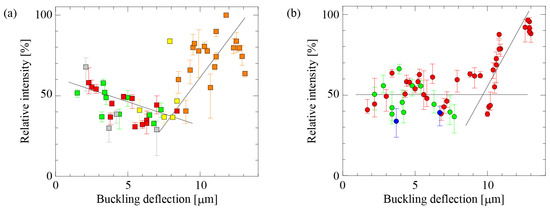
Figure 5.
Relative intensity of the dominant vibration mode versus buckling deflection: (a) square diaphragms, and (b) circular diaphragms. Error bars indicate maximum and minimum values and plot marker indicates average value in 10-time measurement.
4. Conclusions
Vibration mode and piezoelectric responses of ultrasonic microsensors were investigated on diaphragm structures, which were fabricated to have a buckling deflection for higher sensitivity. Influences of the buckling to the vibration were evaluated in laser Doppler vibrometry and in their piezoelectric responses to a short ultrasound pulse. Several vibration modes were generated on the diaphragms and their natural frequencies changed with increasing the buckling deflection in different rates. Natural frequencies of some modes approached each other in large buckling deflection ranges, and thus the vibration modes were superposed and degraded into a single mode, resulting in a much simpler vibration spectrum than that of the diaphragms having smaller buckling deflections. The results indicate that the diaphragm buckling is useful not only to enhance the sensitivity but also to improve the vibration of the diaphragm resulting in improved output signal waveforms.
Funding
This work was supported in part by Grant-in-Aid for Scientific Research (C) (KAKENHI) 15k06016 from Japan Society of the Promotion of Science (JSPS) and Research Grant from Nippon Sheet Glass Foundation for Materials Science and Engineering.
Conflicts of Interest
The authors declare no conflict of interest. The funding sponsors had no role in the design of the study; in the collection, analyses, or interpretation of data; in the writing of the manuscript, and in the decision to publish the results.
References
- Yamashita, K.; Nishimoto, H.; Okuyama, M. Diaphragm Deflection Control of Piezoelectric Ultrasonic Microsensors for Sensitivity Improvement. Sens. Actuators A 2007, 139, 118–123. [Google Scholar] [CrossRef]
- Yamashita, K.; Okuyama, M. Sensitivity improvement of diaphragm type ultrasonic sensors by complementary piezoelectric polarization. Sens. Actuators A 2006, 127, 119–122. [Google Scholar] [CrossRef]
- Bernstein, J.J.; Finberg, S.L.; Houston, K.; Niles, L.C.; Cross, L.E.; Li, K.K.; Udayakumar, K. Micromachined high frequency ferroelectric sonar transducers. IEEE Trans. UFFC 1997, 44, 960–969. [Google Scholar] [CrossRef]
- Wooh, S.-C.; Shi, Y. Optimization of Ultrasonic Phased Arrays. Rev. Progress Quantit. Nondestruct. Eval. 1998, 17, 883–890. [Google Scholar]
- Yamashita, K.; Chansomphou, L.; Murakami, H.; Okuyama, M. Ultrasonic micro array sensors using piezoelectric thin films and resonant frequency tuning. Sens. Act. A 2004, 114, 147–153. [Google Scholar] [CrossRef]
- Yamashita, K.; Shiomi, J.; Nishiumi, T.; Noda, M. Stress control on sol-gel PZT prepared for highly sensitive diaphragm structures of ultrasonic microsensors. In Proceedings of the 2016 Joint IEEE International Symposium on the Applications of Ferroelectrics, European Conference on Application of Polar Dielectrics, and Piezoelectric Force Microscopy Workshop (ISAF/ECAPD/PFM), Darmstadt, Germany, 21–25 August 2016. [Google Scholar]
- Yamashita, K.; Nishiumi, T.; Tanaka, H.; Noda, M. Vibration modes in impulse response of piezoelectric diaphragms for ultrasonic microsensors. In Proceedings of the 2016 IEEE 11th Annual International Conference on Nano/Micro Engineered and Molecular Systems (NEMS), Sendai, Japan, 17–20 April 2016. [Google Scholar]
- Kobayashi, S.; Kihira, M.; Kawasaki, S. Natural Frequency of Thin Plates. J. Jpn. Soc. Aeronaut. Eng. 1968, 16, 182–190. [Google Scholar] [CrossRef][Green Version]
Publisher’s Note: MDPI stays neutral with regard to jurisdictional claims in published maps and institutional affiliations. |
© 2018 by the authors. Licensee MDPI, Basel, Switzerland. This article is an open access article distributed under the terms and conditions of the Creative Commons Attribution (CC BY) license (https://creativecommons.org/licenses/by/4.0/).