Performance Degradations of MISFET-Based Hydrogen Sensors with Pd-Ta2O5-SiO2-Si Structure at Long-Time Operation †

Abstract
1. Introduction
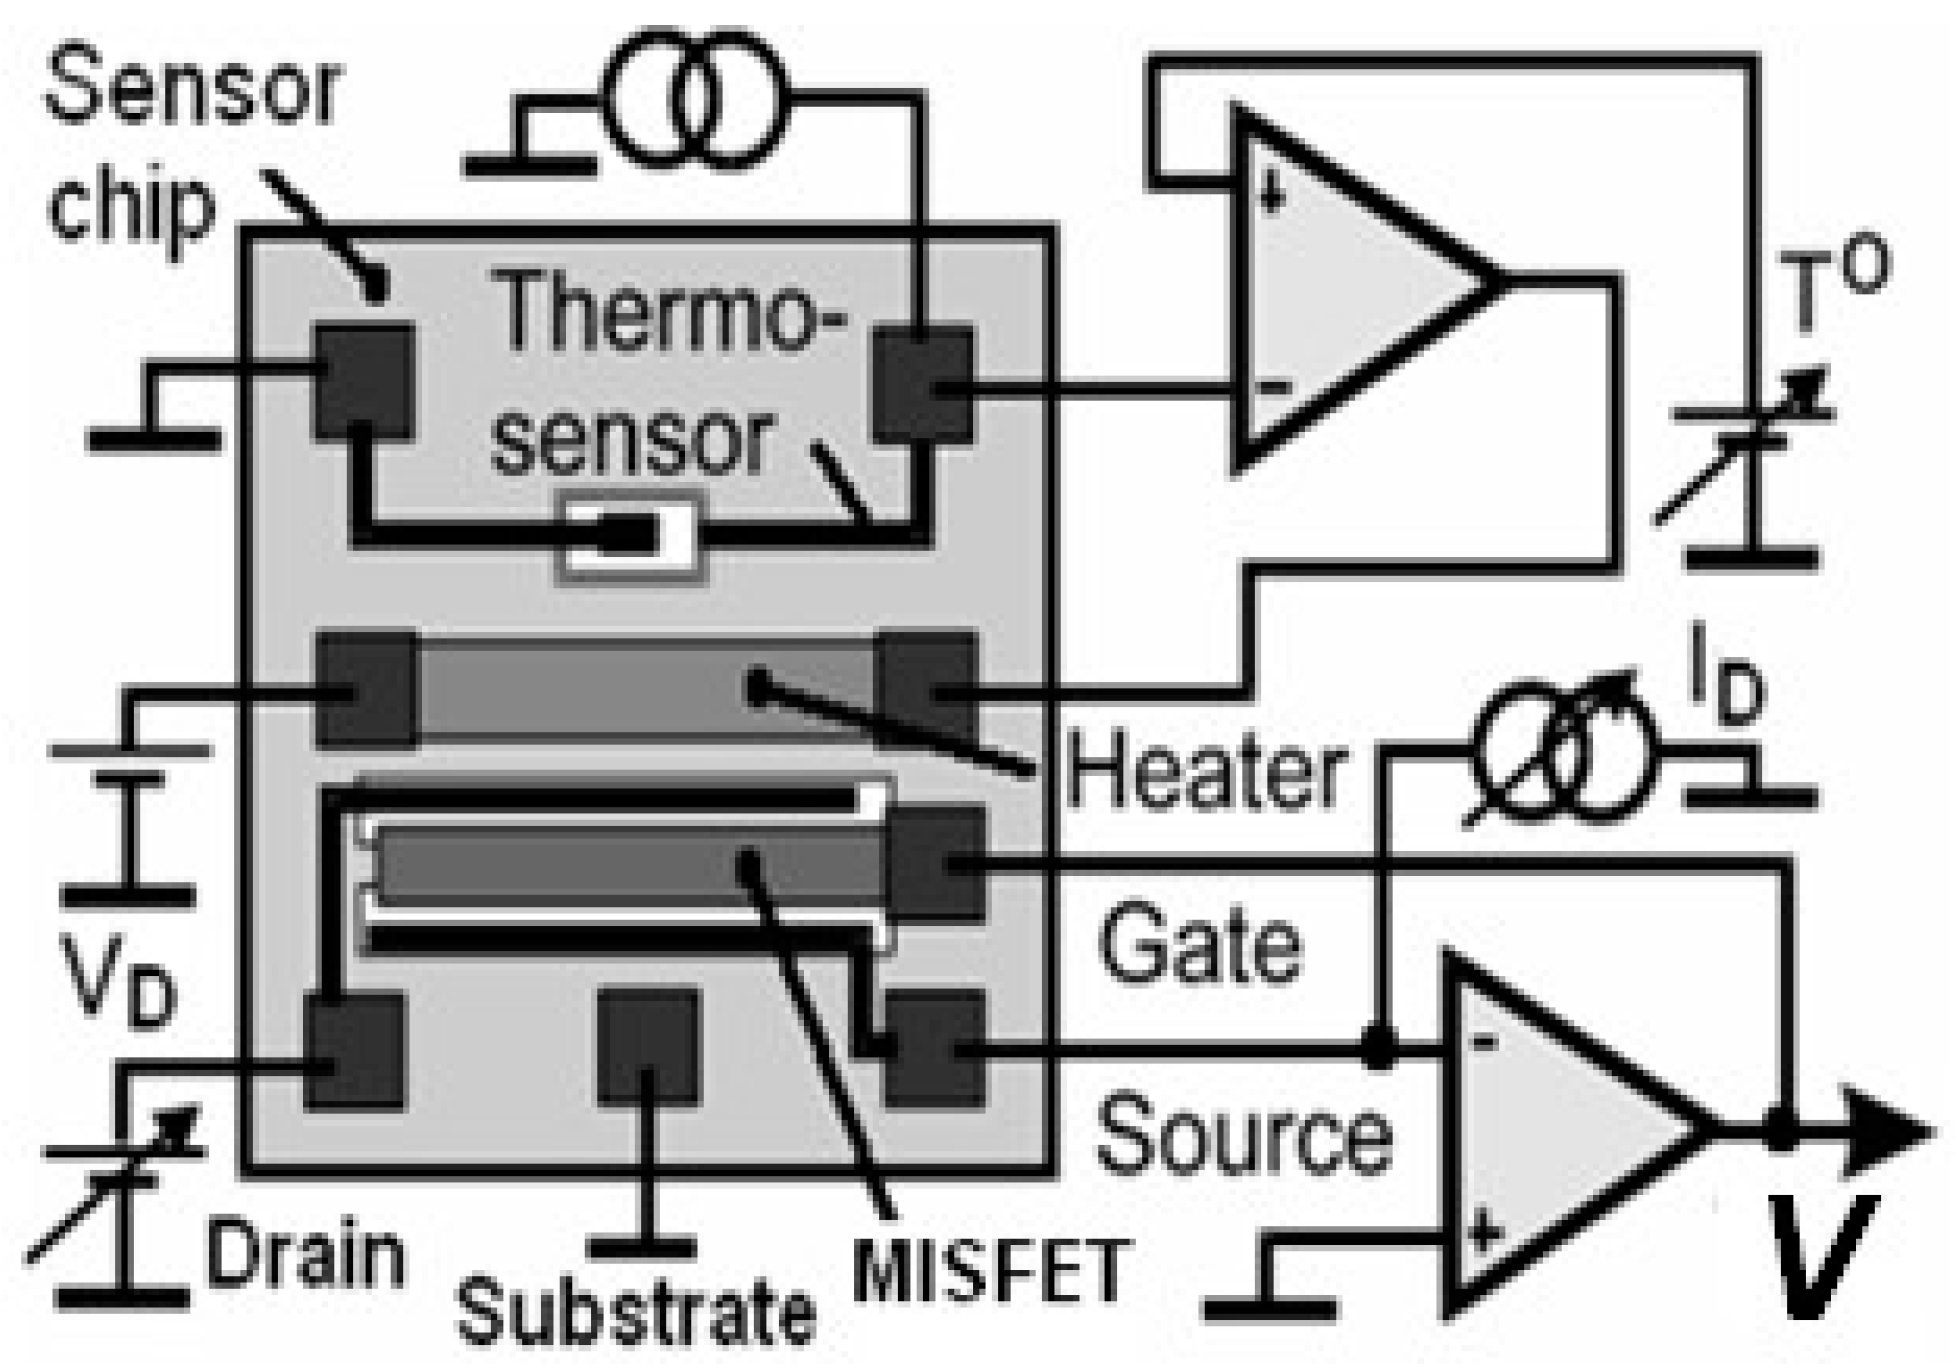
2. Materials and Methods
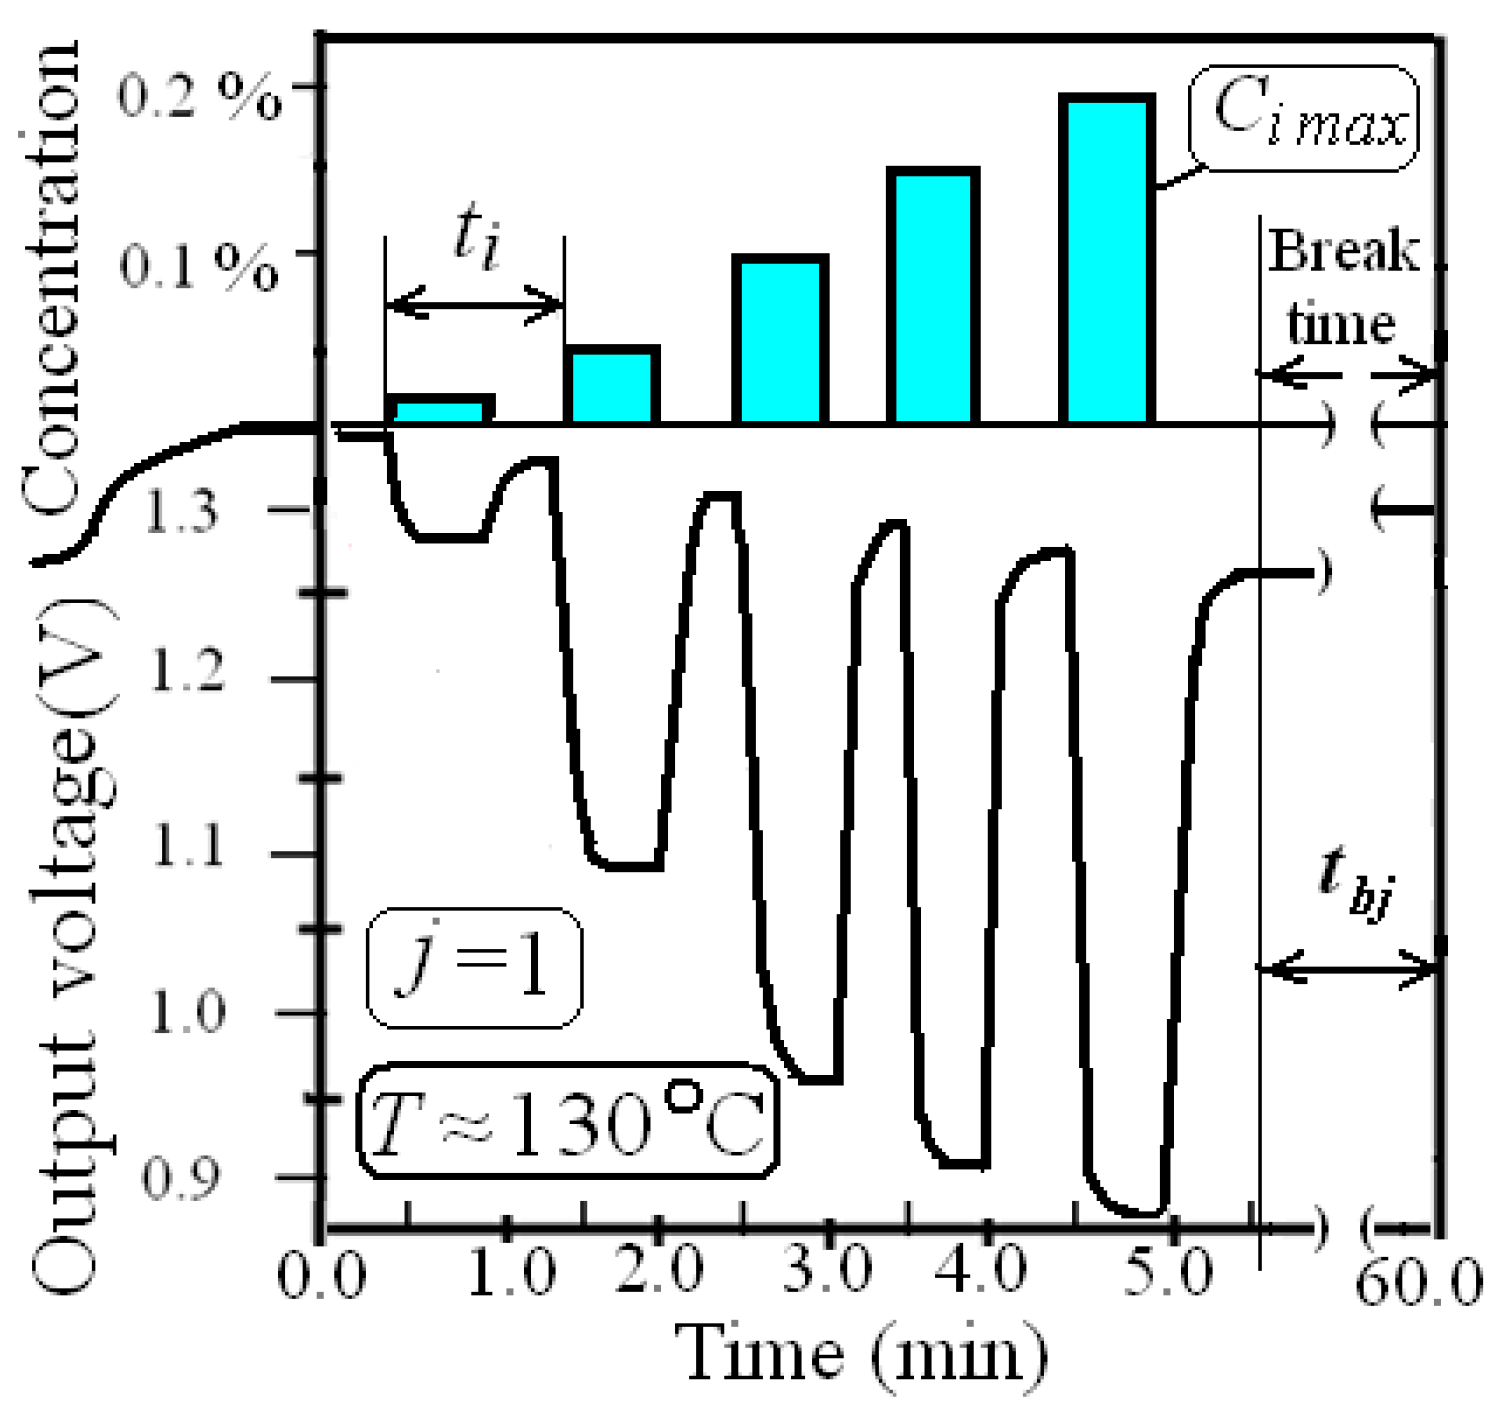
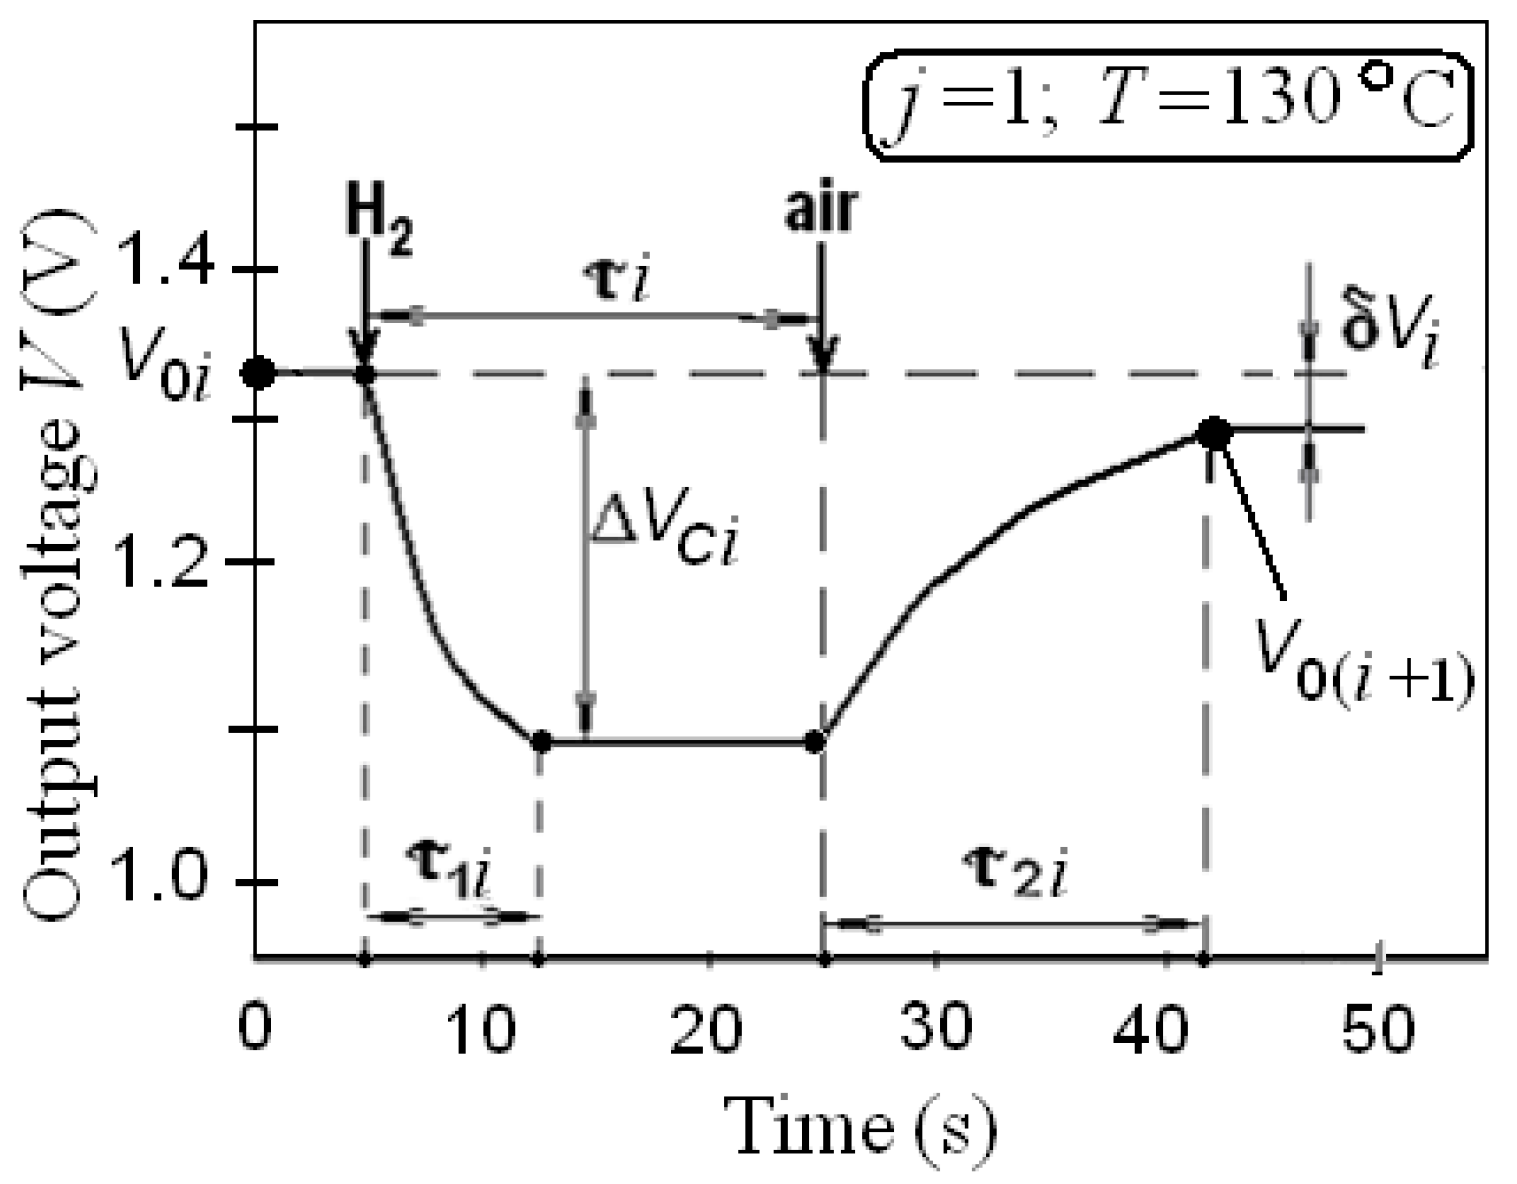
3. Results
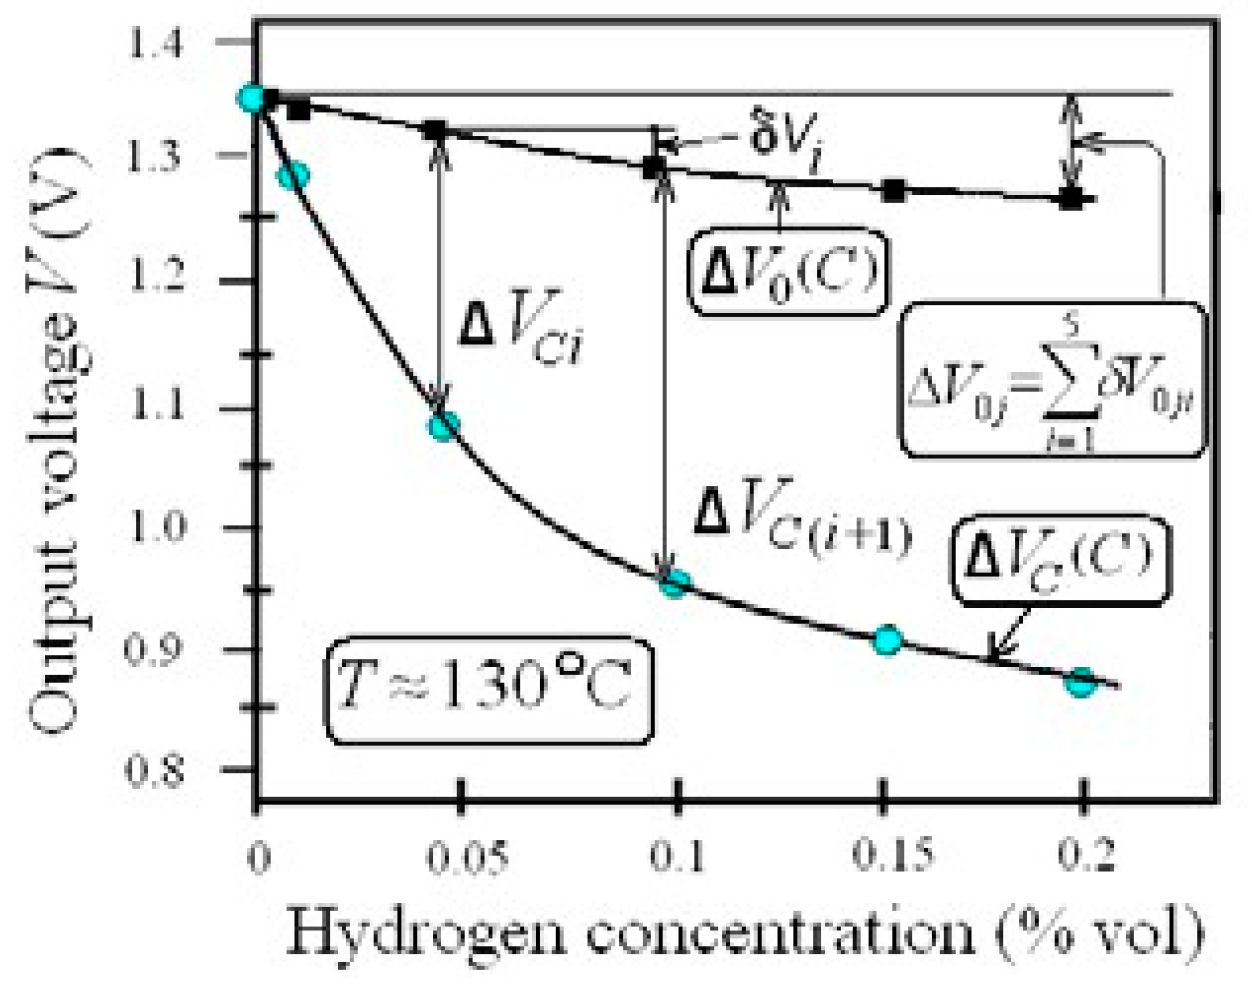
4. Discussion
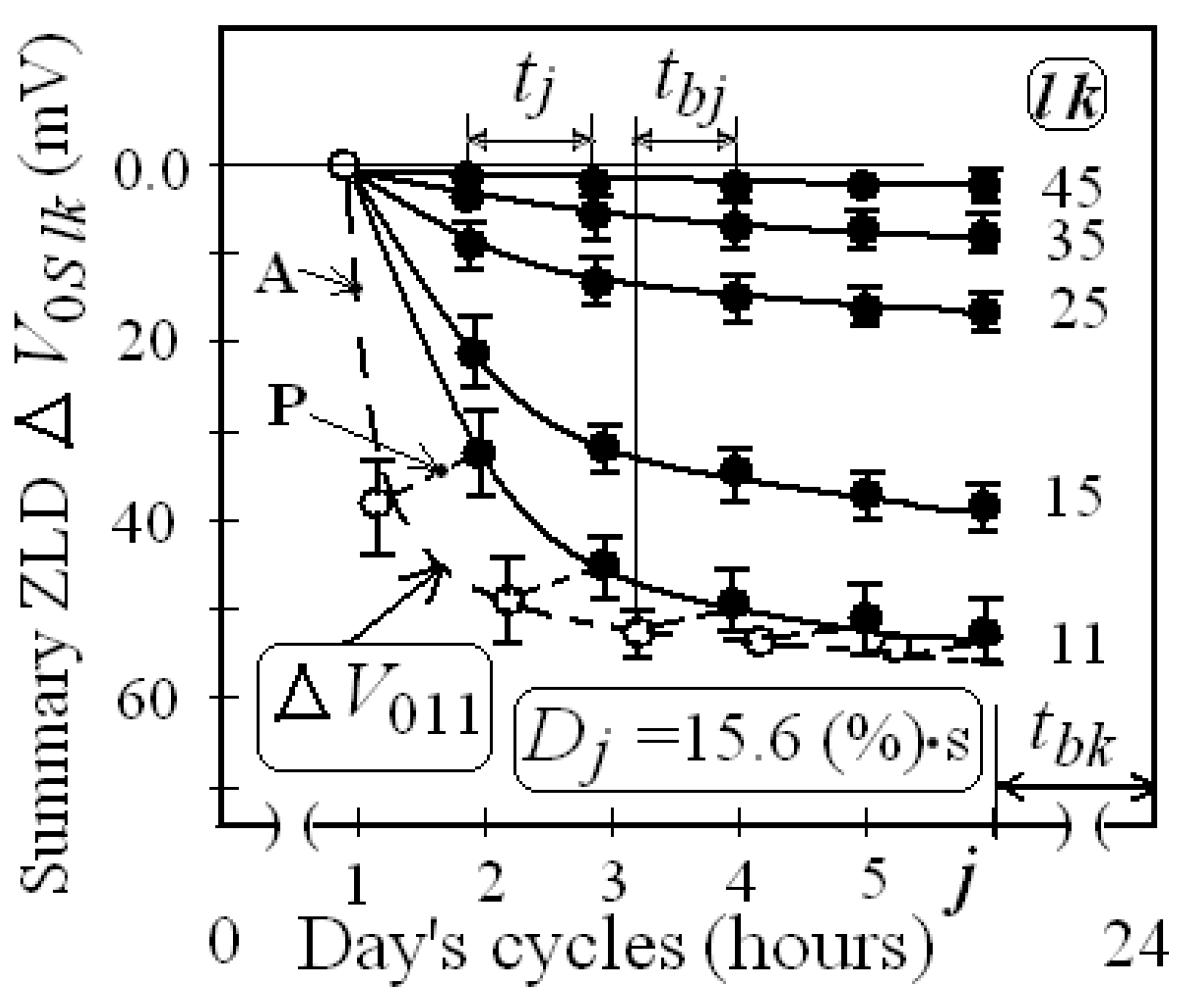
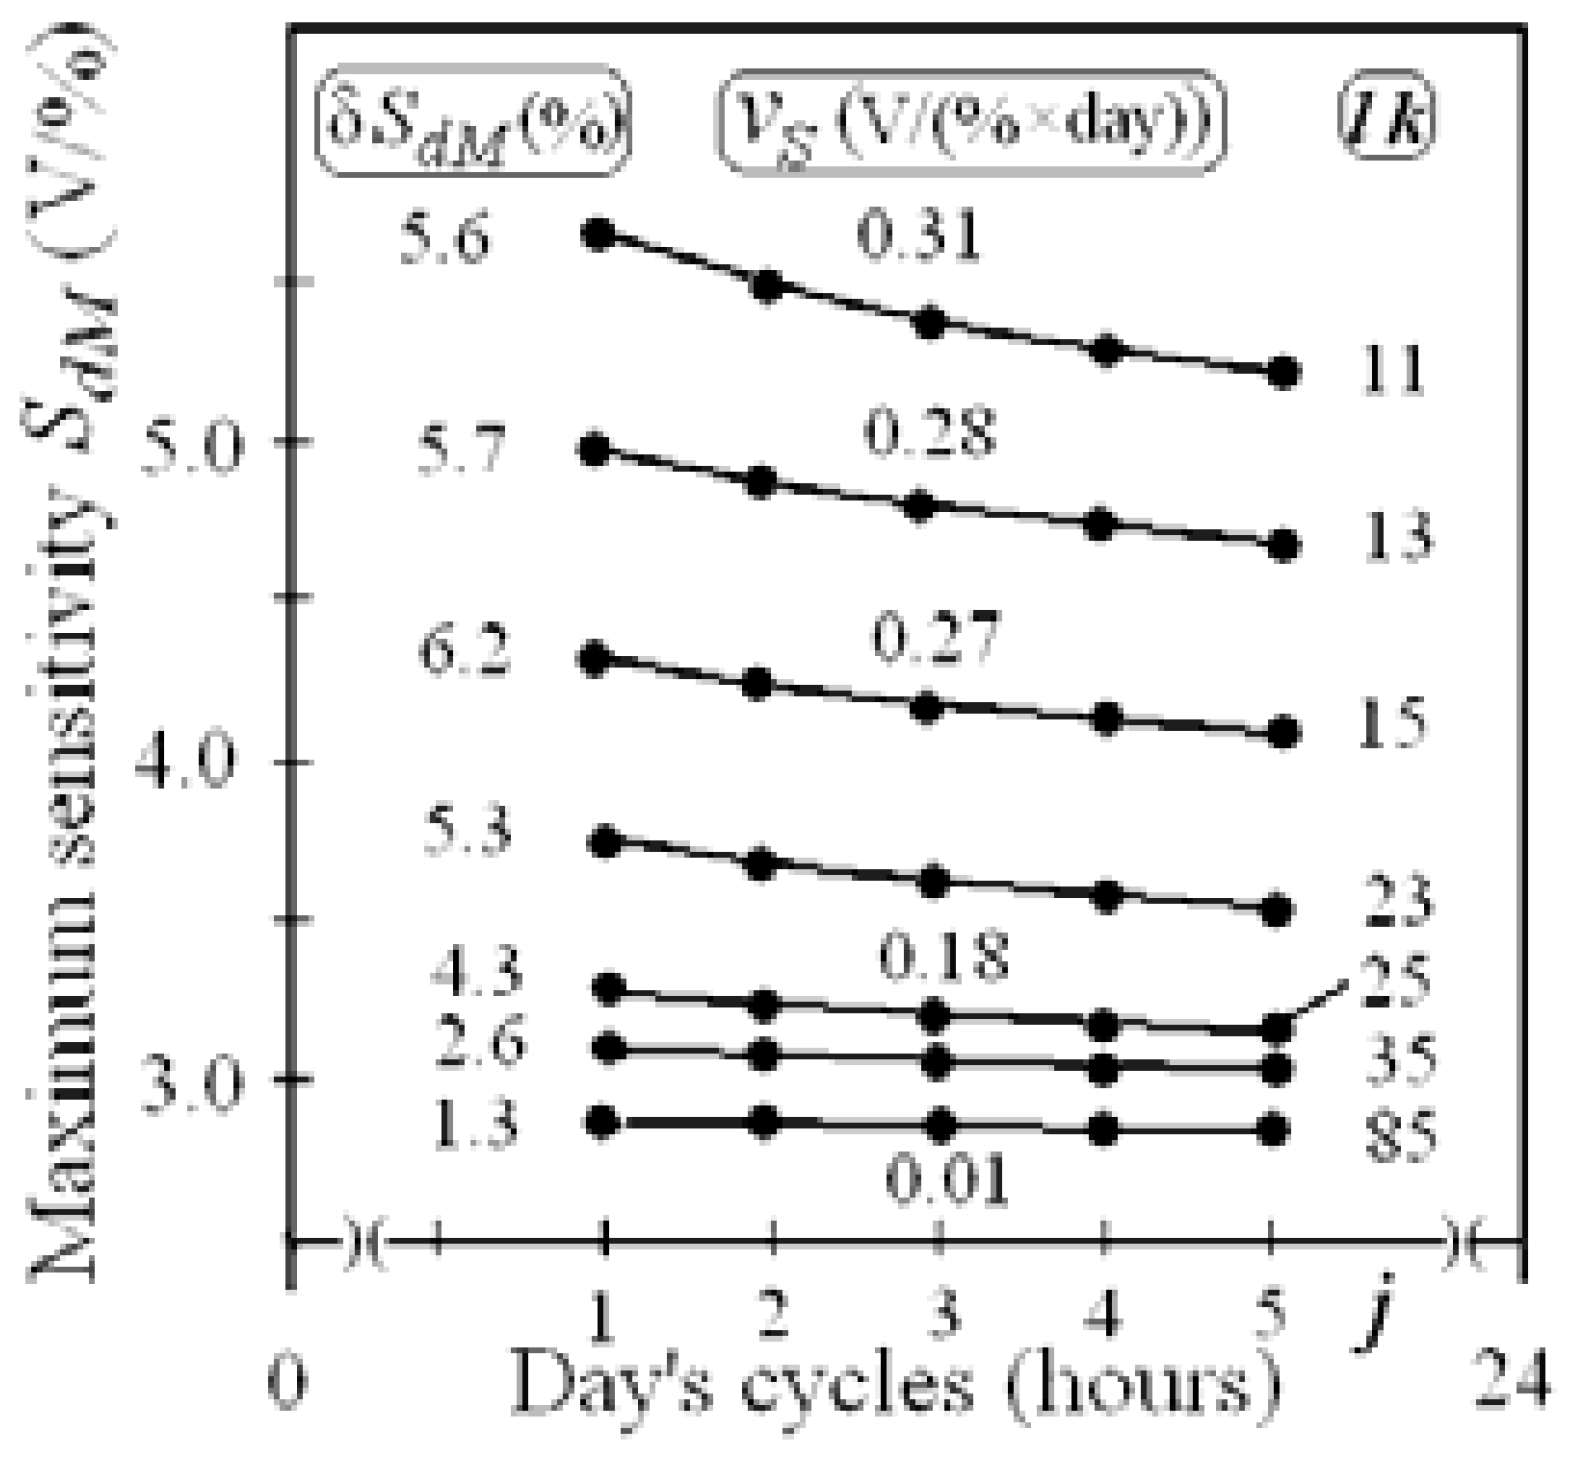
ΔVC(C,tC) = ΔVCM(C, tC)∙[1 − exp(−kC×C)]; SdM = kC(C, tC) × ΔVCM(C, tC),
5. Conclusions
Acknowledgments
References
- Lundström, I.; Armgarth, M.; Spetz, A.; Winquist, F. Gas sensors based on catalytic metal-gate field-effect devices. Sens. Actuators 1986, 3–4, 399–421. [Google Scholar] [CrossRef]
- Fomenko, S.; Gumenjuk, S.; Podlepetsky, B.; Chuvashov, V.; Safronkin, G. The influence of technological factors on hydrogen sensitivity of MOSFET sensors. Sens. Actuators B Chem. 1992, 10, 7–10. [Google Scholar] [CrossRef]
- Lin, K.W.; Cheng, C.C.; Cheng, S.Y.; Yu, K.H.; Wang, C.K.; Chuang, H.M.; Liu, W.C. A novel Pd/oxide/GaAs metal–insulator–semiconductor field-effect transistor (MISFET) hydrogen sensor. Semicond. Sci. Technol. 2001, 16, 997–1001. [Google Scholar] [CrossRef]
- Podlepetsky, B.I.; Nikiforova, M.Y.; Gumenyuk, S.V. Stability investigation of the characteristics of integral hydrogen sensors. Instrum. Exp. Tech. 2001, 44, 257–258. [Google Scholar] [CrossRef]
- Lundström, I.; Sundgren, H.; Winquist, F.; Eriksson, M.; Krants-Rülcker, C.; Lloyd-Spets, A. Twenty-five years of field effect gas sensor research in Linköping. Sens. Actuators B Chem. 2007, 121, 247–262. [Google Scholar] [CrossRef]
- Kalinina, L.; Litvinov, A.; Nikolaev, I.; Samotaev, N. MIS-Field Effect Sensors for low concentration of H2S for enviromental monitoring. Procedia Eng. 2010, 5, 1216–1219. [Google Scholar] [CrossRef][Green Version]
- Andersson, M.; Pearce, R.; LloydSpetz, A. New generation SiC based field effect transistor gas sensors. Sens. Actuators B Chem. 2013, 179, 95–106. [Google Scholar] [CrossRef]
- Podlepetsky, B.I. Integrated Hydrogen Sensors Based on MIS Transistor Sensitive Elements: Modeling of Characteristics. Autom. Remote Control. 2015, 76, 535–547. [Google Scholar] [CrossRef]
- Podlepetsky, B.I. Effect of irradiation on hydrogen sensors based on MISFET. Sens. Actuators B 2017, 238, 1207–1213. [Google Scholar] [CrossRef]
- Podlepetsky, B.I.; Nikiforova, M.Y.; Kovalenko, A.V. Chip temperature influence on characteristics of MISFET hydrogen sensors. Sens. Actuators B 2018, 254, 1200–1205. [Google Scholar] [CrossRef]


| i-Response | j-Cycle | k-and l-Cycles | General Values |
|---|---|---|---|
| V00—primary voltage | Maximum amplitude ΔVCM | Amplitude’ changes: δVCM lk = ΔVCM − ΔVCMlk | N—number of sensors |
| τi—H2 pulse duration | Amplitude’ changes: δVCM j= ΔVCM − ΔVCMj | Y0—primary value of Y | |
| Ci—H2 concentration | break times tbk and tbl | average of Y, variation indices, degradation degree: | |
| V0i—initial voltage | differential sensitivity: Sdj = d(ΔVC)/dC | cycle time tk= tj × jmax+ tbk |  |
| ΔVCi—response amplitude | cycle time tl = tk × kmax + tbl | ||
| δV0i—residual value | maximum sensitivity SdM lk | summary ZLD (j = 1; k = 1) | |
| τ1i—response time | break time tbj | ΔV0Sk= V0k − V0(k+1) | |
| τ2i—relaxation time | cycle time tj = tji × imax+ tbj | ΔV0Sl= V0l − V0(l+1); | |
| ti—response period | ZLD ΔV0j= V0j1 − V0j i max | ΔV0S= V0111 − V0( lkji) max | |
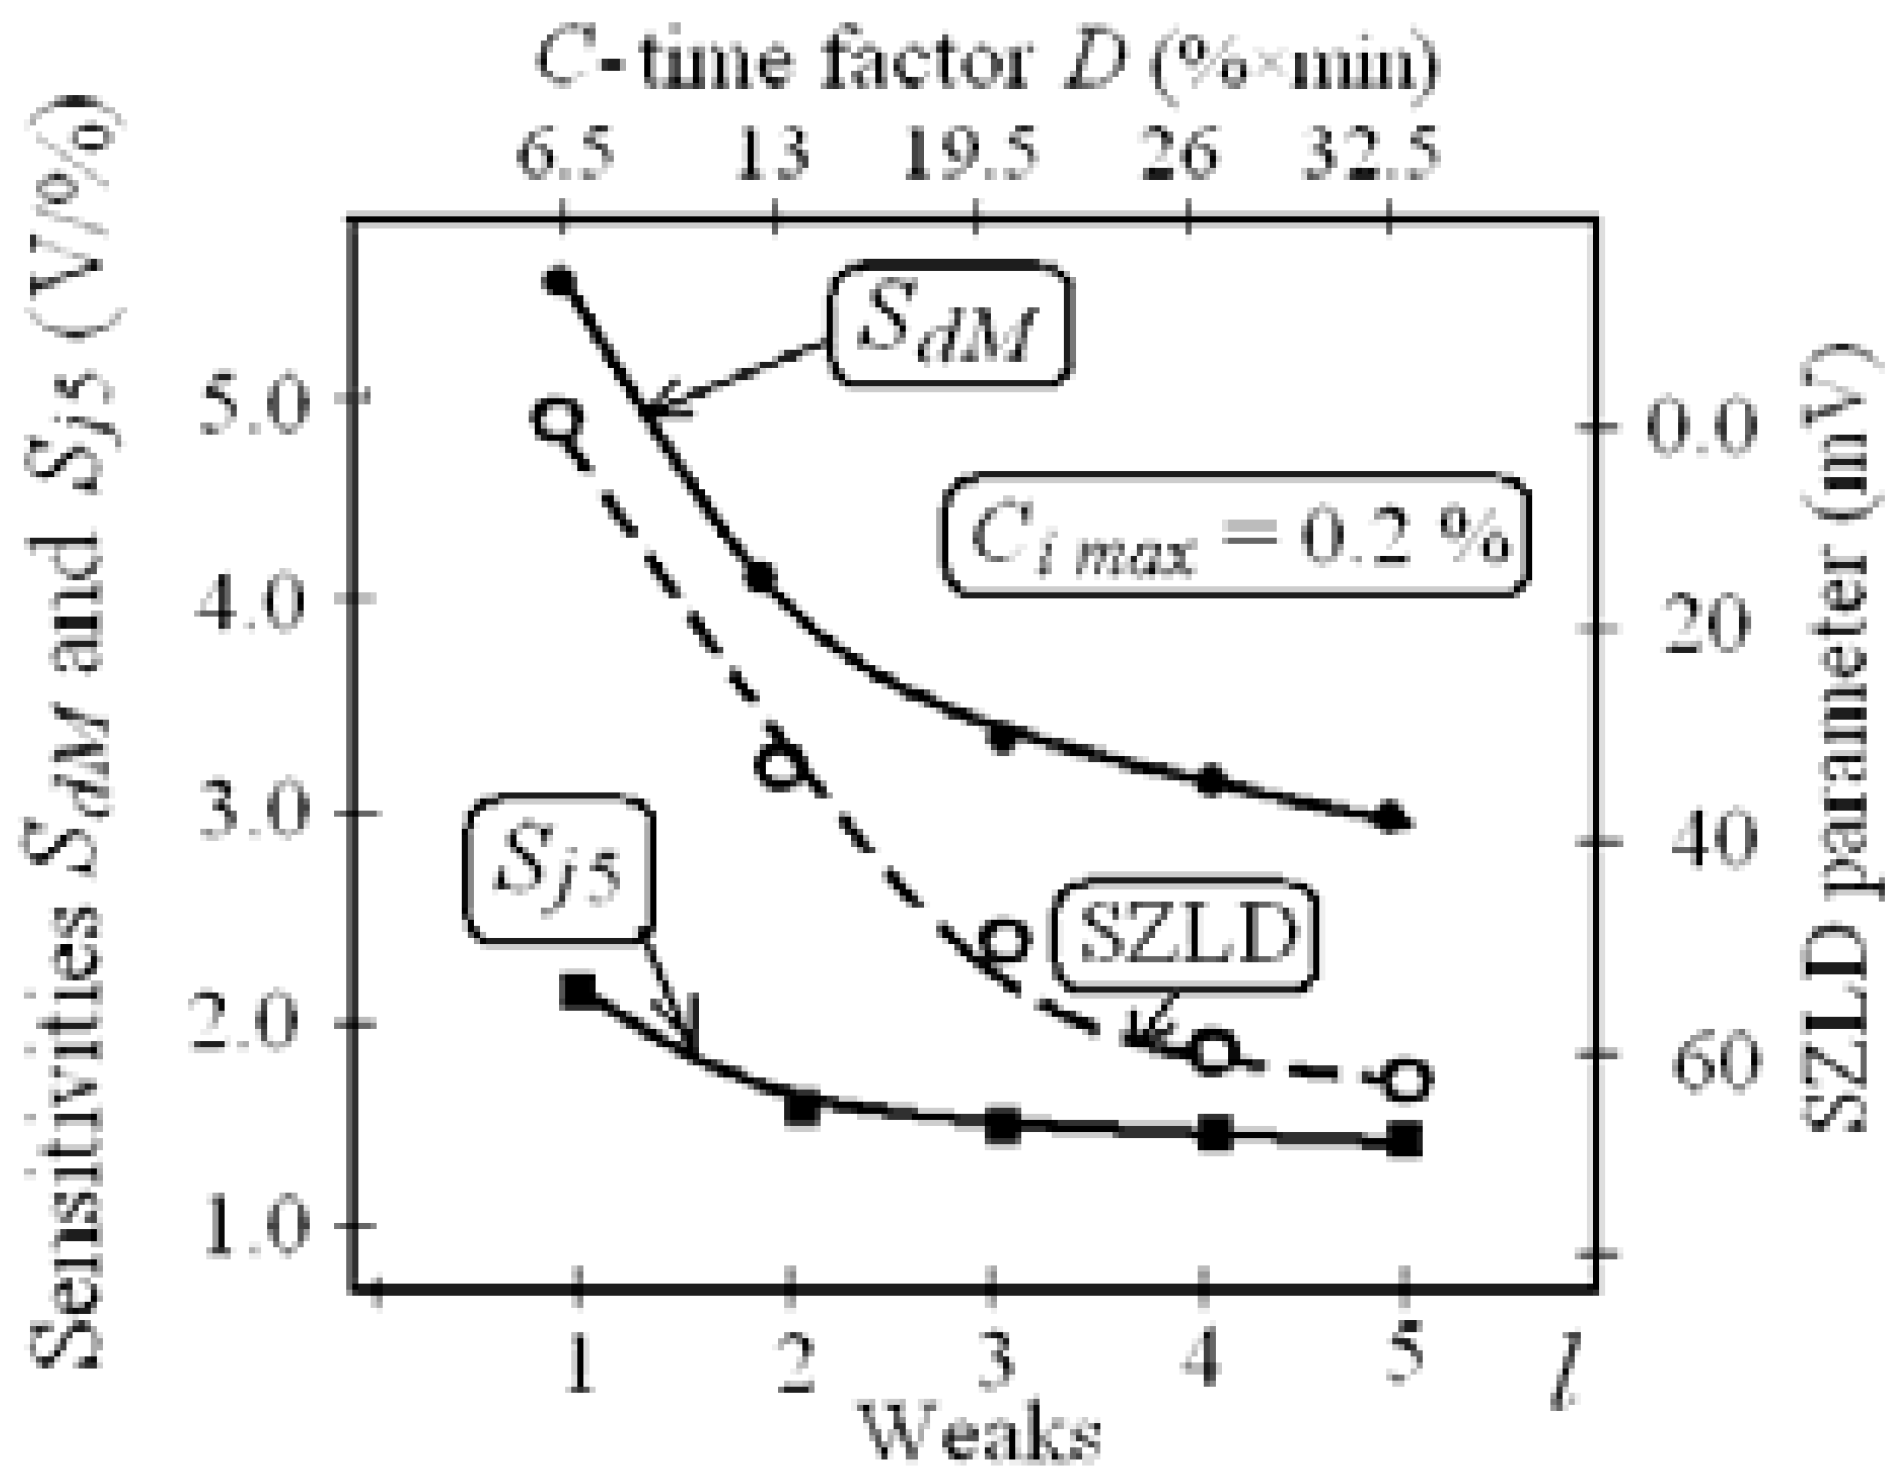
| Si = ΔVCi /Ci − sensitivity | summary SZLD (I = 1): | C-time factor D = nk∙nl∙Djmax | |
| Di= (Ci·τi) is Ci-time factor | ΔV0Slkj = V0lk1 − V0lk(j+1) | Degradation rate vY = dY/dt |
| ↓parameters/lkj→ | 111 | 155 | 255 | 355 | 455 | 555 | 655 | 755 | 855 | Total ΔYD,% |
|---|---|---|---|---|---|---|---|---|---|---|
| ΔVCM, V/ρVCM, % | 0.46/4.3 | 0.41/3.7 | 0.39/3.8 | 0.38/3.9 | 0.37/4.0 | 0.36/4.2 | 21.7 | |||
| kC, 1/%/ρkCM, % | 12/8.2 | 10/8.8 | 8.5/10.6 | 8.2/10.6 | 8.1/11.5 | 8.0/11.5 | 33.3 | |||
| SdM, V/%/ρSdM, % | 5.52/12.5 | 4.1/12.5 | 3.32/14.4 | 3.12/14.5 | 2.96/15.5 | 2.88/15.7 | 47.8 | |||
| vS, V/(% × day) | - | 0.28 | 0.16 | 0.024 | 0.016 | 0.08 | - | |||
| Sj5, V/%/δSj5, % | 2.1/2.4 | 1.8/2.8 | 1.6/3.1 | 1.55/3.2 | 1.50/3.3 | 1.45/3.45 | 31.0 | |||
| ΔV0Slkj, mV | 33 | 37 | 16 | 7 | 3 | - | ||||
| vΔV0, mV/(day) | - | 7.4 | 3.2 | 1.4 | 0.6 | - | ||||
| τ1i, s/τ2i, s (i = 2) | 10/15 | 9/15 | 8/15 | 7/16 | 7/15 | 30/6.6 | ||||
| τ1i, s/τ2i, s (i = 5) | 7/17 | 7/16 | 6/16 | 6/16 | 7/15 | 14.3/11.8 | ||||
| SdM, V/%/ρSdM, % (for Ci max = 1.0%) | 5.5/8.7 | 3.9/9.2 | 3.65/9.8 | 3.5/10.2 | 3.4/9.5 | - | 38.2 | |||
| D, % × min | 0.26 | 6.5 | 13 | 19.5 | 26 | 32.5 | 39 | 45.5 | 52 | - |
Publisher’s Note: MDPI stays neutral with regard to jurisdictional claims in published maps and institutional affiliations. |
© 2018 by the authors. Licensee MDPI, Basel, Switzerland. This article is an open access article distributed under the terms and conditions of the Creative Commons Attribution (CC BY) license (https://creativecommons.org/licenses/by/4.0/).
Share and Cite
Podlepetsky, B.; Nikiforova, M.; Kovalenko, A. Performance Degradations of MISFET-Based Hydrogen Sensors with Pd-Ta2O5-SiO2-Si Structure at Long-Time Operation. Proceedings 2018, 2, 777. https://doi.org/10.3390/proceedings2130777
Podlepetsky B, Nikiforova M, Kovalenko A. Performance Degradations of MISFET-Based Hydrogen Sensors with Pd-Ta2O5-SiO2-Si Structure at Long-Time Operation. Proceedings. 2018; 2(13):777. https://doi.org/10.3390/proceedings2130777
Chicago/Turabian StylePodlepetsky, Boris, Marina Nikiforova, and Andrew Kovalenko. 2018. "Performance Degradations of MISFET-Based Hydrogen Sensors with Pd-Ta2O5-SiO2-Si Structure at Long-Time Operation" Proceedings 2, no. 13: 777. https://doi.org/10.3390/proceedings2130777
APA StylePodlepetsky, B., Nikiforova, M., & Kovalenko, A. (2018). Performance Degradations of MISFET-Based Hydrogen Sensors with Pd-Ta2O5-SiO2-Si Structure at Long-Time Operation. Proceedings, 2(13), 777. https://doi.org/10.3390/proceedings2130777