A High-Efficiency RF Harvester with Maximum Power Point Tracking †

 ,
,  ,
, 
Abstract
:1. Introduction
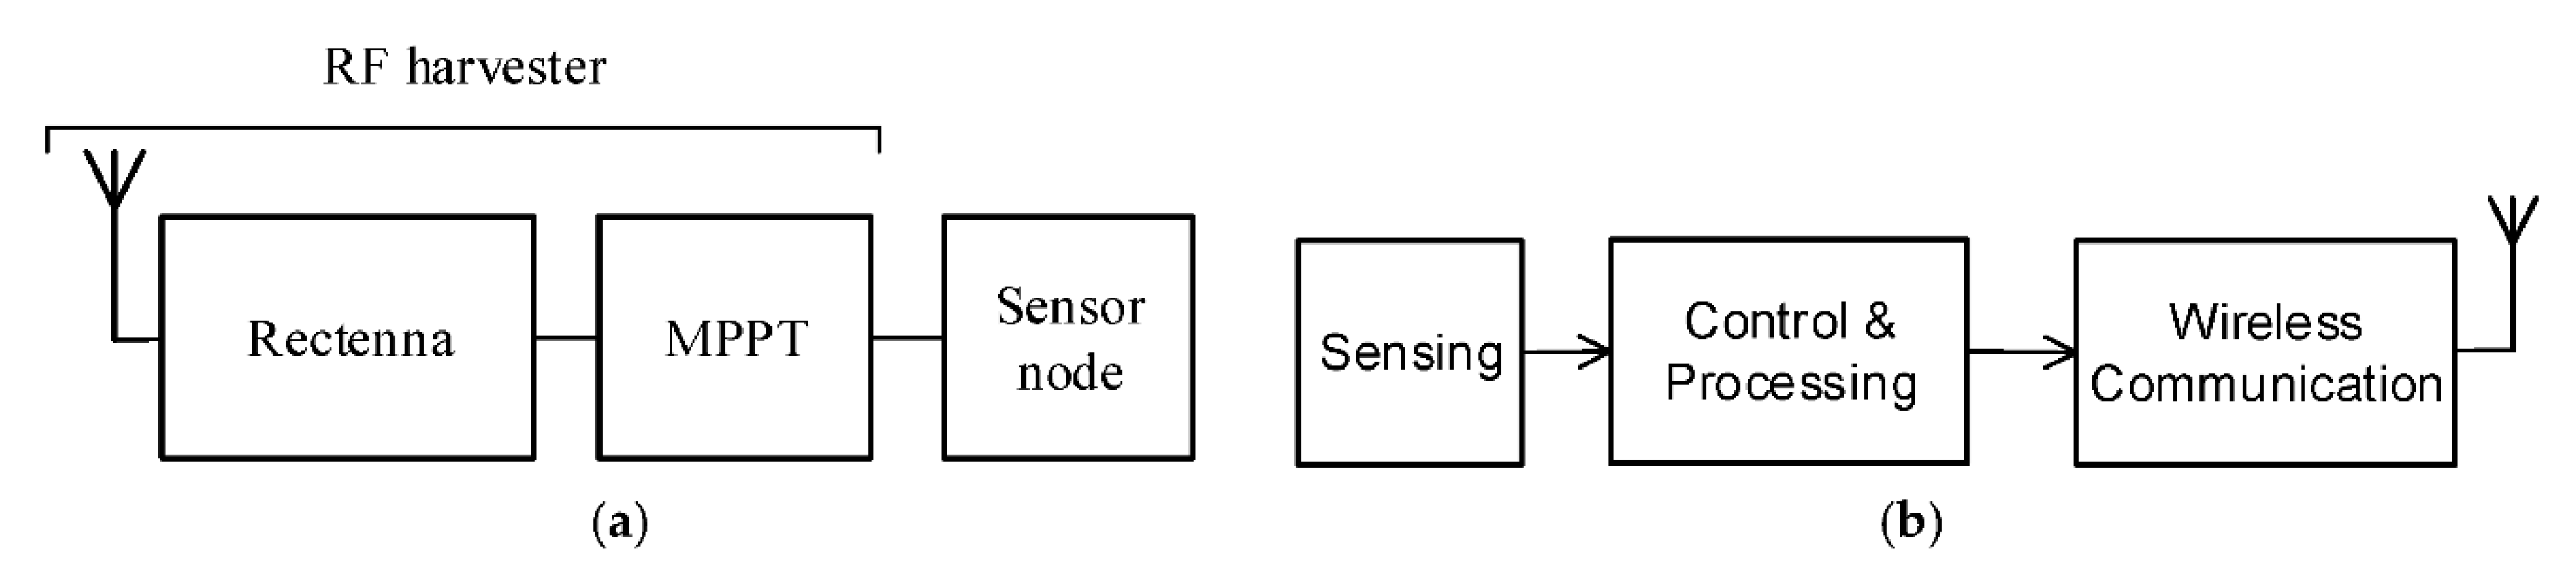
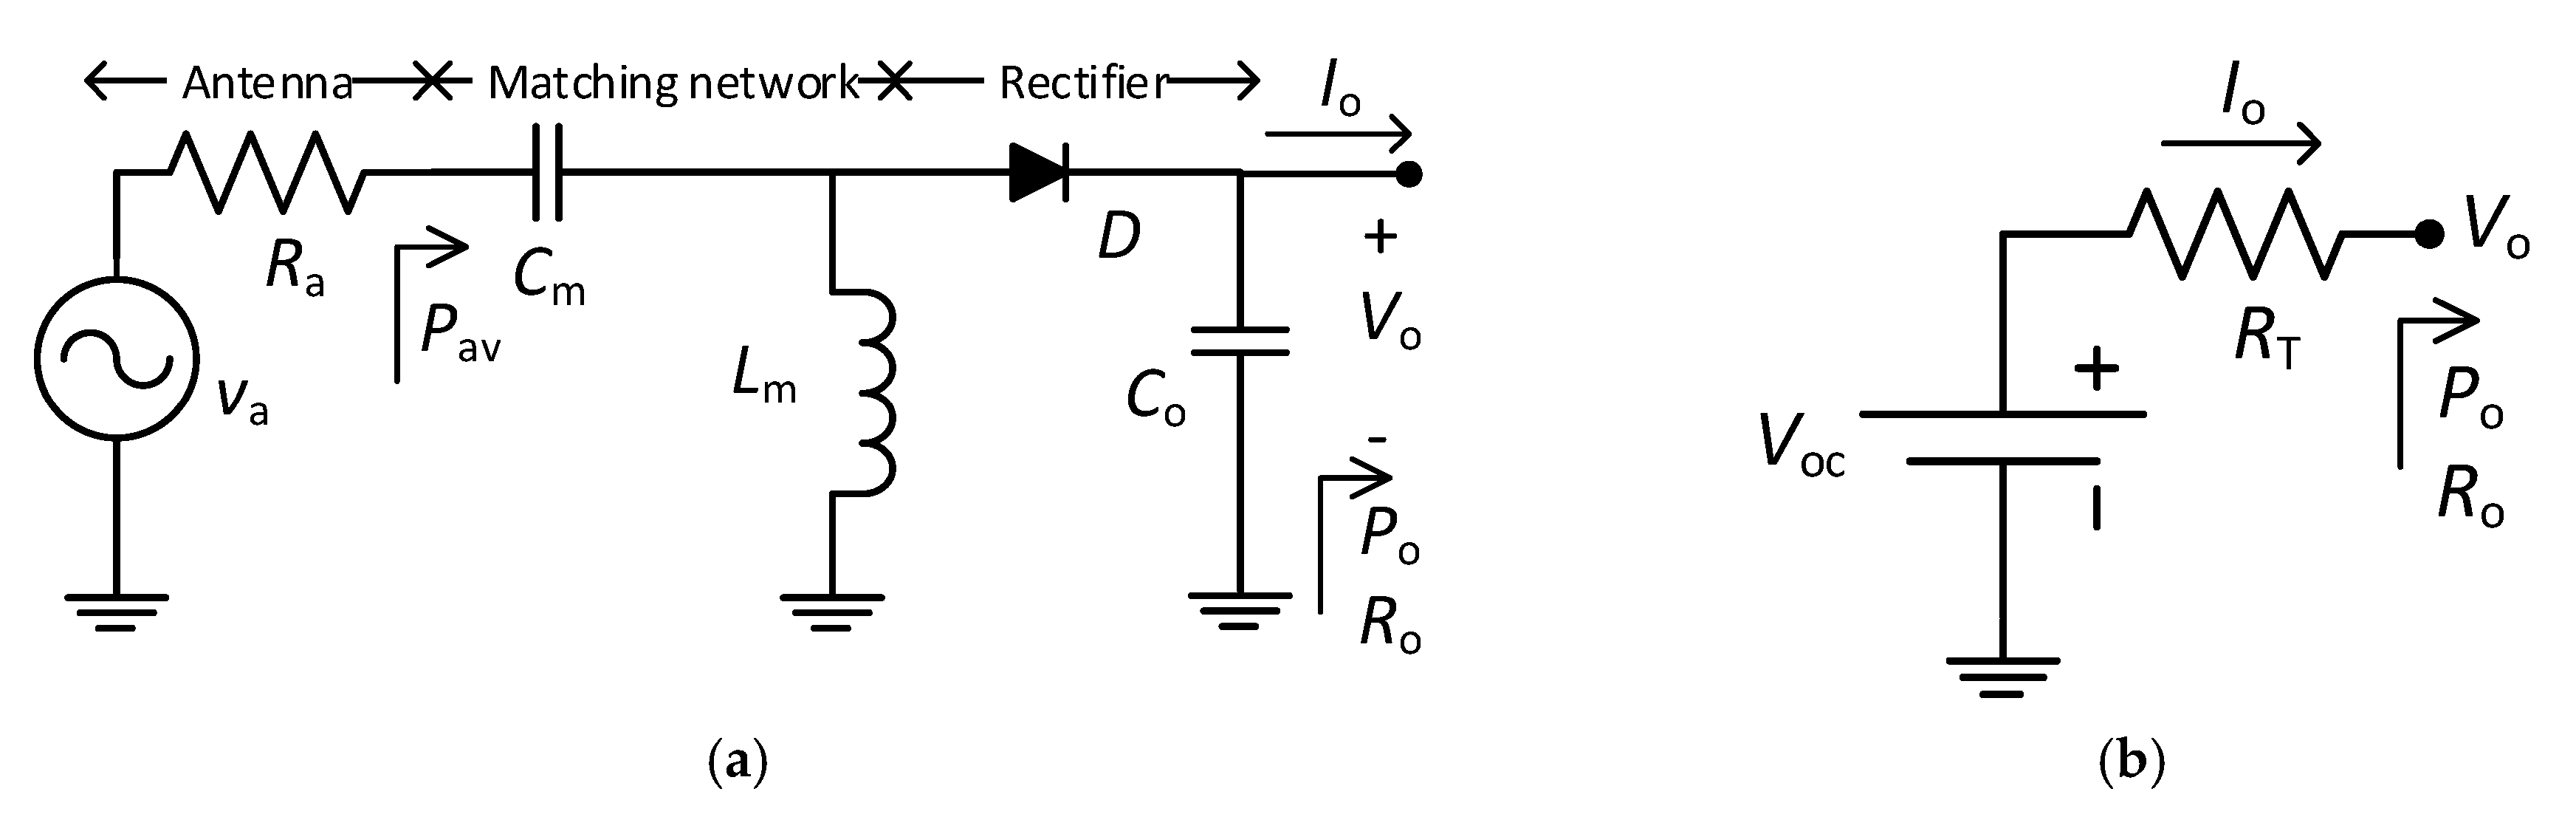
2. RF Harvester
3. Materials and Methods
4. Experimental Results and Discussion
Acknowledgments
Conflicts of Interest
References
- Piñuela, M.; Mitcheson, P.D.; Lucyszyn, S. Ambient RF energy harvesting in urban and semi-urban environments. IEEE Trans. Microw. Theory Tech. 2013, 61, 2715–2726. [Google Scholar] [CrossRef]
- de Carli, L.G.; Juppa, Y.; Cardoso, A.J.; Galup-Montoro, C.; Schneider, M.C. Maximizing the Power Conversion Efficiency of Ultra-Low-Voltage CMOS Multi-Stage Rectifiers. IEEE Trans. Circuits Syst. I Regul. Pap. 2015, 62, 967–975. [Google Scholar] [CrossRef]
- Marian, V.; Allard, B.; Vollaire, C.; Verdier, J. Strategy for Microwave Energy Harvesting from Ambient Field or a Feeding Source. IEEE Trans. Power Electron. 2012, 27, 4481–4491. [Google Scholar] [CrossRef]
- Talla, V.; Kellogg, B.; Ransford, B.; Naderiparizi, S.; Gollakota, S.; Smith, J.R. Powering the Next Billion Devices with Wi-Fi. ArXiv:1505.06815 [cs.NI] 2015. Available online: https://arxiv.org/abs/1505.06815 (accessed on 22 November 2018).
- Gasulla, M.; Jordana, J.; Robert, F.J.; Berenguer, J. Analysis of the optimum gain of a high-pass L-matching network for rectennas. Sensors 2017, 17, 1712. [Google Scholar] [CrossRef] [PubMed]
- Ripoll-Vercellone, E.; Ferrandiz, V.; Gasulla, M. An add-on electronic device that upgrades mechanical gas meters into electronic ones. In Proceedings of the Eurosensors 2018, Graz, Austria, 9–12 September 2018. [Google Scholar]
- Gutmann, R.J.; Borrego, J.M. Power Combining in an Array of Microwave Power Rectifiers. IEEE Trans. Microw. Theory Tech. 1979, 27, 958–968. [Google Scholar] [CrossRef]
- Reverter, F.; Gasulla, M. Optimal Inductor Current in Boost DC/DC Converters Regulating the Input Voltage Applied to Low-Power Photovoltaic Modules. IEEE Trans. Power Electron. 2017, 32, 6188–6196. [Google Scholar] [CrossRef]


| Pav/dBm | RT/kΩ | Voc/mV | ηrectmax/% | VMPPexp/mV | Vocexp/mV |
|---|---|---|---|---|---|
| −10 | 3.80 | 958 | 60.3 | 480 | 960 |
| −20 | 4.79 | 275 | 39.3 | 130 | 280 |
| −30 | 6.29 | 58.7 | 13.6 | 27 | 60 |
Publisher’s Note: MDPI stays neutral with regard to jurisdictional claims in published maps and institutional affiliations. |
© 2018 by the authors. Licensee MDPI, Basel, Switzerland. This article is an open access article distributed under the terms and conditions of the Creative Commons Attribution (CC BY) license (https://creativecommons.org/licenses/by/4.0/).
Share and Cite
Gasulla, M.; Robert, F.J.; Jordana, J.; Ripoll-Vercellone, E.; Berenguer, J.; Reverter, F. A High-Efficiency RF Harvester with Maximum Power Point Tracking. Proceedings 2018, 2, 1049. https://doi.org/10.3390/proceedings2131049
Gasulla M, Robert FJ, Jordana J, Ripoll-Vercellone E, Berenguer J, Reverter F. A High-Efficiency RF Harvester with Maximum Power Point Tracking. Proceedings. 2018; 2(13):1049. https://doi.org/10.3390/proceedings2131049
Chicago/Turabian StyleGasulla, Manel, Francesc J. Robert, Josep Jordana, Edgar Ripoll-Vercellone, Jordi Berenguer, and Ferran Reverter. 2018. "A High-Efficiency RF Harvester with Maximum Power Point Tracking" Proceedings 2, no. 13: 1049. https://doi.org/10.3390/proceedings2131049
APA StyleGasulla, M., Robert, F. J., Jordana, J., Ripoll-Vercellone, E., Berenguer, J., & Reverter, F. (2018). A High-Efficiency RF Harvester with Maximum Power Point Tracking. Proceedings, 2(13), 1049. https://doi.org/10.3390/proceedings2131049