Abstract
This work introduces a novel method to characterize cross-linking differences in spin-cast polymers for waveguide applications. The method is based on a low-coherence interferometer which utilizes an imaging spectrometer to gather spatially resolved data along a line without the need for scanning. The cross-linking characterization is performed by the determination of the wavelength-dependent optical thickness. In order to do this, an algorithm to analyze the wrapped phase data and extract refractive index information is developed. Finally, the approach is tested on photo-lithographically produced samples with lateral refractive index differences in pitches of 50 µm.
1. Introduction
The control of mechanical, electrical and optical properties of polymers during fabrication is necessary to ensure their performance [1]. As cross-linking is a crucial process step, it is necessary to monitor its degree. State-of-the-art characterization technologies often require slow, lab-based approaches which are not able to deliver spatial information on a specific sample [2,3]. One of the most common methods to determine the degree of cross-linking is Soxhlet-type extraction [4]. For that purpose, a sample is exposed to a solvent, typically a xylene isomer, in which non-cross-linked material will dissolve after a few hours. After drying, the degree of cross-linking can be calculated from the respective weights of cross-linked and non-cross-linked material. Another common method is differential scanning calorimetry (DSC) [5]. This approach measures thermal features like heat-flow, melting point and reaction enthalpy. Similar to chemical based methods, this approach is destructive to the sample and not in-line ready. Faster and non-destructive measurements can be obtained by using optical metrology such as RAMAN spectroscopy [6]. The analysis of spectral features of reactional groups and bonds can be utilized to calculate the degree of cross-linking.
This work aims to present a novel approach to overcome the shortcomings of traditional characterization approaches. For this purpose, a low-coherence interferometer with an imaging spectrometer is adapted from surface profilometry [7], for spatially resolved cross-linking characterization without the need for mechanical scanning.
2. Materials and Methods
In order to characterize the degree of cross-linking of a polymeric sample, the sample itself is integrated into a Michelson interferometer, Figure 1.
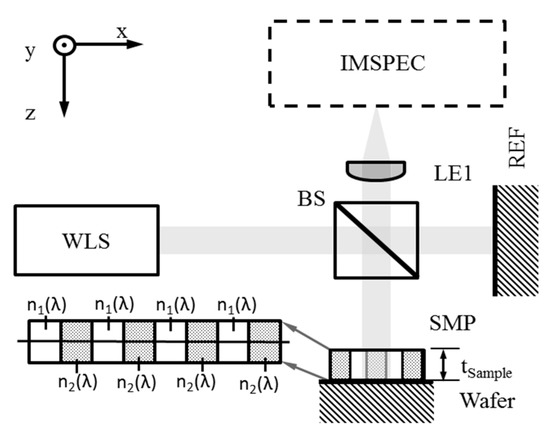
Figure 1.
Schematic of the measurement setup with WLS—white-light source, BS—beam splitter, REF—fixed reference mirrors, SMP—sample on a wafer with the thickness tsample and cross section with index n1(λ) and n2(λ), LE1—lens to image the sample on the spectrometer, IMSPEC—imaging spectrometer.
Specifically, a sample of negative tone photoresist was spin-cast onto a silicon wafer (tsample = 750 µm) and exposed to light using a rectangular pattern (pitches of 50 and 100 µm) which produced areas with defined refractive index differences. This sample acts as one mirror in the interferometer setup. During measurement, the light of a white light source (EQ-99X, Energetiq Technology, Inc., Woburn, MA, USA) was split in a 50:50 ratio by a cube beamsplitter. In both arms, light traveled the same optical path while the sample under test was placed in one of the arms. After reflection from the wafer and the reference mirror, the recombined signal was imaged onto the slit of an imaging spectrometer by an achromatic lens. The imaging spectrometer recorded the spectral intensity of the recombined signal for every point on a line of interest, Figure 1.
By transmitting through the sample volume, the signal is affected by the material dispersion which depends on the wavelength-dependent refractive index n(λ) and the thickness tsample. For this reason, the optical path of the corresponding interferometer arm shows a slight variation in the optical path length for every wavelength. In essence, the signal shows an interference pattern in which the phase inherits a distinct minimum at wavelengths where the optical path difference in relation to the reference arm equals zero. This point is characterized by the equalization wavelength λeq. The effect can be described with
where I0(λ) is the spectral profile of the light source and δ is the path length difference between both arms. In order to estimate the degree of cross-linking, the analysis of the refractive index can be utilized [8]. Therefore, the phase of the recorded signal was extracted from the interference data.
3. Results
In order to evaluate the phase and after rearranging Equation (1), a simple cos−1 operation can be performed on the measured and I0(λ) corrected data which results in φmeas. If the signal changes are larger than 2π, the resulting signal will be wrapped which leads to problems in the determination of the absolute phase value. In order to overcome this issue, an alternative approach based on the wrapped-phase derivative evaluation (WPDE) has been developed.
An estimation of the equalization wavelength was performed using a Short-Term Fourier Transform (STFT) where a Fast Fourier Transform (FFT) is performed in one small window of the complete data set which is then slid over the signal successively [9]. This estimation is then used to define a spectral area of interest around the equalization wavelength in order to perform a cos−1 operation to retrieve the local phase information. The retrieved phase is still affected by an absolute phase offset ∆φ which has to be taken into account. However, by analyzing the first derivative of the signal with respect to λ, this phase offset becomes irrelevant, Equations (3)–(5),
so that the relative derived optical thickness (RDOT) can be determined from the group refractive index ng(λ) using
The imaging approach enables the detection of individual spectral data along a spatial line and subsequent calculation of the RDOT profiles. The RDOT of two different areas in the sample could be calculated and fitted with a Cauchy model for negative tone photoresists [10], Figure 2a.
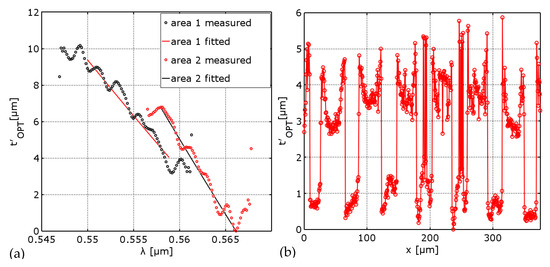
Figure 2.
Result of the measured RDOT (a) for two separate areas with different cross-linking amounts over a spectral range and (b) spatially resolved along one sample dimension.
The data in Figure 2a shows that a RDOT difference of less than 2 µm could be detected. The results are affected by noise in the original data which gets more pronounced by the process of taking the derivative. Some smoothing using a gaussian-filter was applied to the data. The RDOT was fitted only in a small range around the equalization wavelength. The fitting of the spectral range is not in the scope of a production accompanying approach but could be applied if needed. The imaging approach allowed for the analysis of the spatially resolved optical thickness on the sample, Figure 2b.
The approach was capable of resolving optical thickness difference on a pitch size of 50 µm with high resolution. Although the signal is affacted by noise and batwing-effects [11], a dynamic range of ±1 µm in the RDOT for the given sample could be revealed over a lateral range of nearly 400 µm.
4. Discussion and Conclusions
In order to characterize the cross-linking of waveguide polymers, an experimental approach based on a low-coherent interferometer was developed. The approach utilized the material dispersion of the sample as well as an imaging spectrometer to gather the wavelength-dependent, derived optical thickness in a spatially resolved fashion as a measure for cross-linking. In order to evaluate the derived optical thickness, a novel approach called WPDE has been developed and successfully applied to the measurement of a negative tone resist sample. The results have shown that the method allows for measurements to be made with an optical thickness resolution of about 2 µm and a spatial resolution of about 2 µm. This allows fast, one-shot evaluation of cross-linking within the integration time of the camera. The use of this method for production accompanying tasks is favorable due to its speed. Future work will be focused on the quantification of the precision, the reduction of deviations such as bat-wing effects and the combined measurement of sample thickness and refractive index.
Author Contributions
Conceptualization, Methodology, Software, Investigation and Writing—Original Draft Preparation, C.T.; Methodology and Writing—Review & Editing, B.N.; Sample Preparation, S.S.; Supervision, E.K.; Supervision and Project Administration, P.H.
Funding
This research received no external funding.
Acknowledgments
The authors would like to thank the WHZ Optical Technologies group for fruitful discussions. Part of the research work was performed at the Polymer Competence Center Leoben GmbH (PCCL, Austria) within the framework of the COMET-program of the Federal Ministry for Transport, Innovation and Technology and the Federal Ministry for Digital and Economic Affairs. The PCCL is funded by the Austrian Government and the State Governments of Styria, Lower Austria and Upper Austria.
Conflicts of Interest
The authors declare no conflict of interest.
References
- Ehrenstein, G.; Riedel, G.; Trawiel, P. Thermal Analysis of Plastics: Theory and Practice; Hanser: Munich, Germany, 2004. [Google Scholar]
- Hirschl, C.; Biebl-Rydlo, M.; DeBiasio, M.; Mühleisen, W.; Neumaier, L.; Scherf, W.; Oreski, G.; Eder, G.; Chernev, B.; Schwab, W.; et al. Determining the degree of crosslinking of ethylene vinyl acetate photovoltaic module encapsulants—A comparative study. Sol. Energy Mater. Sol. Cells 2013, 116, 203–218. [Google Scholar] [CrossRef]
- Feng, R.; Farris, R.J. Influence of processing conditions on the thermal and mechanical properties of SU8 negative photoresist coatings. J. Micromech. Microeng. 2003, 13, 80. [Google Scholar] [CrossRef]
- ASTM. Standard Test Methods for Determination of Gel Content and Swell Ratio of Crosslinked Ethylene Plastics; American Society for Testing and Materials: West Conshohocken, PA, USA, 2006. [Google Scholar]
- Stark, W.; Jaunich, M. Investigation of Ethylene/Vinyl Acetate Copolymer (EVA) by thermal analysis DSC and DMA. Polym. Test. 2011, 30, 236–242. [Google Scholar] [CrossRef]
- Peike, C.; Kaltenbach, T.; Weiß, K.A.; Koehl, M. Non-destructive degradation analysis of encapsulants in PV modules by Raman Spectroscopy. Sol. Energy Mater. Sol. Cells 2011, 95, 1686–1693. [Google Scholar] [CrossRef]
- Taudt, C.; Baselt, T.; Nelsen, B.; Aßmann, H.; Greiner, A.; Koch, E.; Hartmann, P. Two-dimensional low-coherence interferometry for the characterization of nanometer wafer topographies. In Proceedings of the Optical Micro- and Nanometrology VI, Brussels, Belgium, 5–7 April 2016; Volume 9890. [Google Scholar] [CrossRef]
- Taudt, C.; Baselt, T.; Oreski, G.; Hirschl, C.; Koch, E.; Hartmann, P. Cross-linking characterization of polymers based on their optical dispersion utilizing a white-light interferometer. In Proceedings of the Optical Measurement Systems for Industrial Inspection IX, Munich, Germany, 22–25 June 2015; Volume 9525. [Google Scholar] [CrossRef]
- Sejdic´, E.; Djurovic´, I.; Jiang, J. Time–frequency feature representation using energy concentration: An overview of recent advances. Digit. Signal Process. 2009, 19, 153–183. [Google Scholar] [CrossRef]
- Polyanskiy, M.N. Refractive Index Database. Available online: https://refractiveindex.info (accessed on 19 July 2018).
- Xie, W.; Hagemeier, S.; Woidt, C.; Hillmer, H.; Lehmann, P. Influences of edges and steep slopes in 3D interference and confocal microscopy. In Proceedings of the Optical Micro- and Nanometrology VI, Brussels, Belgium, 5–7 April 2016; Volume 9890. [Google Scholar] [CrossRef]
Publisher’s Note: MDPI stays neutral with regard to jurisdictional claims in published maps and institutional affiliations. |
© 2018 by the authors. Licensee MDPI, Basel, Switzerland. This article is an open access article distributed under the terms and conditions of the Creative Commons Attribution (CC BY) license (https://creativecommons.org/licenses/by/4.0/).