Proceeding Paper

Noise Characterization of Vortex-State GMR Sensors with Different Free Layer Thicknesses †

1
Physics of Functional Materials, University of Vienna, 1090 Vienna, Austria
2
Department for Integrated Sensor Systems, Danube University Krems, 2700 Wiener Neustadt, Austria
3
Infineon Technologies Austria AG, 9500 Villach, Austria
*
Author to whom correspondence should be addressed.
Presented at the Eurosensors 2018 Conference, Graz, Austria, 9–12 September 2018.
Proceedings 2018, 2(13), 1013; https://doi.org/10.3390/proceedings2131013
Published: 3 December 2018
(This article belongs to the Proceedings of EUROSENSORS 2018)

Abstract

:
The spin valve principle is the most prominent sensor design among giant- (GMR) and tunneling (TMR) magnetoresistive sensors. A new sensor concept with a disk shaped free layer enables the formation of a flux-closed vortex magnetization state if a certain relation of thickness to diameter is given. The low frequency noise of current-in-plane GMR sensing elements with different free layer thicknesses at different external field strengths has been measured. The measurements of the 1/f noise in external fields enabled a separation of magnetic and electric noise contributions. It has been shown that while the sensitivity is increasing with a decreasing element thickness, the pink noise contribution is increasing too. Still the detection limit at low frequencies is better in thinner free layer elements due to the higher sensitivity.

1. Introduction

The adaption of semiconductor magnetoresistive (MR) sensors for a variety of applications like current sensing, automotive and biomedical purposes is driven by its low cost and power consumption at a small size. Among other MR technologies, the use of GMR and TMR sensors is vastly expanding due to their high magnetoresistive ratio and large bandwidth. The major sensing principle is the spin valve concept. It consists of two magnetic layers separated by a spacer layer. In the case of GMR devices the spacer layer is a conductive material. The introduction of a new sensor concept [1] with a disk shaped free layer enables a flux-closed magnetization state when small or no external fields are applied (see Figure 1b). This sensor concept enables high saturation fields compared to other spin valve sensor technologies, a theoretically hysteresis-free transfer curve if the vortex annihilation field is not exceeded and the absence of phase noise due to the energetically favored, well defined vortex magnetisation state [2,3]. The intrinsic noise of the sensor is the crucial value regarding the minimum detectable field at low frequencies. In this article the transfer characteristic and the low frequency noise of vortex GMR sensors with different free layer thicknesses are studied to evaluate the sensor performance.

2. Materials and Methods

The GMR current-in-plane samples were fabricated by optical lithography consisting of a sputter-deposited layer stack with a PtMn-pinned synthetic antiferromagnet as pinned layer, a Cu spacer layer and a CoFeB free layer of varying thickness. The noise measurements were performed by supplying the device under test (DUT) with a battery connected to a potentiometer in series to limit the current. The set-up is shown in Figure 1a with the DUT placed in an electrically shielded environment inside an electromagnet calibrated by a Hall sensor. The active sensor elements are arranged in a Wheatstone bridge configuration to suppress external noise sources. Each resistive leg of the bridge contains 1752 active disc elements. The noise of the bridge output has been amplified using an ultra low noise amplifier (ULNA, see [4]) and monitored with a lock-in amplifier. For the resistance measurements a sourcemeter has been used.

3. Results

Magnetoresistance measurements of the samples are shown in Figure 2. The sweeping direction of the external field up to the saturation field of the sensor is indicated by the colored arrows. The delayed renucleation of the vortex state after the saturation of the discs, which results in an annihilation of the vortex state, can be observed as hysteresis. While both the nucleation and the annihilation fields increase with thickness, the sensitivity around zero field decreases.
The sensors noise as a function of frequency in the vortex state (i.e., with no external fields applied) is given in Figure 3. The data is represented using a boxplot with whiskers and the mean with its positive and negative standard deviation as a triangle. To obtain the frequency and bias voltage independent Hooge parameter αH [5], the noise contributions of the sensor can be splitted in a white noise and a pink noise contribution with the latter containing noise of electric as well as magnetic origins [6,7]:
S V 2 = S V , amp 2 + 4 k B T R 0 + α H ( R 0 I ) 2 f   [ V 2 / Hz ]
with the noise of the ULNA S V , amp 2 , Boltzmann‘s constant kB and the temperature T in Kelvin. Noise measurements of the sensors at a fixed frequency of 10 Hz, shown in Figure 4, were performed at a supply current of 500 µA over an external field range of 100 mT. The measurements were performed at a delay time of 3 min after each field sweep increment and averaged over 500 measurements to ensure a stabilized noise measurement. The intrinsic noise is highest near the vortex nucleation fields and is clearly lower in the saturated region of the sensor. The voltage noise SV is dependent on the sensitivity what can be related to the magnetic noise contributions [7,8]. If the sensor is in a saturated state, the magnetic noise contributions can be neglected, enabling a separation of the electric (αH,el) and magnetic (αH,mag) part of the Hooge parameter αH = αH,el + αH,mag using Equation (1). Using the results of the noise measurements shown in Figure 4 to estimate the noise values, the contribution of electric and magnetic noise can be listed in Table 1.

4. Discussion

The sensors linear range is increasing with the thickness of the free layer and therefore the sensitivity is decreasing. This can be analytically derived from the “rigid” vortex model discussed by Guslienko et al. [9], showing that the initial susceptibility of the free layer is dependent on thickness and diameter. The second result is that the magnetic contribution to the sensors low frequency noise is dominant in thinner discs. The minimum detectable field is expressed by the frequency dependent detectivity D given as the sensors noise power divided by the sensitivity S = (∆R/∆B)/R0 times the supply voltage V [6]:
D = S V 2 / ( S ·   V ) 2               [ T / Hz ]
The sensor properties are summarized in Table 2. Despite the fact of an increasing noise with decreasing free layer thickness, the detectivity is still somewhat better in thin free layers due to the increased sensitivity.

Author Contributions

Conceptualization, H.B. and H.W.; Methodology, H.B. and H.W.; Software, H.B. and H.W.; Validation, H.B., D.S. and A.S.; Formal Analysis, H.B. and H.W.; Investigation, H.B. and H.W.; Resources, A.S. and H.B.; Writing H.W.; Visualization, H.W.; Supervision, D.S. and H.B.; Project Administration, D.S. and H.B.; Funding Acquisition, D.S., A.S. and H.B.

Acknowledgments

The financial support by the Austrian Federal Ministry for Digital and Economic Affairs and the National Foundation for Research, Technology and Development is gratefully acknowledged.

Conflicts of Interest

The authors declare no conflict of interest. The founding sponsors had no role in the design of the study; in the collection, analyses, or interpretation of data; in the writing of the manuscript, and in the decision to publish the results.

References

  1. Zimmer, J.; Satz, A.; Raberg, W.; Brueckl, H.; Suess, D. Device, Magnetic Sensor Device and Method. USA U.S. Application 20150185297A1, 2 July 2015. [Google Scholar]
  2. Wurft, T.; Raberg, W.; Pruegl, K.; Satz, A.; Reiss, G.; Brueckl, H. The Influence of Edge Inhomogeneities on Vortex Hysteresis Curves in Magnetic Tunnel Junctions. IEEE Trans. Magn. 2017, PP, 1. [Google Scholar] [CrossRef]
  3. Suess, D.; Bachleitner-Hofmann, A.; Satz, A.; Weitensfelder, H.; Vogler, C.; Bruckner, F.; Abert, C.; Prügl, K.; Zimmer, J.; Huber, C.; et al. Topologically protected vortex structures for low-noise magnetic sensors with high linear range. Nat. Electron. 2018, 1, 362–370. [Google Scholar] [CrossRef]
  4. Scandurra, G.; Cannat, G.; Ciofi, C. Differential ultra low noise amplifier for low frequency noise 77 measurements. AIP Adv. 2011, 1, 022144. [Google Scholar] [CrossRef]
  5. Hooge, F.N. 1/f noise sources. IEEE Trans. Electron. Devices 1994, 41, 1926–1935. [Google Scholar] [CrossRef]
  6. Reig, C.; Cardoso, S.; Mukhopadhyay, S.C. Giant Magnetoresistance (GMR) Sensors: From Basis to State-of-the-Art Applications; Springer-Verlag: Berlin/Heidelberg, Germany, 2013. [Google Scholar] [CrossRef]
  7. Egelhoff, W.; Pong, P.; Unguris, J.; McMichael, R.; Nowak, E.; Edelstein, A.; Burnette, J.; Fischer, G. Critical challenges for picoTesla magnetic-tunnel-junction sensors. Sens. Actuators A Phys. 2009, 155, 217–225. [Google Scholar] [CrossRef]
  8. Stutzke, N.A.; Russek, S.E.; Pappas, D.P.; Tondra, M. Low-frequency noise measurements on commercial magnetoresistive magnetic field sensors. J. Appl. Phys. 2005, 97, 10Q107. [Google Scholar] [CrossRef]
  9. Guslienko, K.Y.; Novosad, V.; Otani, Y.; Shima, H.; Fukamichi, K. Field evolution of magnetic vortex state in ferromagnetic disks. Appl. Phys. Lett. 2001, 78, 3848–3850. [Google Scholar] [CrossRef]
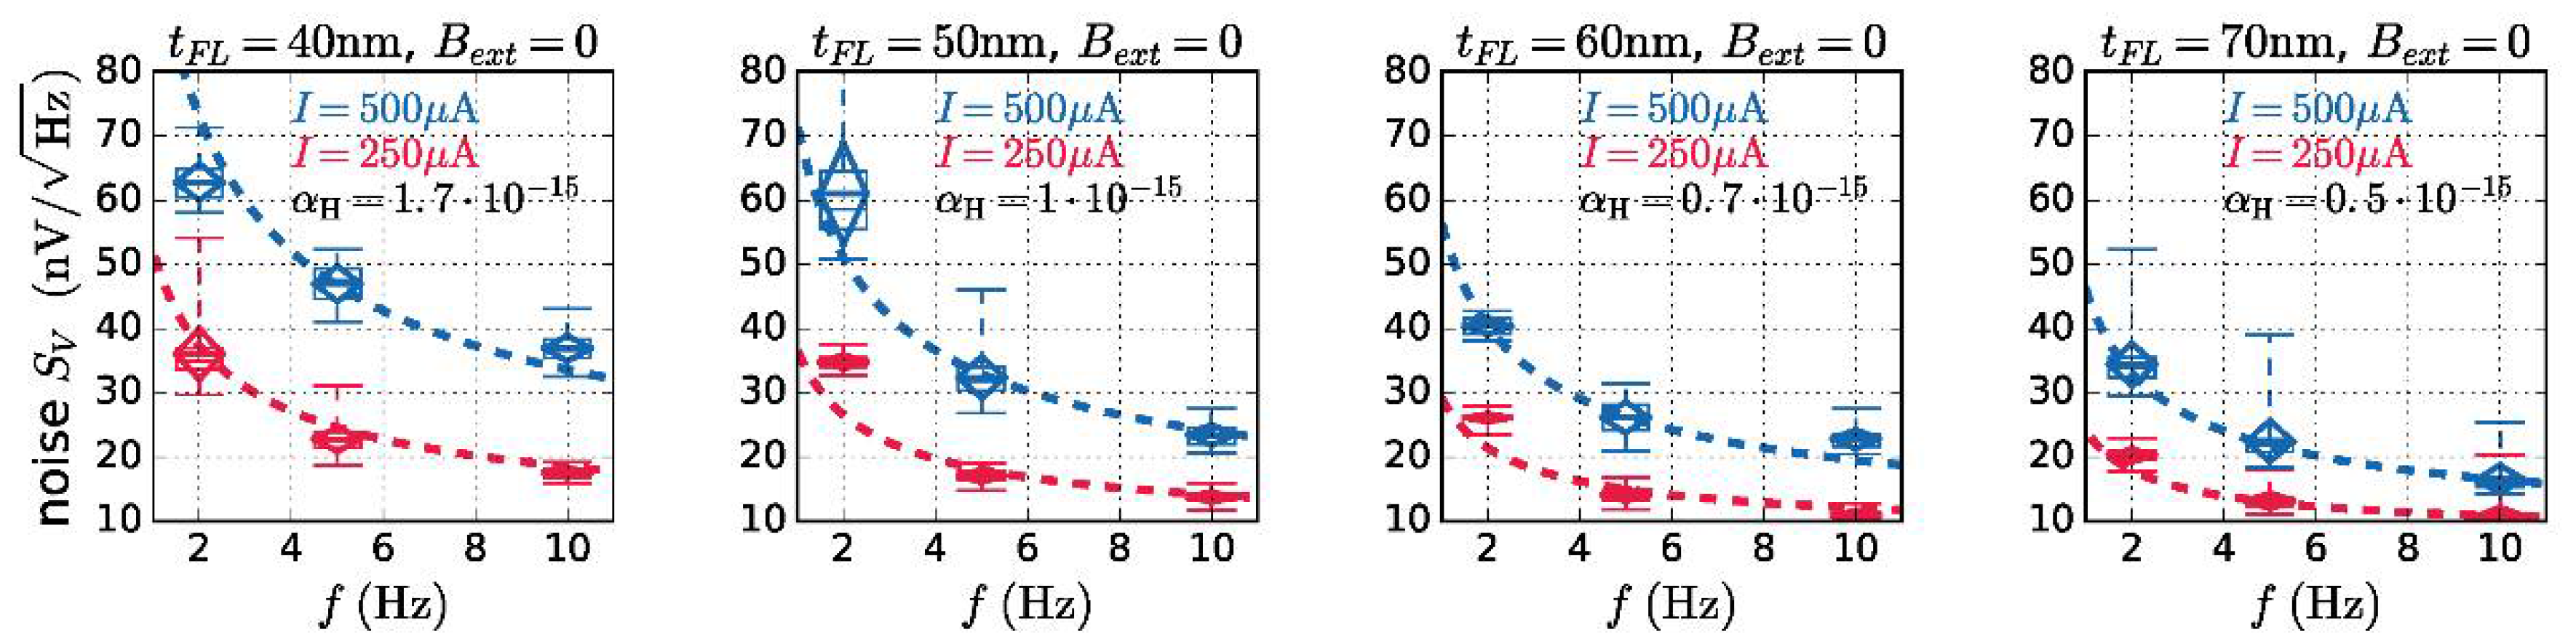
Figure 1. (a) Noise measurement set-up with a potentiometer RVD to limit the current through the device under test (DUT). The small voltage fluctuations are amplified (ULNA) and monitored with a lock-in amplifier (LIA) to obtain the frequency resolved noise amplitudes. (b) An active elements free layer with the diameter D and the thickness tFL in its vortex magnetisation state (arrows) without external field.
Proceedings 02 01013 g001
Figure 2. Measured resistance variations R normalised to the saturation values of the sensors in dependence of external fields Bext.
Proceedings 02 01013 g002
Figure 3. Noise measurements at no external field in the low frequency regime. The measurements are displayed by boxplots with standard deviation and mean (triangles) for two different supply currents. The measured data are fitted according to Equation (1) (dashed lines) to extract the empirical fit parameter αH.
Proceedings 02 01013 g003
Figure 4. Noise SV of the sensor during external field sweeps at a frequency of 10 Hz and a supply current of 500 µA.
Proceedings 02 01013 g004
Table 1. Electric and magnetic noise contributions.
Thickness tFL [nm]Noise Parameter αHMagnetic Contribution αH,mag
401.7 · 10−15αH,mag = 0.83 · αH
501.0 · 10−15αH,mag = 0.76 · αH
600.7 · 10−15αH,mag = 0.63 · αH
700.5 · 10−15αH,mag = 0.57 · αH
Table 2. Geometrical, electrical and magnetic properties of the measured samples.
ThicknessDiameterResistanceMR RatioSensitivityDetectivity
tFL [nm]D [µm]R0(B = 0)[Ω]MR[%]S[%/mT] D [ nT / H z ]@10 Hz
40249725.870.14129.3
50245045.520.11328.2
60242285.180.07635.2
70240584.680.06336.0
Publisher’s Note: MDPI stays neutral with regard to jurisdictional claims in published maps and institutional affiliations.

