Proceeding Paper

The Development of a Decision Support Software for the Design of Micro-Hydropower Schemes Utilizing a Pump as Turbine †

Department of Civil, Structural & Environmental Engineering, Trinity College Dublin, the University of Dublin, Dublin 2, Ireland
*
Author to whom correspondence should be addressed.
Presented at the 3rd EWaS International Conference on “Insights on the Water-Energy-Food Nexus”, Lefkada Island, Greece, 27–30 June 2018.
Proceedings 2018, 2(11), 678; https://doi.org/10.3390/proceedings2110678
Published: 8 August 2018
(This article belongs to the Proceedings of EWaS3 2018)

Abstract

:
Pumps As Turbines (PATs) are a class of unconventional hydraulic turbines consisting of standard water pumps working in reverse mode as the prime mover. Such devices can be well suited for either in-pipe energy recovery or small-scale hydropower, but their practical application is hampered by the lack of comprehensive guidelines able to assist the designer in the determination of the optimal plant layout and the choice of equipment. In fact, the performances of a PAT will depend on factors such as its construction type, its size and the flow conditions under which the machine is expected to operate. Ultimately, the design of a PAT-based hydro scheme is a matter of trade-offs which are in most cases not trivial. An innovative software was developed in order to assist hydro designers and provide a visual aid when choosing between different layouts of the analyzed hydro scheme (e.g., more than one PAT in series/parallel, different shaft speeds), and has been applied to a real case study of energy recovery in a water network.

1. Introduction

Pumps as Turbines (PAT) are a class of hydraulic energy converters consisting of standard water pumps working in reverse mode as turbines. Being mass manufactured, they distinguish themselves from classic hydraulic turbines for having a lower purchase price, being available down to small power ratings, and being inexpensive to maintain [1,2,3].
These are ideally suitable for in-pipe energy recovery in water networks, irrigation or process industry, and belonging to the class of reaction turbines they allow the fluid to hold a residual pressure at outlet which is fundamental to maintain the integrity of the network. Besides, water pumps are vastly known and adopted pieces of equipment that can be found in any water network, therefore network operators are generally familiar with the technology and its maintenance aspects. Finally, due to their robustness and availability, PATs have been considered an appropriate technology for Micro-Hydropower schemes in developing countries [1,4,5].
One of the major limitations of the use of PATs is their generally low part-load efficiency, which makes the choice of the equipment and plant layout for a determined site critical. This is particularly true for drinking water or irrigation networks, which commonly experience marked fluctuations of water demand daily and seasonally [3].
Another limitation is the uncertainty about the PAT performances, since pump manufacturers tend not to divulge the characteristic charts of their units when operated as turbines. Such uncertainties in the location of the Best Efficiency Point (BEP) of PATs are intrinsic to the act of utilizing an off-the-shelf piece of equipment for a use not originally envisaged by its maker. The effect of such uncertainties can be multiple, ranging from a lower energy yield than the expected power output up to failing to maintain the desired backpressure at the turbine’s outlet.
Another important aspect to be considered is that choosing the most appropriate PAT for a determined site is a matter of non-trivial tradeoffs between ideal targets which are often contrasting. The typical design targets can be of technical or economic nature:
  • technical aspects
    -
    maximization of the energy yield over a set period of time;
    -
    maximization of the power output;
    -
    maintenance of an adequate backpressure at the turbine’s outlet;
    -
    maximization of CO2 savings over a set period of time;
    -
    mitigating the risk of pressure surges under runaway conditions, which occur if the connection to the grid is temporarily lost during turbine operations;
    -
    space constraints in presence of physical obstacles to the installation.
  • economic aspects
    -
    maximization of the Net Present Value (NPV) of the project;
    -
    minimization of the project payback time.
A practical example of contrasting design parameters is when a pump is selected to operate as PAT in order to have as short payback time as possible, which would most likely lead to the selection of an undersized PAT with respect to other models which may have resulted in a higher energy yield and CO2 savings. Ultimately, the selection of a PAT is a problem of multi-objective nonlinear optimization. Since the priorities and the relative weight of the above mentioned parameters may be relative to specific cases, the aim of the software is to enable the designer to select any parameter relevant to their needs and for each of them identify on a chart the most appropriate families of commercially available pumps. Besides, the choice of giving a visual output also enables the software user to assess the convenience of selecting a different equipment layout (e.g., more than one PAT in parallel or in series).

2. Architecture of the Software

The key concept around which the software revolves is that of Best Efficiency Point (BEP), which corresponds to the set of hydraulic working conditions in terms of flow rate and head drop across a machine that allow the same unit to work under the highest possible hydraulic conversion efficiency. The software generates a 2D contour chart in which each point represents a hypothetical turbine whose BEP corresponds to the Q (m3/s) and H (m) coordinates shown on the horizontal and vertical axis respectively. For each hypothetical turbine the hydraulic behavior and purchase cost are computed, and its performances are evaluated against the provided flow rate and available head profiles. The logic of the software is schematically represented in Figure 1.

2.1. PAT Cost Model

A recent research proposed a set of equations able to predict the purchase price of PATs connected to induction generators having 1, 2 or 3 pairs of magnetic poles (pp) [6]. Three equations have been proposed, based on the values of Q (m3/s) and H (m) at the BEP of a PAT:
For radial PATs, pp = 1
CPAT+gen (€) = 11,589.32 QBEP √(HBEP) + 1380.79
For radial PATs, pp = 2
CPAT+gen (€) = 12,864.77 QBEP √(HBEP) + 949.93
For radial PATs, pp = 3
CPAT+gen (€) = 15,484.97 QBEP √(HBEP) + 1172.72
The above equations have been integrated in the PAT design software, since they allow an easy calculation of the PAT + generator purchase price for a range of nominal shaft speed N of 3020, 1510 and 1005 RPM which correspond respectively to the speed of asynchronous generators having 1, 2 and 3 pairs of poles.

2.2. Efficiency Prediction

The magnitude of peak hydraulic efficiency at BEP of a centrifugal PAT has been found to vary according to its nominal flow and head characteristics in term of Q (m3/s), H (m) and N (RPM) at the BEP [7]. An equation has been proposed to predict the efficiency at the BEP of any machine based from experimental data of 280 radial PATs:
ηMAX = 0.89 − (0.024/QBEP0.41) − 0.076 (0.22 + ln (Ns/52.933))2
The term Ns in Equation (4) refers to the specific speed of a PAT defined as:
Ns = N ((√QBEP)/(HBEP0.75))
where N is in RPM, QBEP in m3/s and HBEP in m. The nominal power output of a PAT P (kW) can therefore be calculated as:
9.81 ηMAX QBEP HBEP

2.3. Prediction of the BEP of a PAT

Several methods exist to predict the BEP location of a PAT with respect to its known BEP as a pump. The most reliable is the physical lab test of pumps in specialized test rigs, which in contrast is very expensive and resource-demanding. Another option is Computational Fluid Dynamics (CFD) simulations, which can give accurate results but require a powerful computational capacity and need an extensive knowledge of the internal geometry of the machine [8].
Instead, several 1-D algebraic methods exist which are capable of predicting the location of the BEP in turbine mode from the BEP in pump mode [9]. They require minimal data, typically only the Q, H coordinates of the BEP in pump mode, the machine rated efficiency and the nominal shaft speed. The 1-D method developed by Yang et al. (2012) has the advantages of being developed from a large database of PATs [10]. It consists of the set of equations described in Equations (7) and (8).
h = Ht,BEP/Hp,BEP = 1.2/(ηp,BEP)1.1
q = Qt,BEP/Qp,BEP = 1.2/(ηp,BEP)0.55
In this analysis the peak efficiency of a pump has been considered equal to that of the very same unit in turbine mode, as suggested in the literature [11,12].
A database of BEP of pumps from several manufacturers has been gathered, which included standardized centrifugal pumps from 5 manufacturers. Only units with full size impellers were selected. The units are displayed in the charts, according to their predicted BEP location in turbine mode obtained through Equations (7) and (8).

2.4. PAT Curve Extrapolation from BEP

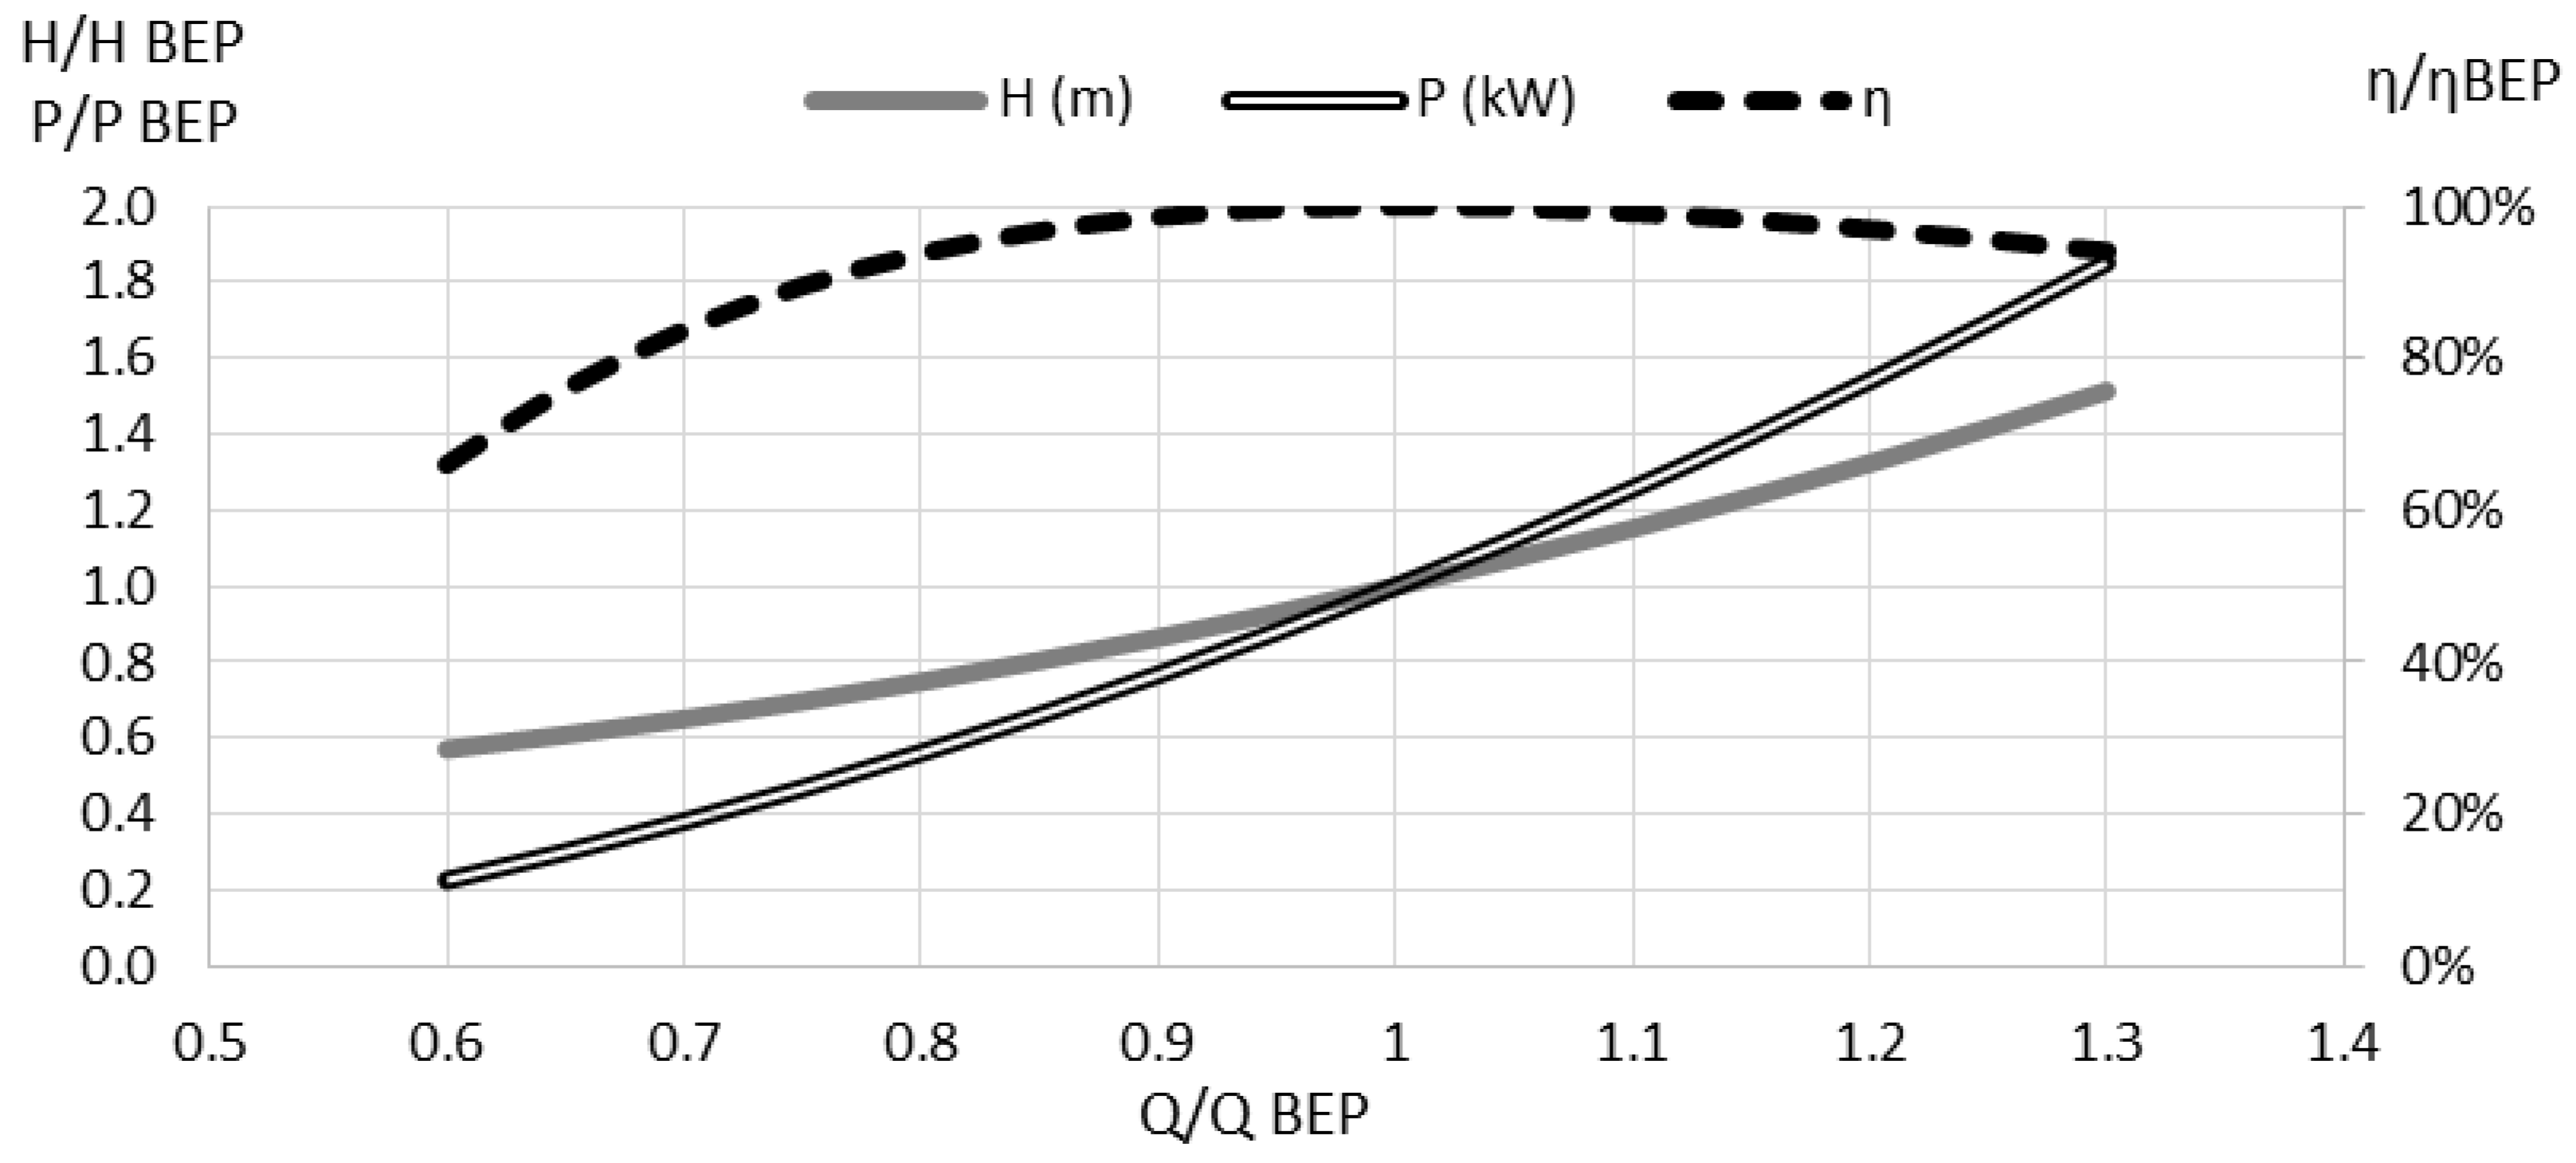
In the literature some second and third-degree polynomials are available which allow to draw the approximate Q-H and P-H characteristic curve of a PAT only knowing its Q, H and P (or η, based on Equation (6)) at the BEP. An example of such curves is shown in Figure 2, where the point of coordinates (1,1) represents the BEP.
Several authors have proposed empirical equations to perform this task [12,13,14]. The most recent set of equations has been published based on the characteristic curves of 12 radial PATs experimentally tested [15]. For each machine the head and power curves relative to the BEP have been interpolated to second and third degree polynomials respectively. Subsequently, the average values of each coefficient of the relative head and power polynomial has been obtained as shown in Equations (9) and (10).
Ht/Ht,BEP = 0.922 (Qt/Qt,BEP)2 − 0.406 (Qt/Qt,BEP) + 0.483
Pt/Pt,BEP = 0.040 (Qt/Qt,BEP)3 + 1.185 (Qt/Qt,BEP)2 − 0.043 (Qt/Qt,BEP) − 0.183

3. Limits of the Analysis

In order to predict realistically the performance and cost of a continuous series of hypothetical PATs the model relies on a series of semi-empirical mathematical correlations whose applicability constraints and uncertainties consequently limit the results provided by the software.
Besides, although several pump—and therefore PAT—design families exist (e.g., multistage, submersible, double suction split-case, lobe pumps) by far the most common pump type corresponds to the centrifugal or radial units [16]. Such category of pumps is not only the most easily available and sold worldwide, but also the one whose behavior as turbine has been studied more in depth. Therefore, the present version of the software focuses solely on centrifugal PATs. At the same time, it has been chosen for the first version of the software to consider uniquely the use of asynchronous induction generators which are the most chosen option for turbines in the Micro-Hydropower range. The asynchronous motor/generator units are classified into four efficiency classes; IE1 the lowest and IE4 the highest [17]. Since standard hydraulic pumps being sold in Europe come with IE3-class motor/generators, such type of machines have been considered in the analysis.
The permissible operating range of each PAT was considered as a precautionary measure to extend from 0.7 to 1.2 of Q/QBEP in order to ensure an acceptable reliability [18]. Besides, the value of Ns for each PAT was limited to the range 6–70 because of all of the units from which Equations (9) and (10) were derived fall within that interval [15].

4. Case Study and Results

A research from the University of Trento (Italy) has evaluated the opportunity for energy recovery downstream of an elevated tank from which water is distributed to the city of Merano [19].

4.1. Available Flow Rate and Hydraulic Head

The flow duration curve follows a daily profile as displayed in Figure 3, showing a peak flow rate more than double than the minimum flow occurring during night time. In the absence of more detailed information, the available hydraulic head has been considered as constant and equal to 60 m [19]. In reality, this value will change slightly according to the head losses in the piping.

4.2. Additional Input Data

The presence of an automated by-pass duct has been introduced, in order to guarantee the network reliability under all operational regimes. Therefore, a portion of water can be diverted through the bypass instead of the turbine at any given time. Additional inputs were:
  • the rest of project costs were assumed to be equal to the 300% of the cost of PAT and generator calculated through Equations (1)–(3) [20];
  • the revenues from energy sales to the national grid were evaluated as 210 €/MWh which is the feed-in tariff from in-pipe micro hydro in Italy at the time of this study [21];
  • the yearly maintenance costs have been considered equal to the 5% of the PAT + generator cost [22].

4.3. Results Chart and Interpretation

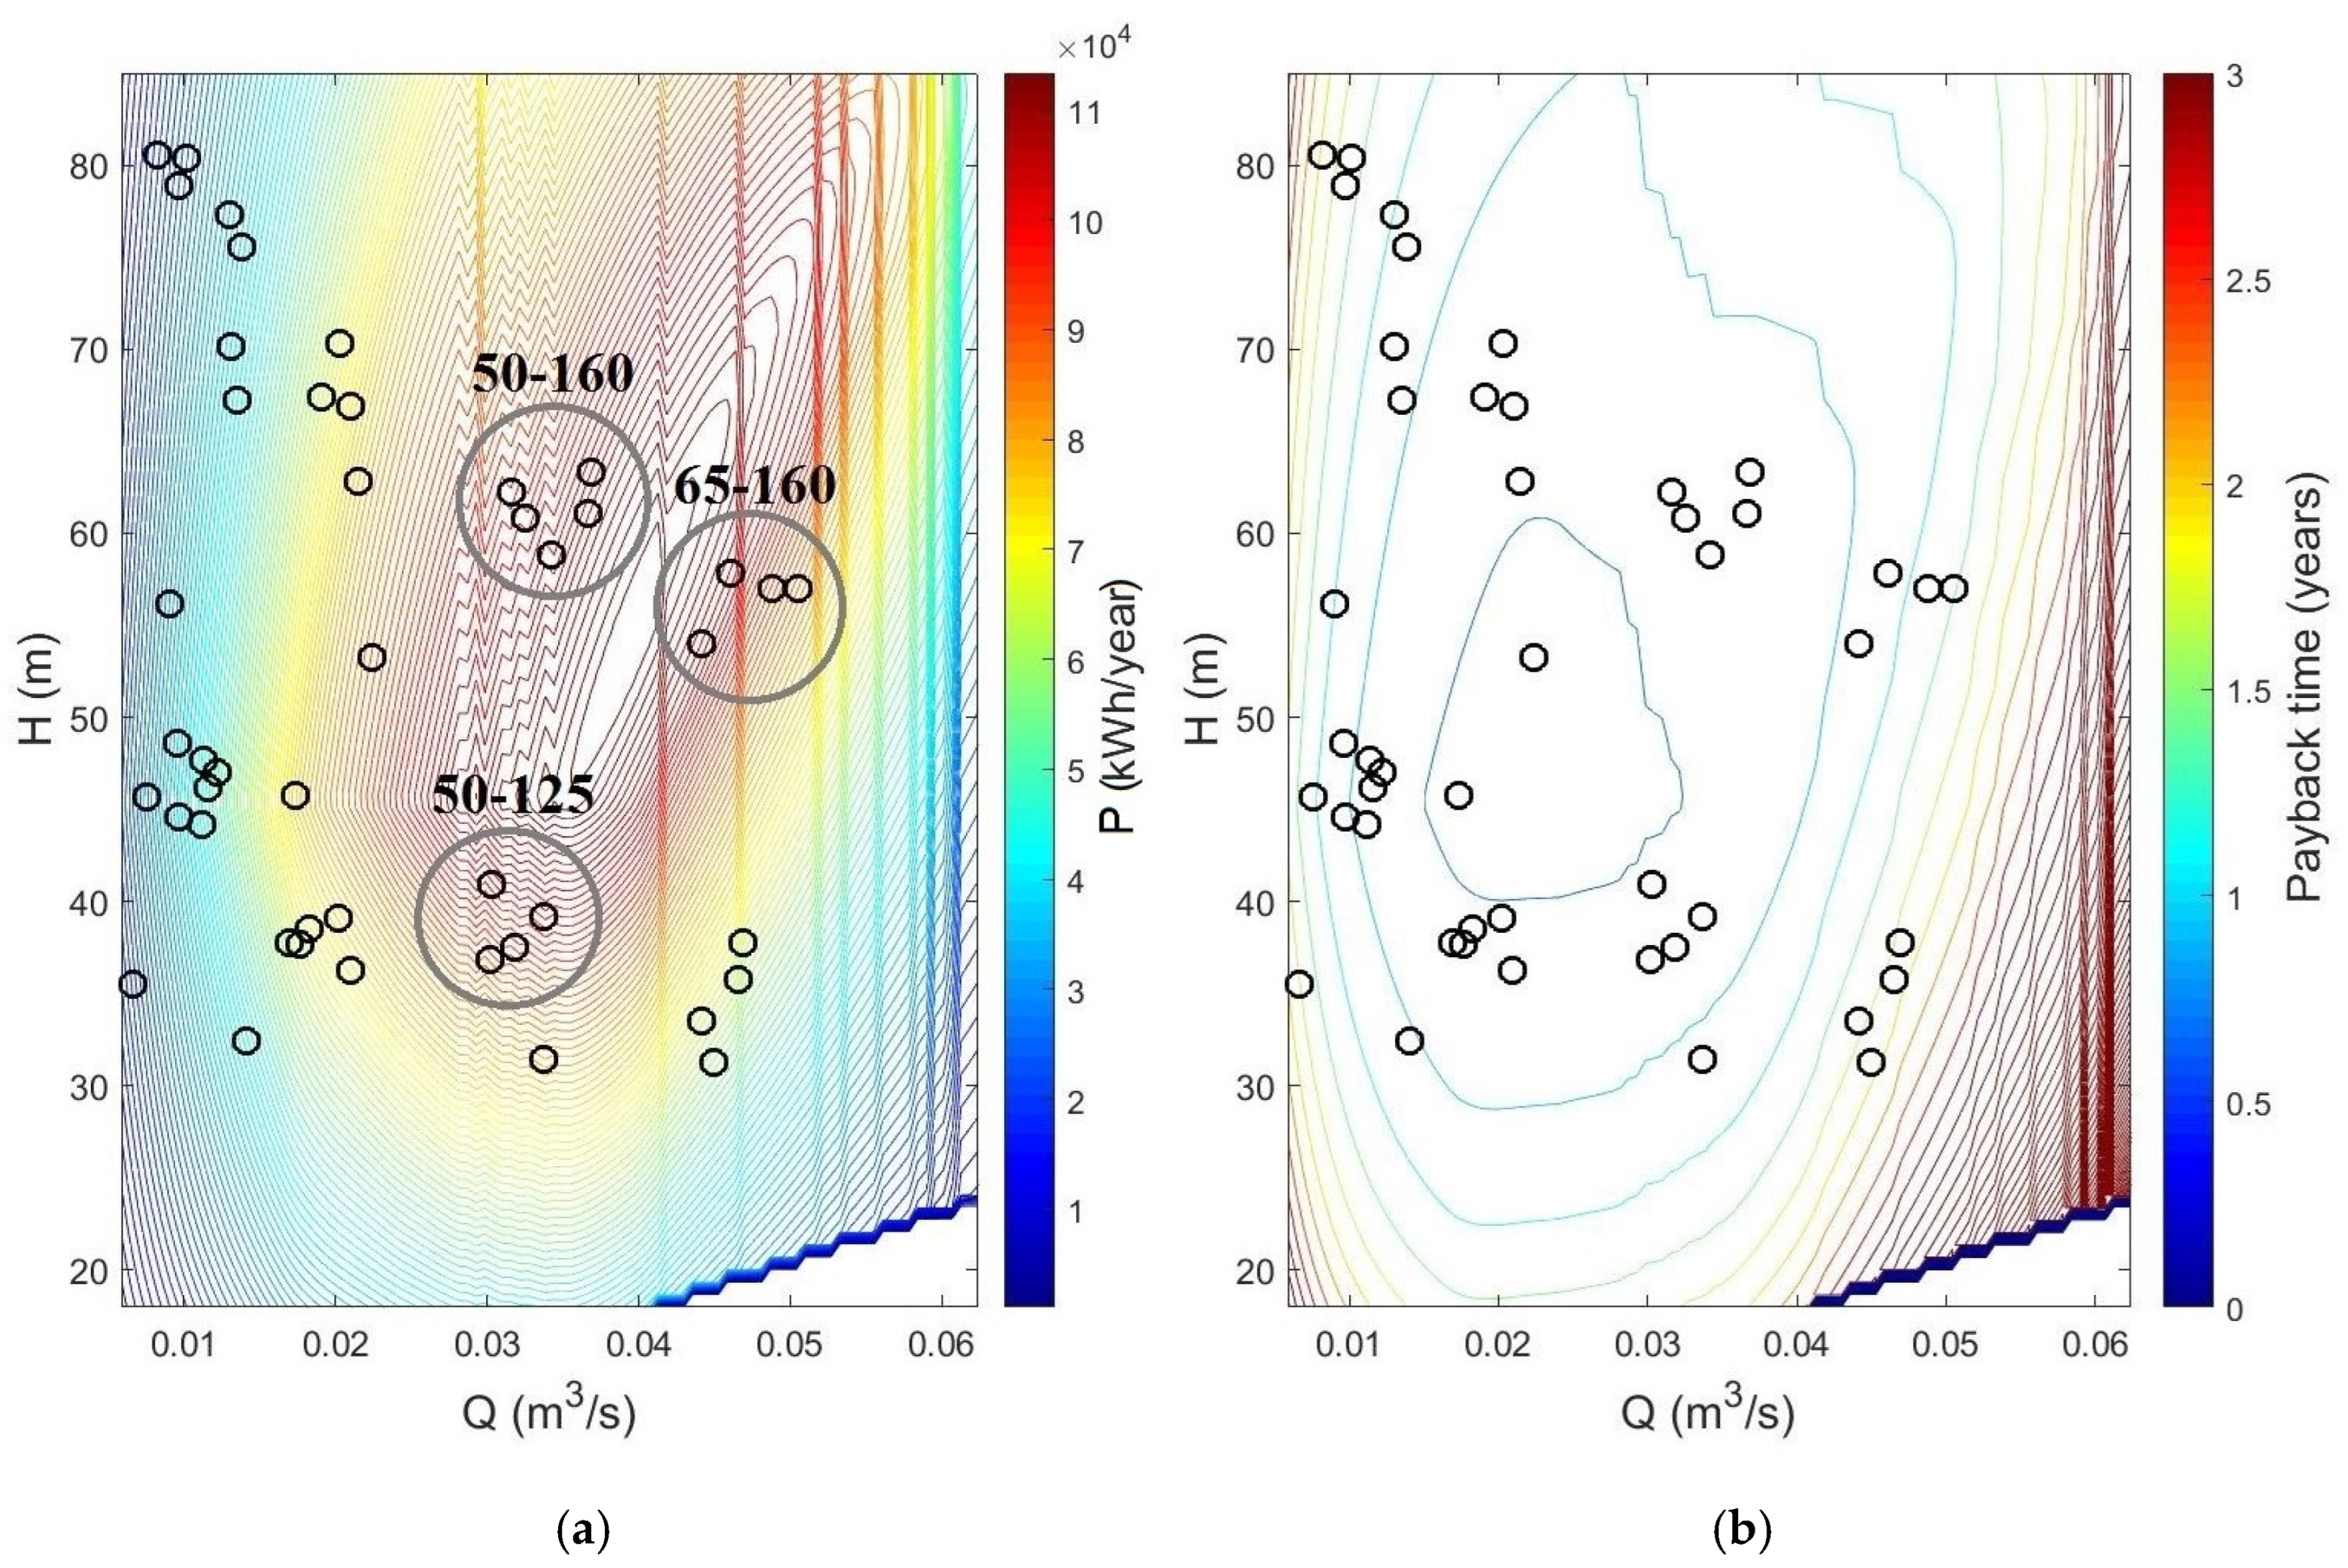
In order to compare the results with those reported by the original study, a similar shaft speed was selected (3020 RPM). The results are shown in Figure 4.
The chart of Figure 4a indicates that the maximum yearly energy yield that can be obtained by a PAT rotating at 3020 RPM in the selected location is equal to approximately 100 MWh/year which is close to the 123.4 MWh/year forecasted by the authors of the article [19]. The families of standardized centrifugal pumps most likely to achieve the highest energy output are the 50–160, 50–125 and 65–150. The first two digits correspond to the nominal size in mm of the pump discharge nozzle (PAT inlet nozzle) while the last three refer to the nominal diameter of the impeller in mm. Instead, Figure 4b shows that the payback of the investment would likely occur in less than three years with any PAT included in the range of the chart axis. However, the shortest possible payback time corresponds to a hypothetical turbine having nearly half of the nominal flow rate with respect to the ideal PAT that would maximize the energy yield as seen in Figure 4a.

5. Conclusions

The main scope of the proposed algorithm is the selection of PAT family and system configuration for any given potential site in order to meet the existing constraints and satisfy the stakeholder’s expectations. The generated results can be useful for a designer in order to shortlist one or more families of commercially available PATs for determinate locations. The software has been tested against a previously investigated site for in-pipe energy recovery within a water network whose data was found in the literature. The results compared favourably with the expectations of the authors of the original study and provided useful information for a successful choice of equipment.

Acknowledgments

The present research has been part funded by the ERDF Interreg Ireland-Wales Programme 2014-2020, Dŵr Uisce Project.

Conflicts of Interest

The authors declare no conflict of interest.

References

  1. Agarwal, T. Review of pump as turbine (PAT) for micro-hydropower. Int. J. Emerg. Technol. Adv. Eng. 2012, 11, 163–168. [Google Scholar]
  2. Williams, A. Pumps as turbines for low cost micro hydro power. Renew. Energy 1996, 9, 1227–1234. [Google Scholar] [CrossRef]
  3. Alatorre-Frenk, C. Cost Minimisation in Micro-Hydro Systems Using Pumps-as-Turbines. Ph.D. Dissertation, University of Warwick, Coventry, UK, 1994. [Google Scholar]
  4. Motwani, K.H.; Jain, S.V.; Patel, R.N. Cost analysis of pump as turbine for pico hydropower plants—A case study. Procedia Eng. 2013, 51, 721–726. [Google Scholar] [CrossRef]
  5. McNabola, A.; Coughlan, P.; Corcoran, L.; Power, C.; Williams, A.P.; Harris, I.; Gallagher, J.; Styles, D. Energy recovery in the water industry using micro-hydropower: An opportunity to improve sustainability. Water Policy 2014, 16, 168–183. [Google Scholar] [CrossRef]
  6. Novara, D.; Carravetta, A.; McNabola, A.; Ramos, H.M. Cost model for Pumps As Turbines in run-of-river and in-pipe micro-hydropower applications. J. Water Resour. Plan. Manag. 2018. under review. [Google Scholar]
  7. Novara, D.; Derakhshan, S.; McNabola, A.; Ramos, H.M. Estimation of unit cost and maximum efficiency for Pumps as Turbines. In Proceedings of the 9th Eastern European IWA Young Water Professionals conference, Budapest, Hungary, 24–27 May 2017. [Google Scholar]
  8. Binama, M.; Su, W.T.; Li, X.B.; Li, F.C.; Wei, X.Z.; An, S. Investigation on pump as turbine (PAT) technical aspects for micro hydropower schemes: A state-of-the-art review. Renew. Sustain. Energy Rev. 2017, 79, 148–179. [Google Scholar] [CrossRef]
  9. Singh, P. Optimization of Internal Hydraulics and of System Design for PUMPS AS TURBINES with Field Implementation and Evaluation. Ph.D. Dissertation, Universität Karlsruhe, Karlsruhe, Germany, 2005. [Google Scholar]
  10. Yang, S.S.; Derakhshan, S.; Kong, F.Y. Theoretical, numerical and experimental prediction of pump as turbine performance. Renew. Energy 2012, 48, 507–513. [Google Scholar] [CrossRef]
  11. Garay, P.N. Using pumps as hydro turbines. Hydro Rev. 1990, 9, 52–61. [Google Scholar]
  12. Derakhshan, S.; Nourbakhsh, A. Experimental study of characteristic curves of centrifugal pumps working as turbines in different specific speeds. Exp. Therm. Fluid Sci. 2008, 32, 800–807. [Google Scholar] [CrossRef]
  13. Pugliese, F.; De Paola, F.; Fontana, N.; Giugni, M.; Marini, G. Experimental characterization of two Pumps as Turbines for hydropower generation. Renew. Energy 2016, 99, 180–187. [Google Scholar] [CrossRef]
  14. Fecarotta, O.; Carravetta, A.; Ramos, H.M.; Martino, R. An improved affinity model to enhance variable operating strategy for pumps used as turbines. J. Hydraul. Res. 2016, 54, 332–341. [Google Scholar] [CrossRef]
  15. Barbarelli, S.; Amelio, M.; Florio, G. Experimental activity at test rig validating correlations to select pumps running as turbines in microhydro plants. Energy Convers. Manag. 2017, 149, 781–797. [Google Scholar] [CrossRef]
  16. Pump Handbook; GRUNDFOS Management A/S: Bjerringbro, Denmark, 2004.
  17. Low Voltage Process Performance Motors According to EU MEPS; ABB Motors and generators; ABB: Zürich, Switzerland, 2014.
  18. Carravetta, A.; Del Giudice, G.; Fecarotta, O.; Ramos, H.M. PAT design strategy for energy recovery in water distribution networks by electrical regulation. Energies 2013, 6, 411–424. [Google Scholar] [CrossRef]
  19. Rossi, M.; Righetti, M.; Renzi, M. Pump-as-turbine for Energy Recovery Applications: The Case Study of An Aqueduct. Energy Procedia 2016, 101, 1207–1214. [Google Scholar] [CrossRef]
  20. Ogayar, B.; Vidal, P.G. Cost determination of the electro-mechanical equipment of a small hydro-power plant. Renew. Energy 2009, 34, 6–13. [Google Scholar] [CrossRef]
  21. Incentivazione Della Produzione di Energia Elettrica da Impianti a Fonti Rinnovabili Diversi dai Fotovoltaici; Procedure Applicative del D.M. 23 Giugno 2016; GSE: Houston, TX, USA, 2016.
  22. Calado, T.V.R. Microprodução de Energia, Caso de Loures. Master’s Thesis, Instituto Superior Técnico, Lisbon, Portugal, 2014. [Google Scholar]
Figure 1. Basic layout of the software logic.
Proceedings 02 00678 g001
Figure 2. Typical Q-H and Q-P characteristic curves of a PAT relative to its BEP.
Proceedings 02 00678 g002
Figure 3. Recorded flow rate daily profile at the outlet of a water storage tank, adapted from [19].
Proceedings 02 00678 g003
Figure 4. Algorithm results for the PAT downstream of Merano aqueduct: (a) yearly energy yield; (b) simple Payback time.
Proceedings 02 00678 g004
Publisher’s Note: MDPI stays neutral with regard to jurisdictional claims in published maps and institutional affiliations.