1. Introduction
Membrane fouling in membrane bioreactors (MBRs) decreases permeate yield (flux) and increases energy consumption [
1,
2]. Flux can be affected by concentration polarization, and external and internal membrane deposits [
3]. Membrane fouling can be biological, organic and inorganic as the result of biological and chemical properties of membrane foulants [
1,
2]. The nature of such foulants defines the choice of membrane cleaners, since they have involvement on membrane cleaning efficiency.
Membrane cleaning is typically classified into in-situ and ex-situ cleaning based on membrane module cleaning within membrane bioreactor or outside the bioreactor [
4]. It is divided into physical, chemical and biochemical cleaning based on foulants’ removal mechanisms or cleaning substrates used. Physical cleaning is applied to remove reversible fouling (e.g., biosolids coats and cake layer) and it is usual attained by backflushing [
5] and/or relaxation, which pause permeation and permit air bubbles to remove solids from membrane surface [
6], sonication [
7], suspended particles and carriers addition [
8], and mechanical cleaning (sweeping and flushing) [
9]. Chemical cleaning is applied to remove irreversible fouling by using chemical substrates, such as sodium hydroxide, citric acid and hypochlorite [
10]. Chemical cleaning mainly executed in-situ as maintenance cleaning or intensive cleaning in site.
Monitoring and control of the membrane fouling in MBRs are important because such flux obstacles affect operating costs [
11]. Most of the monitoring systems estimate sludge filterability and fouling potential and, thus, membrane fouling rate [
2]. However, they do not predict the membrane behavior under the applied operating conditions. By measuring the TMP directly on membrane modules, monitoring of the fouling trend is permitted under steady and transient operating conditions [
12].
In the current work, TMP monitoring and pattern was studied to estimate membrane fouling and to prevent permeate decrease under various cleaning actions. Specifically, strategies such as aeration velocity regulation, backwash supply increase, mechanical and chemical cleaning were applied to evaluate membrane fouling recovery.
2. Materials and Methods
2.1. MBR Pilot-Plant Configuration
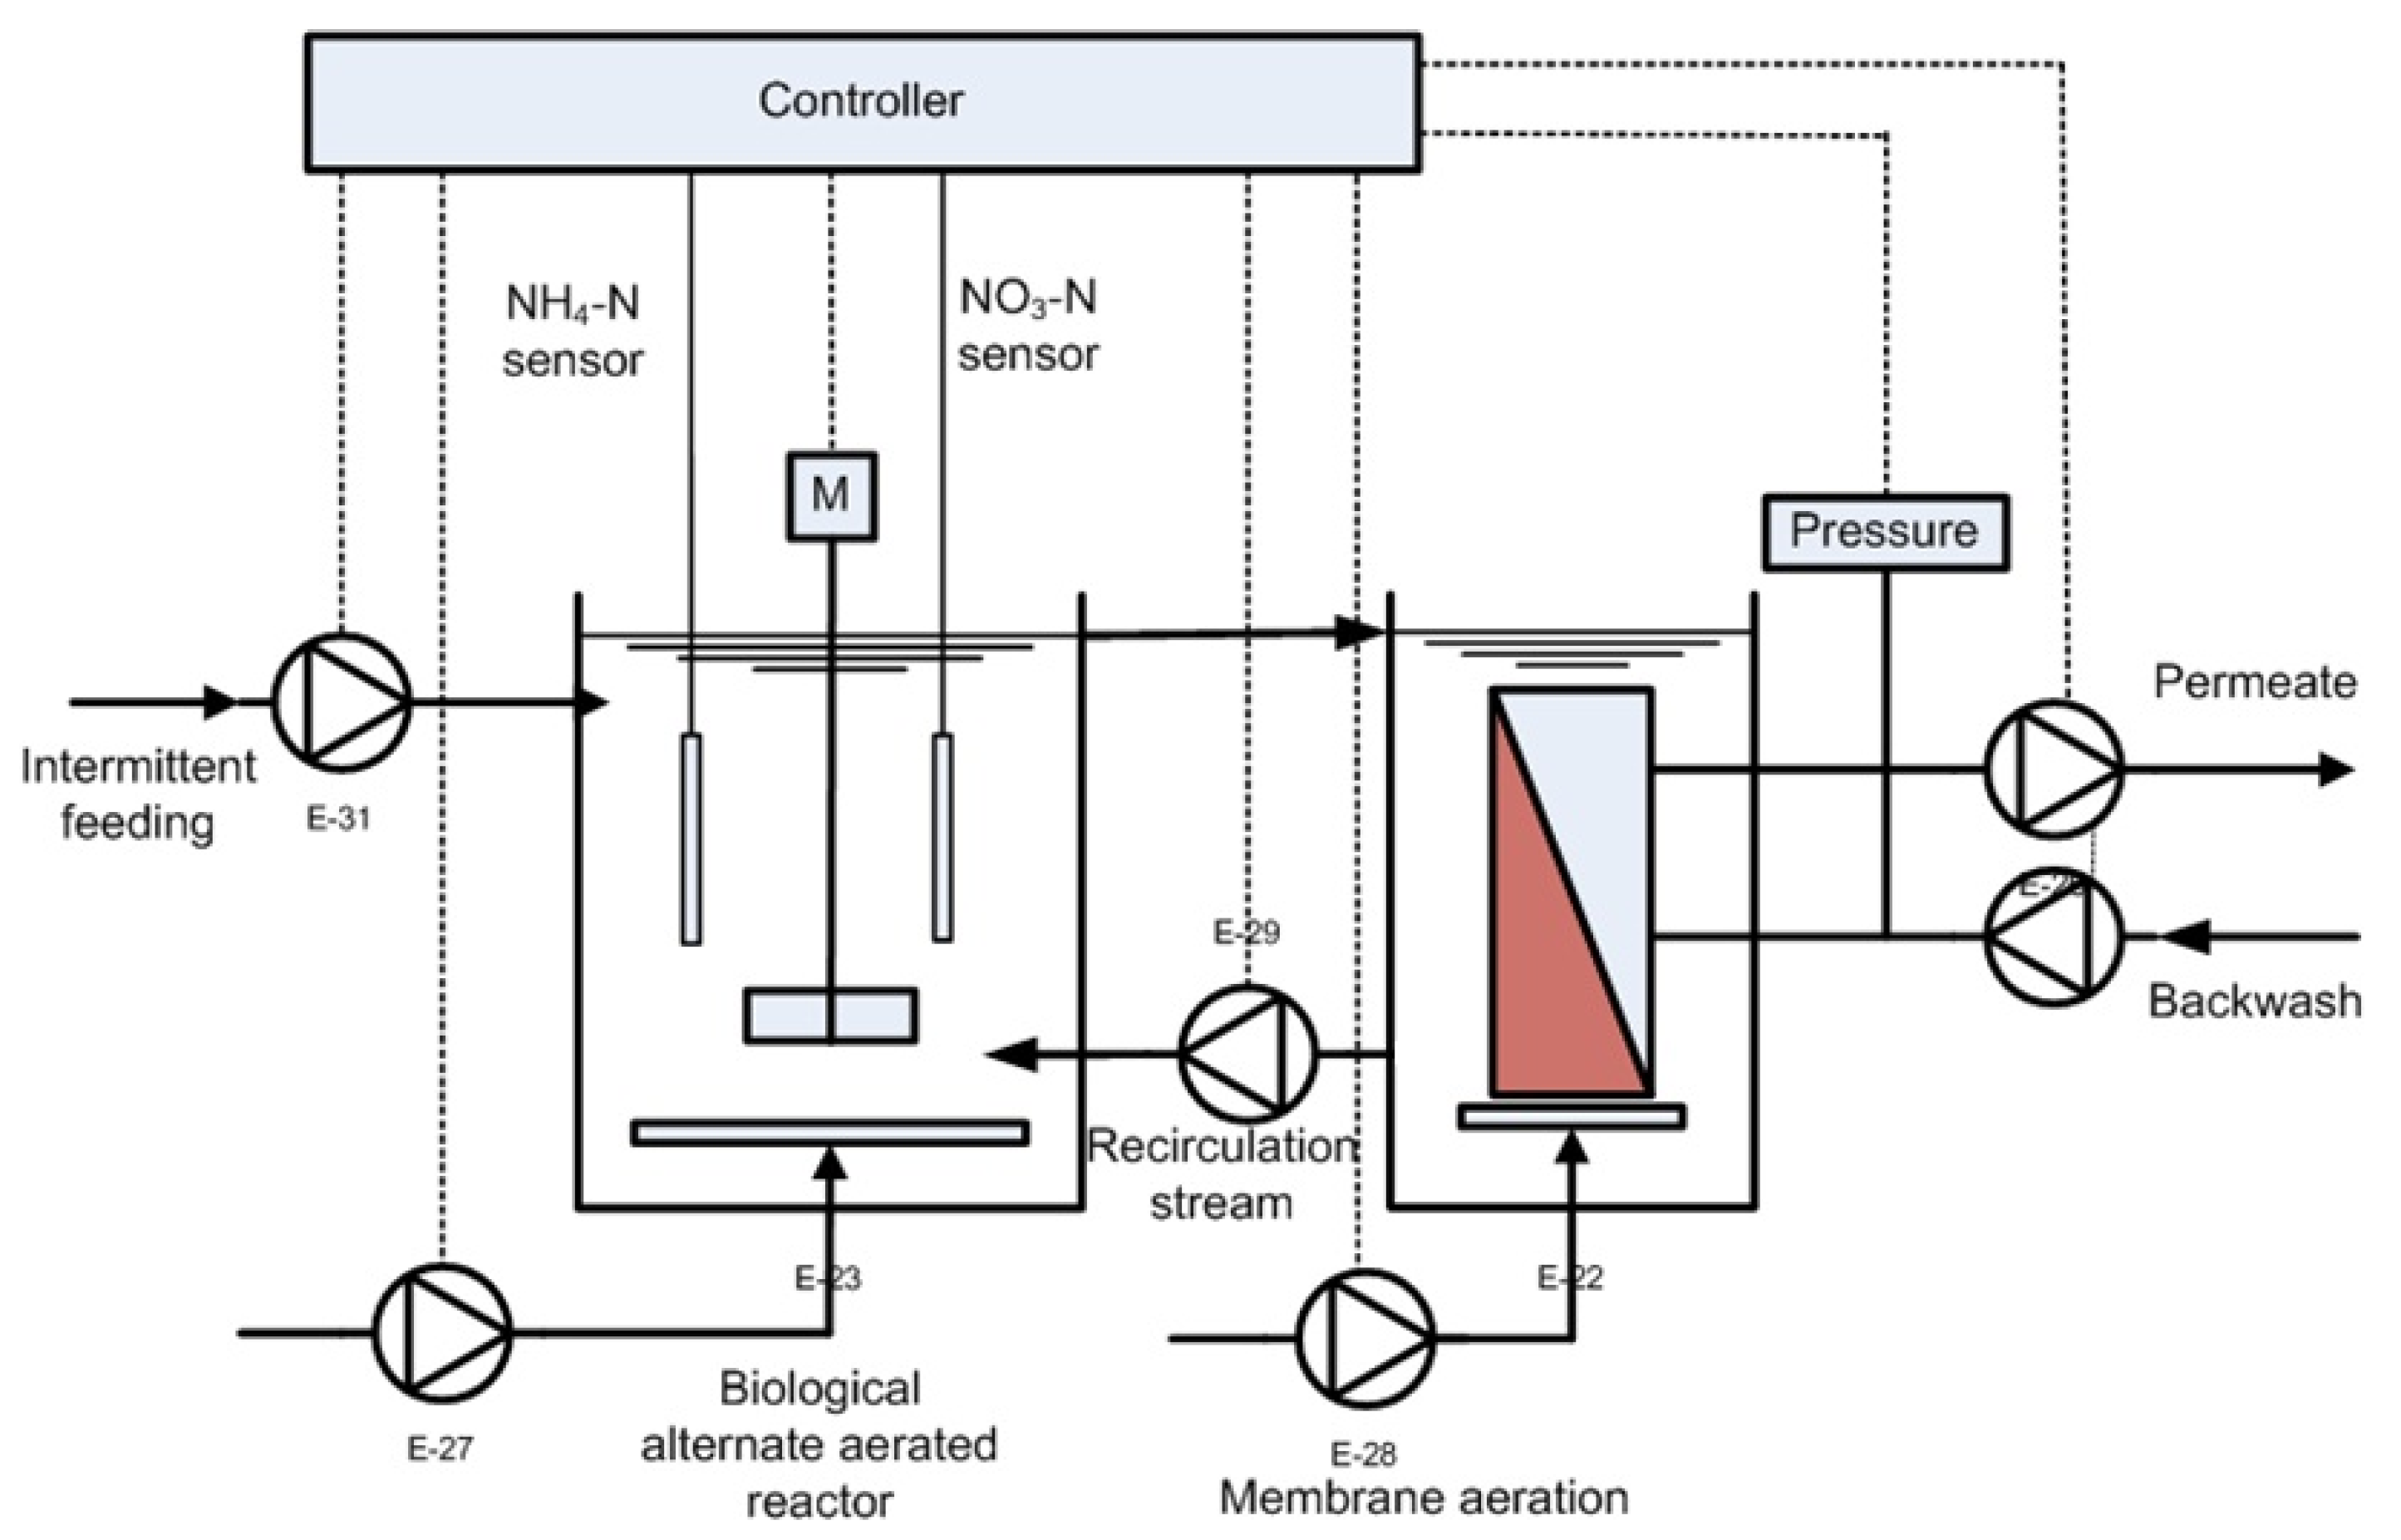
Figure 1 illustrates the schematic layout of the pilot-scale MBR plant. The maximum operating filtration and backwash pressure were −400 and +150 mbar, respectively. A feeding tank (20 L), a bioreactor tank (100 L) and an external membrane tank (80 L) were the main parts of the pilot-scale MBR systrem. Biomass reciculation was achieved from the main bioreactor to the external tank at rate of 187 L/h. On-line TMP monitoring and control was conducted through a pressure transmitter. The periodic feeding at the beginning of the anoxic phase developed favorable conditions for effective C and N removal. To accomplish denitrification, external carbon source was added to increase the low carbon/nitrogen ratio of the raw wastewater. The membrane (Microdyn Nadir UP-150) consisted of three semipermeable flat sheets, which act as artificial barrier for retenting effluent biosolids [
13].
The membrane was made by hydrophilic polyether-sulfone (PES) sheets of 2 mm thickness and 0.04 μm pores size (cut-off, 150 kDa), with the total active surface being equal to 0.34 m2. The membrane could operate under a wide range of pH and temperature, i.e., 2–10 and 5–40 °C, respectively. A fine bubble aeration system was installed at the bottom of module to provide air crossflow and prevent clogging.
2.2. Control System Design
A real-time control approach was implemented to oversee and control both activated sludge process and membrane filtration efficiency. TMP was monitored by a PLC, which linked to a SCADA (supervisory control and data acquisition) system. The recording TMP data was continuously logged (every minute) via the implementation of the Modcan32 software. To sustain effiecient filtration performance, suction duration phase, crossflow aeration, backwash (at −250 mbar) and chemical cleaning (at −300 mbar) were controlled by the supervisory control system, evaluating the on-line acquisition data. Each filtration cycle consisted of a permeate phase of 480 s, a relaxation phase of 30 s, a backwash period of 60 s and a second relaxation phase of 30 s in the oxic period. It is noted that automatically emergency backwash cycles (1 min per each one) were begun by the controller at TMP values above −300 mbar, indicating membrane fouling and need for chemical cleaning by using a warning light. For TMP values above −350 mbar, PLC ceased the filterability, ensuring the membrane integrity.
2.3. Wastewater Characteristics
The MBR system was fed with sewage obtained from the University Campus of Xanthi. The influent traits were determined as follows: pH, 7.31 ± 0.23; EC, 1229 ± 170 μS/cm; suspended solids (SS), 201 ± 88.5 mg/L; BOD5, 149 ± 37.2 mg/L; total COD, 388 ± 196 mg/L; total Kjeldahl nitrogen (TKN), 73.8 ± 12.9 mg/L and ammonium nitrogen (NH4+–N), 57.3 ± 15.8 mg/L.
2.4. Analytical Methods
Permeate was obtained by employing a vacuum pressure drop over the membrane sheets, where the TMP was monitored through the use of a pressure transducer. TMP data were recorded via a Modcan32 program at a frequency of 1 min. An ABB PLC was programmed through the implementation of the Controller Functionality Software (CODESYS) and the use of Continuous Function Charts (CFC) as the target language for PLC environments. Off-line measurements of NO
3−–N and NH
4+–N concentrations were performed by ion chromatographic analysis and the steam distillation method, respectively. These off-line measurements were used for sensors’ matrix adjustment and ion electrodes validation. The dissolved oxygen (DO) concentration was estimated by an oxygen meter (WTW Handheld meter Oxi340i) and the electrical conductivity (EC) was determined by using a CRISON CM35 meter. All off-line parameters measured were based on protocols reported in APHA manual [
14].
3. Results and Discussion
The submerged membrane bioreactor was initially inoculated with activated sludge from the WWTP (wastewater treatment plant) of Xanthi. Regarding loading characteristics, the MBR was operated under a F/M ratio of 0.27 ± 0.1 g BOD5/g VSS.d, an organic loading rate (LORG) of 0.9 ± 0.2 g BOD5/L.d and a nitrogen loading rate (LN,V) of 0.024 g TKN/L.d. During the whole experimental period, sludge was not wasted and the corresponding sludge age (SRT) was identical with the exact operation period. Permeate flux was ranged between 13.1 L/m2·h and 32.6 L/m2·h, while MLSS concentration was 4–6 g/L. The permeability was determined as 27.5 ± 6.7 L/m2·h.mbar, which corresponded to a membrane resistance of 2.4 ± 0.5 m−1. In the effluent of the MBR system, the BOD5 and COD concentrations were 3.4 ± 1.5 and 21 ± 12 mg/L, respectively. Regarding nitrogen removal process, TKN, NH4+–N and NO3−–N concentrations in the effluent of the MBR were 6.76 ± 1.39, 2.70 ± 0.65 and 0.7 ± 0.5 mg/L, respectively. In all cases, the effluent characteristics of the MBR met the discharge limits for unrestricted irrigation.
3.1. Fouling Monitoring by TMP
Membrane fouling phenomena were prevented through the implementation of physicochemical practices for TMP control. Such fouling prevention methods were hydraulic cleaning via backflushing, volume supply and backwash frequency increase (cycles’ replications), mechanical cleaning, airation capacity increase and chemical cleaning, as the last management technique.
3.1.1. Hydraulic Cleaning
According to Hwang et al. [
15] and Raffin et al. [
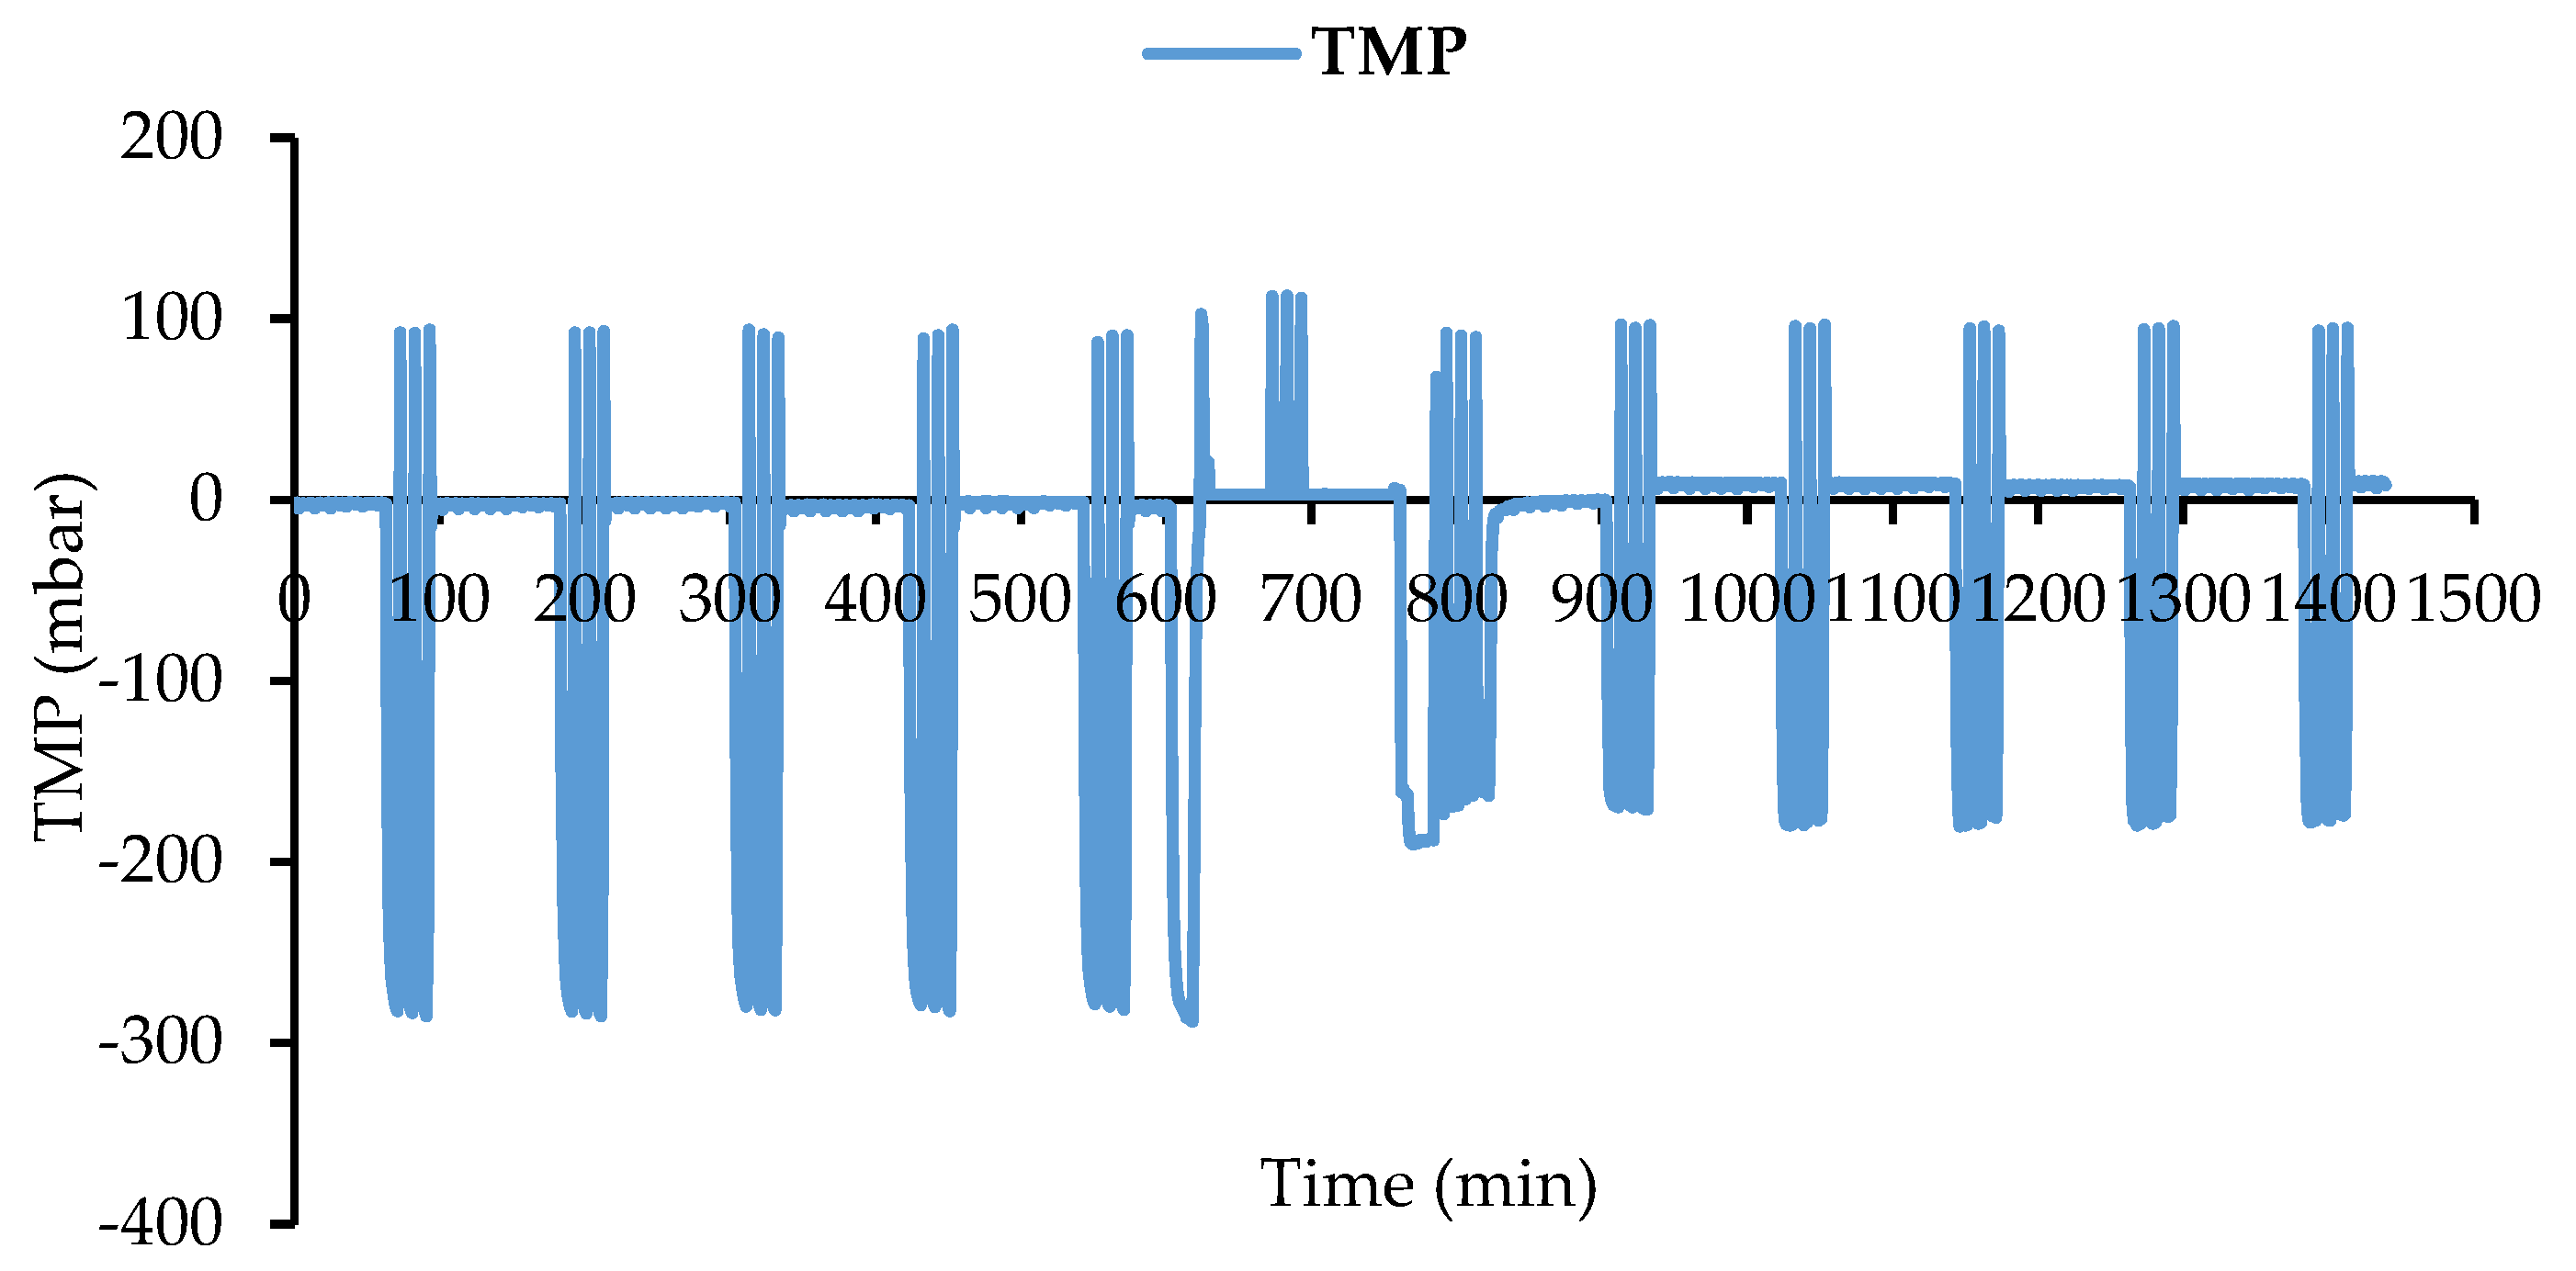
16], solids accumulation on membrane surface can be removed by backflush flux increase in combination with further backwashing replications, improving the permeate flux. At TMP values higher than −250 mbar, the supervisory control system initiated membrane cleaning by applying a double volume of water and three replications of backwash cycles, enhancing the purification method. TMP was changed at −150 mbar and the respective flux was increased from 10.6 to 13.8 L/m
2·h (
Figure 2). Indeed, the reversible fouling can be eliminated by frequent backwashing and this practice was also confirmed by Yigit et al. [
5].
3.1.2. Mechanical Cleaning
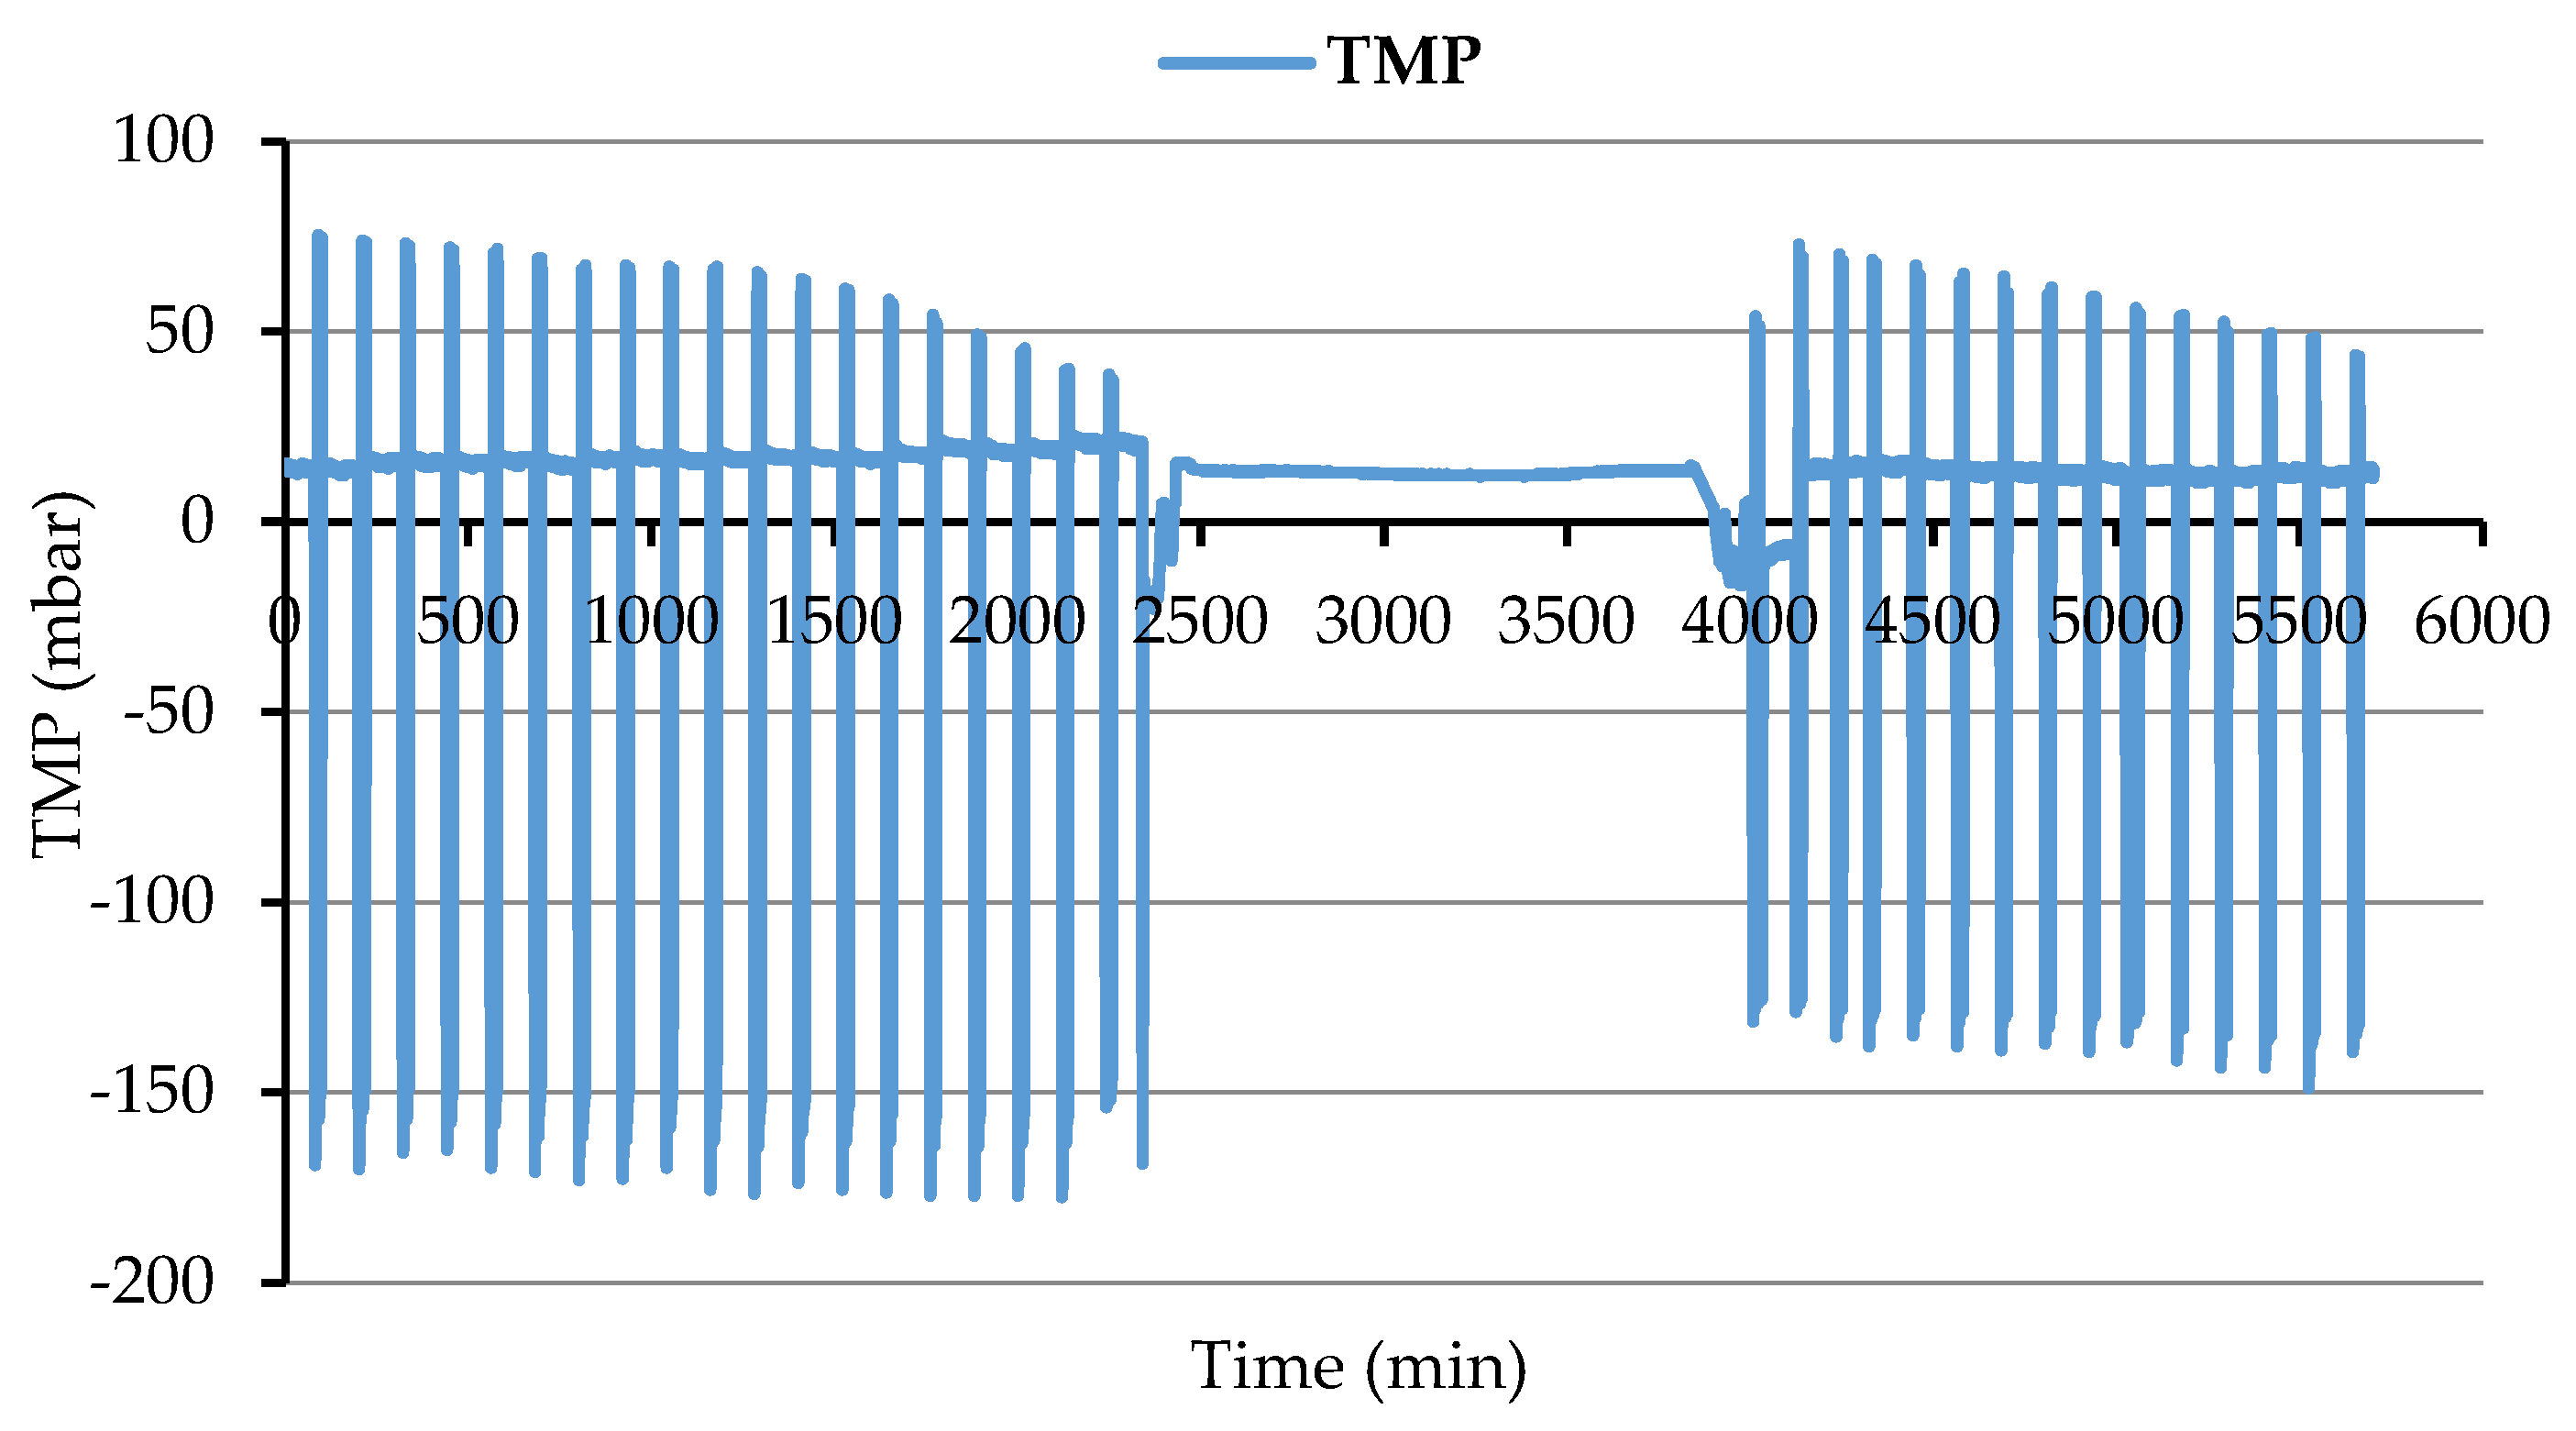
A further attempt to remove membrane surface coat was to unload the activated sludge from the membrane tank and scrap the fouling layer by a sponge, followed by intensive wash with flushing water. TMP recording data showed a change from −170 mbar to −130 mbar (
Figure 3) and a permeate flux improvement from 13.1 to 21.4 L/m
2·h. According to Van den Brink et al. [
9], fouling cannot be removed completely by harsh mechanical cleaning, but partially by superficially external clogging of pores. Therefore, we assume that the membrane cleaning efficiency was mainly due to the water pressure.
3.1.3. Chemical Cleaning
Chemical purification could effectively control the irreversible fouling by using sodium hypochlorite or/and citric acid [
4]. Thus, a membrane that is chemically and biologically clean, free of organic foulants, can provide adequate flux and separation [
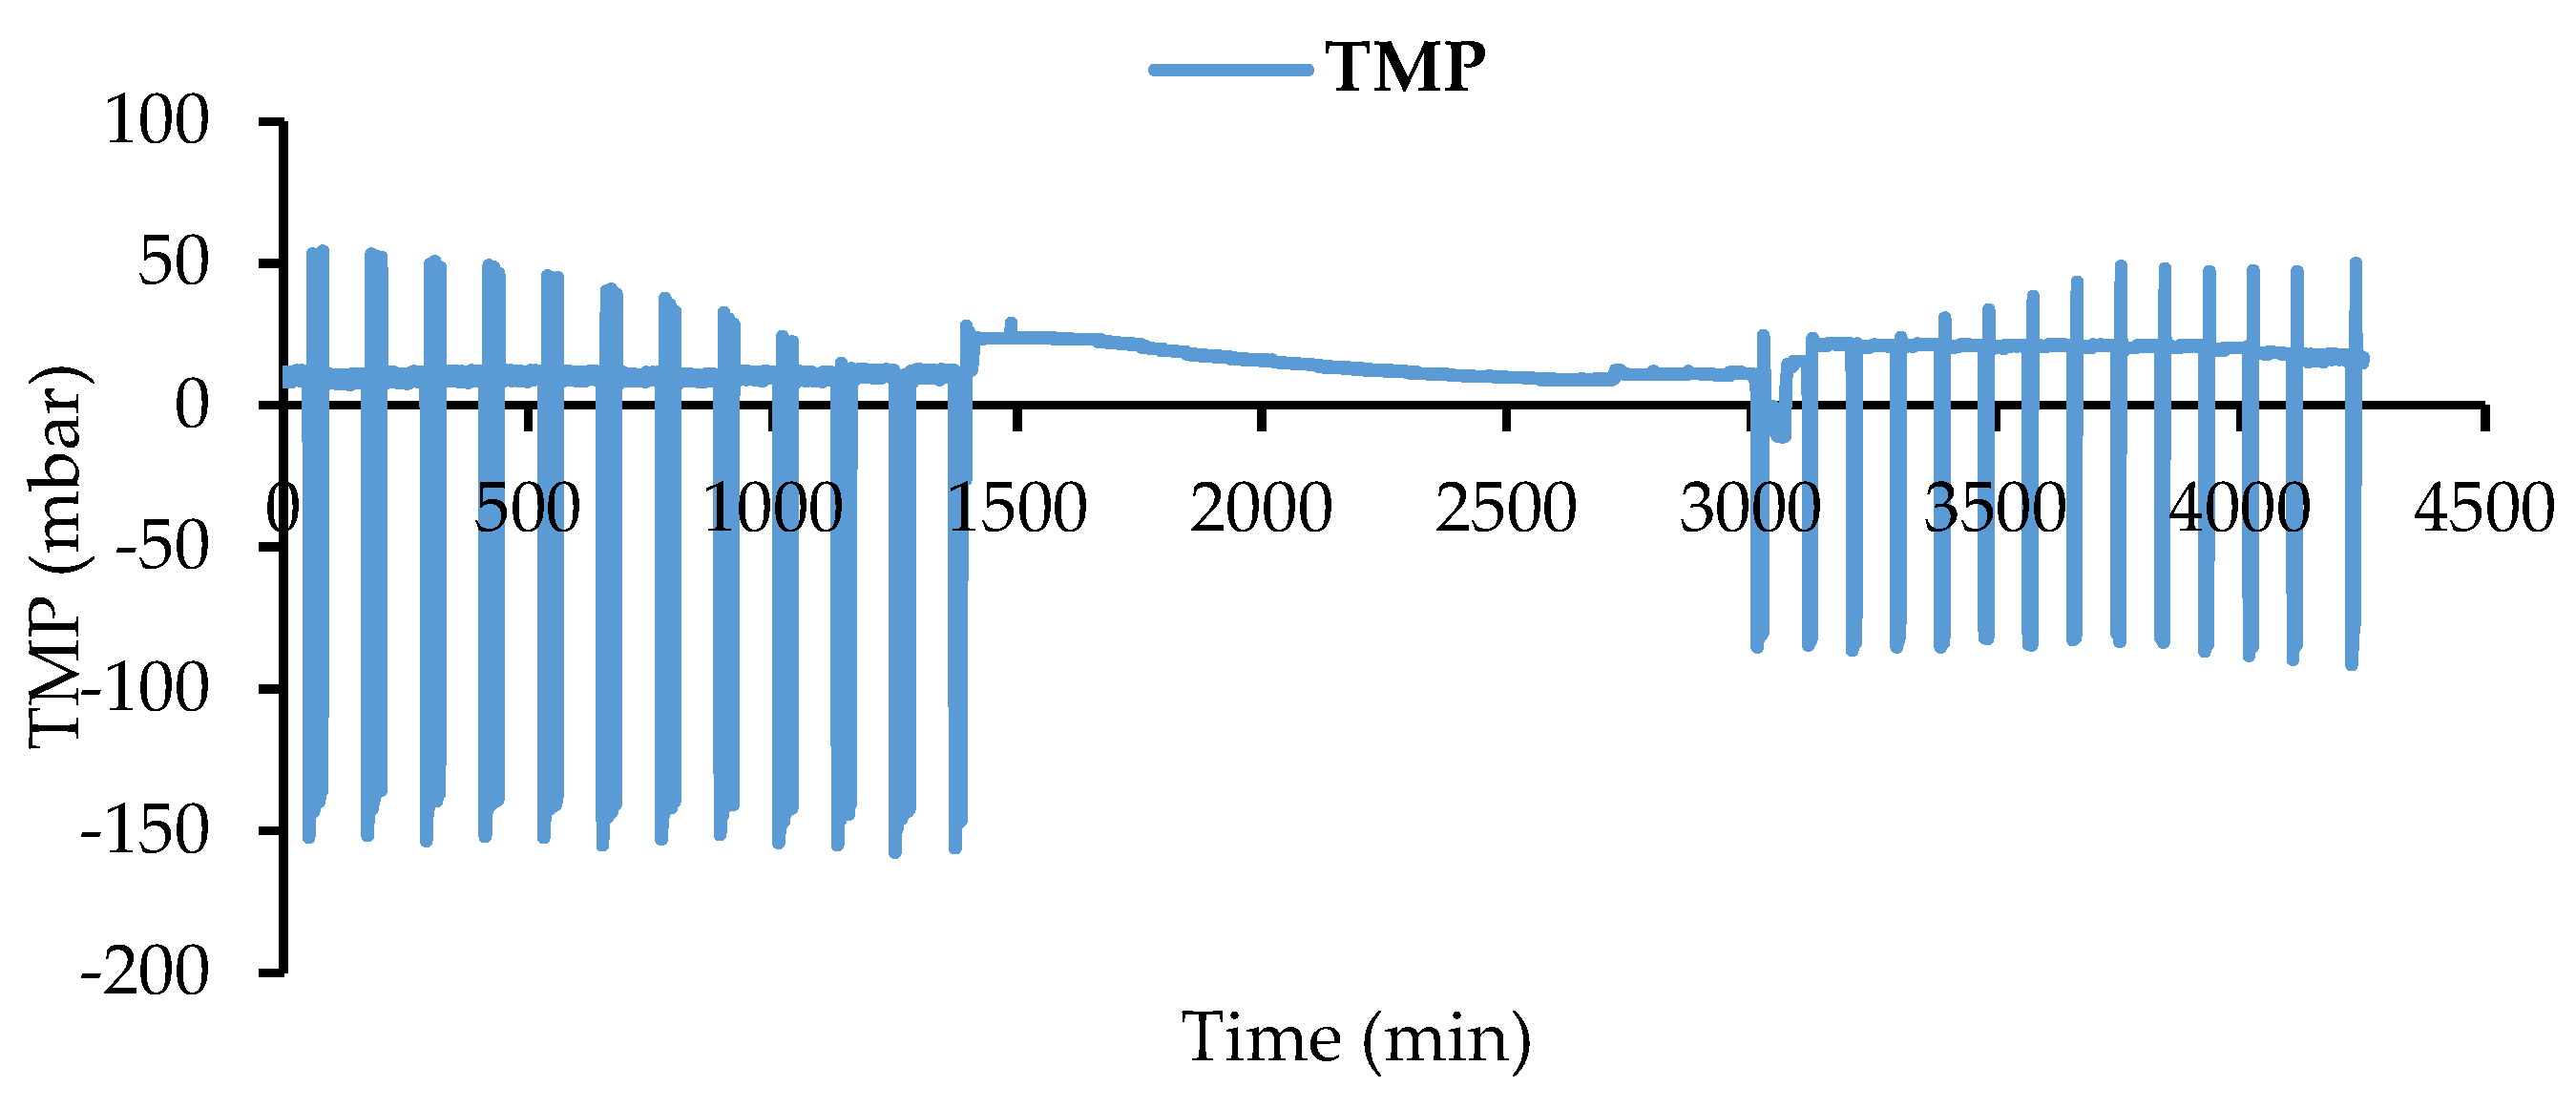
10]. After the chemical cleaning with a NaOCl solution, the specific flux reached up to 28.9 L/m
2·h and the respective TMP was changed to −82.3 mbar, as shown in
Figure 4. Accordingly, the TMP stabilized at flux equal to 57% of its initial value (16.5 L/m
2·h), even after a long operating period.
5. Conclusions
The performance of the externally-submerged MBR system was optimized through the use of an advanced control system, which monitored the TMP. Membrane fouling and flux decrease were prevented automatically by initiating either emergence backwash or chemical cleaning, as electronically controlled by the on-line TMP measurements. Hydraulic cleaning resulted in a TMP change from −250 up to −150 mbar and the respective flux was increased from 10.6 to 13.8 L/m2·h. Mechanical cleaning led to a TMP shift from −170 mbar to −130 mbar and a flux recovery from 13.1 to 21.4 L/m2·h. Chemical cleaning with a NaOCl solution led to a specific flux of 28.9 L/m2·h, corresponding to a TMP of −82.3 mbar. This control system design regarding MBR operation resulted in BOD5, COD, TN and PO43−-P removal efficiencies of 97.9%, 93.2%, 90.5% and 93.2%, respectively.
Author Contributions
P.M. and K.A. conceived and designed the experiments; K.A. and M.M. performed the experiments; P.M., K.A. and S.N. analyzed the data; National Scholarships Foundation funded the research; P.M., K.A. and S.N.wrote the paper.
Funding
This research was funded by the National Scholarships Foundation 2016 (Project Title: Advanced control methods applied in activated sludge systems); Greek Ministry of Education Research and Religions.
Acknowledgments
This research was funded by the National Scholarships Foundation 2016 (Project Title: Advanced control methods applied in activated sludge systems); Greek Ministry of Education Research and Religions.
Conflicts of Interest
The authors declare no conflict of interest. The founding sponsors had no role in the design of the study; in the collection, analyses, or interpretation of data; in the writing of the manuscript, and in the decision to publish the results.
References
- Drews, A. Membrane fouling in membrane bioreactors-Characterisation, contradictions, cause and cures. J. Membr. Sci. 2010, 363, 1–28. [Google Scholar] [CrossRef]
- Meng, F.; Zhang, S.; Oh, Y.; Zhou, Z.; Shin, H.-S.; Chae, S.-R. Fouling in membrane bioreactors: An updated review. Water Res. 2017, 114, 151–180. [Google Scholar] [CrossRef] [PubMed]
- Akhondi, E.; Zamani, F.; Tng, K.H.; Leslie, G.; Krantz, W.B.; Fane, A.G.; Chew, J.W. The performance and fouling control of submerged hollow fiber (HF) systems: A review. Appl. Sci. 2017, 7, 765. [Google Scholar] [CrossRef]
- Wang, Z.; Ma, J.; Tang, C.; Kimura, K.; Wang, Q.; Han, X. Membrane cleaning in membrane bioreactors: A review. J. Membr. Sci. 2014, 468, 276–307. [Google Scholar] [CrossRef]
- Yigit, N.; Civelekoglu, G.; Harman, I.; Köseoǧlu, H.; Kitis, M. Effects of various backwash scenarios on membrane fouling in a membrane bioreactor. In Environmental Earth Sciences; Springer: Berlin/Heidelberg, Germany, 2011; pp. 917–929. [Google Scholar]
- Judd, S. The MBR Book: Principles and Applications of Membrane Bioreactors for Water and Wastewater Treatment, 2nd ed.; Elsevier Science: New York, NY, USA, 2011; p. 344. [Google Scholar]
- Kobayashi, T.; Hosaka, Y.; Fujii, N. Ultrasound-enhanced membrane-cleaning processes applied water treatments: Influence of sonic frequency on filtration treatments. Ultrasonics 2003, 41, 185–190. [Google Scholar] [CrossRef]
- Aslam, M.; Charfi, A.; Lesage, G.; Heran, M.; Kim, J. Membrane bioreactors for wastewater treatment: A review of mechanical cleaning by scouring agents to control membrane fouling. Chem. Eng. J. 2017, 307, 897–913. [Google Scholar] [CrossRef]
- Van den Brink, P.; Vergeldt, F.; Van As, H.; Zwijnenburg, A.; Temmink, H.; van Loosdrecht, M.C.M. Potential of mechanical cleaning of membranes from a membrane bioreactor. J. Membr. Sci. 2013, 429, 259–267. [Google Scholar] [CrossRef]
- Shi, X.; Tal, G.; Hankins, N.P.; Gitis, V. Fouling and cleaning of ultrafiltration membranes: A review. J. Water Process Eng. 2014, 1, 121–138. [Google Scholar] [CrossRef]
- Sabia, G.; Ferraris, M.; Spagni, A. Online monitoring of MBR fouling by transmembrane pressure and permeability over a long-term experiment. Sep. Purif. Technol. 2014, 122, 297–305. [Google Scholar] [CrossRef]
- Monclús, H.; Ferrero, G.; Buttiglieri, G.; Comas, J.; Rodriguez-Roda, I. Online monitoring of membrane fouling in submerged MBRs. Desalination 2011, 277, 414–419. [Google Scholar] [CrossRef]
- Azis, K.; Vardalachakis, C.; Ntougias, S.; Melidis, P. Microbiological and physicochemical evaluation of the effluent quality in a MBR system to meet the legislative limits for wastewater reuse. Water Sci. Technol. 2017, 76, 1796–1804. [Google Scholar] [CrossRef] [PubMed]
- American Public Health Association (APHA). Standard Methods for the Examination of Water and Wastewate, 21th ed.; American Public Health Association: Washington, DC, USA, 2005. [Google Scholar]
- Hwang, K.-J.; Chan, C.-S.; Tung, K.-L. Effect of backwash on the performance of submerged membrane filtration. J. Membr. Sci. 2009, 330, 349–356. [Google Scholar] [CrossRef]
- Raffin, M.; Germain, E.; Judd, S.J. Influence of backwashing, flux and temperature on microfiltration for wastewater reuse. Sep. Purif. Technol. 2012, 96, 147–153. [Google Scholar] [CrossRef]
| Publisher’s Note: MDPI stays neutral with regard to jurisdictional claims in published maps and institutional affiliations. |
© 2018 by the authors. Licensee MDPI, Basel, Switzerland. This article is an open access article distributed under the terms and conditions of the Creative Commons Attribution (CC BY) license (https://creativecommons.org/licenses/by/4.0/).


