Proceeding Paper

Zero-Cost Agricultural Wastes as Sources for Activated Carbons Synthesis: Lead Ions Removal from Wastewaters †

by
George Z. Kyzas
* and
Athanasios C. Mitropoulos
Hephaestus Advanced Laboratory, Eastern Macedonia and Thrace Institute of Technology, GR-654 04 Kavala, Greece
*
Author to whom correspondence should be addressed.
Presented at the 3rd EWaS International Conference on “Insights on the Water-Energy-Food Nexus”, Lefkada Island, Greece, 27–30 June 2018.
Proceedings 2018, 2(11), 652; https://doi.org/10.3390/proceedings2110652
Published: 30 July 2018
(This article belongs to the Proceedings of EWaS3 2018)

Abstract

:
In the present study, activated carbons (PAC) were hydrothermally prepared with an environmental friendly preparation route after pyrolysis from biomass (specifically from agricultural (potato) peels). The prepared biochars were activated with potassium hydroxide (chemical activities). The preparation route had a strong impact on the pore structure of PAC. In addition, surface chemistry was also affected by the preparation and activation process. The adsorbent materials were also characterized by Scanning Electron Microscopy. The prepared activated carbons were used as adsorbents for the removal of lead ions. Batch experiments were performed to investigate the effect of physico-chemical parameters, such as pH, contact time, initial metal concentration and temperature. Equilibrium data were analyzed using Langmuir and Freundlich isotherm models. The thermodynamic parameters such as the change of enthalpy (ΔH0), entropy (ΔS0) and Gibb’s free energy (ΔG0) of adsorption systems were also determined and evaluated.

1. Introduction

Recently, many researchers worldwide turned their interest to the preparation of low-cost adsorbent materials for decontamination/desalination purposes [1,2,3,4]. It is fact that these years there is a question about which adsorbent is most efficient. The first theory proposes adsorbent materials of high adsorption capacity (i.e., >200 mg/g) but with demanding synthesis steps and high cost. The other theory suggests adsorbent materials of medium adsorption capacity (50–200 mg/g) but with simple synthesis routes and really low-cost. In the latter theory, those activated carbons can be classified [5,6].
An important (but easy for reply) question is why activated carbons are such useful in adsorption technology. The activated carbons are widely used in adsorption technology due their large surface area and different surface functional groups as carboxylic, carbonylic, phenolic, quinonic, lactonic and/or other groups which are bound to the graphite-like layers [7]. For this reason, activated carbons are extensively used as optimum adsorbent materials. Numerous types of activated carbons (especially derived from fruit peels) are produced in the last years focusing on the improvement of adsorption capacity given that the cost is kept low [8,9,10,11,12].
In the present study, based on our previous experience/knowledge in activated carbons and low-cost adsorbent materials [4,5,13,14,15,16,17,18,19,20,21], activated carbons were produced from agricultural wastes by hydrothermal treatment of potato peels. All samples were activated using KOH at 400 °C. The activated carbons produced were denotes hereafter as PAC. The samples were characterized using Scanning electron microscopy (SEM) and BET analysis. The model heavy metal ions pollutant selected for the adsorption tests was lead ions (Pb(II)).
For this purpose, mainly extensive equilibrium analysis was done by fitting the equilibrium data to Langmuir and Freundlich equations. The equilibrium data were repeated similarly at 4 different temperatures (20, 30, 40, 50 °C) in order to result the respective thermodynamic evaluation of this system. Based on the fact that 4 different temperatures was examined in equilibrium, the respective thermodynamic analysis was done in order to export some very important parameters as enthalpy, entropy and free energy for the system.

2. Materials and Methods

2.1. Materials

For the preparation of activated carbons, H3PO4 and NiCl2∙6H2O were obtained from Sigma-Aldrich (St. Louis, MO, USA). The potato peels used were obtained as residues/wastes after domestic (home) use.

2.2. Preparation of Activated Carbons by Hydrothermal Treatment

Potato peels after being washed with distilled water to remove dust and other inorganic impurities, were dried overnight at 100 °C to reduce the moisture content. The dry material was grounded and sieved to be of uniform particle size (+0.45–0.15 mm). The final material was designated as “PP”. For the hydrothermally prepared activated carbon, hydrochars were firstly prepared by hydrothermal treatment. A weighted amount of the dry potato peels precursor (20 g) was dispersed in 100 mL of water. The hydrocarbonization process (HTC) of the precursor material was carried out in a 1-L Parr stirred pressure reactor (Parr Instrument Company, Moline, IL, USA). The mixture was sealed into a Teflon vessel inserted in the autoclave, which was subjected to 200 °C at a heating rate of 4 °C min (pressure at 200 °C of around 580 psi) with an agitation speed of 150 rpm. It was maintained at this temperature for 4 h and after this period of time the autoclave was cooled down to room temperature. The reaction mixture, was consisting of a liquid solution and a solid phase (hydrochar); the hydrochar was collected in a glass beaker for separation, was washed thoroughly with hot distilled water followed by ethanol washing and was dried at 100 °C overnight. The solid yield was determined by weight. Chemical activation of the hydrochar was performed using KOH. The impregnation ratio was calculated as the ratio of the weight of KOH in solution to the weight of the used hydrochars (the weight ratio of KOH/precursor is 1:0.9). The appropriate volume of KOH were dissolved in 250 mL of distilled water and then 20 g of the hydrochar were mixed with the KOH solution and stirred overnight in order a complete reaction between hydrochar and H3PO4 to be achieved. The mixture was filtered and the remaining solid was dried at 100 °C for about 24 h. It was placed then in a furnace and heated to 400 °C for 2 h at a heating rate of 25 °C/min under nitrogen flow (500 mL/min). The activated carbons formed were then treated with Soxhlet washing, freeze-drying, grounding and sieving. The yield of activated carbons was defined as the ratio of the sample weight after carbonization to the weight of the initial hydrochar.

2.3. Characterization Techniques

The surface area was determined by the the BET analysis software. Surface morphologies were studied by scanning electron microscopy (SEM), performed using JEOL-JSM-6060LV Scanning Electron Microscope.

2.4. Adsorption Experiments

All adsorption experiments were carried out in 3 repetitions and the average of the values was presented as experimental point in charts. At first, the effect of the pH was determined in batch mode using fixed conditions. 0.02 g of materials (m) were added to 20 mL of adsorbate solution (V) consisted of 100 mg/L initial ion concentrations (C0). The pH of the solution was fixed to 2, 3, 4, 5, and 6 for each flask by micro-additions of HNO3 (0.01 mol/L) or NaOH (0.01 mol/L). The agitation rate (N) was 150 rpm using thermostatted shaking water bath (model Julabo SW-21C, Seelbach, Germany) under controlled temperature (T = 20 °C). The agitation was lasted 24 h (t). pH-effect experiments were not carried out at pH > 6, in order to avoid precipitation phenomena of Pb(II). In this pH-zone, the metal ions get out of the solution due to formation of colloidal precipitate of Ni(OH)2 and not due to the adsorption of free Pb(II) ions [22]. In general the uptake of those metals at pH > 6 is attributed to the formation of metal hydroxide species such as soluble Pb(OH)+ and/or insoluble precipitate of Pb(OH)2. Then, after finding the optimum pH (6), the effect of the initial ion concentration was also investigated (m = 0.02 g, V = 20 mL, T = 20 °C, N = 150 rpm, pH = 6, t = 24 h). The initial ion concertation was ranged from 10 to 1000 mg/L. The effect of temperature in equilibrium was investigated by carrying out the same equilibrium experiments (as those of the previous paragraph), not only at 20 °C but also at 30, 40, and 50 °C (m = 0.02 g, V = 20 mL, T = 20–50 °C, N = 150 rpm, pH = 6, t = 24 h min, C0 = 10–1000 mg/L). After adsorption, the Pb(II) ions were quantitatively analyzed by atomic absorption spectrometer (model Perkin-Elmer Analyst 400, Dresden, Germany) composed of FIAS 100 Flow Injection System. The removal percentage of ions after adsorption was calculated as:
R ( % ) = ( C 0 C e C 0 ) × 100 %
The equilibrium amount in the solid phase (Qe, mg/g) was calculated according to the following equation:
Q e = ( C 0 C e ) ( V m )

Equations (Isotherm, Kinetic, Thermodynamic)

The experimental equilibrium data were fitted to the Langmuir (Equation (3)) [23], Freundlich (Equation (4)) [24], and Langmuir-Freundlich (L-F) (Equation (5)) [24] isotherm equations expressed by the following equations:
Q e = Q m a x K L C e 1 + K L C e
Q e = K F C e 1 / n
Q e = Q m a x K L F C e 1 / b 1 + K L F C e 1 / b
where Qmax (mg/g) is the maximum amount of adsorption; KL (L/mg) is the Langmuir adsorption equilibrium constant; KF (mg1−1/n L1/n g) is the Freundlich constant representing the adsorption capacity; n (dimensionless) is the constant depicting the adsorption intensity; KLF (L/mg)1/b is the L-F constant; b (dimensionless) is the L-F heterogeneity constant.
For the thermodynamic evaluation, three main parameters have been calculated (the change of Gibbs free energy (ΔG0, kJ/mol), enthalpy (ΔH0, kJ/mol) and entropy (ΔS0, kJ/mol K)) based on the isotherms resulted at 20, 30, 40, and 50 °C. The system of equations below can be used for the calculation of the aforementioned thermodynamic parameters (where Cs (mg/L) is the amount adsorbed on a solid at equilibrium and R (8.314 J mol−1 K−1) is the universal gas constant) [25]:
K c = C s C e
Δ G 0 = RTln ( K c )
Δ G 0 = Δ H 0 T Δ S 0
ln ( K c ) = ( Δ H 0 R ) 1 T + Δ S 0 R
ΔG0 was given from Equation (7), while ΔH0 and ΔS0 were given from the slop and intercept of the chart between ln(Kc) versus 1/T (Equation (9)).

3. Results and Discussion

In this section, the brief characterization was discussed as well as the adsorption evaluation of the Pb(II) removal. Extensive analysis is done about the equilibrium fitting. Also, the thermodynamic evaluation gives important data about the entropy and enthalpy of the system (based on isotherms of 4 different temperatures).

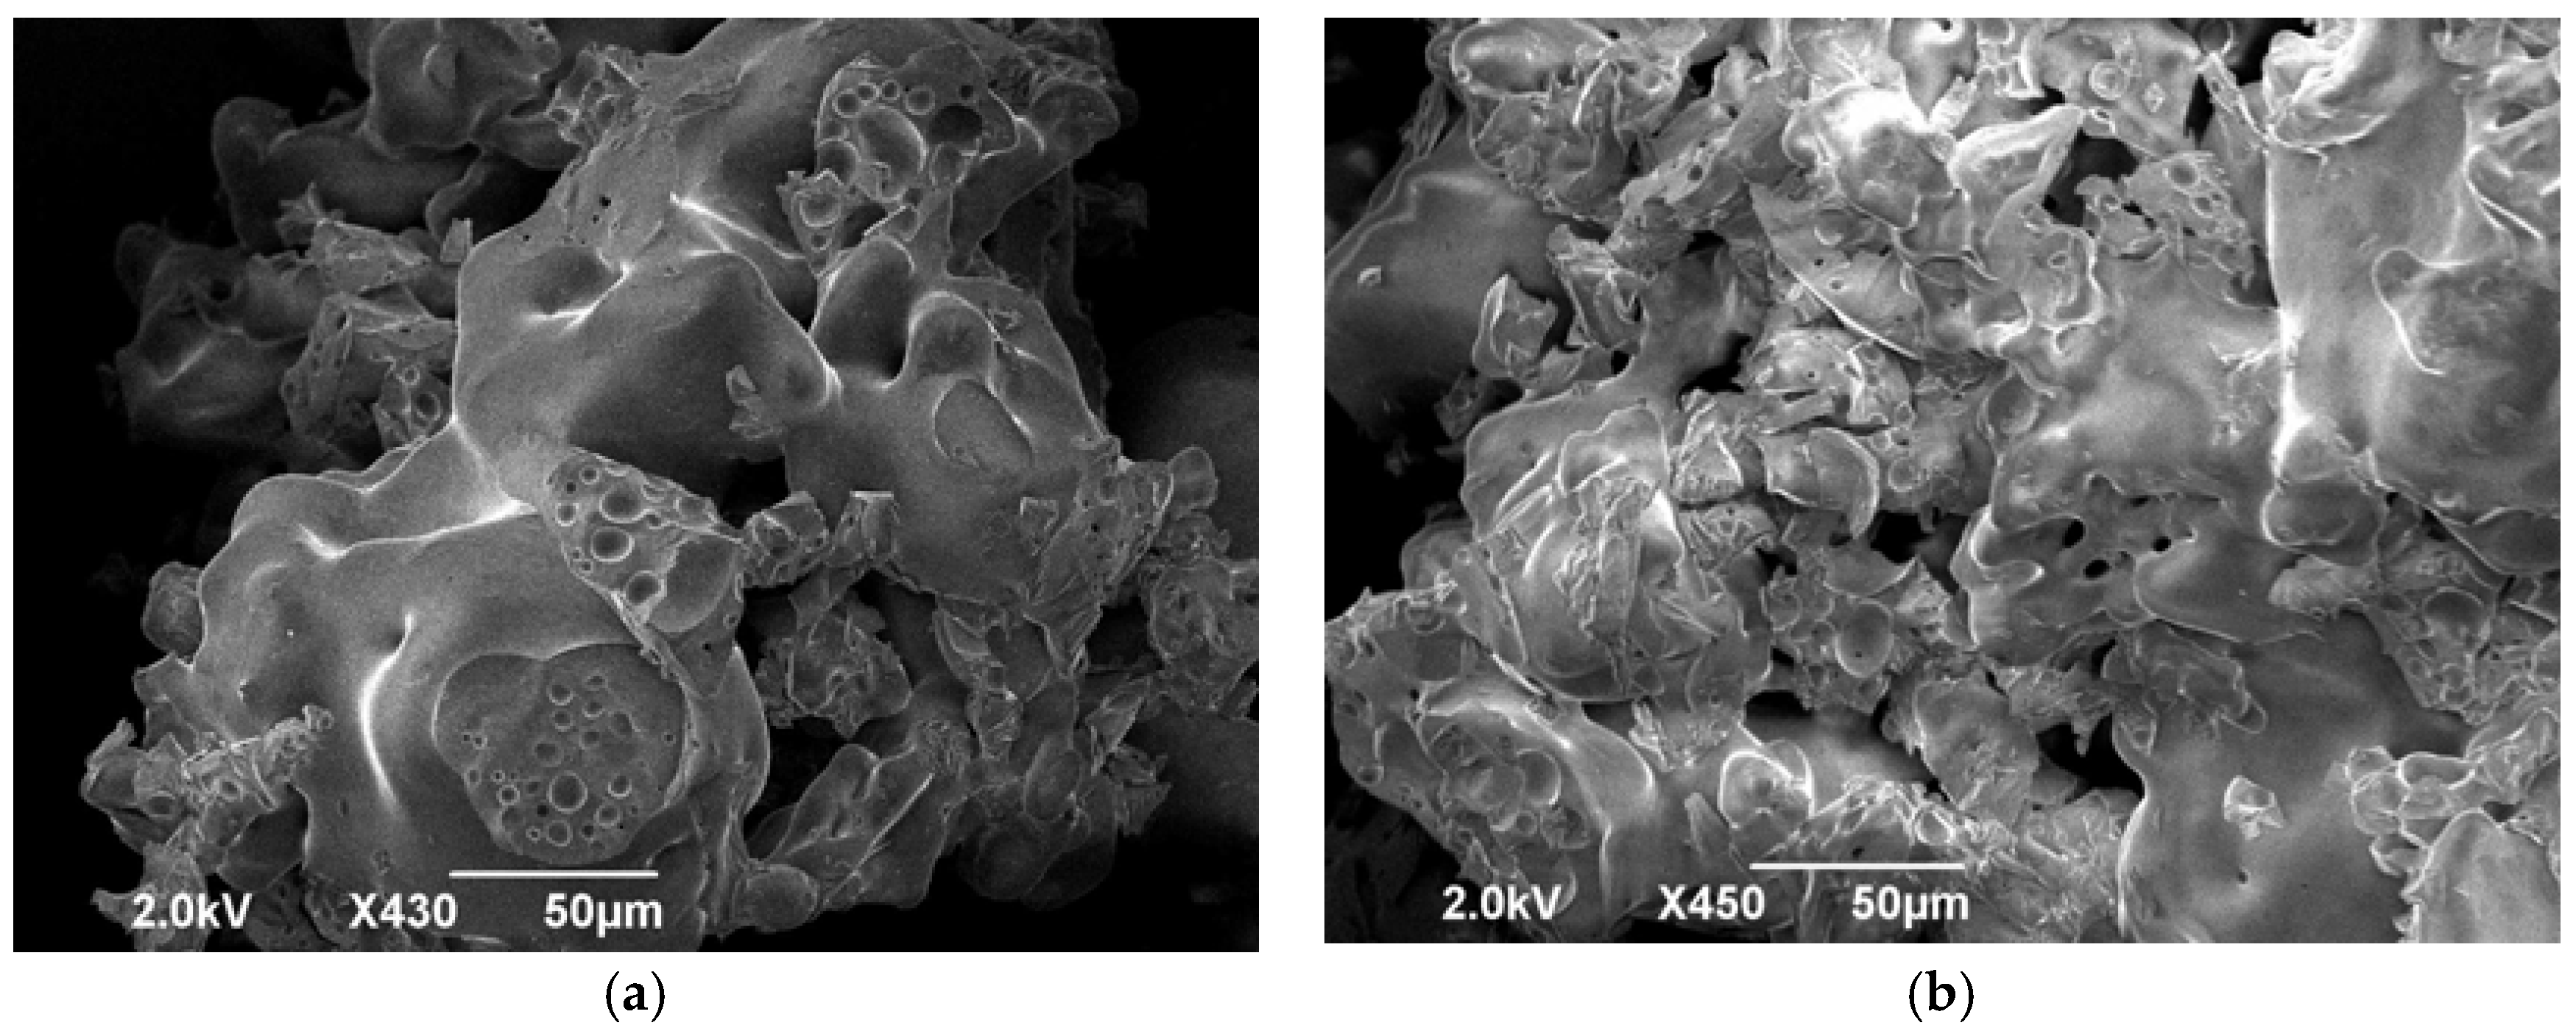
3.1. Characterizations

The morphology of the prepared materials was examined by observing the respective SEM images of them (Figure 1). Many microparticles can be seen on carbons prepared. Some samples have clear holes on the surface or some of them have smooth surface. The latter can be probably due to the synthesis procedure followed [20].
The activated carbons were also measured regarding their Specific Surface. The value found was 625 m2/g which can be considered as satisfactory surface area given the zero-cost first source (potato peels) and the relatively mild activation procedure.

3.2. Adsorption Evaluation
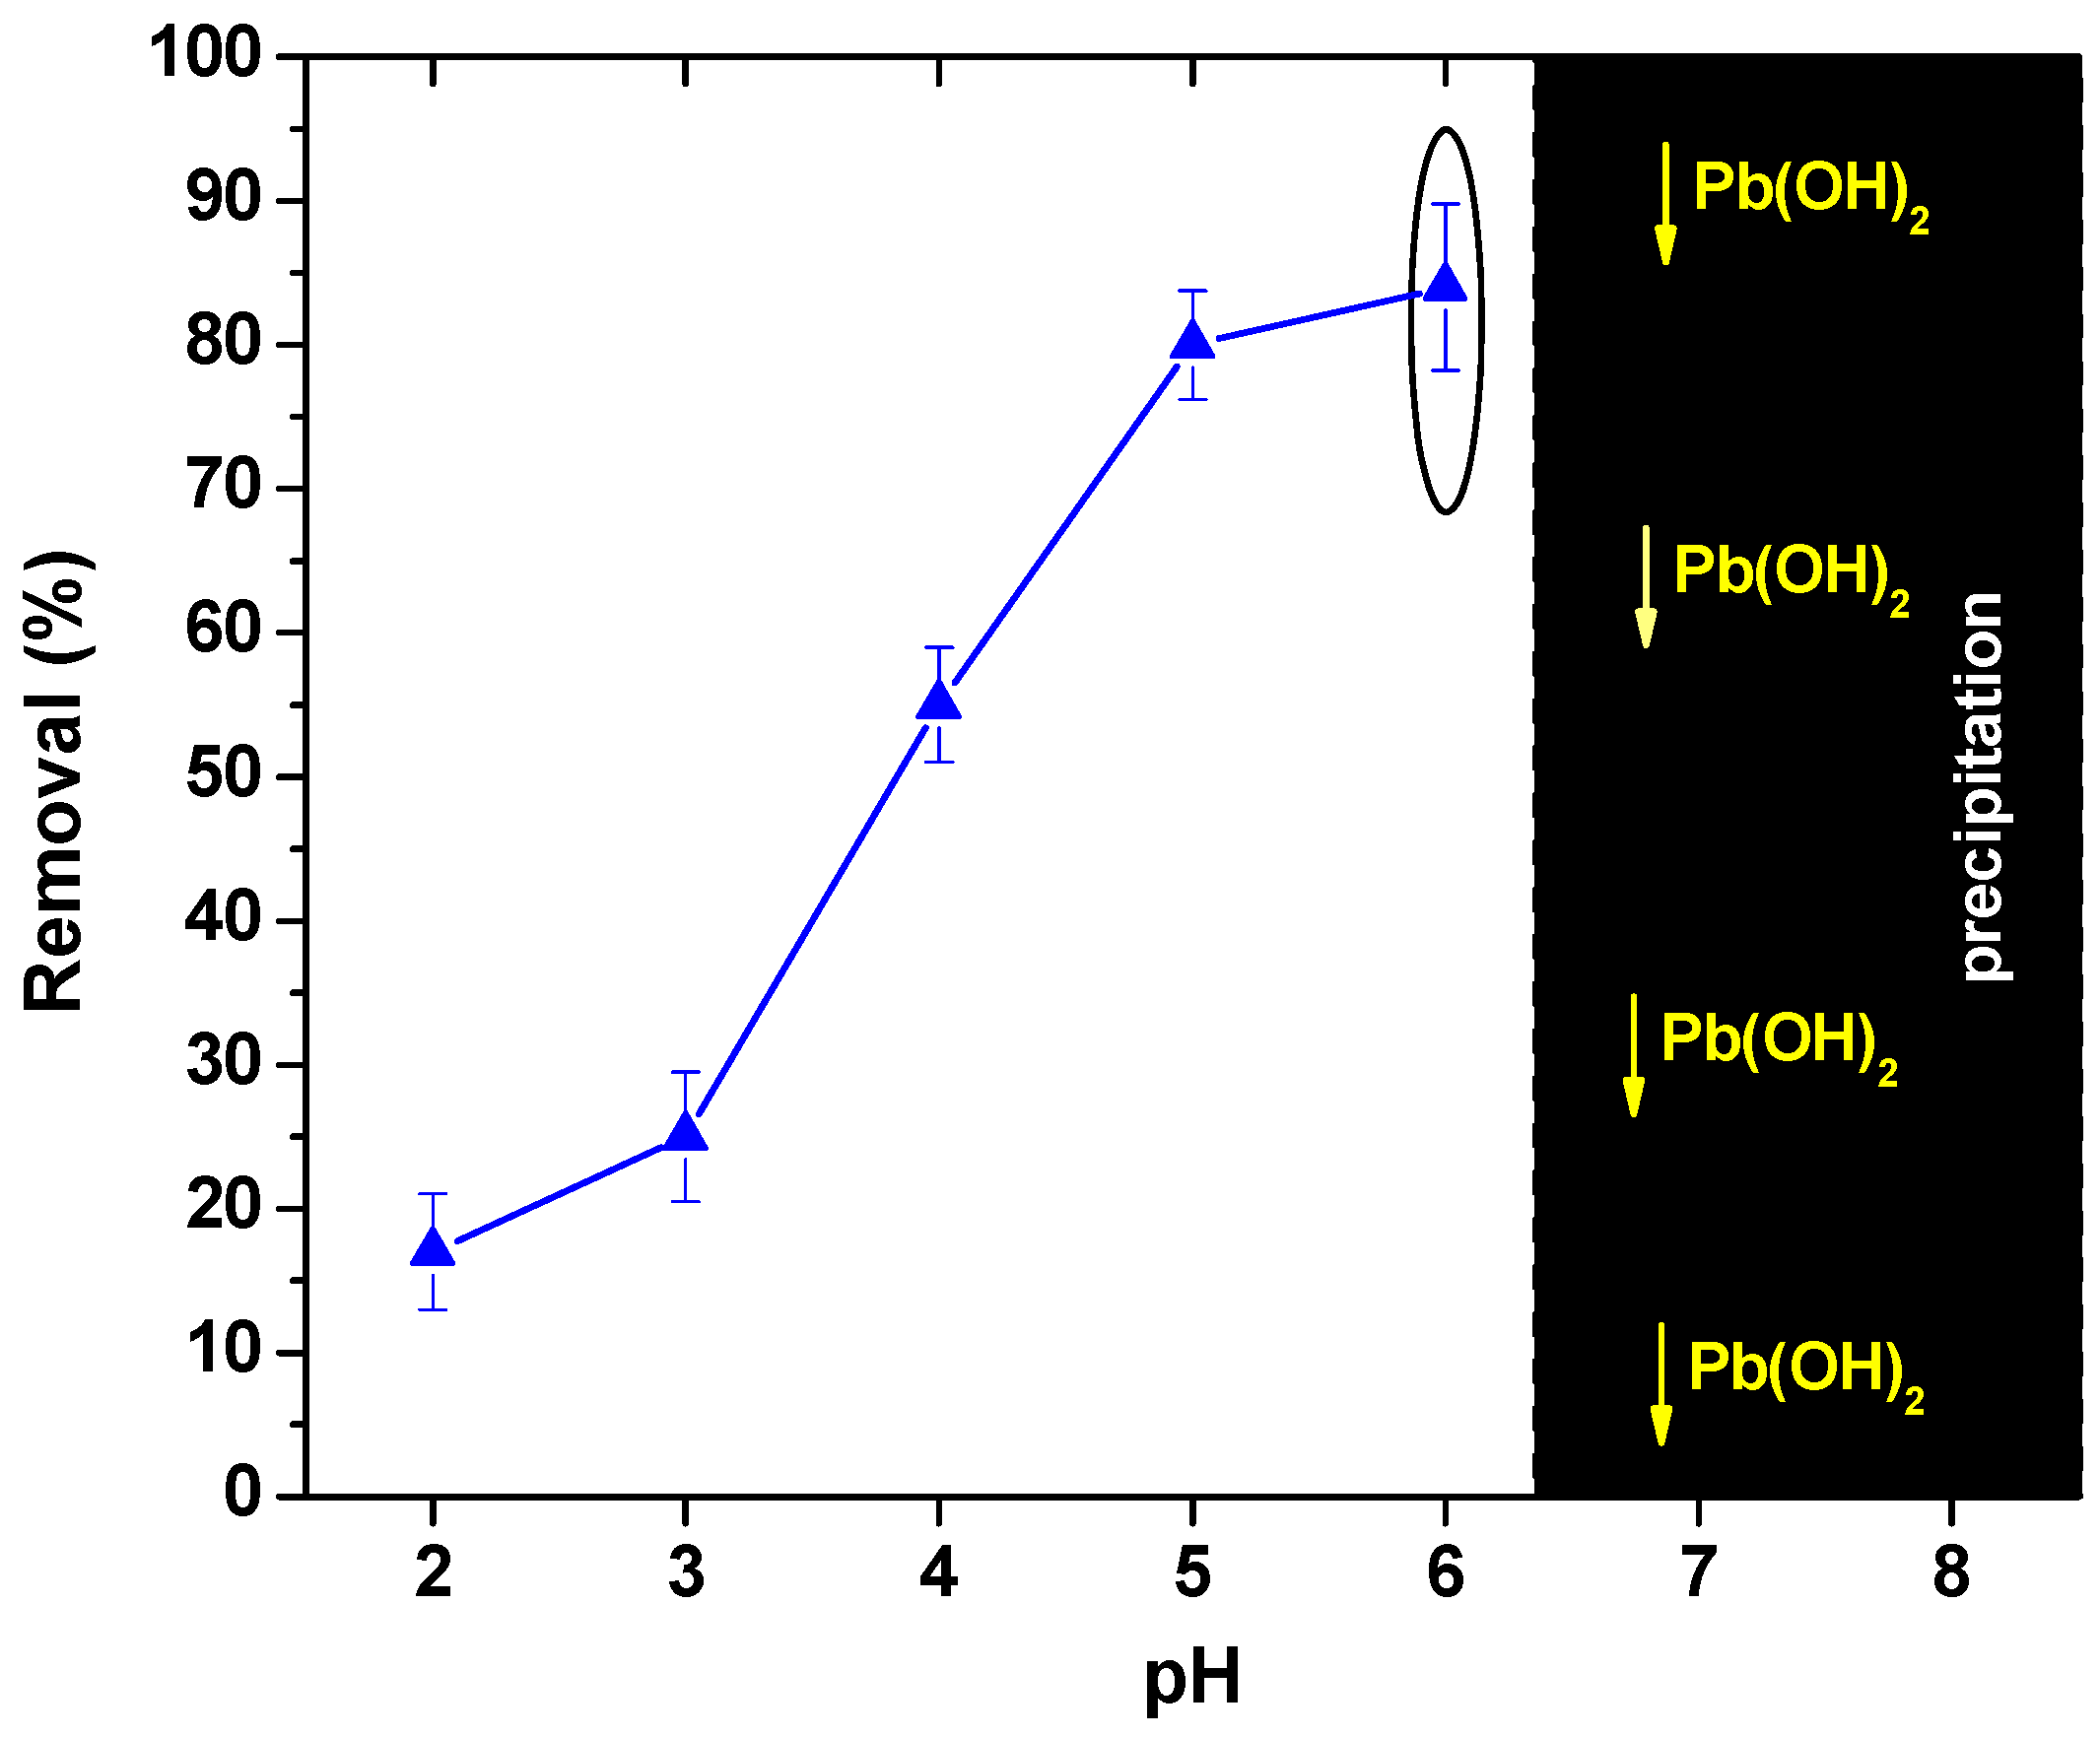
3.2.1. Effect of pH

One of the most important factors which can influence the whole adsorption behavior of materials is the pH of the solution (adsorbate). So, the fisrt factor studied in this work was the effect of pH on Pb(II) removal. Figure 2 presents the adsorption behavior of the material in 5 experimental pH values (2–6).
At acidic conditions the removal of ions is lower than going to higher pH values. In particular, at pH = 2, the adsorption of Pb(II) seems very low (15%). With the increase of pH values to 3, the adsorption/removal showed gradual/mild improvement (25%). The most interseting is the sharp increase at pH > 3. So, at pH = 4 the removal wase further improved presenting the pH-curves big slopes (55%). Similar behaviour at pH = 5 slopes (80%). At the final studied pH-value (6), the trend of increase was midler (84%). In general similar pH-behavior was found in other published work regarding some heavy metals removal [20,26,27], meaning low uptake at acidic and higher at neutral-alkaline conditions. As it was mentioned previously, the effect of pH was studied until pH = 6, due to some possible precipitation phenomena which may be governed the whole removal process at pH > 7.

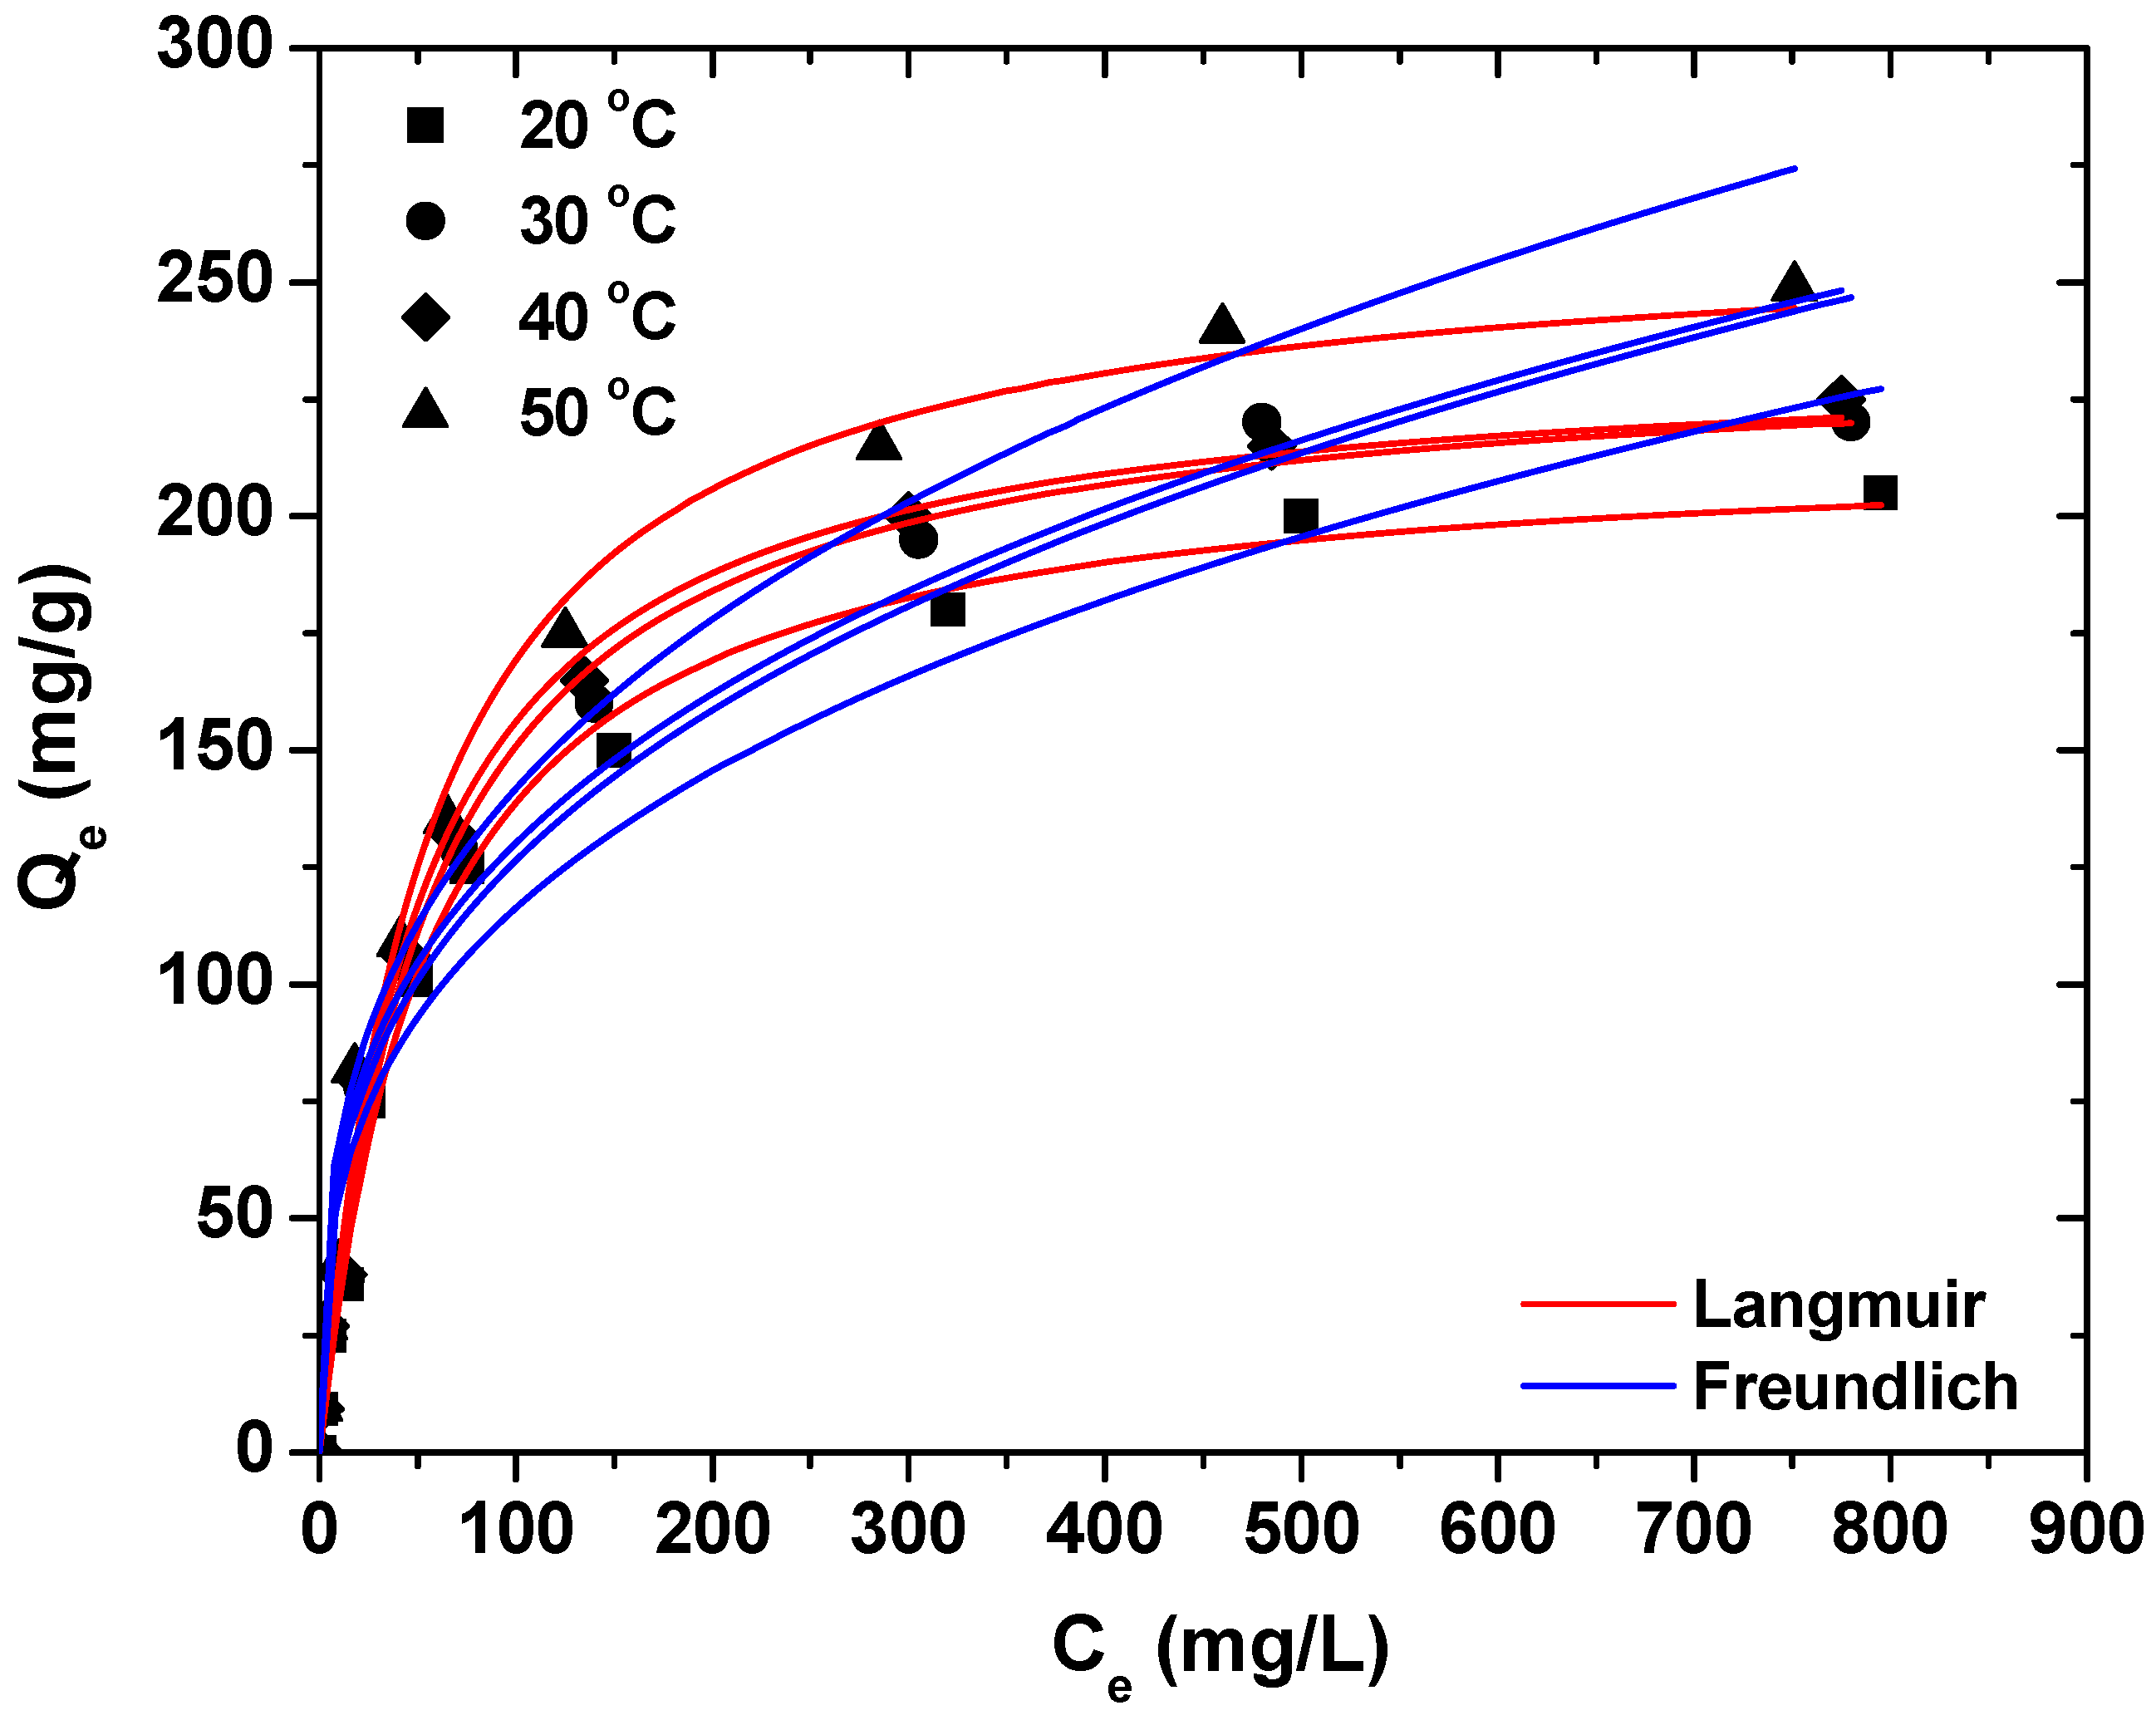
3.2.2. Effect of Initial Pb(II) Concentration and Temperature

In order to investigate the effect of initial lead ions concentration, isotherm curves was presented. According to Figure 3, the increase of initial concentration of metal caused the increase of the adsorbed amount onto solid adsorbent. The range used for the initial Pb(II) concentration was 10–1000 mg/L. For low C0 almost the whole amount was adsorbed onto material. But, using higher concentrations (C0 > 300 mg/L), the non-adsorbed amount of ions increased. This is normal due to the material’s saturation. Table 1 shows all equilibrium data.
To find the maximum theoretical adsorption capacity (Qmax), the equilibrium data were fitted to three isotherm models; Lanmguir and Freundlich. Table 1 presents the equilibrium fitting results after running the aforemenetioned models. In general, the best fitting was achieved using Langmuir-equation (R2 = 0.991–0.994), while Freundlich did not present good fitting results (R2 = 0.951–0.964). The latter can be even visuallu checked by observing the curves in Figure 3.
A very interesting finding of the equilibrium data was the behavior of the hydrothermal and carbons regarding the increase of temperature (Figure 3). The increase of temperature drastically improved (21%) the Qmax from 217 (20 °C) to 262 (50 °C). It is also notworthy that the middle temperatures (30 and 40 °C) did not present significant changes (235 ad 236 mg/g).
In adsorption technology, it is widely known that it cannot be compared two adsorbent materials (even for the same pollutant) without keeping the same experimental conditions. Some of the basic parameters which strongly influence the whole procedure are (i) the pH solution; (ii) contact time; (iii) initial pollutant’s concentration; (iv) temperature; (v) agitation speed; (vi) volume of adsorbate, (viii) ionic strength of solution, (ix) adsorbent’s dosage, etc. It is clear that if any of the aforementioned conditions varies, the experiment will not be the same and consequently none comparison will be correct. Having the above in the mind, the only comparison can be realized for adsorbent/adsorbate systems of the same study.

3.2.3. Thermodynamics

One useful tool to evaluate thermodynamically the adsorbate-adsorbent system is to calculate the change of Gibbs free energy (ΔG0, kJ/mol), change of enthalpy (ΔH0, kJ/mol) and entropy change (ΔS0, kJ/mol K). Those thermodynamic parameters at the optimum pH found (6), at fixed initial Pb(II) concentrations (10, 100, 300, 700 mg/L) and all temperatures (20, 30, 40, 50 °C) were presented in Table 2.
ΔG0 values were negative (for C0 = 10, 100, 300 mg/L) suggesting the spontaneous adsorption of ions onto carbons. At this point, we have to take into account, that being in nature, the target is to keep or obtain the lowest energy state. So, to occur adsorption process and majorly spontaneous, the energy must be less than the initial state at the end of the process. This is the explanation why the ΔG0 values were found to be negative. Another interesting finding is that the negatives values of ΔG0 decreased with an increase of temperatures (from 20 to 30, and then to 40 and 50 °C). The latter may indicate the favorability of the adsorption at higher temperatures.
In the case of enthaly, the positive values of ΔH0 suggest the endothermicity of the process. These values were drastically diminished with the increase of C0 (Table 2). The adsorbate ion species had to displace more than one water molecule for their adsorption and this resulted in the endothermicity of the adsorption process. So, the change of enthalpy must be positive. Another possible indication (not so crucial) about the adsorption type is the magnitude of ΔH0.
In the case of entropy, all values of ΔS0 were positive. This is corresponded to the adsorbent’s affinity with the adsorbate ion species. Also, when ΔS0 > 0 an increased randomness happened at the solid/solution interface. It is necessary to keep in mind that the water molecules, which were diffused into the porous network of the carbons (those which were displaced by the adsorbate lead ions), obtained big quantites of transitional entropy and in this way they allow the randomness in the system. The last point for ΔS0 > 0 is the increase in freedom degree of the bound/adsorbed ions [28].
At this point it is mandatory to say some few words about the reuse potential of actiavted carbons. In general, the exothermic nature of the adsorption is used in the heat treatment process and leads to desorption, partial cracking and polymerization of the organics adsorbed. The removal of charred organic residue formed in the porous structures is conducted in the final stage. The porous carbon structure regenerating its original surface characteristics will be revealed in this manner. The adsorption columns can be reused after treatment. Generally, the adsorptive capacity is reduced after the burning of the pre-adsorption thermal regeneration cycle between 5–15 wt% of the carbon bed [29]. High temperatures are required in the process of thermal regeneration, which means that the energies involved in this process are high. This process is hence energetically and commercially expensive [30]. Before it is feasible to have regeneration facilities on site, a certain size has to be attained for the plants based on thermal regeneration of activated carbon. Smaller waste treatment sites normally transport their activated carbon cores to specialized facilities for regeneration. This increases the footprint of the carbon [31].

3.3. Cost-Effectiveness of Agricultural-Based Activated Carbons

To better understand the value of the activated carbon from agricultural wastes (not especially from potato), a scenario with many hypotheses is set-up. The basic parameters hypothetically are the same apart from the maximum theoretical adsorption capacity (Qmax) and the estimated cost for the adsorbent production. In that case, 5, and 3.3 kg of AC and ACM required for decontamination. If the cost production for an agricultural waste is zero, then the production of AC is expected to be at least 4 times larger (electricity for pyrolysis etc.), while the respective for ACM 6 times larger (pyrolysis, chemical modification etc.). It is clear that the order of profitability using the above adsorbents will be AC > ACM.
In order to make a more realistic scenario, for an average industry which treats and discharges 1 MGD (megagallons per day) as effluents (containing either dyes or metals), the approximate quantity of adsorbents can be calculated. In the case of textile industries, dye concentrations of 0.01–0.25 g/dm3 (=10–250 g of dye per m3 of effluent) have been cited as being present in dyehouse effluents, depending on the dyes and processes used [32]. Therefore, 37.85–946.25 kg of dye (containing into the dyeing effluent) per day must be removed/adsorbed. Having as basis the example of Table 7, 189–4731 kg of AC and 126–3154 kg of ACM are needed for the efficient treatment of effluent. The same example for an average metal plating (chromium) with 2 MGD as effluent rate can be calculated mentioning that chromium concentrations of 0.5–270,000 g per m3 of effluent have been cited [33].

4. Conclusions

This paper investigates the synthesis of activated carbons with hydrothermal treatment using potato peels as source. The activation was done with KOH at 400 °C. The pH-effect experiments confirmed lower ion removal at acidic conditions, while going to higher pH values the removal increased (pH optimum was 6). The increase of temperature drastically improved (21%) the Qmax of PAC from 217 (20 °C) to 262 (50 °C). From SEM images, many microparticles can be seen and some of them have clear holes on the surface.

Author Contributions

A.C. Mitropoulos contributed to the writing of the paper; G.Z. Kyzas conceived, designed the adsorption experiments and contributed to the writing of the paper having also the super-vision of the whole paper.

Funding

Grant No. GRA-14199.

Acknowledgments

The project “Multifunctional super-adsorbent materials for efficient decontamination of oil spills and heavy metal effluents” supported by Stavros Niarchos Foundation is acknowledged for the funding of this work.

Conflicts of Interest

The authors declare no conflict of interest.

References

  1. Chan, W.H.; Mazlee, M.N.; Ahmad, Z.A.; Ishak, M.A.M.; Shamsul, J.B. The development of low cost adsorbents from clay and waste materials: A review. J. Mater. Cycle Waste Manag. 2017, 19, 1–14. [Google Scholar] [CrossRef]
  2. Habineza, A.; Zhai, J.; Ntakirutimana, T.; Qiu, F.P.; Li, X.; Wang, Q. Heavy metal removal from wastewaters by agricultural waste low-cost adsorbents: Hindrances of adsorption technology to the large scale industrial application—A review. Desalin. Water Treat. 2017, 78, 192–214. [Google Scholar] [CrossRef]
  3. Inyang, M.I.; Gao, B.; Yao, Y.; Xue, Y.; Zimmerman, A.; Mosa, A.; Pullammanappallil, P.; Ok, Y.S.; Cao, X. A review of biochar as a low-cost adsorbent for aqueous heavy metal removal. Crit. Rev. Environ. Sci. Technol. 2016, 46, 406–433. [Google Scholar] [CrossRef]
  4. Anastopoulos, I.; Kyzas, G.Z. Agricultural peels for dye adsorption: A review of recent literature. J. Mol. Liq. 2014, 200, 381–389. [Google Scholar] [CrossRef]
  5. Kyzas, G.Z. Green Adsorbents; Bentham Science Publishers: Sharjah, United Arab Emirates, 2015. [Google Scholar]
  6. Kyzas, G.Z. Coffee wastes as adsorbents. In Agricultural Wastes: Characteristics, Types and Management; Foster, C.N., Ed.; NOC: New York, NY, USA, 2015; pp. 215–229. [Google Scholar]
  7. Jiang, Z.; Zhu, C.; Wan, W.; Qian, K.; Xie, J. Constructing graphite-like carbon nitride modified hierarchical yolk-shell tio2 spheres for water pollution treatment and hydrogen production. J. Mater. Chem. A 2016, 4, 1806–1818. [Google Scholar] [CrossRef]
  8. Aldawsari, A.; Khan, M.A.; Hameed, B.H.; AlOthman, Z.A.; Siddiqui, M.R.; Ahmed, A.Y.B.H.; Alsohaimi, I.H. Development of activated carbon from phoenix dactylifera fruit pits: Process optimization, characterization, and methylene blue adsorption. Desalin. Water Treat. 2017, 62, 273–281. [Google Scholar] [CrossRef]
  9. Gottipati, R.; Mishra, S. Preparation of microporous activated carbon from aegle marmelos fruit shell and its application in removal of chromium(VI) from aqueous phase. J. Ind. Eng. Chem. 2016, 36, 355–363. [Google Scholar] [CrossRef]
  10. Hashem, F.S.; Amin, M.S. Adsorption of methylene blue by activated carbon derived from various fruit peels. Desalin. Water Treat. 2016, 57, 22573–22584. [Google Scholar] [CrossRef]
  11. Islam, M.A.; Sabar, S.; Benhouria, A.; Khanday, W.A.; Asif, M.; Hameed, B.H. Nanoporous activated carbon prepared from karanj (Pongamia pinnata) fruit hulls for methylene blue adsorption. J. Taiwan Inst. Chem. Eng. 2017, 74, 96–104. [Google Scholar] [CrossRef]
  12. Md Arshad, S.H.; Ngadi, N.; Aziz, A.A.; Amin, N.S.; Jusoh, M.; Wong, S. Preparation of activated carbon from empty fruit bunch for hydrogen storage. J. Energy Storage 2016, 8, 257–261. [Google Scholar] [CrossRef]
  13. Anastopoulos, I.; Kyzas, G.Z. Progress in batch biosorption of heavy metals onto algae. J. Mol. Liq. 2015, 209, 77–86. [Google Scholar] [CrossRef]
  14. Anastopoulos, I.; Kyzas, G.Z. Composts as biosorbents for decontamination of various pollutants: A review. Water Air Soil Pollut. 2015, 226, 61. [Google Scholar] [CrossRef]
  15. Deliyanni, E.A.; Kyzas, G.Z.; Triantafyllidis, K.S.; Matis, K.A. Activated carbons for the removal of heavy metal ions: A systematic review of recent literature focused on lead and arsenic ions. Open Chem. 2015, 13, 699–708. [Google Scholar] [CrossRef]
  16. Kyzas, G.Z. A decolorization technique with spent “greek coffee” grounds as zero-cost adsorbents for industrial textile wastewaters. Materials 2012, 5, 2069–2087. [Google Scholar] [CrossRef]
  17. Kyzas, G.Z. Commercial coffee wastes as materials for adsorption of heavy metals from aqueous solutions. Materials 2012, 5, 1826–1840. [Google Scholar] [CrossRef]
  18. Kyzas, G.Z.; Deliyanni, E.A. Modified activated carbons from potato peels as green environmental-friendly adsorbents for the treatment of pharmaceutical effluents. Chem. Eng. Res. Des. 2015, 97, 135–144. [Google Scholar] [CrossRef]
  19. Kyzas, G.Z.; Deliyanni, E.A.; Lazaridis, N.K. Magnetic modification of microporous carbon for dye adsorption. J. Colloid Interface Sci. 2014, 430, 166–173. [Google Scholar] [CrossRef]
  20. Kyzas, G.Z.; Deliyanni, E.A.; Matis, K.A. Activated carbons produced by pyrolysis of waste potato peels: Cobaltions removal by adsorption. Colloid Surf. A 2016, 490, 74–83. [Google Scholar] [CrossRef]
  21. Anastopoulos, I.; Karamesouti, M.; Mitropoulos, A.C.; Kyzas, G.Z. A review for coffee adsorbents. J. Mol. Liq. 2017, 229, 555–565. [Google Scholar] [CrossRef]
  22. Donia, A.M.; Atia, A.A.; Elwakeel, K.Z. Selective separation of mercury(II) using magnetic chitosan resin modified with schiff’s base derived from thiourea and glutaraldehyde. J. Hazard. Mater. 2008, 151, 372–379. [Google Scholar] [CrossRef]
  23. Langmuir, I. The adsorption of gases on plane surfaces of glass, mica and platinum. J. Am. Chem. Soc. 1918, 40, 1361–1403. [Google Scholar] [CrossRef]
  24. Freundlich, H. Over the adsorption in solution. Z. Phys. Chem. 1906, 57, 385–470. [Google Scholar]
  25. Smith, J.M.; Van Ness, H.C. Introduction to Chemical Engineering Thermodynamics, 4th ed.; McGraw-Hill: New York, NY, USA, 1987. [Google Scholar]
  26. Mohan, D.; Pittman, C.U.; Steele, P.H. Single, binary and multi-component adsorption of copper and cadmium from aqueous solutions on kraft lignin—A biosorbent. J. Colloid Interface Sci. 2006, 297, 489–504. [Google Scholar] [CrossRef] [PubMed]
  27. Upendra, U.; Manas, M. Sorption of cadmium from aqueous solution using pretreated rice husk. Bioresour. Technol. 2006, 97, 104–109. [Google Scholar]
  28. Kyzas, G.Z.; Kostoglou, M.; Lazaridis, N.K. Copper and chromium(VI) removal by chitosan derivatives-equilibrium and kinetic studies. Chem. Eng. J. 2009, 152, 440–448. [Google Scholar] [CrossRef]
  29. San Miguel, G.; Lambert, S.D.; Graham, N.J.D. The regeneration of field-spent granular-activated carbons. Water Res. 2001, 35, 2740–2748. [Google Scholar] [CrossRef]
  30. Sabio, E.; González, E.; González, J.F.; González-Garcı́a, C.M.; Ramiro, A.; Gañan, J. Thermal regeneration of activated carbon saturated with p-nitrophenol. Carbon 2004, 42, 2285–2293. [Google Scholar] [CrossRef]
  31. Álvarez, P.M.; Beltrán, F.J.; Gómez-Serrano, V.; Jaramillo, J.; Rodrı́guez, E.M. Comparison between thermal and ozone regenerations of spent activated carbon exhausted with phenol. Water Res. 2004, 38, 2155–2165. [Google Scholar] [CrossRef]
  32. O’Neill, C.; Hawkes, F.R.; Hawkes, D.L.; Lourenco, N.D.; Pinheiro, H.M.; Delee, W. Colour in textile effluents—Sources, measurement, discharge consents and simulation: A review. J. Chem. Technol. Biotechnol. 1999, 74, 1009–1018. [Google Scholar] [CrossRef]
  33. Patterson, J.W. Industrial Wastewater Treatment Technology, 2nd ed.; Butterworth-Heinemann: Oxford, UK, 1985. [Google Scholar]
Figure 1. SEM images of the activated carbon samples prepared by hydrothermal treatment. (a) one particle; (b) second particle.
Proceedings 02 00652 g001
Figure 2. Effect of pH on Pb(II) adsorption by PAC.
Proceedings 02 00652 g002
Figure 3. Effect of initial Pb(II) concentration for PAC.
Proceedings 02 00652 g003
Table 1. Equilibrium parameters for the adsorption of Pb(II) onto PAC.
Langmuir EquationFreundlich Equation
SampleT (°C)Qmax (mg/g)KL (L/g)R2 (-)KF (mg1−1/n L1/n g−1)n (-)R2 (-)
PAC202170.017820.99426.273.090.951
302350.017780.99228.283.070.952
402360.019650.99130.533.170.954
502620.018190.99131.453.060.964
Table 2. Thermodynamic parameters for the adsorption of Pb(II) onto PAC.
SampleC0 (mg/L)T (K)Qe (mg/g)KcΔG0 (kJ/mol)ΔH0 (kJ/mol)ΔS0 (kJ/mol K)
PAC102939.3213.29−6.30+13.82+0.068
3039.4115.67−6.93
3139.4415.67−7.16
3239.6524.00−8.54
10029375.013.00−2.68+10.79+0.046
30378.233.55−3.19
31380.124.00−3.61
32382.344.56−4.07
300293150.151.000.00+8.46+0.029
303161.171.14−0.34
313165.091.22−0.52
323175.811.40−0.90
700293200.340.402.23+5.99+0.013
303221.310.461.97
313215.620.442.12
323240.240.521.75
Publisher’s Note: MDPI stays neutral with regard to jurisdictional claims in published maps and institutional affiliations.

