Proceeding Paper

Mixing of Particles in Micromixers under Different Angles and Velocities of the Incoming Water †

by
Evangelos Karvelas
1,*,
Christos Liosis
2,
Theodoros Karakasidis
1 and
Ioannis Sarris
2
1
Laboratory of Hydromechanics and Environmental Engineering, Department of Civil Engineering, University of Thessaly, 38334 Volos, Greece
2
Department of Mechanical Engineering, University of West Attica, 12243 Athens, Greece
*
Author to whom correspondence should be addressed.
Presented at the 3rd EWaS International Conference on “Insights on the Water-Energy-Food Nexus”, Lefkada Island, Greece, 27–30 June 2018.
Proceedings 2018, 2(11), 577; https://doi.org/10.3390/proceedings2110577
Published: 30 July 2018
(This article belongs to the Proceedings of EWaS3 2018)

Abstract

:
A possible solution for water purification from heavy metals is to capture them by using nanoparticles in microfluidic ducts. In this technique, heavy metal capture is achieved by effectively mixing two streams, a nanoparticle solution and the contaminated water. In the present work, particles and water mixing is numerically studied for various inlet velocity ratios and inflow angles of the two streams. The Navier-Stokes equations are solved for the water flow while the discrete motion of particles is evaluated by a Lagrangian method. Results showed that as the velocity ratio between the inlet streams increases, by increasing the particles solution flow, the mixing of particles with the contaminated water is increased. Thus, nanoparticles are more uniformly distributed in the duct. On the other hand, angle increase between the inflow streams ducts is found to be less significant.

1. Introduction

Water quality problems are a persistent global issue since population growth, urbanization and industrialization, have continually stressed hydrological resources [1]. Heavy metals released into the environment from plating plants, mining and alloy manufacturing pose a significant threat to the environment and public health. Heavy metals have the ability to accumulate in the environment but the major concerns are that is not biodegradable and cannot be metabolized or decomposed.
Exposure to heavy metal mixtures is a common and important parameter of toxicity in human and environmental health issues. The effects of heavy metals on health may be loss of memory, allergic reactions, high pressure, depression, irritability, aggressive behavior, insomnia, dyslexia, increased cholesterol, triglycerides, neuropathy and autoimmune diseases just to mention few ones [2]. Therefore, reliable methods are needed to remove heavy metals in environmental and biological samples [3,4,5,6]. Furthermore, current water and wastewater treatment technologies and infrastructures are reaching their limit for providing adequate water quality to meet human and environmental needs [7].
Advances in nanotechnology offer great opportunities in the treatment of water [8]. The combination of nanotechnology and microfluidics may offer an effective water and wastewater treatment. Furthermore, this combination can provide new treatment capabilities that could allow economic utilization of unconventional water sources to expand the water supply [9].
In this study, a contaminated by heavy metals water stream and a particle solution stream are inserted in a microfluidic duct under different inlet velocity ratios and angles. A series of numerical simulations is performed for the study of this inlet effect on the particle distribution in the duct. In Section 2, the numerical methodology for the water flow, the particles’ motion and simulation details are described. Results and discussions of the particles mixing are presented in Section 3 with emphasis to the influence of different inlet angles and velocity ratios. Finally, the most important conclusions of the current study are summarized in Section 4.

2. Materials and Methods

The slow water flow in the 3D duct of the microfluid device that is shown in Figure 1 with a square cross-section is expected to be laminar and steady-state. The length of the micromixer is L = 5 × 10⁻⁴ m while the height and the width is equal to W = H = 1 × 10⁻⁴ m. The two streams, the contaminated water and the particulate one, are entering the micromixer from two different inlet ducts, mixed in the duct and leave the domain from the common outlet. Three different inlet angles θ (i.e., 30 ° , 45°, 60°) are studied. The incompressible Navier–Stokes equations are solved in the Eulerian frame, for the pressure p and the velocity u, together with a model for the discrete motion of particles in a Lagrangian frame. The laminar governing equations of the fluid phase are given by [10]:
× u = 0
u t + u × u = p + ν 2 u
where, t   is the time and ν   the kinematic viscosity of the water. The equations of each single particle motion in the discrete frame are based on the Newton law and may read as follows:
m i u i x = F n c , i + F t c , i + F d r a g + F g r a v        
I i ω ι t = M d r a g , i + M c o n , i          
where, the index i stands for the ith -particle with diameter d i   ,   u i   and ω i are its transversal and rotational velocities, respectively, and m i   is its mass. The mass moment of inertia matrix is   I i and the terms u i t and ω i t   correspond to the linear and angular accelerations, respectively. F n c , i and F t c , i are the normal and tangential contact forces, respectively. F d r a g , i stands for the hydrodynamic drag force, F g r a v , i is the total force due to buoyancy and Μ d r a g , i and M c o n , i are the drag and contact moments, respectively.
The OpenFoam platform is used for the calculation of the flow field and the uncoupled equations of particles motion. The simulation process reads as follow; initially, the fluid flow is found using the incompressible Navier-Stokes equations and the pressure correction method. Upon finding the flow field (pressure and velocity). The motion of particles is evaluated by the Lagrangian method. The equations are evolved in time by an Euler time marching method. The computational grid for the micromixer duct that is studied here is composed by 81,250 (hexaedra) cells which is adequate for the low Reynolds number of the current flow which is maximum value is R e = U 0 * H ν 2 × 10 2 , based on the height of the duct and the mean velocity U 0 . Details of the numerical models, forces and moments terms forms used on equations are given in Refs [10,11].

3. Results

For the evaluation of the water-particle mixing process inside the micromixer device, series of simulations are performed with different velocity ratios of the contaminated water (Vc) and the particle solution (Vp) under three different inlet angles between the two streams. Simulation parameters as well as the boundary conditions are tabulated in Table 1.
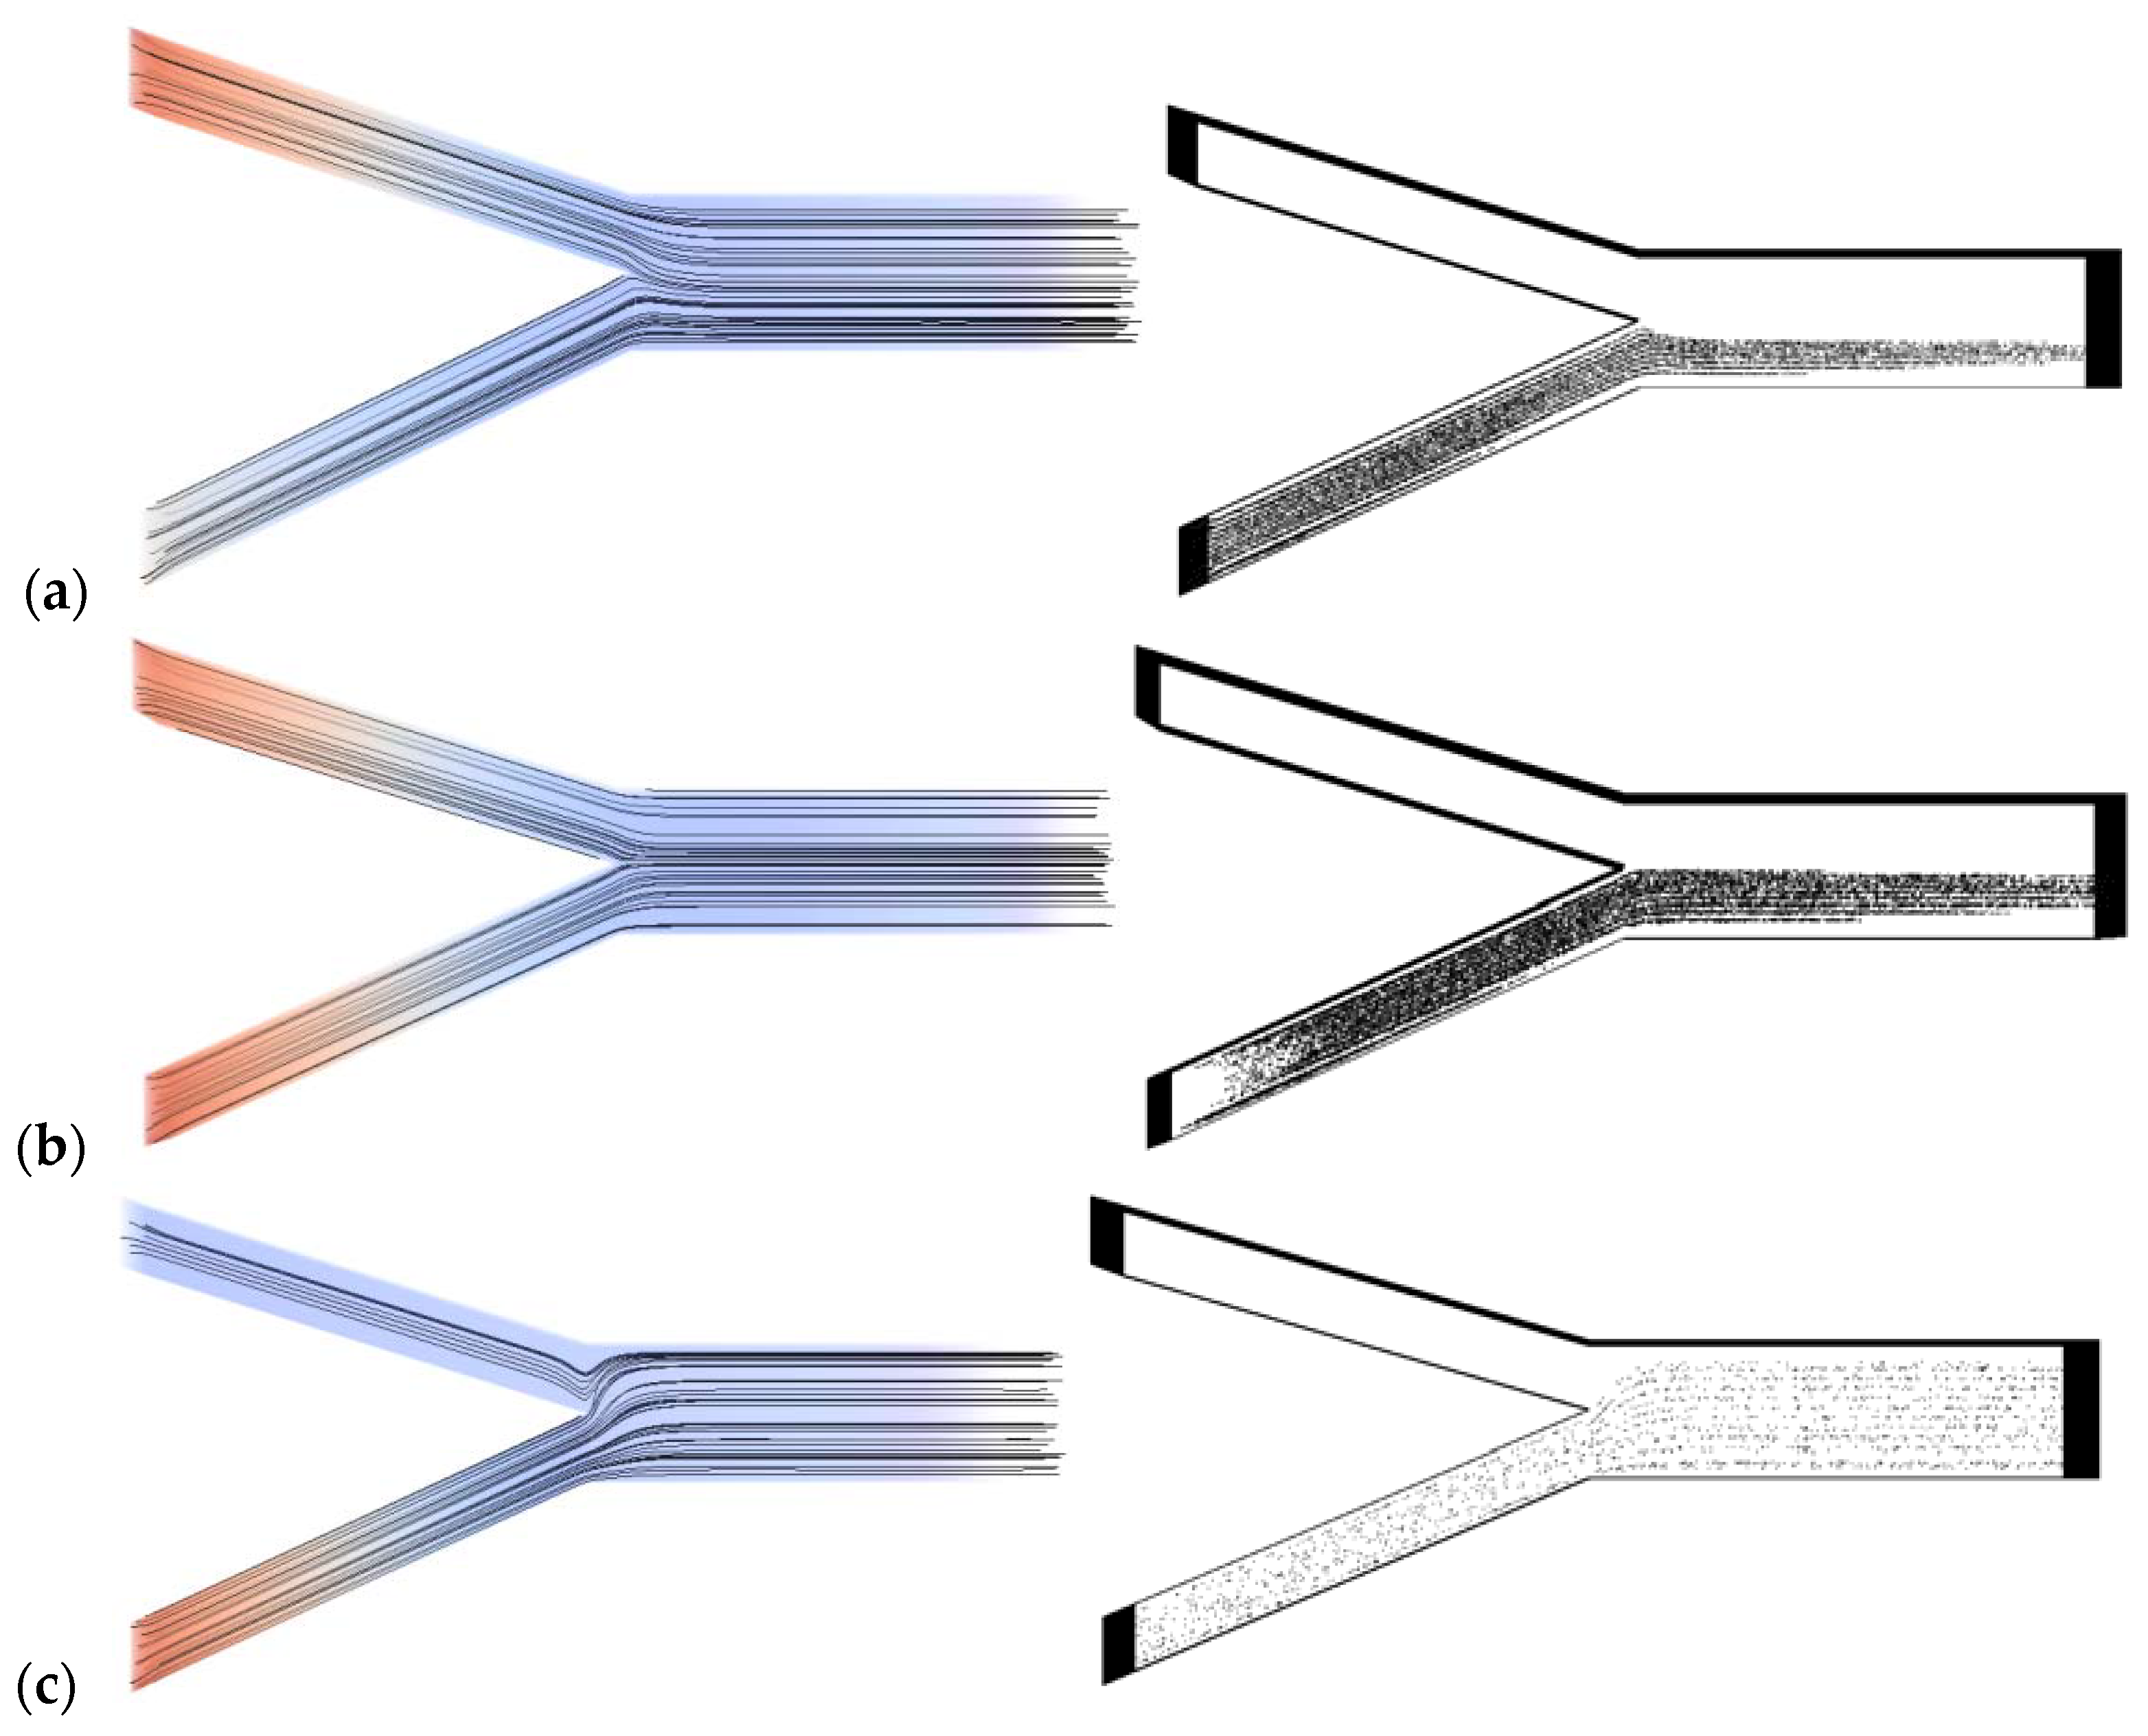
Results and statistics from the water-particle mixing process are measured at the last part of the ducts for lengths x L 2 when mixing is finished and particles are moving only streamwise. The streamlines of the flow are depicted in Figure 2 (left), for different inlet velocity ratios V p V c = 0.5, 1 and 20 and for θ = 30°. In addition, snapshots of the particle positions inside the micromixer are presented in Figure 2 (right) for the same inlet velocity ratios. It is found that, as the inlet velocity ratio is increased, particle trajectories are more uniformly distributed in the duct. In the case of the high inlet velocity ratio V p V c = 20 , the particle solution is more effectively mixed with the contaminated water and particles are nearly homogenously distributed in the duct, as is depicted in Figure 2c. However there is a small area at the higher part of the duct that no particles can be found, as is depicted in Figure 3c. As the inlet ratio is lowered to V p V c = 1 , no mixing between the two streams is observed, as is depicted in Figure 2b. Furthermore, when the inlet ratio is further reduced to V p V c = 0.5 , the particle solution is compressed in the lower part of the micromixer device, as is depicted in Figure 2a. Lower ratios between the two streams leads the particles to be gathered in a small area of the duct, as is depicted in Figure 3a,b, thus no mixing is observed.
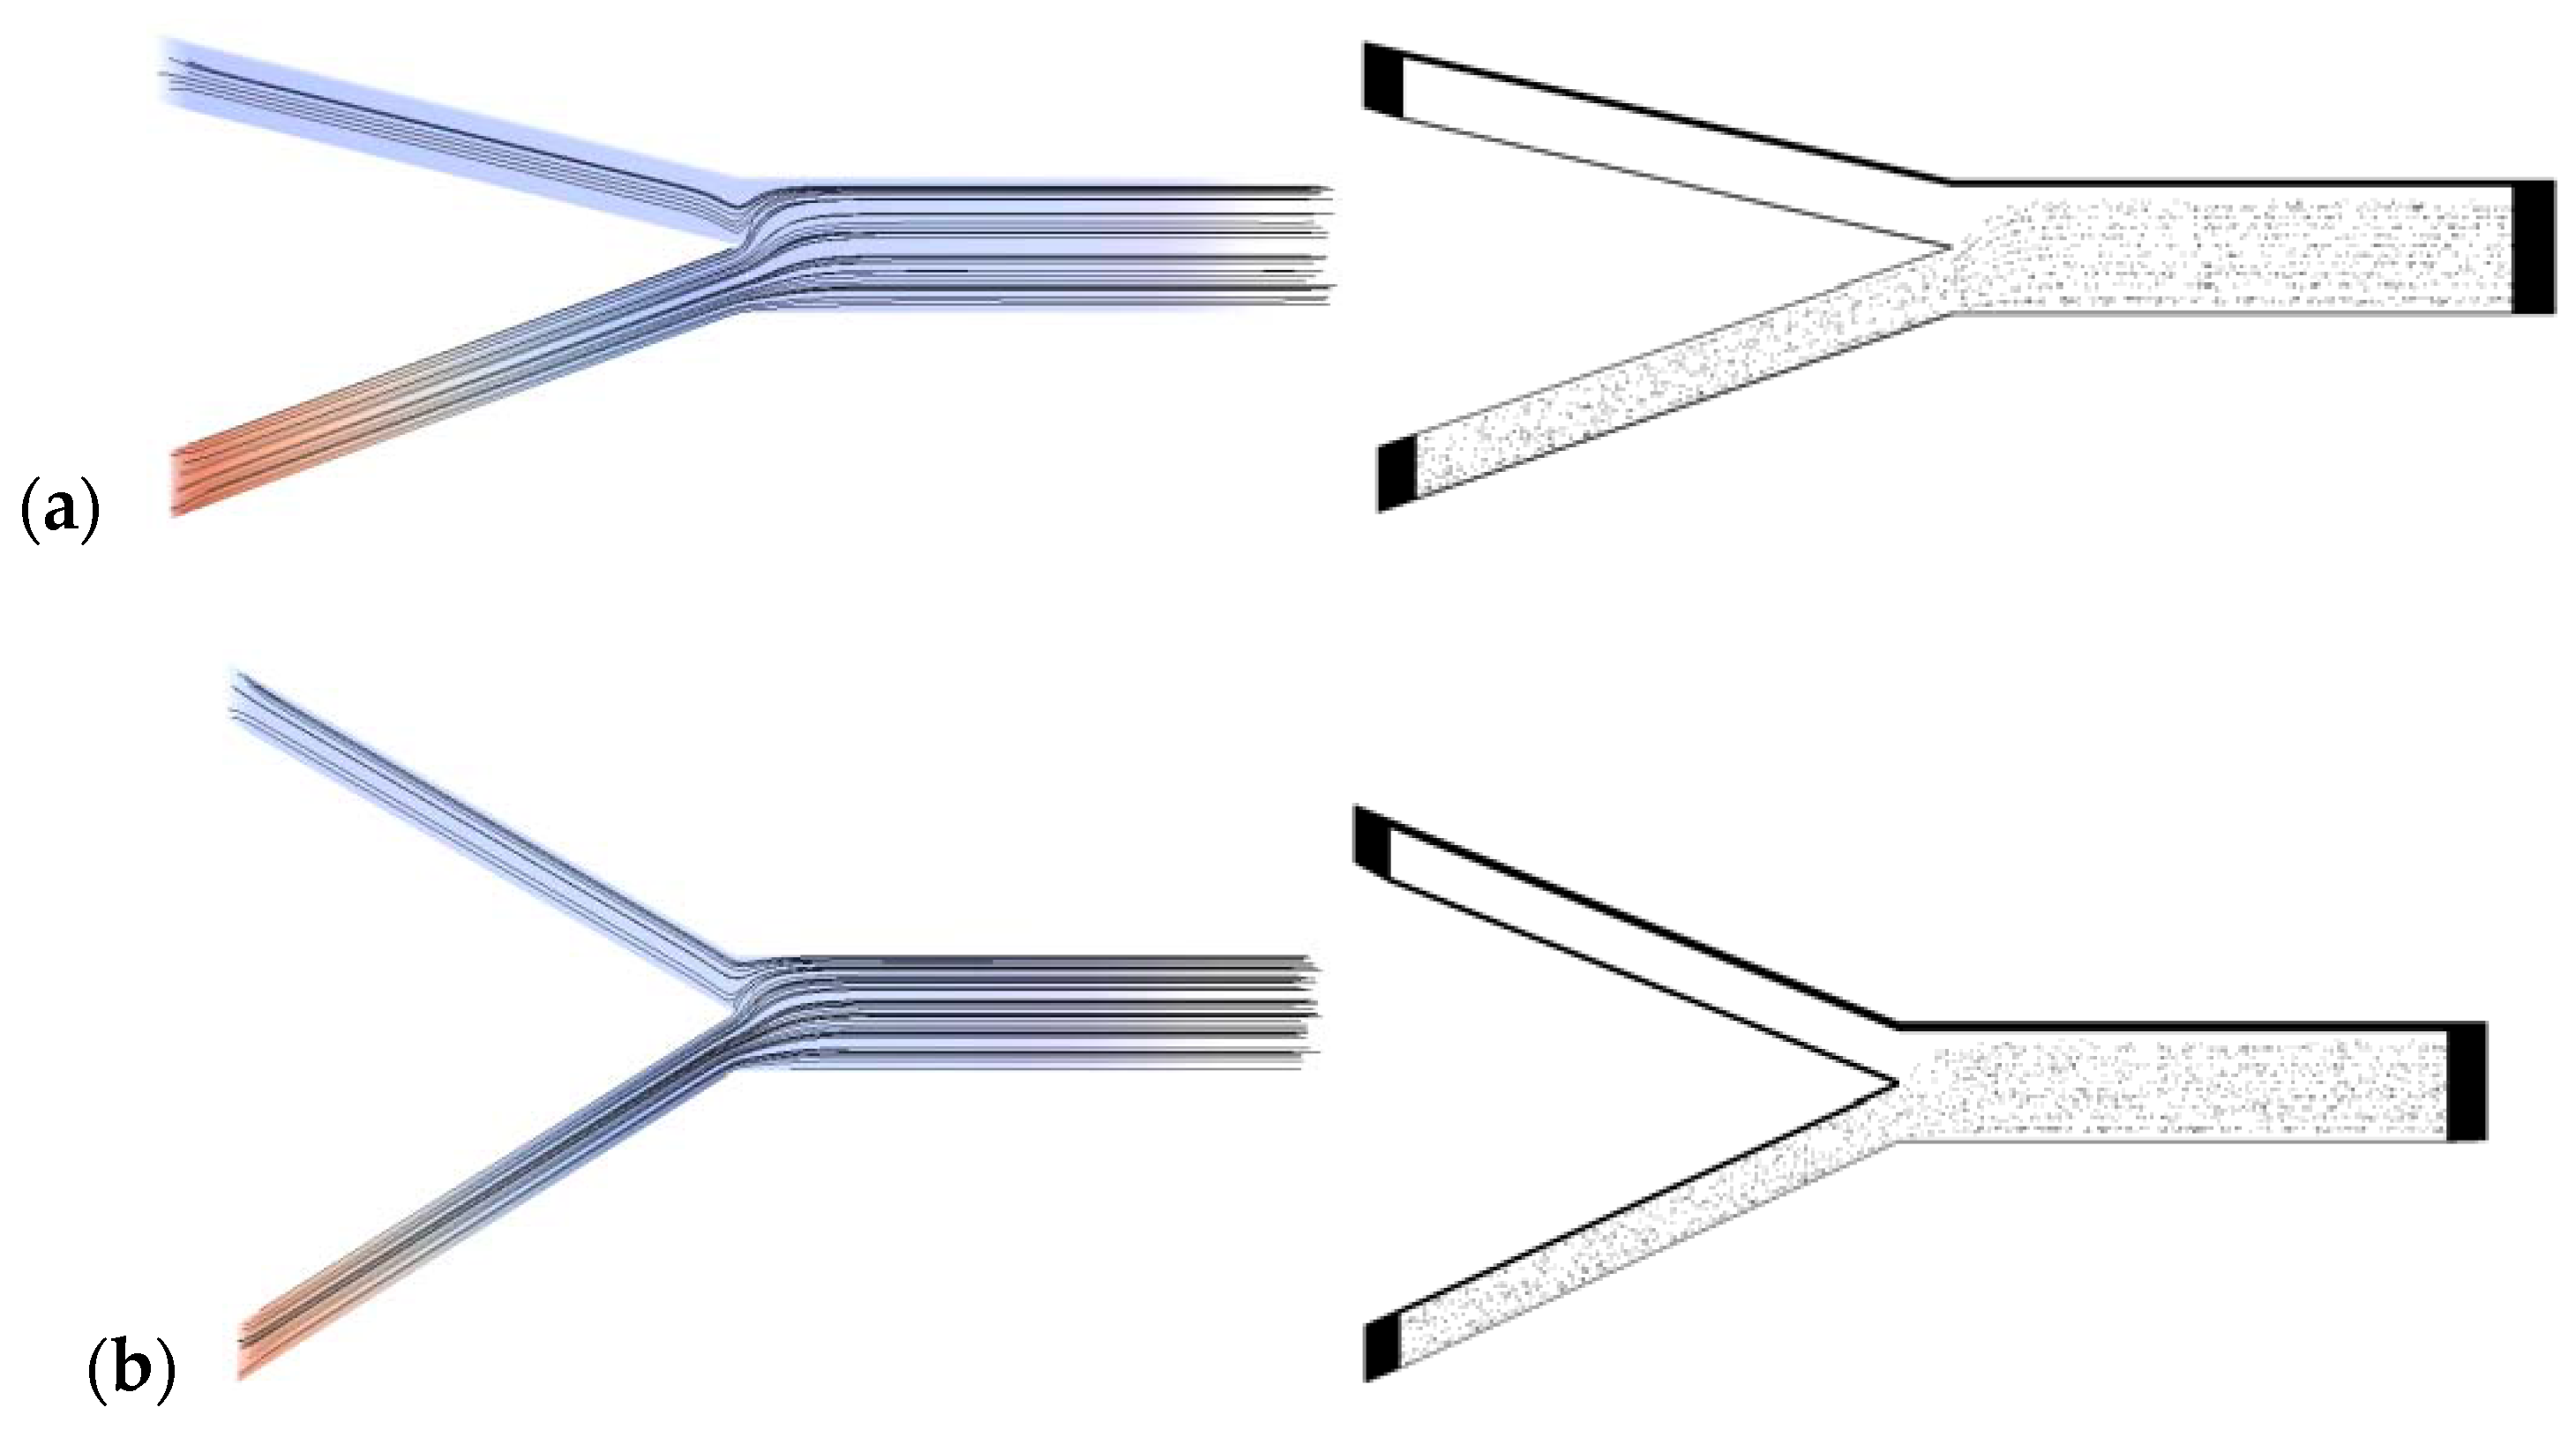
The flow and mixing of the water-particles streams for the velocity ratio, V p V c = 20   ( for   V c = 0.0001 ,   V p = 0.002 ) and for three different angles, θ = 30°, 45°, 60°, between the two inlet streams is depicted in Figure 4 for the streamlines of the flow and the particles locations (snapshot). As it is observed for this high inlet velocity ratio, particles are almost independently of θ distributed uniformly in the duct and only in the region close to the inlet bifurcation some minor differences may be observed. More quantitative results on the particles’ distribution are given below.
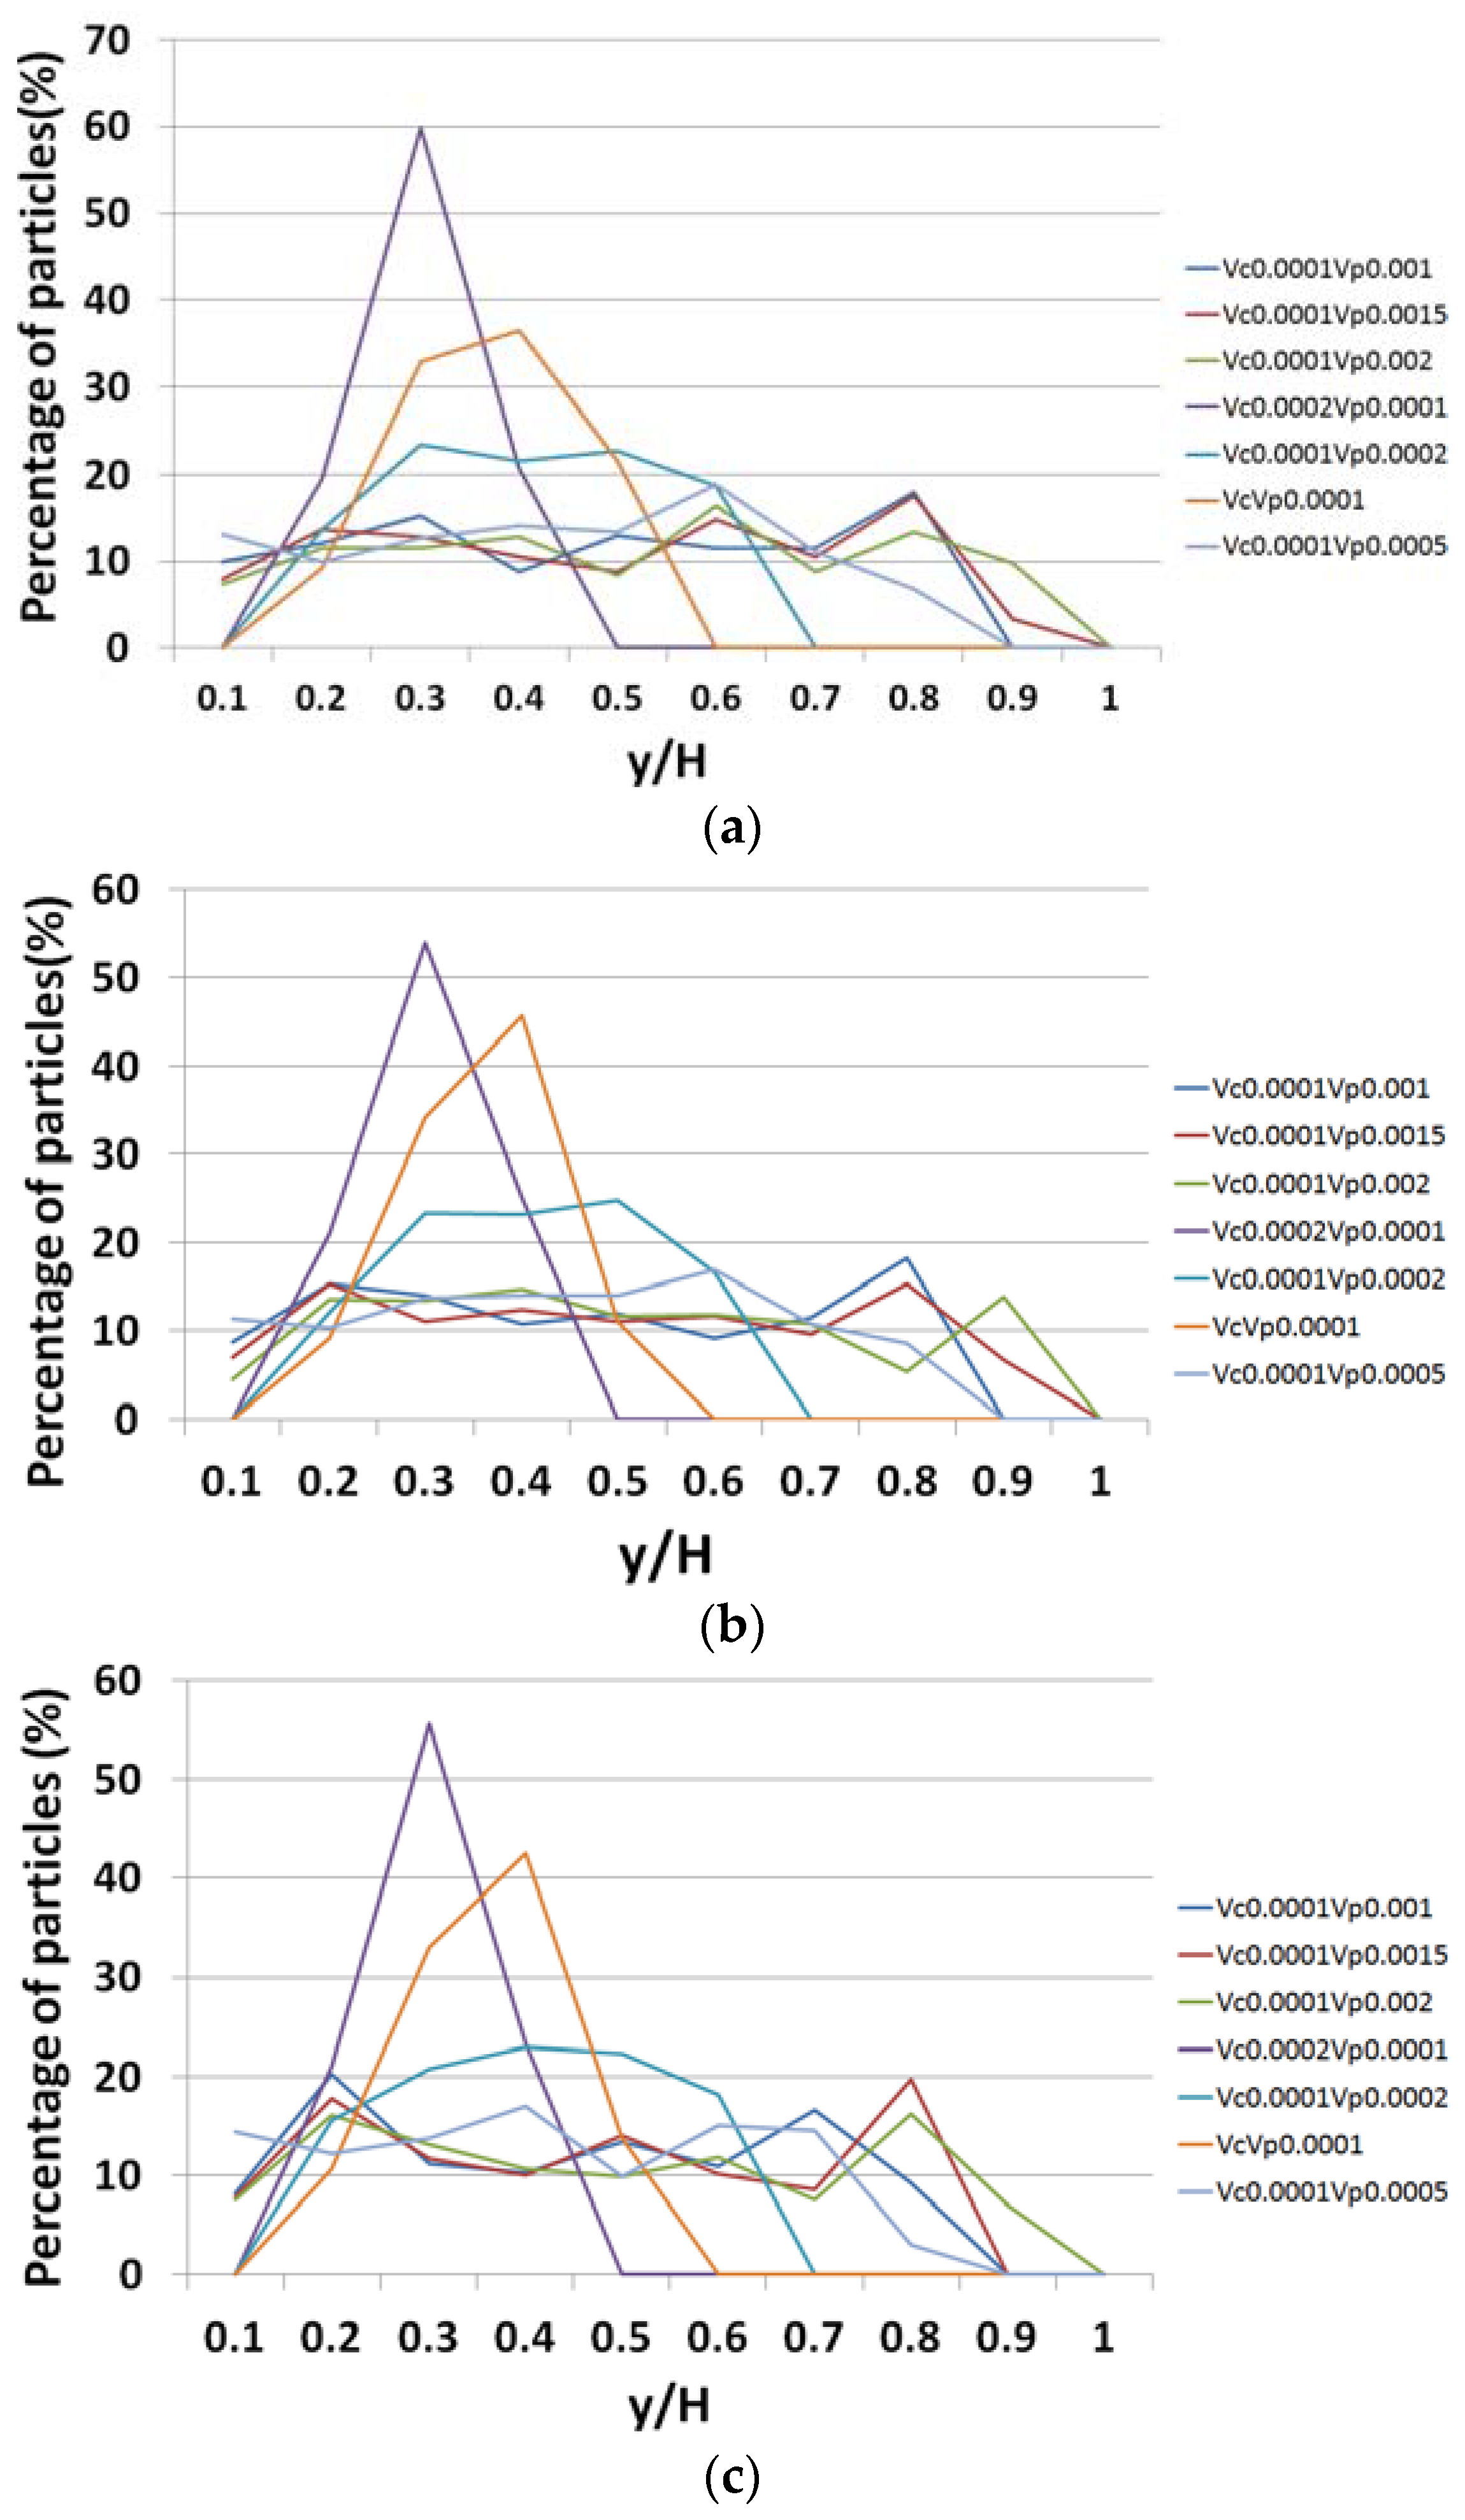
The zx-projected particles’ locations distributions at the last half part of the duct are shown in Figure 5 for various velocity ratios, V p V c and for θ = 30°, 45° and 60°. The height of the duct H is divided into 10 layers and the number of particles found in each level is divided by the total number of particles, thus a uniform distribution of particles up to 10% is considered to be the optimum one. For the case V p V c = 0.5 , no mixing is observed since all the particles are located at heights y/H ≤ 0.5 of the micromixer. As the velocity ratio is increased more effective mixing is observed and for V p V c > 5 the particles mixing is almost uniform. Similar behaviour is also observed as the angle between the two streams increases to 45° and 60°, as is depicted in Figure 5b,c.

4. Conclusions

In the present study the effect of the water-particles flow and mixing under different inlet velocity ratios and angles of the contaminated water and the particle solution ducts is studied. It is found that when small velocity ratios, V p V c are used the mixing process efficiency reduces significantly. As the velocity ratio increases, the mixing is improved and for V p V c 5   particles’ locations are distributed almost uniformly inside the micromixer’s outlet duct. The angle between the two inflow ducts is found to have a minor effect on the mixing process that is intensified as θ increases. Our results justify the use of electromagnetic stirring of the particles in the micromixer as in [8].

References

  1. Foley, J.A.; De Fries, R.; Anser, G.P.; Barford, C.; Bonan, G.; Carpenter, S.R.; Chapin, F.S.; Coe, M.T.; Daily, G.C.; Gibbs, H.K.; et al. Global consequences of land use. Science 2005, 309, 570–574. [Google Scholar] [CrossRef] [PubMed]
  2. Falconer, I.R.; Humpage, A.R. Health risk assessment of cyanobacterial (blue-green algal) toxins in drinking water. J. Environ. Res. Public Health 2005, 2, 43–50. [Google Scholar] [CrossRef] [PubMed]
  3. Li, F.B.; Li, X.Z.; Liu, C.S.; Liu, T.X. Effect of alumina on photocatalytic activity of iron oxides for bisphenol; A degradation. J. Hazard Mater. 2007, 149, 199–207. [Google Scholar] [CrossRef] [PubMed]
  4. Daniel-da-Silva, A.L.; Lóio, R.; Lopes-da-Silva, J.A.; Trindade, T.; Goodfellow, B.J.; Gil, A.M. Effects of magnetite nanoparticles in the thermorheological properties of carrageenan hydrogels. J. Colloid Interface Sci. 2008, 324, 205–211. [Google Scholar] [PubMed]
  5. Shen, Y.F.; Tang, J.; Nie, Z.H.; Wang, Y.D.; Ren, Y.; Zuo, L. Preparation and application of magnetic Fe3O4 nanoparticles for wastewater purification. Sep. Purif. Technol. 2009, 68, 312–319. [Google Scholar] [CrossRef]
  6. Indira, T.K.; Lakshmi, P.K. Magnetic nanoparticles—A review. Int. J. Pharm. Sci. Nanotechnol. 2010, 3, 1035–1042. [Google Scholar]
  7. Qu, X.; Alvarez, P.J.; Li, Q. Applications of nanotechnology in water and wastewater treatment. Water Res. 2013, 47, 3931–3946. [Google Scholar] [CrossRef] [PubMed]
  8. Karvelas, E.G.; Lampropoulos, N.K.; Karakasidis, T.E.; Sarris, I.E. A computational tool for the estimation of the optimum gradient magnetic field for the magnetic driving of the spherical particles in the process of cleaning water. Desalin. Water Treat. 2017, 99, 27–33. [Google Scholar] [CrossRef]
  9. Lampropoulos, N.K.; Karvelas, E.G.; Sarris, I.E. Computational Modeling of an MRI Guided Drug Delivery System Based on Magnetic Nanoparticle Aggregations for the Navigation of Paramagnetic Nanocapsules. In Proceedings of the 11th World Congress on Computational Mechanics (WCCMXI) 2014, Barcelona, Spain, 14 April 2015; Available online: https://arxiv.org/abs/1504.03490 (accessed on 19 March 2018).
  10. Karvelas, E.G.; Lampropoulos, N.K.; Sarris, I.E. A numerical model for aggregations formation and magnetic driving of spherical particles based on OpenFOAM®. Comp. Methods Progr. Biomed. 2017, 142, 21–30. [Google Scholar] [CrossRef] [PubMed]
  11. Tijskens, E.; Ramon, H.; Baerdemaeker, J. Discrete element modelling for process simulation in agriculture. J. Sound Vib. 2003, 266, 493–514. [Google Scholar] [CrossRef]
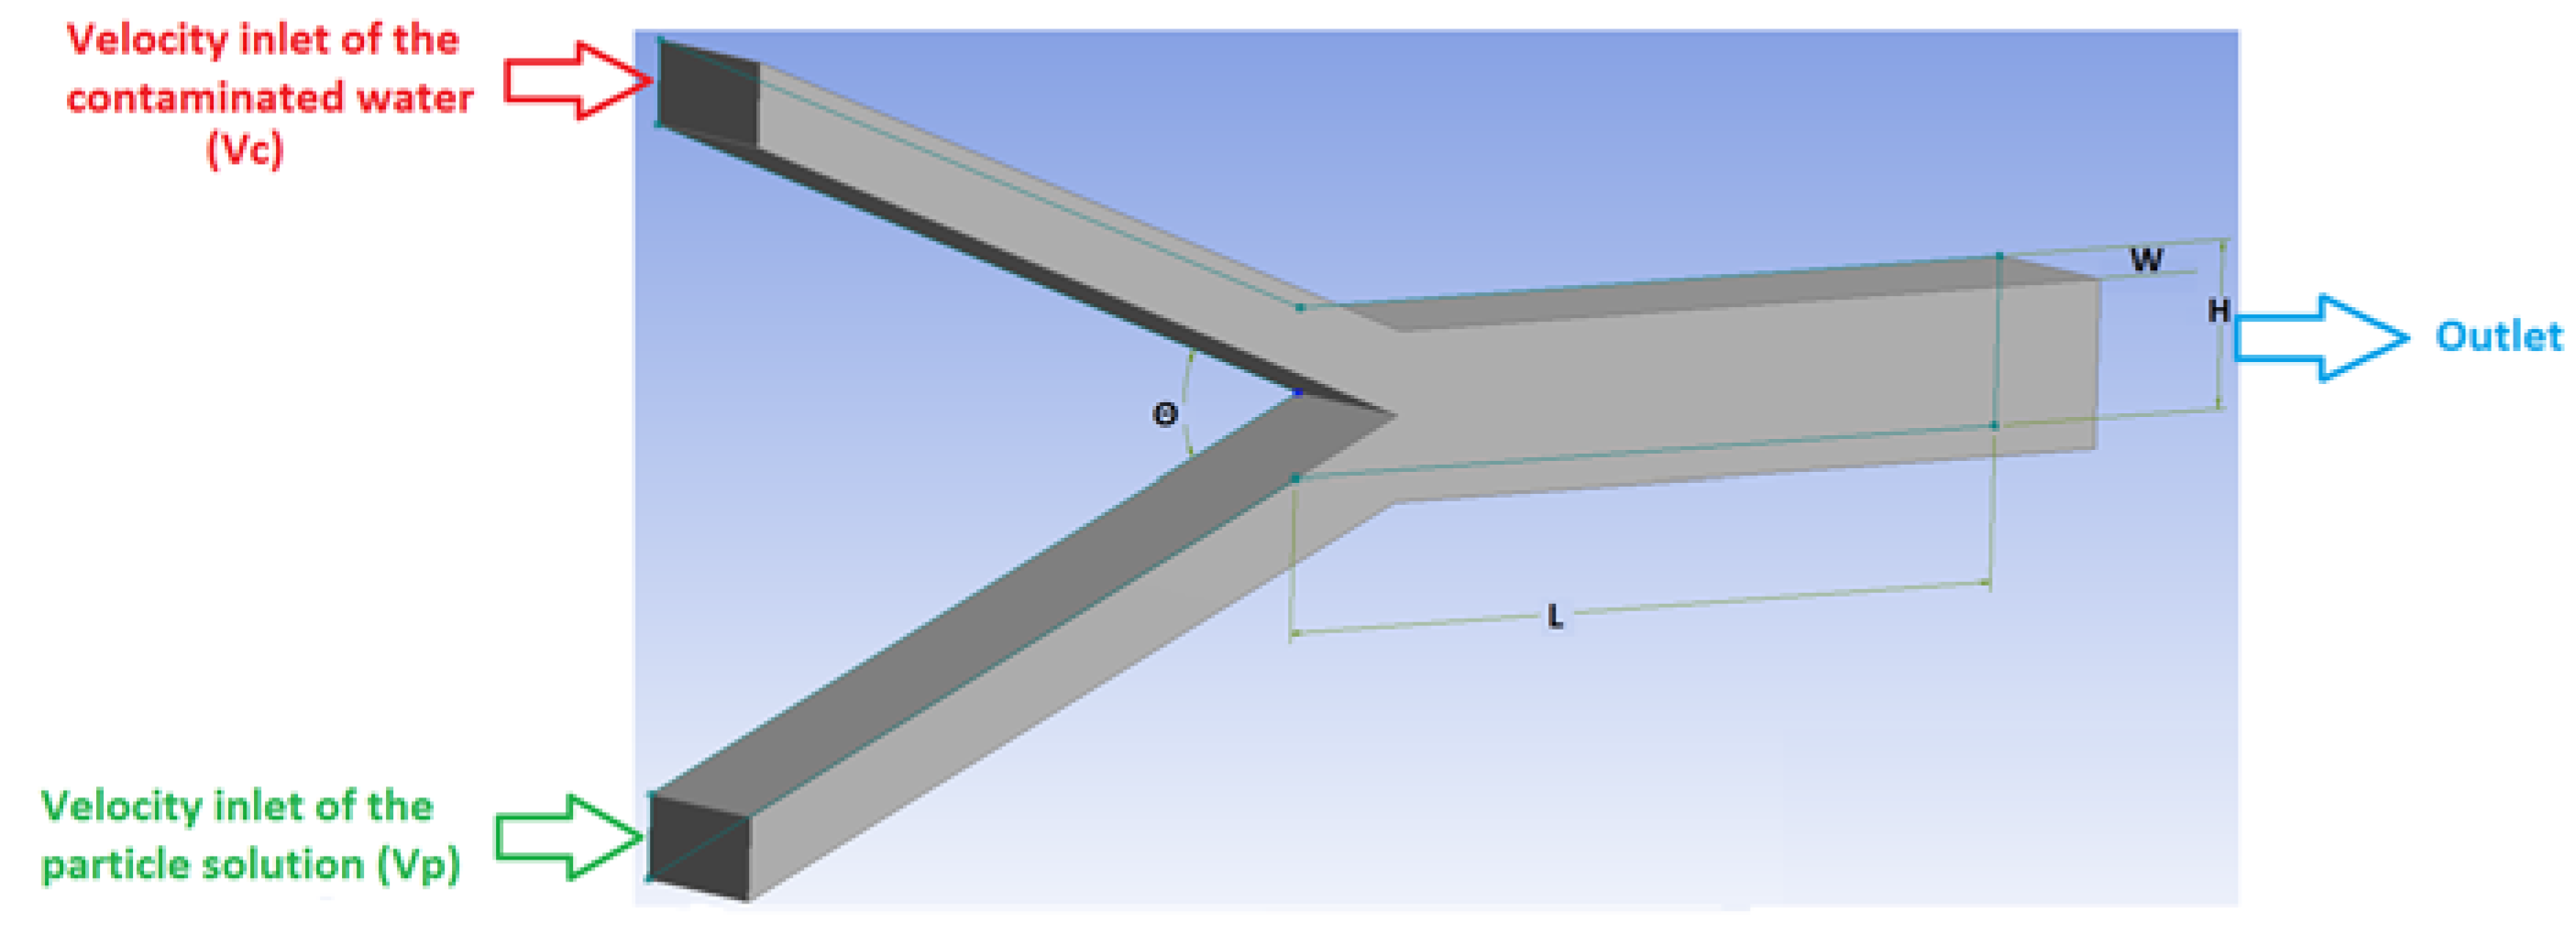
Figure 1. Micromixer geometry of the Y-shaped duct and water-particles inlet and outlet flow directions. θ is the angle between the two inlet ducts.
Proceedings 02 00577 g001
Figure 2. Streamlines (left) and snapshots of the particles positions (right) for θ = 30° and (a) Vc = 0.0002, Vp = 0.0001, (b) Vc = 0.0001, Vp = 0.0001, and (c) Vc = 0.0001, Vp = 0.002.
Proceedings 02 00577 g002
Figure 3. Projection of particles that are located in the last part of the duct with length x L 2 at the outlet for θ = 30° and (a) Vc = 0.0002, Vp = 0.0001, (b) Vc = 0.0001, Vp = 0.0001, and (c) Vc = 0.0001, Vp = 0.002.
Proceedings 02 00577 g003
Figure 4. Streamlines (left) and snapshots of the particles locations (right) for the case of V p V c = 20 , and (a) θ = 30°, (b) θ = 45°, and (c) θ = 60°.
Proceedings 02 00577 g004aProceedings 02 00577 g004b
Figure 5. Particles y-distribution near the duct exit for various inlet velocity combinations and for (a) θ = 30°, (b) θ = 45° and (c) θ = 60°.
Proceedings 02 00577 g005
Table 1. Simulation parameters.
Simulation Parameters
Dimensions of the micromixer geometryLength (L): 5 × 10⁻⁴ m, Height (H): 1 × 10⁻⁴ m, Width (W): 1 × 10⁻⁴ m
Inlet angle (Θ) between the two streams30°, 45°, 60°
Diameter of particles1 μm
Particles per second3000
Particle’s density1087 kg/m3
Boundary conditions
BoundaryVelocity (U) (m/s)Pressure (p) (pa)
Contaminated water (Vc)0.001, 0.002zero gradient
Particle solution (Vp)0.0001, 0.0002, 0.0005, 0.001, 0.0015, 0.002zero gradient
Outletzero gradient0
Walls0zero gradient
Publisher’s Note: MDPI stays neutral with regard to jurisdictional claims in published maps and institutional affiliations.