Proceeding Paper

Modelling of Environmental Parameters of a Harbor Basin in a Coastal Zone with a Seawall †

by
Yiannis Savvidis
1,*,
Evangelos Keramaris
2,
George Pechlivanidis
1 and
Christopher Koutitas
3
1
Department of Civil Engineering T.E., Alexander Technological Educational Institute of Thessaloniki, Thessaloniki, 57400 Sindos, Greece
2
Department of Civil Engineering, University of Thessaly, Pedion Areos, 38334 Volos, Greece
3
Department of Civil Engineering, Aristotle University of Thessaloniki, 54124 Thessaloniki, Greece
*
Author to whom correspondence should be addressed.
Presented at the 3rd EWaS International Conference on “Insights on the Water-Energy-Food Nexus”, Lefkada Island, Greece, 27–30 June 2018.
Proceedings 2018, 2(11), 575; https://doi.org/10.3390/proceedings2110575
Published: 30 July 2018
(This article belongs to the Proceedings of EWaS3 2018)

Abstract

:
Long straight seawalls along the coastal front are quite common, especially in cases of coastal cities. In this study in the middle of a coastal zone, a harbor basin in the form of an orthogonal area recessed to the waterfront is considered. A mole of variable length and position offers protection from waves. The renewal time of the waters and the self-purification capacity of the harbor under the influence of alongshore coastal currents of different intensity were examined. The effect of technical partial closing of the harbor’s entrance to the water renewal rate is examined in the present research. More specifically, the study was based on the use of a two dimensional, depth averaged hydrodynamic model which describes the water circulation along the coastal zone. For the solution of the equations of mass and momentum conservation, the method of finite differences was used. The adjustment and the validation of the reliability of the numerical model at a laboratory level were conducted in a recent research based on the use of PIV measurements which ensured a very good agreement between numerical and experimental results.

1. Introduction

In recent studies [1,2], the hydrodynamic circulation in a long extended area with a lateral small basin was investigated quite analytically, both experimentally with the help of a laboratory channel and numerically with the realization of mathematical simulations; consequently, there was a successful combination of physical and mathematical modeling work.
Savvidis et al. [2] investigated the optimum design of the opening through which a fish refuge pond communicates laterally to the main flow of a river. The study was based on physical and mathematical modelling. The physical modeling was realized via laboratory experiments that included an open channel with a lateral reservoir. The flow characteristics measurements were realized using the particle image velocimetry (PIV) method. The mathematical simulations were based on the development of a two-dimensional horizontal hydrodynamic model and a quasi-three-dimensional (3D) sediment transport model. In the study, the final results of the mathematical models and the findings of the physical model were compared, which revealed the hydrodynamic interaction and coupling between the main flow of the channel and the lateral fish pond and led to the optimum technical design of the system.
Finally Savvidis and Keramaris [3] investigated problems similar to the aforementioned issues but in the case of a harbor lateral to a main river stream. Thus, in this study particle transport in a navigable river and its lateral harbor basin was investigated, which mainly focuses on possible deposition issues that might be dangerous in the harbor’s normal operations.
The present study aims to the investigation of important environmental parameters for a number of alternative solutions of the aforementioned problem which is focused on the coastal marine environment and more specifically on the communication between a long coastal zone and a harbor laterally to this coastal area with a seawall.

2. Material and Methods

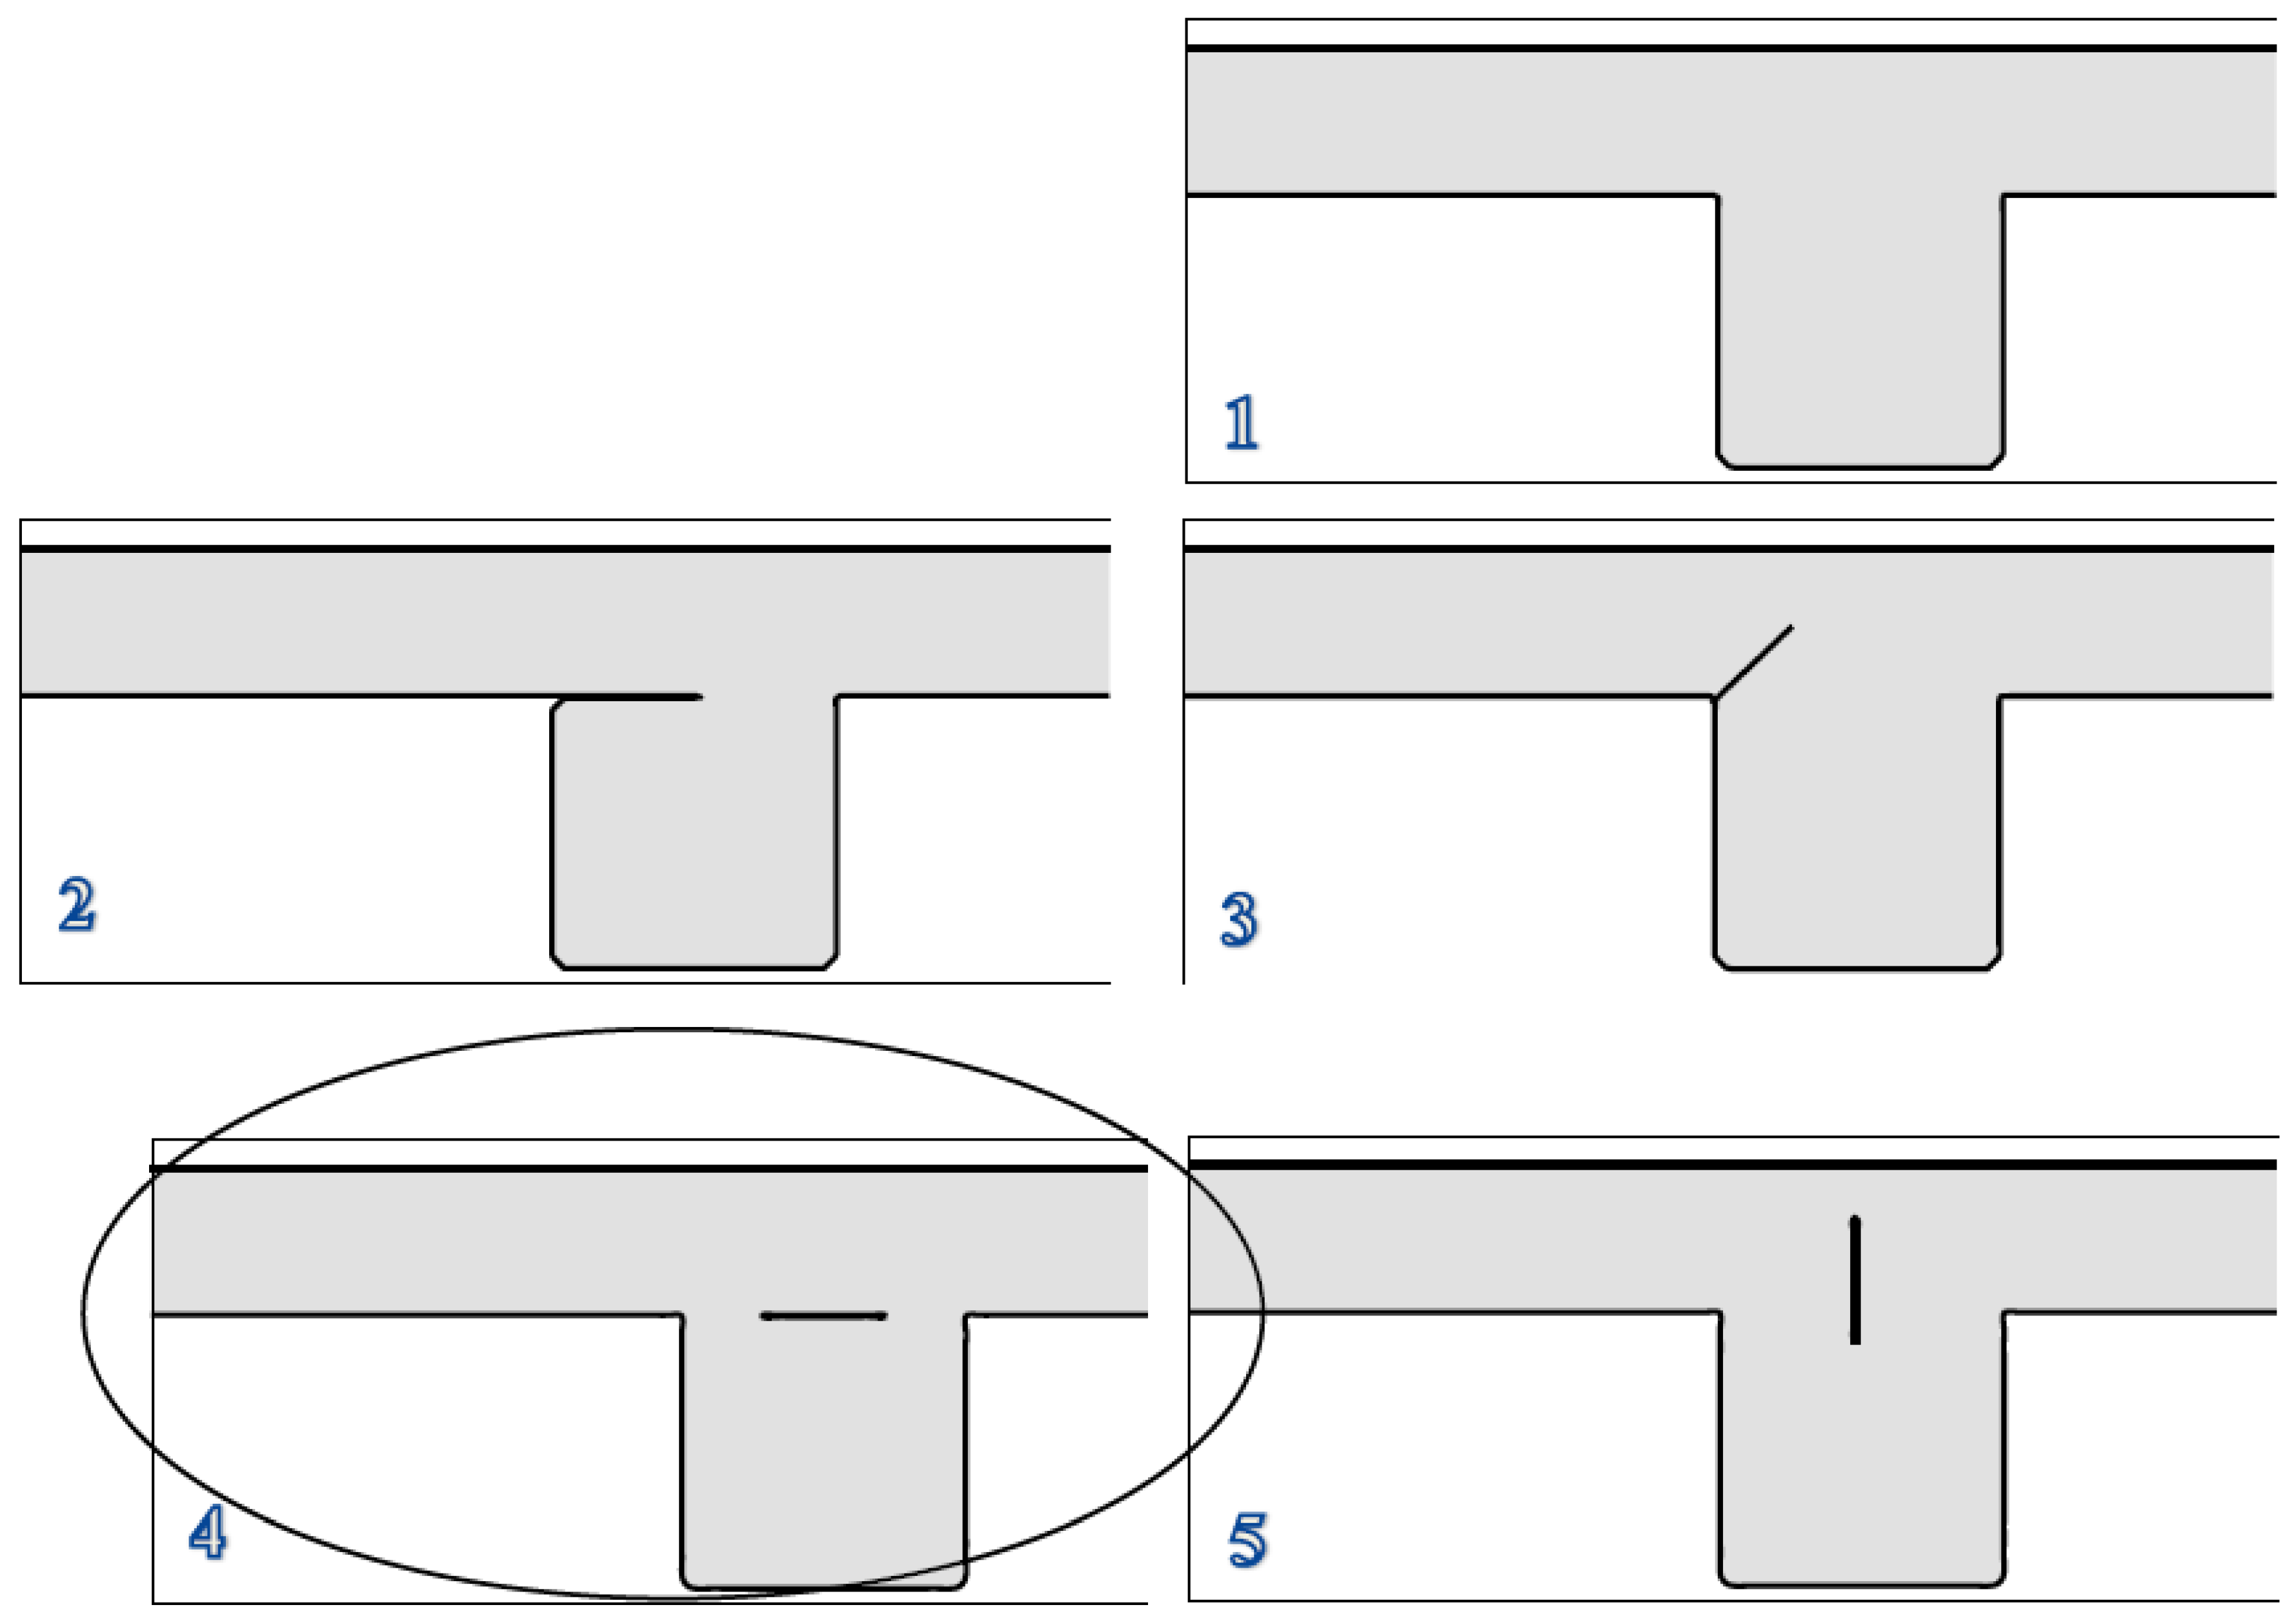
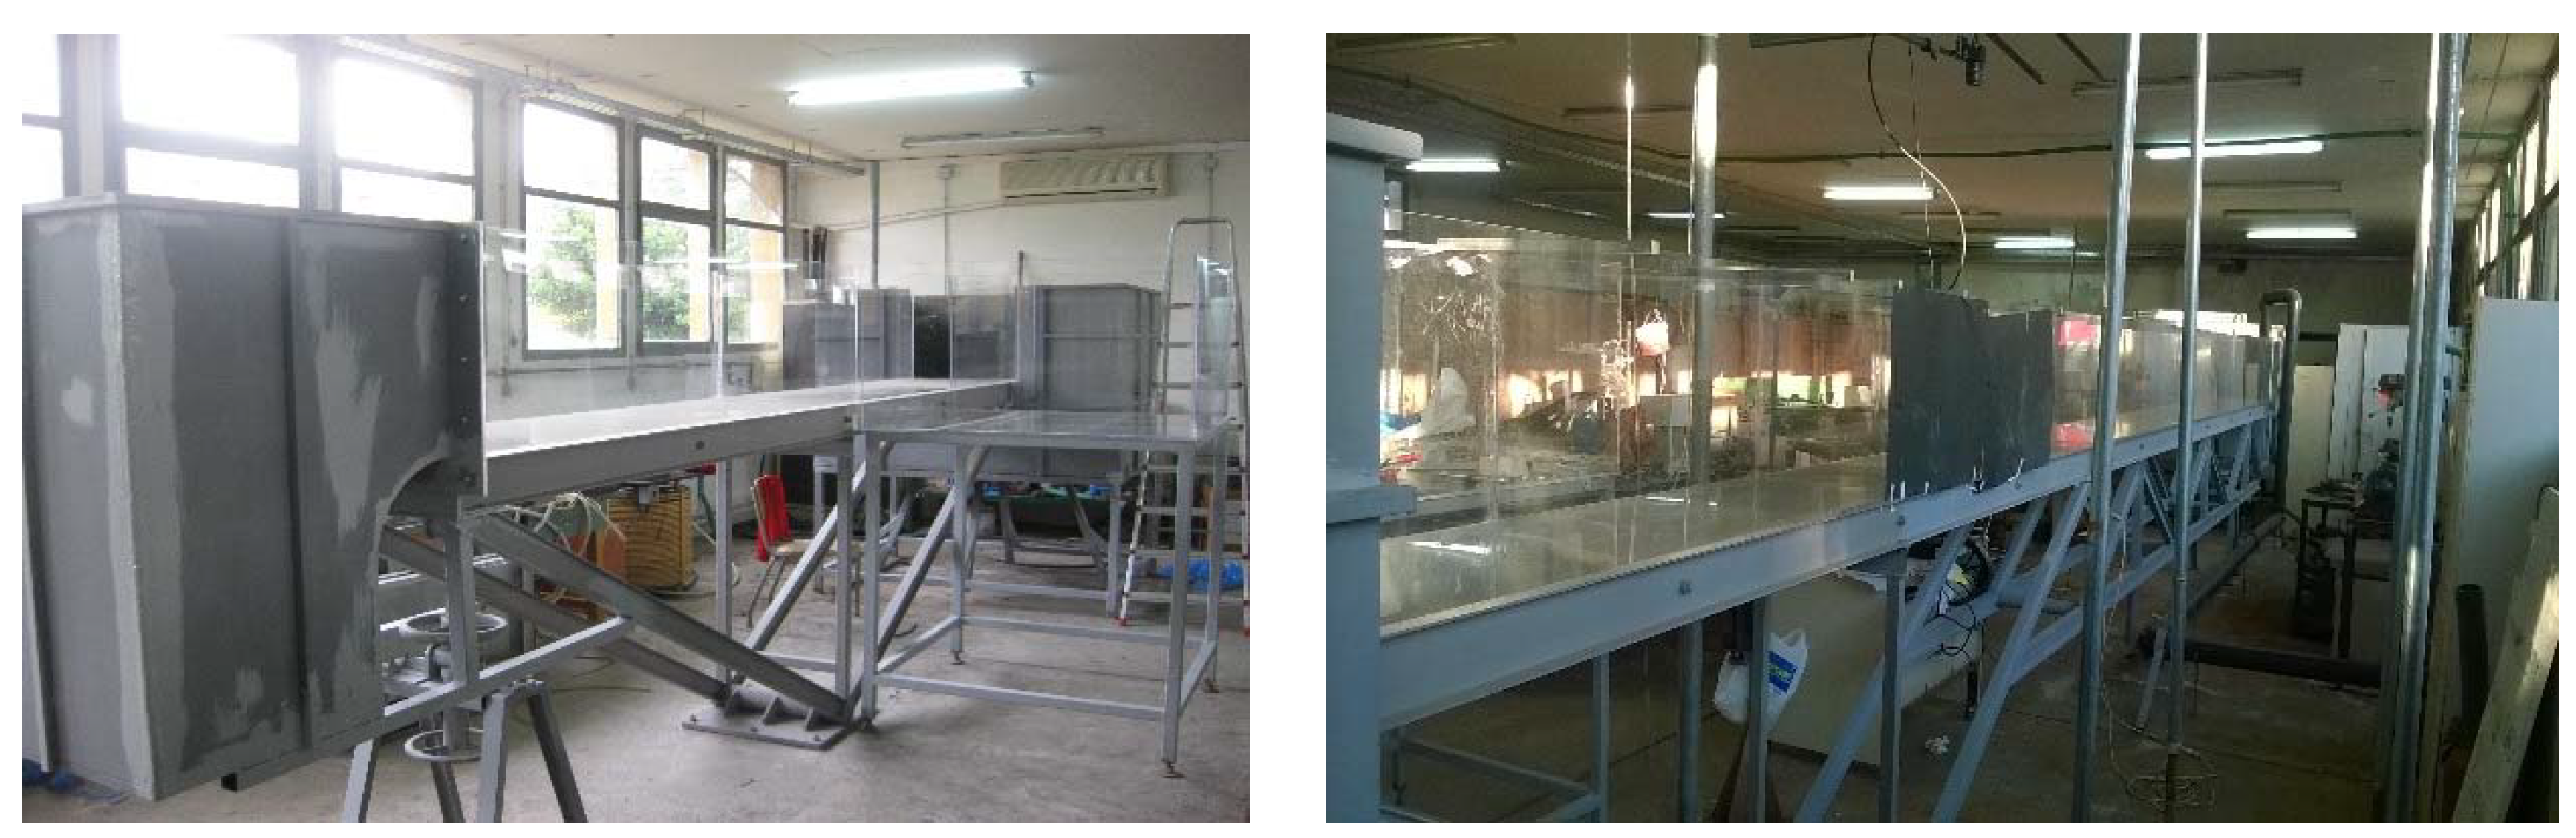
2.1. Laboratory Experiments

The experimental study, and the adjustment and validation of the corresponding numerical models have been described in a recent paper [2]; that modeling work, constituted the basis of the structure of the present mathematical model, for the simulation of a similar problem described in this paper; the successful validation of the aforementioned previous work, ensures the operational value of the present numerical model.
In more detail, the aforementioned experiments were conducted in a horizontal channel with 7.0 m length, 25 cm height and 50 cm width (and a lateral square basin 1 m2) in the laboratory of Hydraulics in the Department of Civil Engineering of Alexander Technological Educational Institute of Thessaloniki, Greece (Figure 1). The technique of PIV (Particle Image Velocimetry), described by Adrian [4] and Raffel et al. [5] was used for the measurements concerning the hydrodynamic information captured by the experimental process. More information about the procedure of the laboratory experiments can be found in [2].
As mentioned in introduction [2] studied a number of alternative solutions concerning the placing of a mole in the entrance of the lateral basin, depicted in Figure 2.
According to [2] the simulations of the experimental laboratory channel combined with numerical modeling work revealed that case 2 seems to be the optimum configuration for the minimization of possible sedimentation in the lateral, to the main stream, basin; however this was definitely not the case for the minimum renewal rate. Moreover, case 2 corresponded to the maximum water renewal rate. Concerning the minimum renewal time of the basin’s waters, this was computed for case 5 which however corresponds to the largest values of trapped particles (leading to large settling rates).
After the above brief presentation we can conclude that cases 3 and 4 seem to be the best possible solutions between the five different scenarios of the entrance design. However, concerning the investigation of the mole placed in the opening of the lateral basin the following reasoning should be taken into account.
Since the parallel to the coast hydrodynamic circulation can be developed from both the two opposite directions i.e., east to west or west to east (depending on the wind blowing over the coastal area) only cases 4 and 5 can obviously be used in order to protect the internal basin with similar way from the waves as well the possible transfer of suspended sediments; this is due to the symmetry, that only cases 4 and 5 present to the particular problem. Since case 5 leads to large trapping and settling rates of possible transported sediment load, we can finally conclude that case 4 is the optimum one for the technical design of the entrance of the lateral basin for present the study.

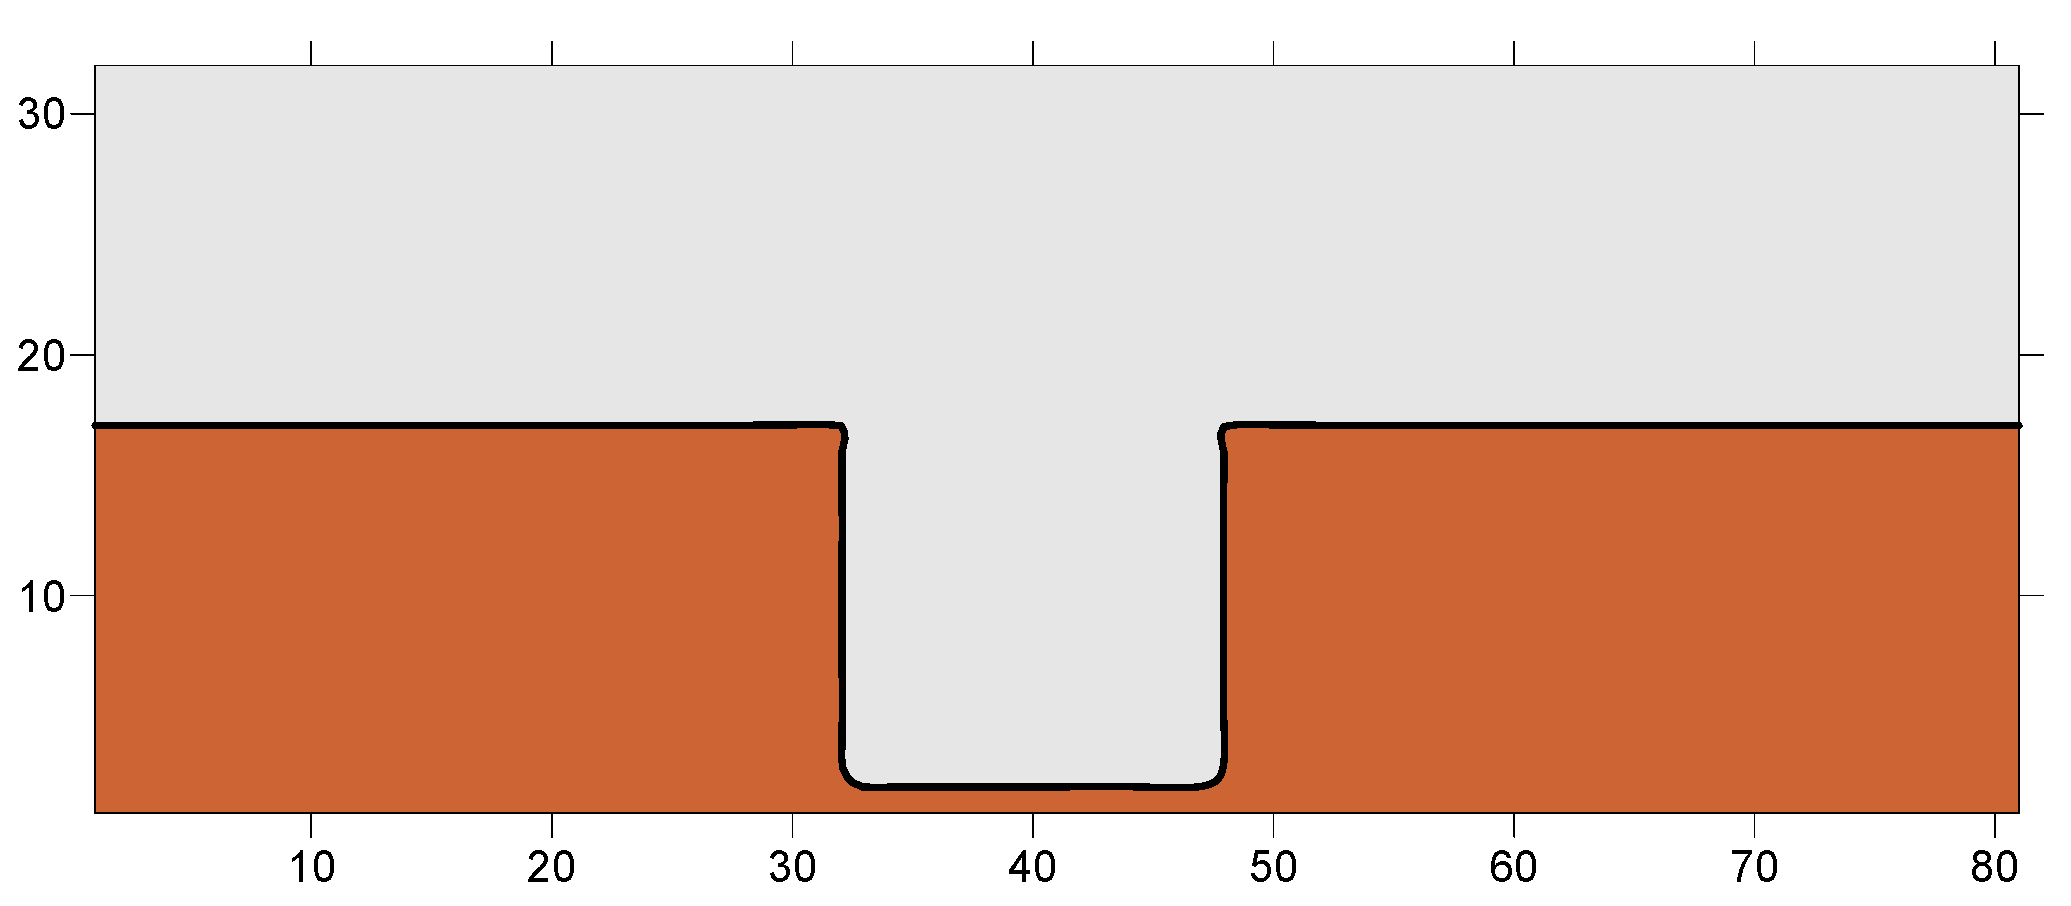
2.2. Numerical Model

The present work concerned the study of a long coastal zone of 800 m length and 150 m width with a square harbor laterally to the coastal area with harbor dimensions 150 m × 150 m (Figure 3). The depth of the water in the elongated coastal area as well as in the lateral basin of the harbor was taken 3 m. The study was based on the development and realization of a hydrodynamic model. In more detail, the geometry of the study area, depicted, was discretized horizontally with spatial step dx = dy =10 m (81 grid points at x and 32 at y axes) and time step dt = 1 s. The finite differences method was used in the mathematical simulations.
The hydrodynamic simulations were based on the application of a two dimensional-depth average-model performed for the exertion of wind stresses as a surface friction for different wind speeds for a time period of six hours which was sufficient to lead the particular water body to steady state hydrodynamic conditions. The equations which govern the hydrodynamic two-dimensional circulation are the well-known equations of the momentum and mass conservation (1)–(3):
U t + U U x + V U y = g ζ x τ b x ρ h + τ s x ρ h + ν h 2 U x 2 + ν h 2 U y 2
V t + U V x + V V y = g ζ y τ b y ρ h + τ s y ρ h + ν h 2 V x 2 + ν h 2 V y 2
ζ t + ( U h ) x + ( V h ) y = 0
where h is the water depth, U and V are the vertically averaged horizontal velocities, ζ is the surface elevation, f is the Coriolis parameter, τbx and τby are the bottom shear stresses, τsx and τsy are the surface wind shear stresses, ν is the horizontal turbulence viscosity coefficient related, according to Smagorinski [6], to the local vorticity, ρ is the density of the water and g is the gravity acceleration.
The expression of shear stress components on the seabed τbx, τby is given by the relations (4) and (5):
τ b x = ρ k b U U 2 + V 2
τ b y = ρ k b V U 2 + V 2
where kb a dimensionless friction constant with a magnitude of 10−3–10−2 (with kb = 10−3 in our model runs)
The expression of wind shear stresses on the sea surface is given by the relations (6) and (7):
τ s x = ρ k s W x W x 2 + W y 2
τ s y = ρ k s W y W x 2 + W y 2
where Wx, Wy the wind velocity components at a distance of 10 m above the sea surface and ks a dimensionless constant with a magnitude of 1 × 10⁻⁶ to 3 × 10⁻⁶ (with ks =3 × 10⁻⁶ in our model runs)
Since there is seawall along the coastal zone no wave currents are generated.
The renewal of the waters of the lateral basin was then calculated by the following relation (8):
T = Ω / Q  
where Ω the volume of the lateral basin (m3), Q the waters’ flushing flow rate (m3/s) which results from the half of the sum of the entering and the leaving flow rates Q+ and Q respectively, and T is the waters’ renewal time of the basin of the harbor (in seconds or days). The flows rates Q+ and Q (resulting almost equal in steady state conditions) were computed from the currents’ velocity data using the following relationships (9) and (10):
Q + = i [ V i ( + ) A i ]
Q = i [ V i ( ) A i ]
where Vi(+) and Vi(−) the mean depth current speed velocity normal to the line of the opening between the main channel and the lateral basin, i.e., the velocity of the currents entering or leaving the inner harbor’s basin respectively from the area Ai (=dx·Hi) corresponding to the cell i of the grid along the remaining opening for the free communication between the main channel and the lateral basin.
After the numerical estimation of the waters’ renewal time, the harbors’ self-purification capacity can be computed. More specifically, the computation of the harbors’ self-purification capacity can be based on the waters’ renewal time as well as on the polluting load q which corresponds to sewage waters of a maximum number of the people who are on the boats in the harbor; this load might be estimated from 500 to 1000 for the specific study. If we take into account a mean value of sewage, 200 L per person per day, then for 1000 people, a load of q = 0.2 × 1000 = 200 m3 /day or 200,000 L/day is used for our computations. Considering this simple analysis and the fundamental target of avoiding eutrophic problems in the harbor’s basin, the BOD parameter is considered as one of the most important environmental indicators that can be used. More analytically, BOD (biological demand oxygen) is defined as the quantity needed for the oxidation of an organic component of waste materials from microbes in aerobic conditions [7] and constitutes one of the most commonly used parameters for the estimation of the organic pollution of surficial waters as well as waste waters.
The mean concentration of BOD in the basin is given by the following relation (11):
C = q C o q + ( Ω / T ) + Ω λ
where, q is the entering flow discharge (with polluted load), Co is the concentration of BOD of untreated sewage (220–400 mg/L), T the mean renewal time, Ω is harbors’ volume and λ the biodegradation coefficient which for urban sewage is of the order of 0.1 per day [8].
Based on the above described computational methods, the following three cases were examined in the present work: (a) the lateral basin keeps its free opening without any structure, (b) the opening is limited by the construction of a mole of 50 m length for wave protection, centered in the opening and forming two smaller entrances of 50 m in the harbor from the left and right side of the mole and (c) the opening is limited by the construction of a 90 m mole for wave protection, centered in the opening and forming two smaller entrances of 30 m in the harbor from the left and right side of the mole.

3. Results and Discussion

Characteristic environmental parameters of the waters of a harbor laterally to a long coastal zone, were examined through the application of a 2D, depth average, hydrodynamic model; these parameters included the renewal time of the waters of the lateral basin, the renewal flow discharge, and the concentrations of BOD for a maximum number of 1000 people on the vessels in the harbor. A maximum value of BOD concentration in the basin, of the order of 5 mg/L is considered as acceptable [9]. Taking into account this critical value of BOD, the diagrams of Figure 4 show how BOD concentrations are influenced by the wind speed and the renewal time of the waters. The red dash line in the diagrams of Figure 4 corresponds to the aforementioned upper limit of BOD concentration. The results of the model runs revealed that the case with the mole of 90 m, in the opening of the harbor, should be definitely avoided; moreover low wind speeds can also lead to unacceptable limits of BOD concentrations. Furthermore, Figure 5 shows the computed renewal time rates for different values of wind speed. The correspondence between the wind intensity in Beaufort scale and the exact mean value in m/s respecting to each different level of Beaufort scale is given to Table 1 according to [10]. These values of wind speed were used in the model simulations.
From the results depicted in Figure 4, it seems that cases (a) and (b) present similar characteristics in contrast with the case c, concerning the influence of wind speed to the concentrations of BOD. In general, wind speeds less than 4.5 m/s (3 Beaufort) lead to increased and unacceptable values of BOD concentrations in the harbor, not only for the cases of a mole in the opening of the harbor (cases b and c) but also for the case of free communication of the harbor to the coastal area (case a). However, the investigation of cases a and b, leads generally to accepted values of BOD for wind speeds greater than 4.5 m/s (3 Beaufort) which may be observed quite frequently in a coastal area. Concerning the case c, acceptable values of BOD are reached if only wind speed exceeds 13 m/s (6 Beaufort). Of course, the presence of 1000 people simultaneously in a harbor of such dimensions is rather rare, and was considered in the computations as a maximum and extreme number of people. It should be noted that the respected computations for 500 people showed that BOD exceeded the value of 5 mg/L only for the case of 90 m mole and for wind speed 2.5 m/s (2 Beaufort). As far as the renewal time of the waters of the harbor is concerned, it seems that a time period up to 7.5 days is sufficient for all the study cases in order to keep BOD concentrations below the limit of 5 mg/L.
Figure 5 shows that large renewal time of the waters of the harbor result from low wind speed blowing over the study area, generating obviously very low seawater current velocities. The situation becomes really problematic for case c, with the mole of 90 m in the opening of the harbor. Thus, considering a wind speed of 4.5 m/s, the renewal time of the harbor’s waters for cases a and b is ~6 and 8 days respectively while for case c the corresponding renewal rate is ~19 days.
Summarizing, from the above presented results, case b, with a 50 m mole centered in the opening of the harbor for wave protection is considered the best possible solution.
Characteristic examples of the velocity field corresponding to wind speed 10 m/s (5 Beaufort) are given in Figure 6 for the three cases examined. Steady state conditions are always reached after six hours of moving water in the study area.
The current velocity patterns depicted in Figure 6 (where the main stream is from west to east), show that in cases b and c (with a mole in the opening) the water masses seem to enter the harbor from the west side of the basin and exit from the east side of it, forming an anti-clockwise, cyclonic eddy. Only, in case a, with the free opening, the water masses seem to enter the harbor from the east side and exit from the west side of it, forming a clockwise, anti-cyclonic eddy.

4. Conclusions

The present research (taking into account a large number of people in the harbor) revealed the following main issues:
(1)
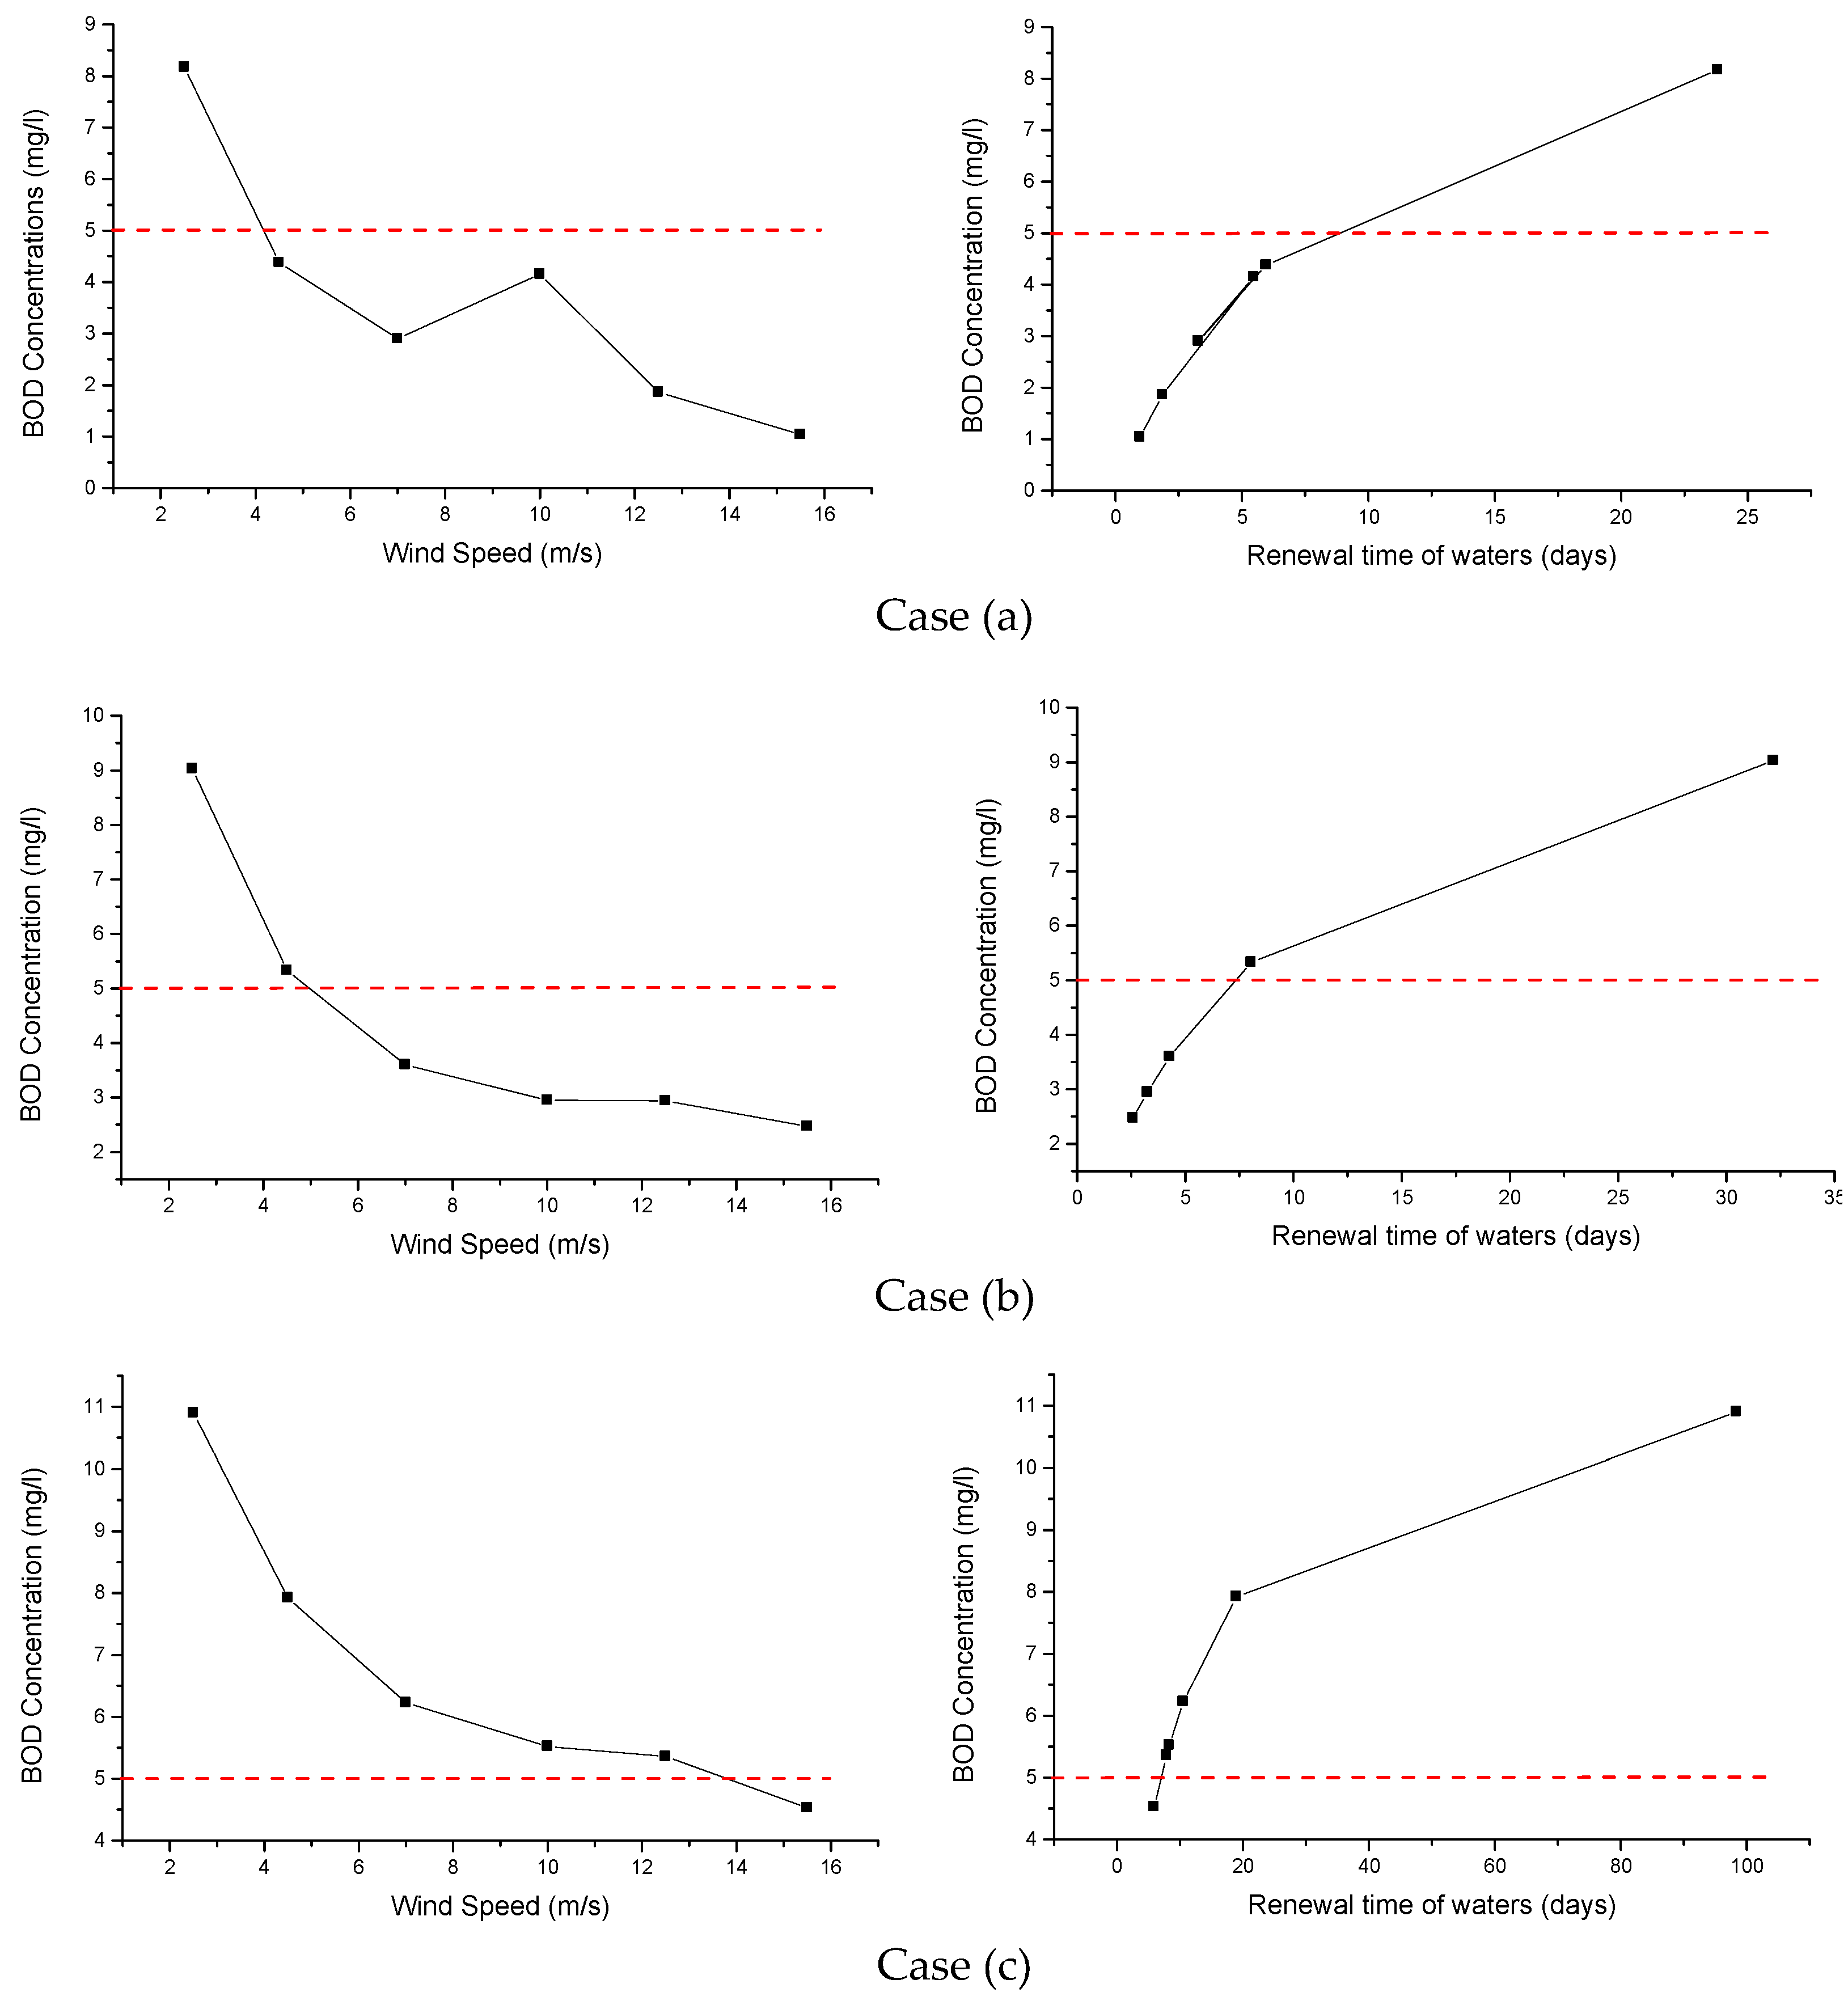
Low wind speeds, less than 2.5 m/s (2 Beaufort), lead to unacceptable values of BOD concentration (>5 mg/L) for all the cases of different formation of the opening. However, it seems that moderate winds (4–7 m/s) ensure acceptable values of BOD concentrations apart from the case of a 90 m mole centered in the opening of the harbor. The detailed statistical analysis of the meteorological data of the study area (winds’ frequency and speed), is the key process which will finally determine the right choice between different alternative cases.
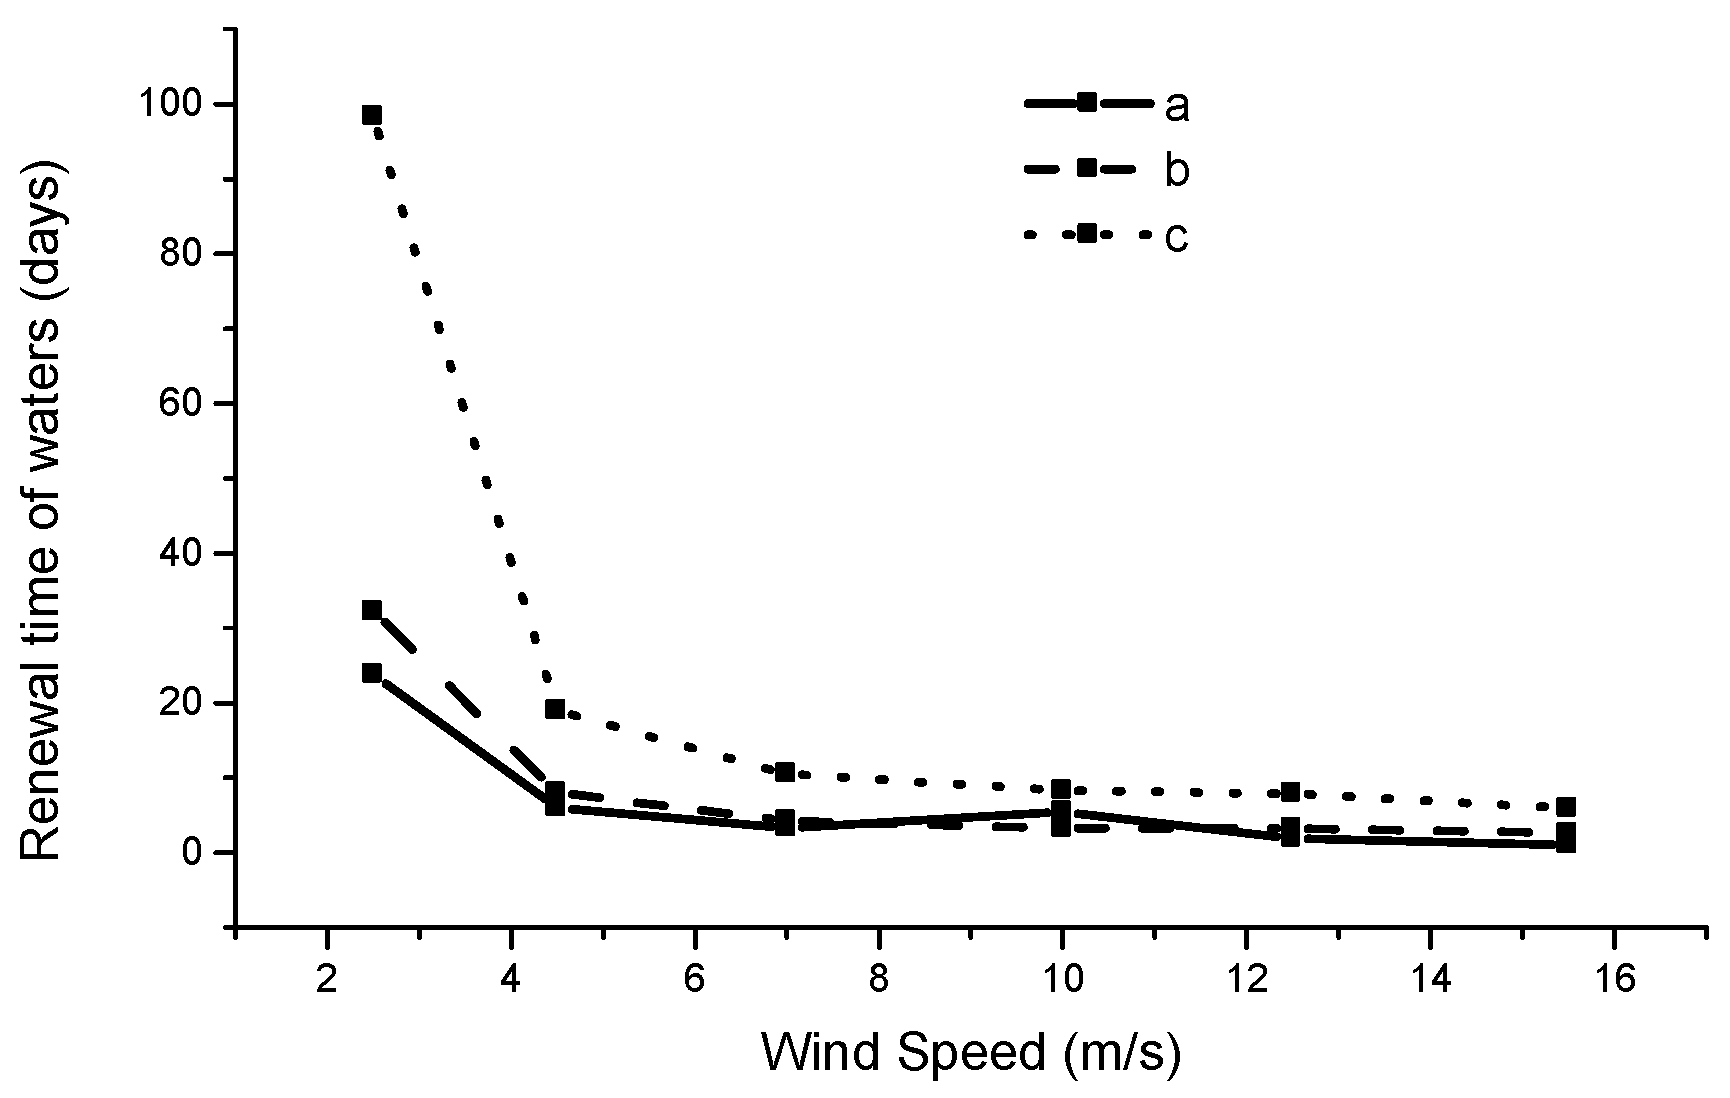
(2)
Large waters renewal times result, as expected, from low wind speeds and become even larger for the case of a 90 m mole in the opening; in fact, for this case, waters renewal times reach approx. 100 days for low wind speeds, becoming multiple of the ones corresponding to the case of free opening or the case of a 50 m mole centered in the opening. This result obviously leads to unpleasant and hazardous environmental situations.
(3)
Between the case of totally free opening and the partial closing of it with a mole of 50 m, it seems that the latter is the best possible technical solution since wave protection is also considered.

Author Contributions

G.P., E.K. and C.K. conceived and designed the experiments; G.P. and E.K. performed the experiments; Y.S. and C.K. developed and performed the numerical simulations; Y.S. analyzed the data; Y.S. and E.K. wrote the paper.

References

  1. Pechlivanidis, G.; Savvidis, Y.; Keramaris, E.; Koutitas, C. Investigation of the optimum connection of a fish pond with the adjacent main riverine flow. Procedia Eng. 2016, 162, 349–356. [Google Scholar] [CrossRef]
  2. Savvidis, Y.; Keramaris, E.; Pechlivanidis, G.; Koutitas, C. Optimum design of the entrance of a fishpond laterally to the main stream of an open channel. Environ. Sci. Pollut. Res. J. 2017, 24, 20122–20133. [Google Scholar] [CrossRef]
  3. Savvidis, Y.; Keramaris, E. Numerical study of particle transport in a river with a lateral harbor basin. Spec. Top. Rev. Porous Media—Int. J. Porous Media J. 2017, 8, 127–135. [Google Scholar] [CrossRef]
  4. Adrian, R.J. Particle-Imaging techniques for experimental fluid mechanics. Annu. Rev. Fluid Mech. 1991, 23, 261–304. [Google Scholar] [CrossRef]
  5. Raffel, M.; Willert, C.; Wereley, S.; Kompenhans, J. Particle Image Velocimetry: A Practical Guide; Springer: Berlin, Germany, 2007. [Google Scholar]
  6. Smagorinsky, J. General circulation experiments with the primitive equations. I. The basic experiment. Mon. Weather Rev. 1963, 91, 99–164. [Google Scholar] [CrossRef]
  7. Kougolos, A. Introduction in Environmental Engineering; Tziolas Thessaloniki: Thessaloniki, Greece, 2005; p. 344. (In Greek) [Google Scholar]
  8. Tchobanoglous, G.; Burton, F.L. Wastewater Engineering Treatment Disposal and Reuse, 3rd ed.; McGraw-Hill: New York, NY, USA, 1991; p. 1334. [Google Scholar]
  9. Savvidis, Y.; Georgiadis, C.; Datsi, E. Investigating the waters’ flushing of the inner basin of Nea Moudania Harbor (Northern Greece). J. Environ. Prot. Ecol. 2009, 10, 732–742. [Google Scholar]
  10. Beaufort Wind Force Scale. Available online: https://www.metoffice.gov.uk/guide/weather/marine/Beaufort-scale (accessed on 10 February 2018).
Figure 1. Experimental set-up: front and back sidelong view of the channel.
Proceedings 02 00575 g001
Figure 2. Different cases of free communication between the main channel and the lateral basin [from [2]).
Proceedings 02 00575 g002
Figure 3. The simulated coastal zone with the grid for the study of the hydrodynamics.
Proceedings 02 00575 g003
Figure 4. BOD for different values of wind speed and waters’ renewal time for the case of (a) a free opening, (b) a 50 m mole centred in the opening and (c) a 90 m mole centred in the opening.
Proceedings 02 00575 g004
Figure 5. Waters’ renewal time for different values of wind speed (case a, b, c).
Proceedings 02 00575 g005
Figure 6. Velocity field for wind 10 m/s over the area (for steady state conditions after 6 h) for the case of (a) a free opening, (b) a 50 m mole centred in the opening and (c) a 90 m mole centred in the opening. The values of the current velocity in m/s range according to the column in the right side of the figure.
Proceedings 02 00575 g006
Table 1. Wind Speed in Beaufort scale and corresponding values in m/s.
m/s2.54.571012.515.5
Beaufort234567
Publisher’s Note: MDPI stays neutral with regard to jurisdictional claims in published maps and institutional affiliations.

