Proceeding Paper

Hydrological Response of a Permeable Pavement Laboratory Rig for Stormwater Management †

1
School of Engineering and the Built Environment, Birmingham City University, Birmingham B4 7XG, UK
2
School of Energy, Geoscience, Infrastructure and Society (EGIS), Heriot-Watt University, Edinburgh EH14 4AS, UK
*
Author to whom correspondence should be addressed.
Presented at the 3rd EWaS International Conference on “Insights on the Water-Energy-Food Nexus”, Lefkada Island, Greece, 27–30 June 2018.
Proceedings 2018, 2(11), 607; https://doi.org/10.3390/proceedings2110607
Published: 1 August 2018
(This article belongs to the Proceedings of EWaS3 2018)

Abstract

:
Nowadays there is an increasing amount of everyday flood incidents around the world, the impact of which poses a challenge on the society, economy and environment. Under the Water Framework Directive (2000/60/EC), green infrastructure provided by sustainable drainage systems (SuDS) is the recommended policy to manage and treat storm water. This paper presents experimental work carried out in the laboratory on a permeable pavement rig, investigating mainly the short-term hydrology of the pavement, and the way that runoff percolates through the structure during simulated rainfall events. Results showed high flood mitigation capacity, encouraging further investigation of this type of SuDS.

1. Introduction

The growing demands of the construction of impervious surfaces, in order to meet the needs of public and personal vehicular and pedestrian transportation, result in increased surface runoff in the urban landscape [1]. This has a direct impact on the society, economy and environment, as impervious surfaces entail generation of greater proportions of storm water surface runoff, increase in the peak flows and decrease of the concentration time, overall resulting in more frequent flooding incidents all over the world. The current policy enforced to alleviate this situation is provided under the Water Framework Directive (2000/60/EC), stating that green infrastructure provided by sustainable drainage systems (SuDS) is the recommended policy to manage and treat storm water [2]. SuDS mimic nature to manage and treat storm water, and incorporates the benefits of managing quantity (flooding), quality (pollution) and biodiversity/amenity [3,4,5].
There are various forms of SuDS which help prevent flooding and clean up contaminants, including constructed wetlands, pervious pavements, green roofs, and ponds. Pervious pavements could play an important role in reducing flooding, as they constitute an everyday component of the urban landscape; in particular, two-thirds of the total rain amount that falls on impervious surfaces within urban catchments falls on pavements, which are liable for excessive runoff generation, containing a variety of contaminants, and groundwater recharge obstruction [6]. Application of pervious pavements is a popular practice the last decade both in Europe and in the USA [7,8]. In the UK, the systematic use of grass concrete installations and small-element permeable concrete blocks appeared in 1980′s, while it was in early 2000 that the usage of permeable block designs was commercially established in the market [3]. On the other hand, in Australia, permeable paving systems constitute an emerging technology, where several installations exist for more than 10 years [9].
As permeable pavements and particularly permeable interlocking concrete blocks (PICPs) constitute a relatively new technology applied in Europe, there is paucity of experimental data on the hydrological response of this particular structure. To bridge this gap, this paper presents the experimental work carried out in the laboratory on a permeable pavement rig, testing concrete blocks (also known as interlocking concrete), overall investigating the hydrological performance of the structure. This study focuses particularly on the short-term hydrology of the pavement, and on the way that runoff percolates through the structure during a range of different rainfall events.

2. Materials and Methods

This section describes the materials and methods employed to achieve the tests. The overall aim of this experiment was to collate empirical data in order to understand the hydrological performance of the permeable pavement. It is noteworthy that evaporation from the permeable surface during the rainfall was negligible, due to the indoors nature of this experiment. For each test, rainfall duration, rainfall volume, and drainage volume were considered. The retention time and storage volume of the structure were computed, by monitoring the inflow and outflow readings.

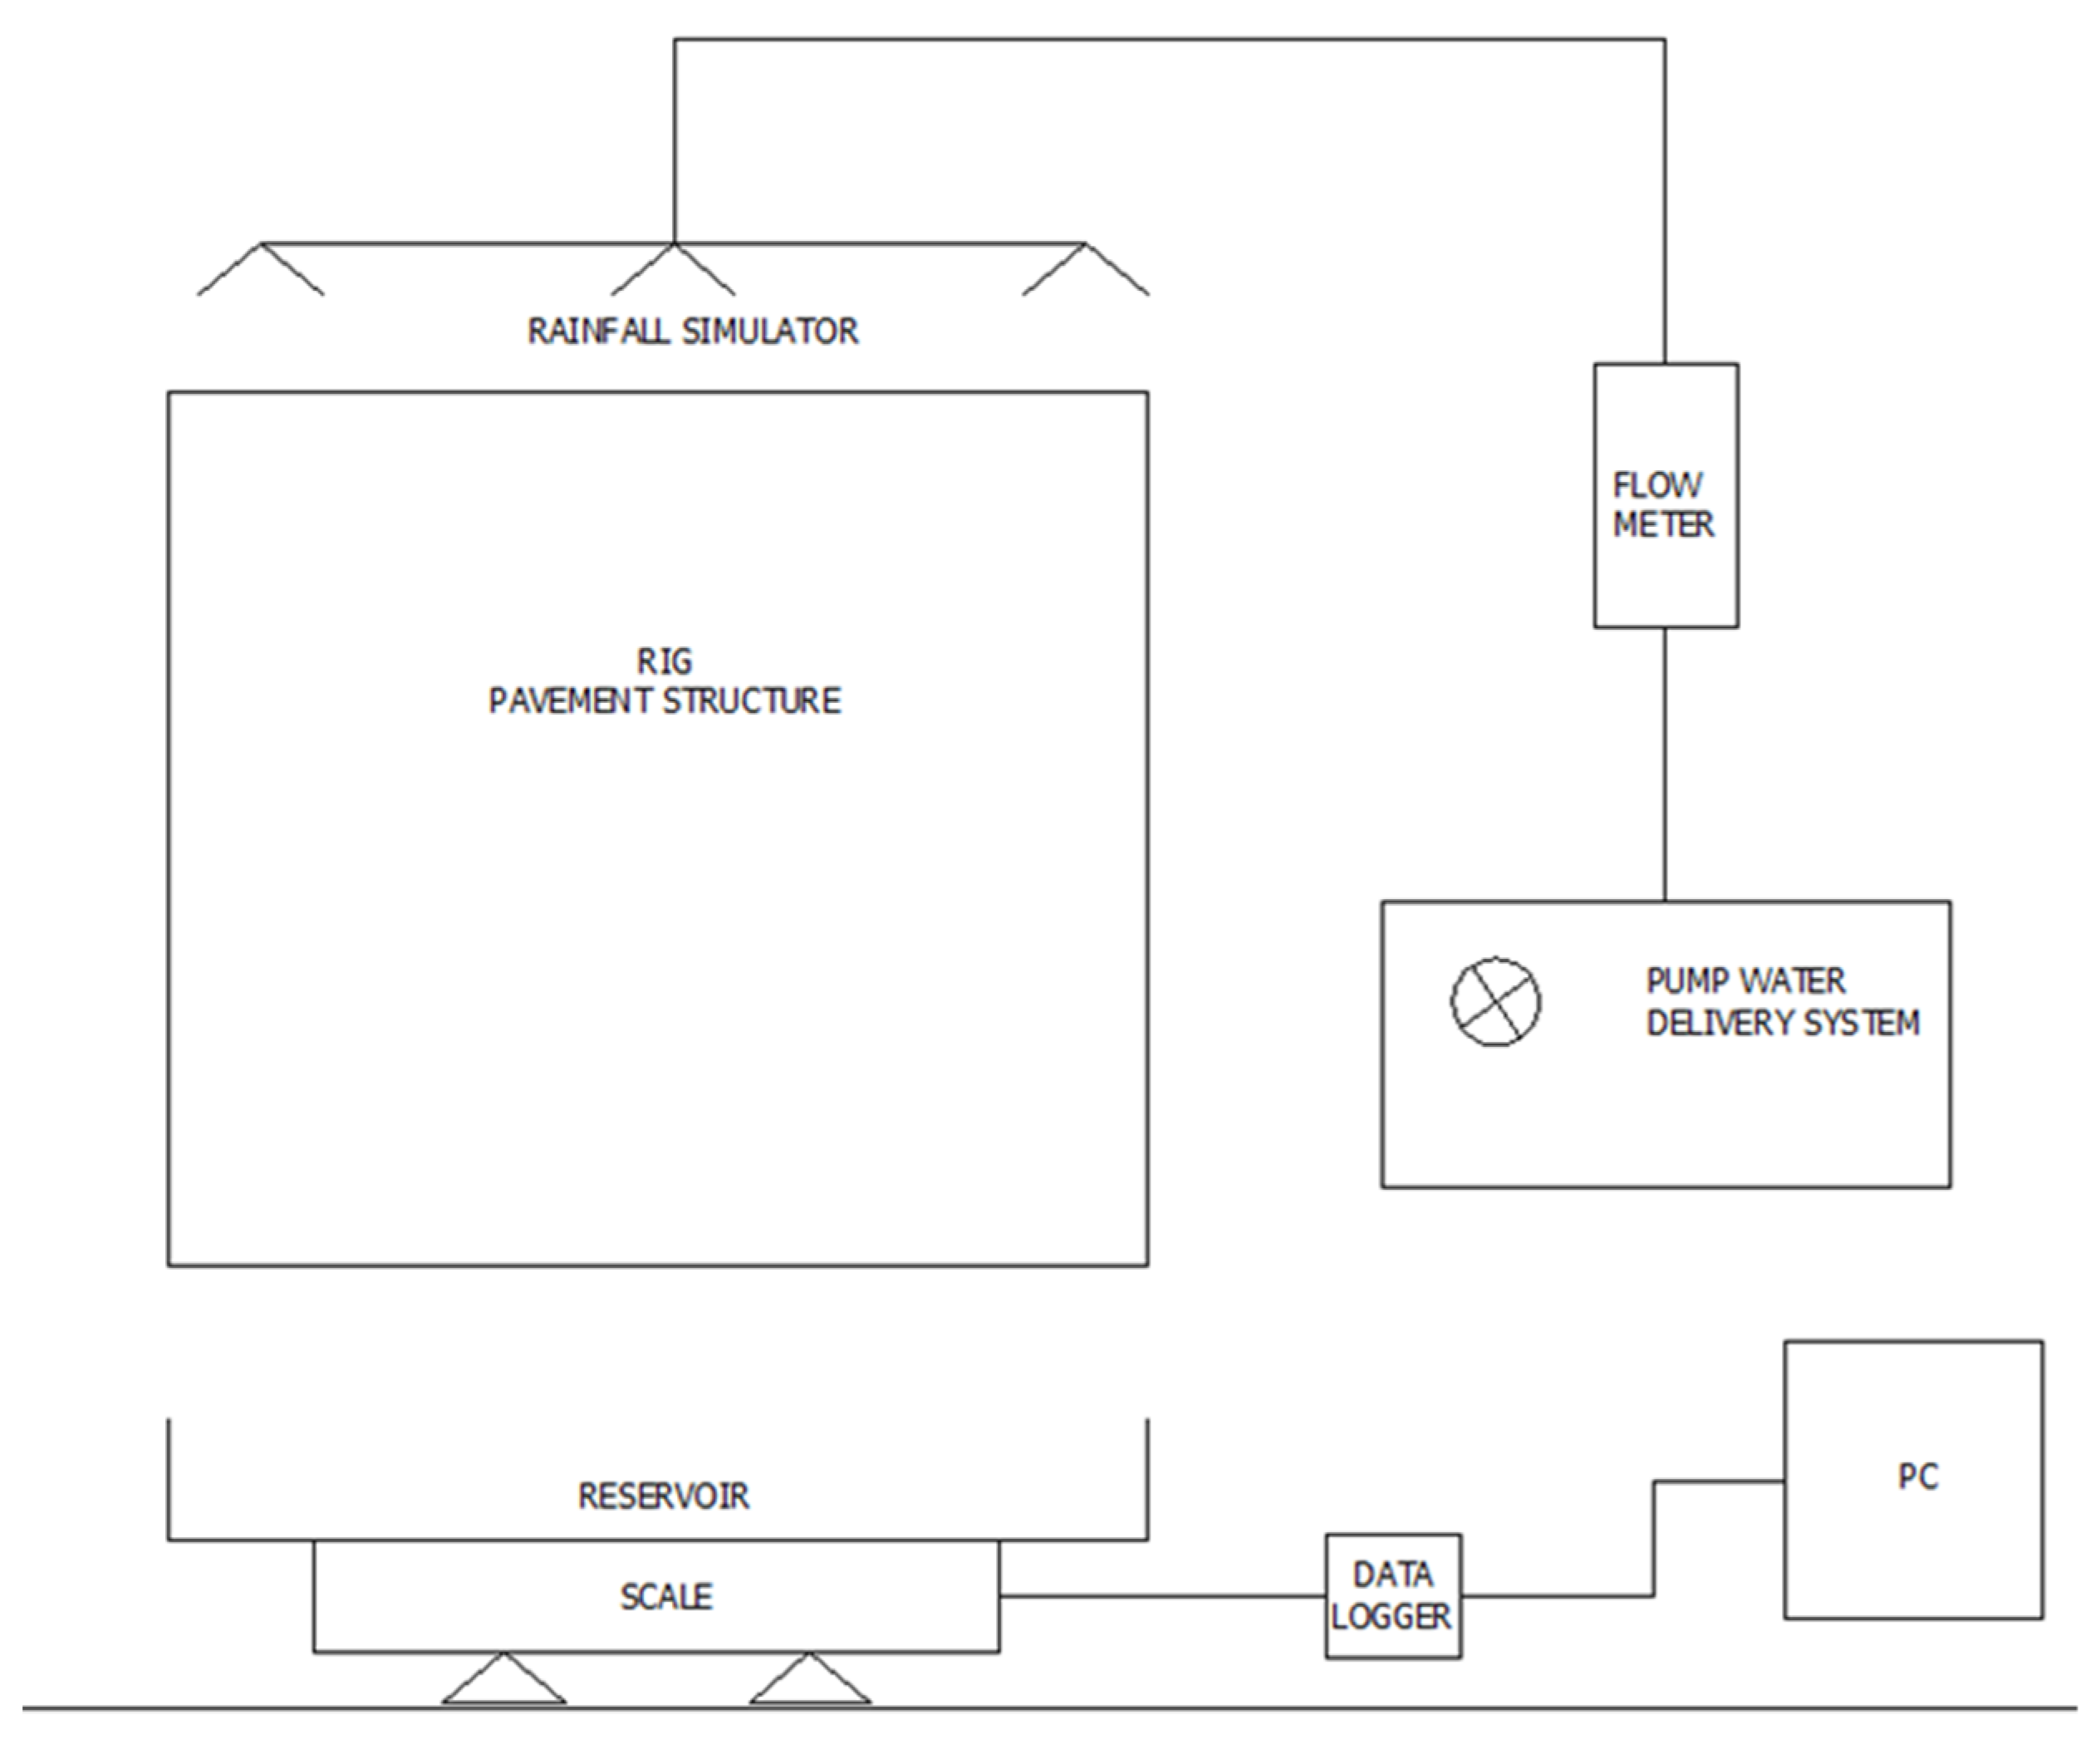
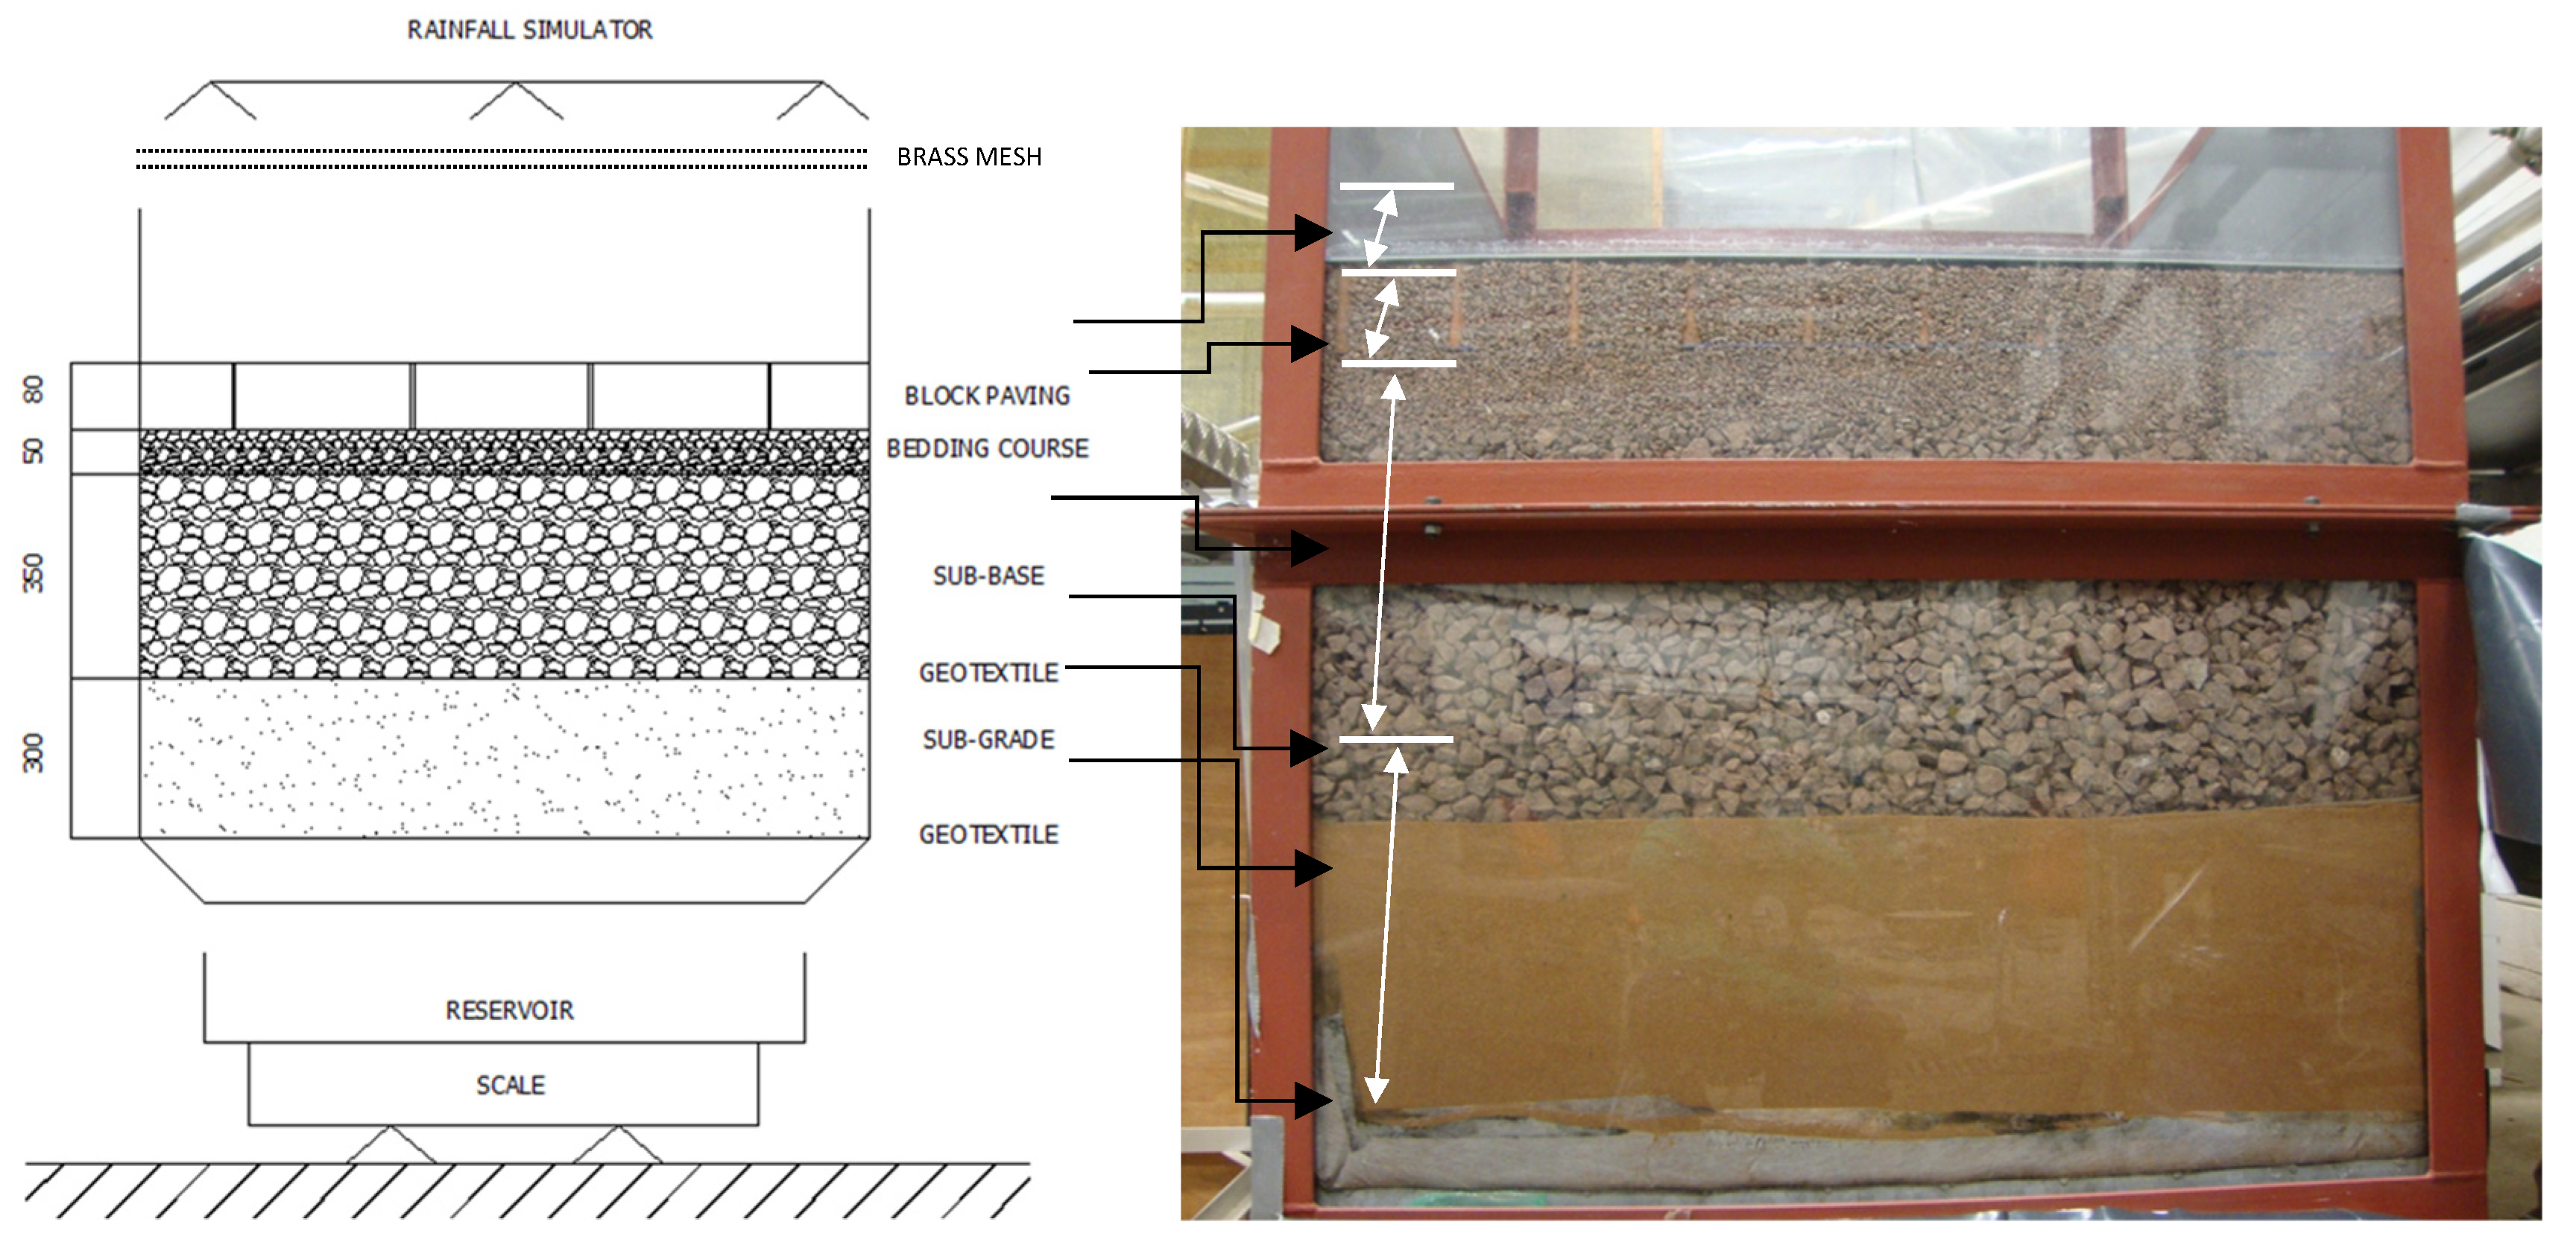
2.1. Experimental Setup-Apparatus

The entire experimental setup is illustrated in Figure 1. Water was delivered by a pump system. A rainfall simulator, consisting of nine uniformly spaced sprayers, was set up above the pavement surface. The applied rainfall intensities were collected by a flow meter. The water filtrating through the pavement layers was collected in a steel reservoir at the bottom of the rig setup (see Figure 1), where it was weighed by a scale. The reservoir capacity was 60 L. The data was measured by a CR800 data logger (Campbell Scientific, Logan, UT, USA). The pavement was assumed to have zero slope, and evaporation losses were assumed to be negligible, due to the indoors nature of the experiment.
In the sub-grade layer, eight time-domain reflectometry (TDR) probes (CS650-Campbell Scientific) were installed to measure the moisture content (MC) every 30 s, transferring the data to the data logger. The MC probes were placed at two levels in the sub-grade, with an arrangement of five probes located at the upper layer (i.e., at 75 mm) and three at the bottom layer (i.e., at 225 mm). Furthermore, temperature (T) and relative humidity (RH) data of the lab environment were collected at a rate of every 30 s.
The rainfall simulator had a layout of 9 sprayers, arranged by 3 × 3 in space. A dense brass mesh was placed between the sprayers and the pavement surface in order to attain the necessary rain fall droplet intensity.

2.2. Experimental Materials

The experimental testing was carried out on a one-meter square of permeable pavement in the hydraulics lab at Heriot-Watt University. The permeable pavement was constructed in a box made of strong polypropylene and supported by a steel frame. The rig dimensions were 116 cm × 100 cm × 100 cm, with one side made of Perspex to allow visibility of the thickness of materials and the layout of the pavement structure, as shown in Figure 2. The construction complied with British Standards [10,11] and with the standard specification used by Marshalls for their Priora Paving System. Artificial rainfall was delivered through spray nozzles (Delavan) and measured via a CR800 data logger (Campbell Scientific). The pavement rig was divided into four layers, as illustrated in Figure 2, comprising:
  • Impermeable rectangular concrete modules (Priora), 80 mm thickness, and 200 mm × 100 mm dimensions
  • Bedding course, 50 mm thickness
  • Sub-base layer, 350 mm thickness
  • Sub-grade layer, 300 mm thickness
  • A Geotextile (1 mm thickness) was placed between sub-base and sub-grade to prevent from migration of sand into course aggregate, and over the stainless steel outflow tank.

2.3. Experimental Procedure

The experimental process involved repeatable rainfall events, and application of a fixed rainfall intensity and duration. The rainfall simulation was repeated over four weeks, with a duration of 15 min. The simulated rainfall events were conducted over a seven-day cycle. The sequence of the rainfall simulations was once per day between Tuesday and Friday (days 2 to 5), with zero rainfall on days 1, 6 and 7 (namely Monday and weekend). The selected rainfall intensity was I = 25.56 L/h = 426 mL/min, which is representative for Edinburgh city, selected for the Heriot-Watt University site from the Flood Estimation Handbook (FEH).
In order to determine the amount of moisture that each layer of the rig is able to hold, laboratory investigation was undertaken. In particular, samples of one block, and samples of some amount of fine aggregate, coarse aggregate and sand were collected and tested in the Geotechnical Laboratory at Heriot-Watt University. The materials were baked in the oven for 24 h, followed by weighing the mass of each specimen on a scale. Subsequently, the materials were submerged in water for 24 h, so that they become sufficiently wet. Then, the wet materials were left for half an hour out of the water, so that the extra water was drained off, and each sample was weighed. The difference between the wet and dry mass of each material gave the estimated moisture content uphold of each material.

3. Results and Discussion

3.1. Initial Condition of the Sub-Grade

As described in Section 2.1, the moisture content (MC) was measured at two different levels within the sub-grade. The MC or Volumetric Water Content (VWC) in the sub-grade layer constitutes a representative index of the level of dryness of the materials. From the overall eight probes installed in the sub-grade, VWC results of the top (probe 1) and bottom level (probe 8) are presented in Figure 3. The results of the VWC (see Figure 3) show that VWC responded to a rainfall event at the start of week 3, between 12th and 13th of July (indicated in Figure 3 by the dashed vertical line). Until that time, VWC gradually increased during each storm event. It is inferred that the sub-grade was quite dry during the first two weeks of rainfall simulations, as demonstrated by the lack of discharge in the outflow until the eighth rainfall event. This is explained by the fact that the pavement structure experienced a preceding long dry period of six months. The results of this study indicate that rainfall response is linked to the sub-grade conditions, and support the implementation of such structure in drier countries.

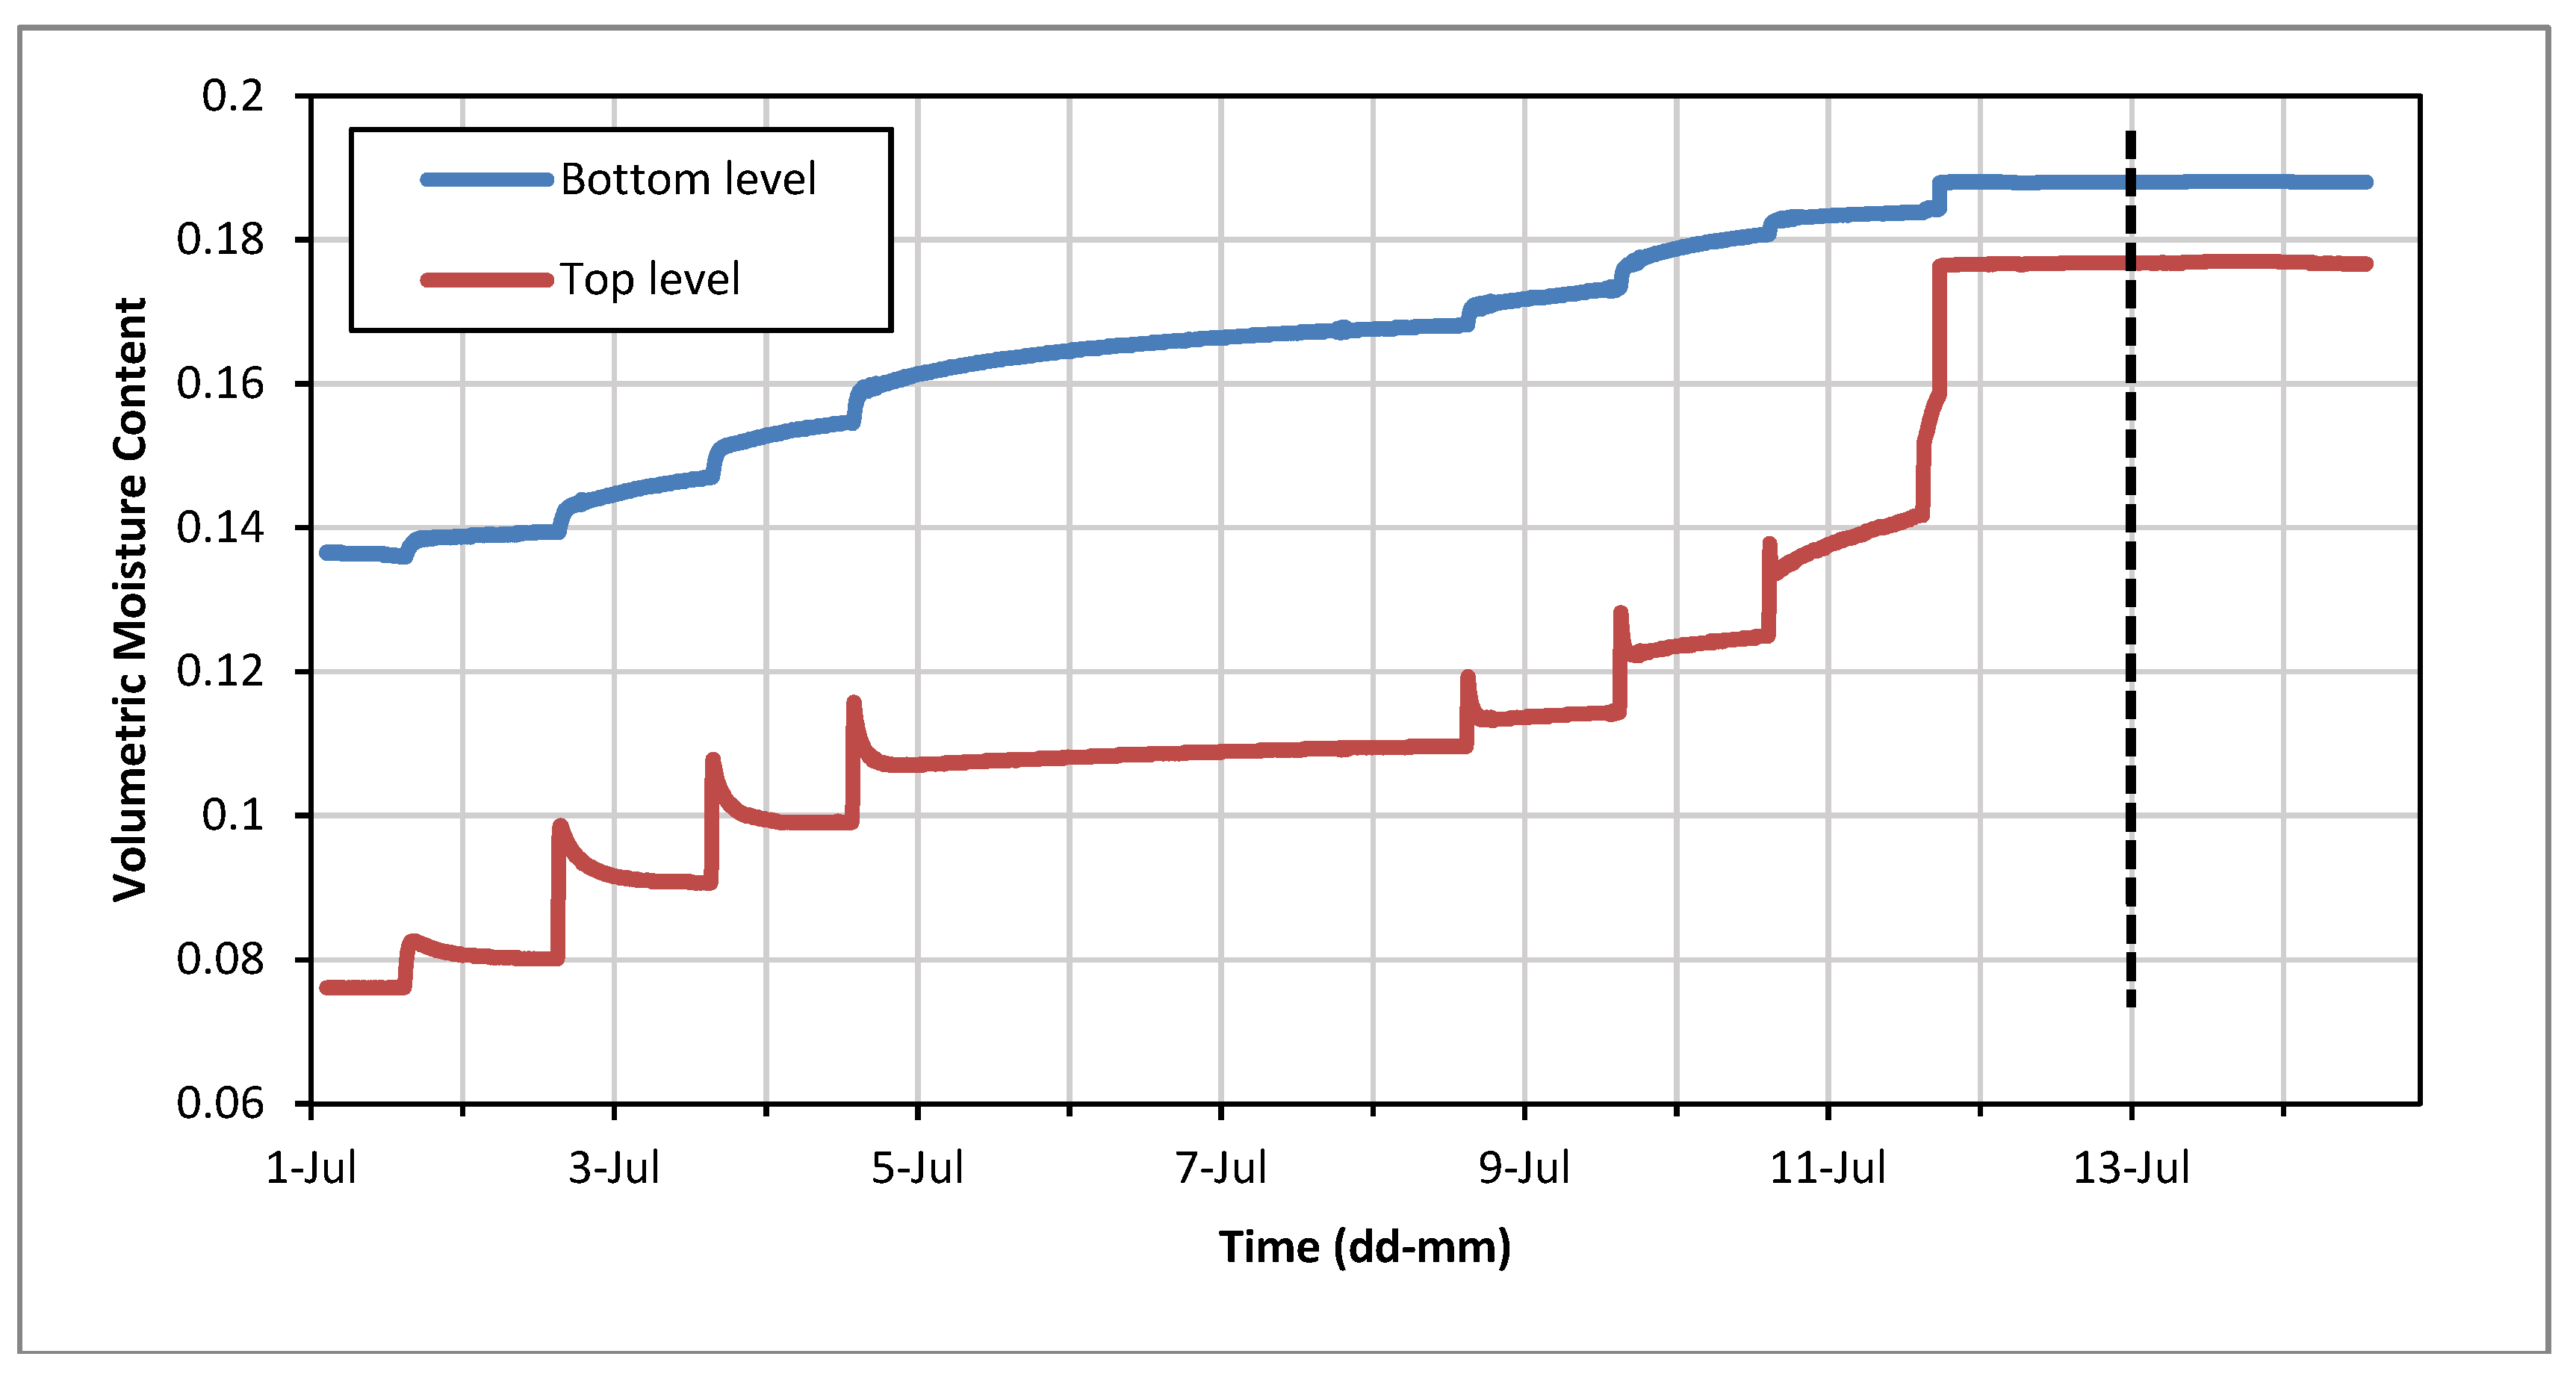
3.2. Moisture Content Retention by the Materials of the Rig

Investigation was undertaken to identify the potential moisture uptake by the materials of the rig before the first runoff production, as described in Section 2.3. The results obtained are listed in Table 1, and procedure is detailed in the Appendix.
It is concluded that sand displays high MC retention capacity in comparison with the block layer and the aggregate layer.
The rig produced no outflow during the first two weeks of experiments (i.e., total inflow till the end of week 2 was 51.12 L). This interesting result could be considered as the first response of the materials attributable to the prolonged dry period that the pavement structure experienced; in particular, it could be considered as a recovery period for the MC levels, since the rig received no inflow for approximately six months. Consequently, the MC had dropped significantly, and thus all the amount of water was absorbed by the dry materials until their started being saturated.
Overall, the total water uptake of the rig was estimated to be 60.2 L. The total water inflow until the first outflow production was: 6.39 (L) × 8 (rainfall events) = 51.12 L, which is close to the total water uptake estimate. The difference in the result is possibly attributed to the time required for the saturated samples of the materials to evaporate/drain some portion of the water that has remained on them. After their submersion into water for 24 h, the samples were let to drain off the water for 0.5 h; it is inferred that this time was not sufficient for the water to evaporate or to drain adequately off their surface, therefore affecting the final estimate value.

3.3. Hydrological Performance
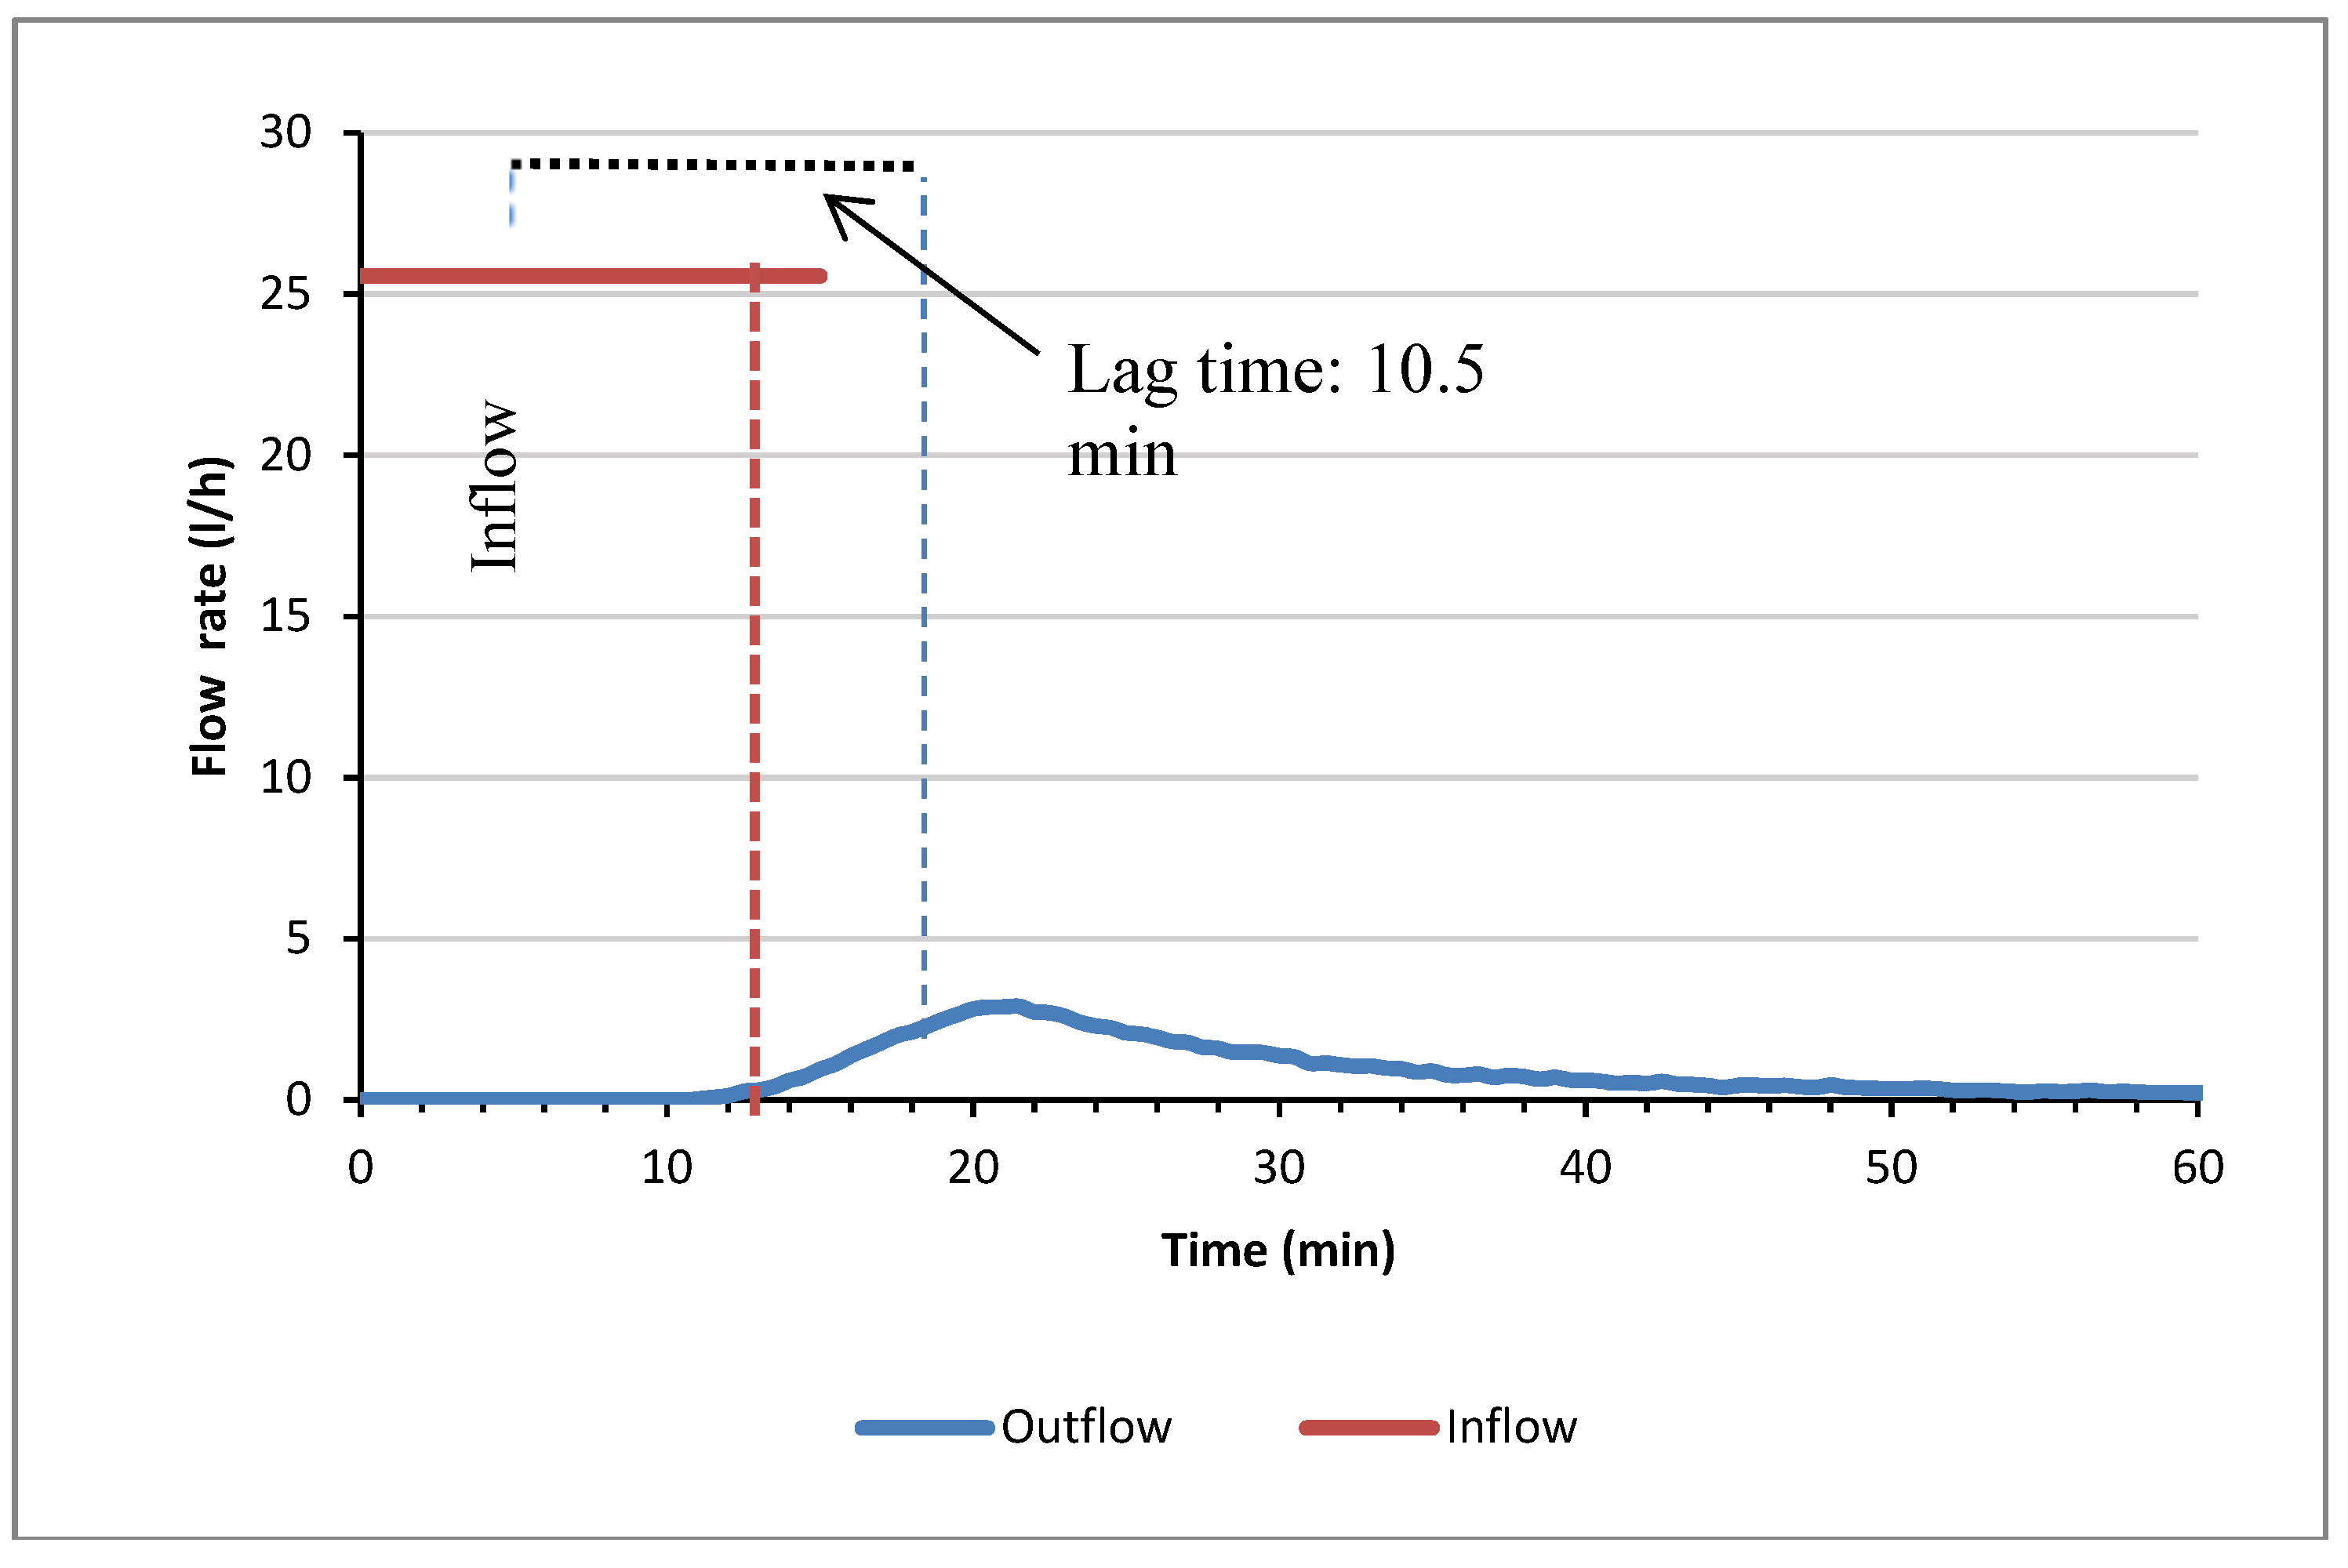
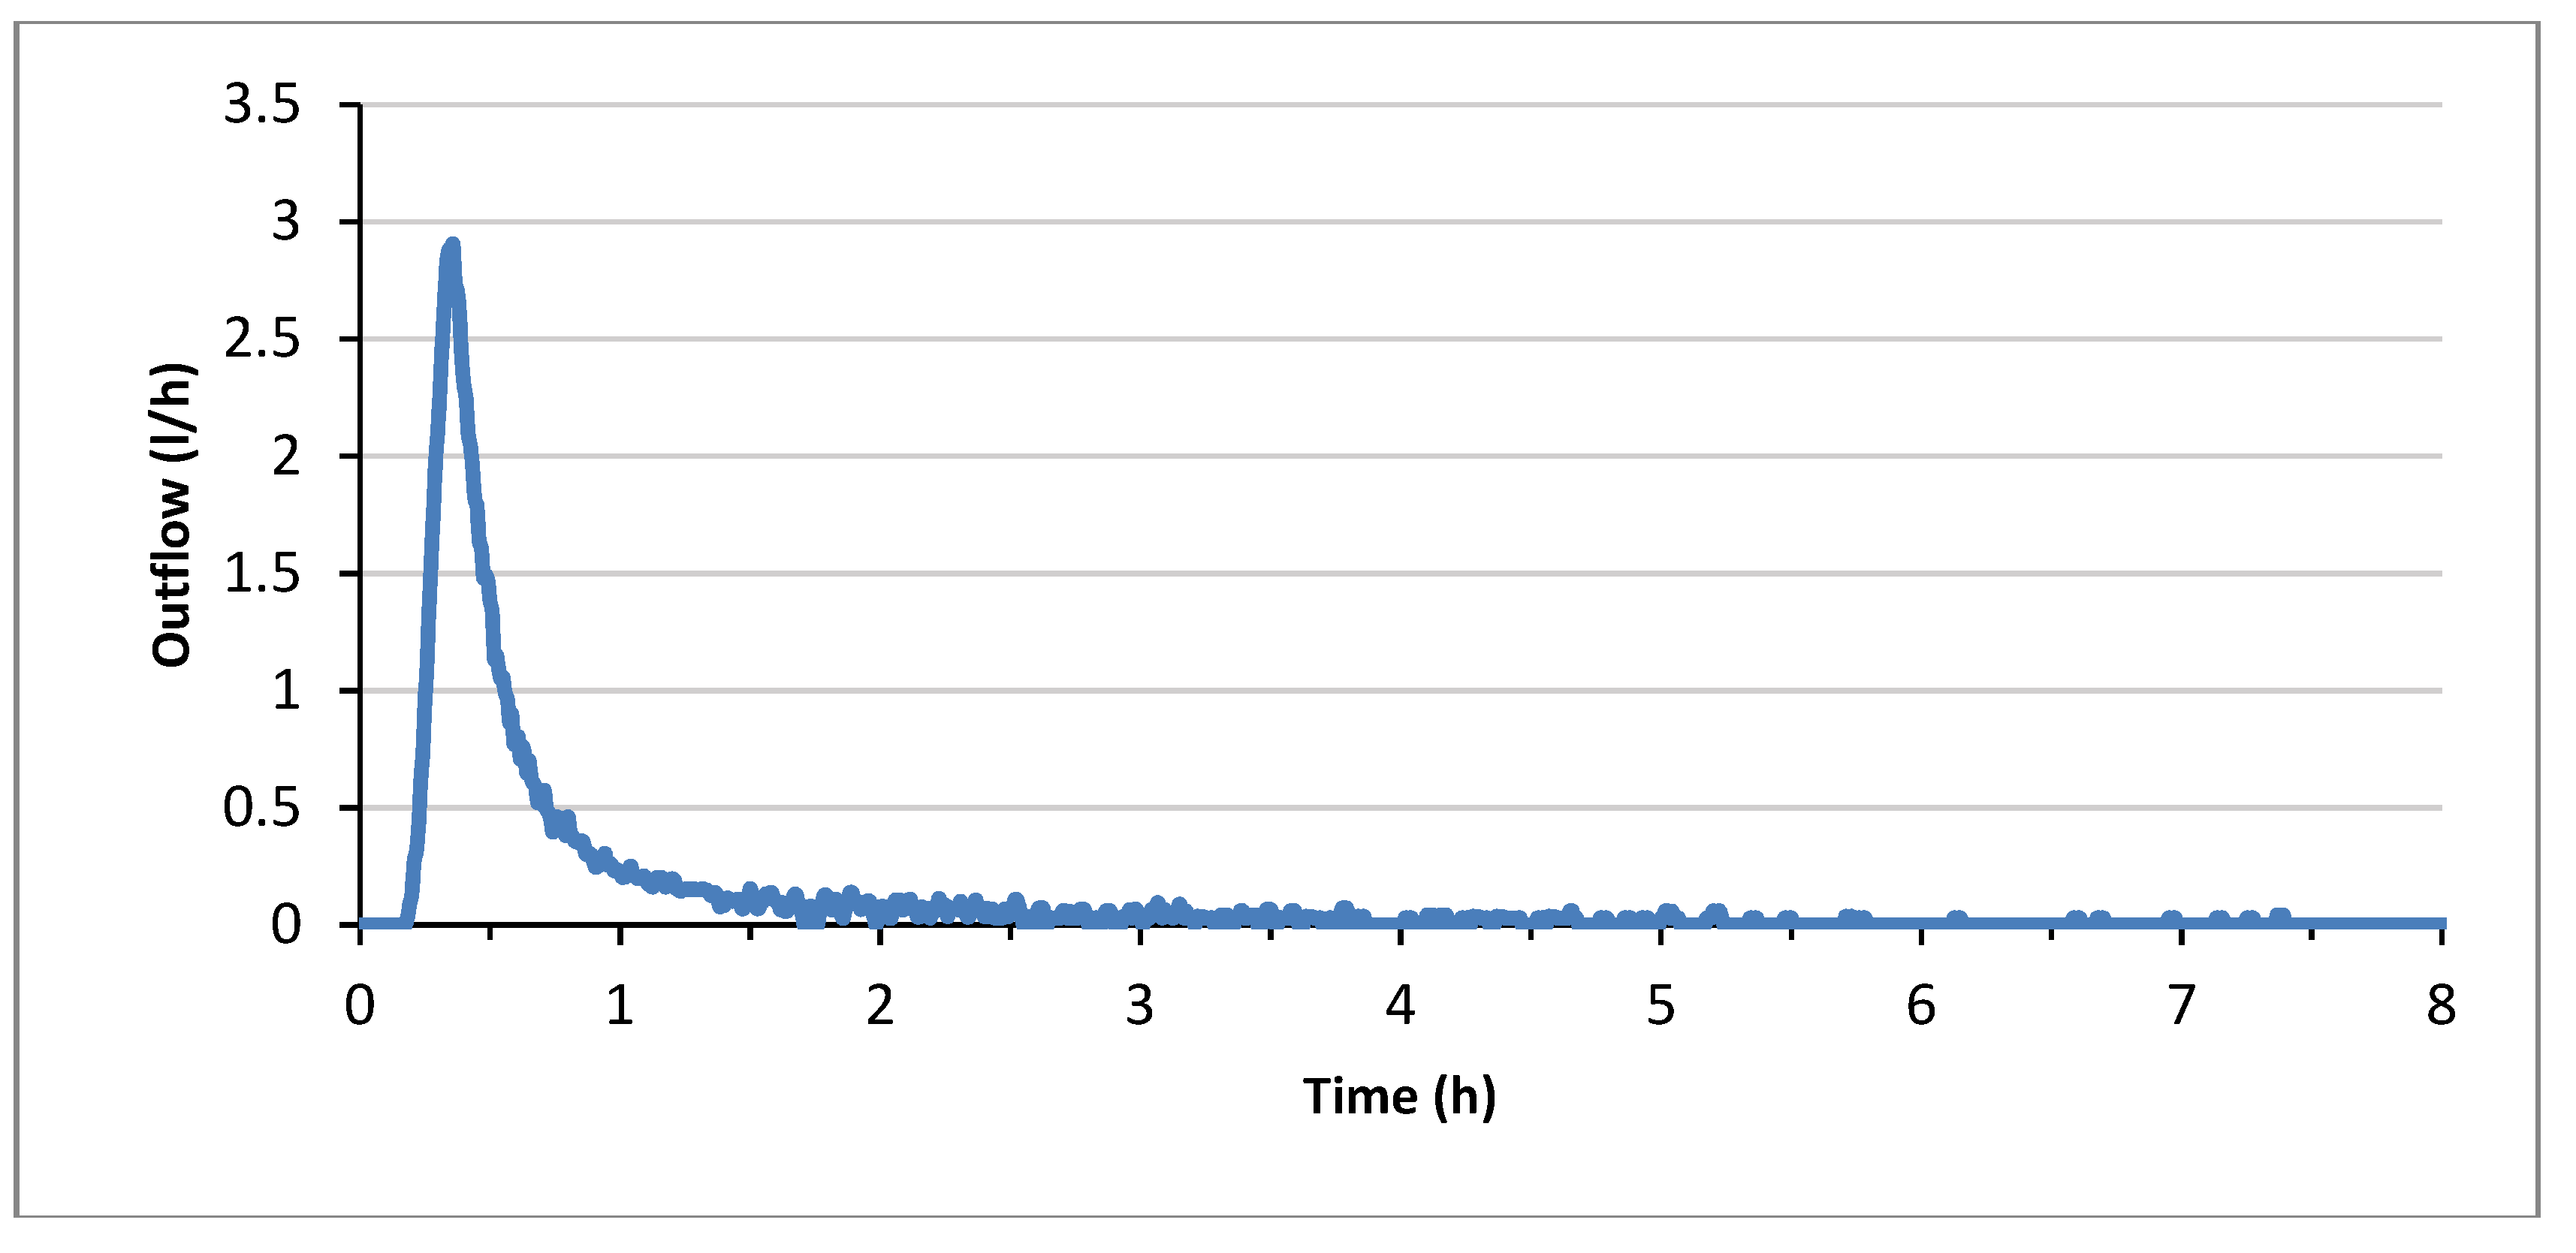
In total, sixteen storm event simulations were undertaken on the permeable pavement. The pavement required nine rainfall events to produce the first outflow. This resulted from the prolonged period that the pavement remained dry. During ninth event of week 3 of the experiments, outflow commenced approximately ten minutes after the rainfall start.

3.3.1. Hydrograph

Figure 4 illustrates the lag time between the inflow and the peak of the outflow, as well as the runoff reduction and the attenuation capacity of the permeable structure for the first outflow produced in week 3 day 2. Furthermore, Figure 4 shows the typical hydrograph produced for the tested rainfall intensity. The outflow lasted for approximately 7 h after the rainfall stopped, as seen in Figure 5. This result demonstrates the high attenuation attributes of the permeable pavement structure.

3.3.2. Total Volume Analysis

It was anticipated that results during the two weeks of outflow (i.e., weeks 3 and 4) would show some difference, due to the gradual saturation of the pavement structure, which was previously totally dry (i.e., no outflow during weeks 1 and 2). The first eight storm events produced zero outflow, because storm water was completely absorbed by the pavement materials. Outflow volume analysis, described in this section, indicates gradual increase of the storm attenuation capacity between testing weeks 3 and 4.
The average outflow for the tested rainfall intensity (i.e., 25.56 L/h) was analysed, as presented in Table 2. Note that day 1 (i.e., Monday) included no storm event; days 2–5 (i.e., Tuesday–Friday) included storm simulations. The last column in Table 2 indicates the mean volume drained as a percentage of the total rainfall volume (i.e., 6.39 L). Results show that the amount of water discharged from the pavement between weeks 3 and 4 ranged from 16.52% to 77.30% of the total rainfall volume applied. These results are in agreement with those stated by [12], who found an average value of 67% of rainfall to be drained. Results of Table 2 demonstrate the performance of the pavement rig to effectively abate storm water runoff resulting from rainfall events.
During week 3, the outflow displayed an increasing trend successively after each rainfall event. The average peak outflow in week 3 was approximately 6.6 L/h with a mean duration of approximately 11.25 h. Similarly, outflow in week 4 exhibited an increasing route, albeit smoother compared to week 3. The average peak outflow for week 4 was estimated at 10.1 L/h. During week 4, outflow required 6–7 min to be generated after the start of the rainfall simulation. The storm attenuation duration on day 2 of week 4 lasted approximately 6 h, and gradually increased to 14 h until day 5, week 4.
The mean attenuation duration during weeks 3 and 4 was approximately 10.5 h, which demonstrates the advantageous capability of the interlocking concrete blocks permeable pavement to reduce the peak concentration time and to mitigate storm water runoff. The total (cumulative) volume discharged at the end of week 3 was approximately 12 L, whilst in week 4 it was 14.9 L. The start delay of the outflow for the least wet event (week 3, day 1) was approximately 10 min, whilst it decreased to 6 min within the same week, when the initial pavement conditions became wetter. This indicates the capacity of the pavement structure to perform fine in wetter conditions.

4. Conclusions

Storm water storage capacity and long attenuation period following a storm are important parameters for SuDS design and operation. This paper presented empirical data and findings from a permeable pavement rig collected in the laboratory. The experiments quantified and assessed the hydrological performance of the permeable pavement rig made of interlocking concrete blocks, for a certain rainfall intensity and duration. The conclusions drawn from this study were:
  • High storm water attenuation ability of the pavement was demonstrated by the mean outflow duration of 10.5 h after the rainfall event.
  • More than 50% of the total rainfall volume, including all rainfall events tested that produced outflow, were retained within the permeable pavement structure.
  • The response of the outflow varied with pavement condition. Prolonged dry periods of months result in decreasing the moisture content of the pavement materials, producing no outflow after several rainfall events. This finding supports permeable pavements’ application into drier countries. Greater outflow was produced from the structure once the pavement wetness increased.

Author Contributions

V.I. performed the experiments, analyzed the data, and wrote the paper. S.A. supervised the project, contributed substantially to the data analysis, authorized permission to access the laboratory facilities and facilitated this study to run.

Acknowledgments

The authors gratefully acknowledge A. Majed’s invaluable support, kind collaboration, and permission to access the laboratory facilities and equipment; the technical support from the laboratory staff in the School of EGIS; and Marshalls Limited for providing material for the testing rig described in this paper.

Conflicts of Interest

The authors declare no conflict of interest. The founding sponsors had no role in the design of the study; in the collection, analyses, or interpretation of data; in the writing of the manuscript, and in the decision to publish the results.

Appendix A

The analytical steps followed for the estimation of the water uptake by each layer of the rig is described as follows:
  • Step 1: Estimation of the water uptake of the block layer. The experimental rig consisted of 50 blocks. According to the results of Table 1, each block can retain 129 g of water. Consequently, the blocks’ layer can hold overall: 129 (g) × 50 = 6450 g = 6.45 kg.
  • Step 2: Estimation of a known volume of a container which will assist to measure the weight and volume of the remaining layers. The volume of the container used for this purpose was: Vc = 27 × 14 × 8 = 3,024 cm3.
  • Step 3: Estimation of the volume and weight of the fine aggregate layer. The volume of the fine aggregate layer was: 5 × 100 × 100 cm3 = 50,000 cm3. The volume of the fine aggregate layer accommodates the volume of the container 16.5 times. The weight of the container filled up with fine aggregate was: W1 = 3.435 kg. As a result, the total weight of the fine aggregate of the rig was: Wfine_aggr_total = 3.435 × 16.5 = 56.7 kg. According to the results of Table 1, 466 g of the dry fine aggregate can hold 13 g of water; consequently, the total mass of the dry aggregate in the rig can retain 8064.6 g = 1.58 kg of water.
  • Step 4: Estimation of the volume and weight of the aggregate layer. The volume of the aggregate layer was: Vaggr = 35 × 100 × 100 cm3 = 350,000 cm3. The volume of the aggregate layer accommodates the volume of the container 115.7 times. The weight of the container filled up with aggregate was: W2 = 3.771 kg. As a result, the total weight of the aggregate of the rig was: Waggr_total = 3.771 × 115.7 = 436.3 kg. Based on Table 1, 427.4 g of the dry aggregate can hold 7.9 g of water; therefore, the total mass of the dry aggregate in the rig can retain 8064.6 g = 8.07 kg of water.
  • Step 5: Estimation of the volume and weight of the sand layer. The volume of the sand layer was: Vsand = 30 × 100 × 100 cm3 = 300,000 cm3. The volume of the sand layer accommodates the volume of the container 99.2 times. The weight of the container filled up with aggregate was: W3 = 4.387 kg. Therefore, the total weight of the aggregate of the rig was: Wsand_total = 4.387 × 99.2 = 435.19 kg. According to Table 1, 276.3 g of the dry sand can hold 28 g of water; hence, the total mass of the dry sand in the rig can retain 44101.77 g = 44.10 kg of water.

References

  1. Sansalone, J.; Kuang, X.; Ranieri, V. Permeable Pavement as a Hydraulic and Filtration Interface for Urban Drainage. J. Irrig. Drain. Eng. 2008, 134, 666–674. [Google Scholar] [CrossRef]
  2. European Commission. Towards Better Environmental Options in Flood Risk Management. 2018. Available online: http://ec.europa.eu/environment/water/flood_risk/better_options.htm (accessed on 21 January 2018).
  3. Pratt, C.; Wilson, S.; Cooper, P. Source Control Using Constructed Pervious Surfaces—Hydraulic, Structural and Water Quality Performance Issues; CIRIA C582; Construction Industry Research and Information Association (CIRIA): London, UK, 2002. [Google Scholar]
  4. Woods-Ballard, B.; Kellagher, R.; Martin, P.; Jeffries, C.; Bray, R.; Shaffer, P. The SUDS Manual; CIRIA C697; CIRIA: London, UK, 2007. [Google Scholar]
  5. Available online: https://www.crew.ac.uk/sites/default/files/sites/default/files/publication/CREW_NFMProject_SUDS.pdf (accessed on 31 July 2018).
  6. Lucke, T.; Beecham, S. Field investigation of clogging in a permeable pavement system. Build. Res. Inf. 2011, 39, 603–615. [Google Scholar] [CrossRef]
  7. Pagotto, C.; Legret, M.; Le Cloirec, P. Comparison of the hydraulic behaviour and the quality of highway runoff water according to the type of pavement. Water Res. 2000, 34, 4446–4454. [Google Scholar] [CrossRef]
  8. Brown, C.; Chu, A.; van Duin, B.; Valeo, C. Characteristics of Sediment Removal in Two Types of Permeable Pavement. Water Qual. Resour. J. 2009, 44, 59–70. [Google Scholar] [CrossRef]
  9. Beecham, S.; Pezzaniti, D.; Kandasamy, J. Stormwater treatment using permeable pavements. Water Management 2012, 165, 161–170. [Google Scholar] [CrossRef]
  10. British Standards Institution. Aggregates for Unbound and Hydraulically Bound Materials for Use in Civil Engineering Work and Road Construction; BS EN 13242:2003; BSI: London, UK, 2003. [Google Scholar]
  11. British Standards Institution. Pavements Constructed with Clay, Natural Stone or Concrete Pavers Part 13: Guide for the Design of Permeable Pavements Constructed with Concrete Paving Blocks and Flags, Natural Stone Slabs and Setts and Clay Pavers; BS 7533-13:2009; BSI: London, UK, 2009. [Google Scholar]
  12. Abbott, C.; Comino-Mateos, L. In-situ hydraulic performance of a permeable pavement sustainable urban drainage system. Water Environ. J. 2003, 17, 187–190. [Google Scholar] [CrossRef]
Figure 1. The entire experimental setup.
Proceedings 02 00607 g001
Figure 2. (Left) Schematic of the vertical cross-section of the rig pavement illustrating the total vertical installation. Dimensions on vertical axis are in mm; (Right) Picture of cross-section of the pavement structure.
Proceedings 02 00607 g002
Figure 3. Levels of VMC for weeks 1 and 2 of the experimental period.
Proceedings 02 00607 g003
Figure 4. Typical hydrograph for the tested rainfall intensity, also indicating the lag time between inflow and outflow, week 3, day 2.
Proceedings 02 00607 g004
Figure 5. Outflow rate (L/hr) for the first outflow event, week 3, day 2.
Proceedings 02 00607 g005
Table 1. Results of the experiment of the moisture content retention by the materials of the rig.
MaterialDry Mass (g)Wet Mass (g)Moisture Content (g)Moisture Content (%)
Block3257.53386.51293.8
Fine aggregate466.0489.0132.7
Aggregate427.4435.37.91.8
Sand276.3304.3289.2
Table 2. Outflow characteristics, including outflow amount and duration, and start delay, associated to the pavement conditions for the tested rainfall intensity.
Testing WeekPavement ConditionAverage Outflow (L)Average Outflow Duration (h)Average start Delay (min)Average Outflow % Rainfall Volume
3Day 10000.00
3Day 21.055710.516.52
3Day 33.116107.048.77
3Day 43.832126.059.97
3Day 54.072146.563.73
4Day 10000.00
4Day 22.17666.034.06
4Day 33.60097.056.28
4Day 44.170126.565.26
4Day 54.939146.077.30
Publisher’s Note: MDPI stays neutral with regard to jurisdictional claims in published maps and institutional affiliations.

