Proceeding Paper

Probability Estimation of Change Maps Using Spectral Similarity †

School of Surveying and Geospatial Engineering, College of Engineering, University of Tehran, 1417466191 Tehran, Iran
*
Author to whom correspondence should be addressed.
Presented at the 3rd International Electronic Conference on Remote Sensing, 22 May–5 June 2019; Available Online: https://sciforum.net/conference/ecrs-3.
Proceedings 2019, 18(1), 8; https://doi.org/10.3390/ECRS-3-06183
Published: 4 June 2019
(This article belongs to the Proceedings of 3rd International Electronic Conference on Remote Sensing)

Abstract

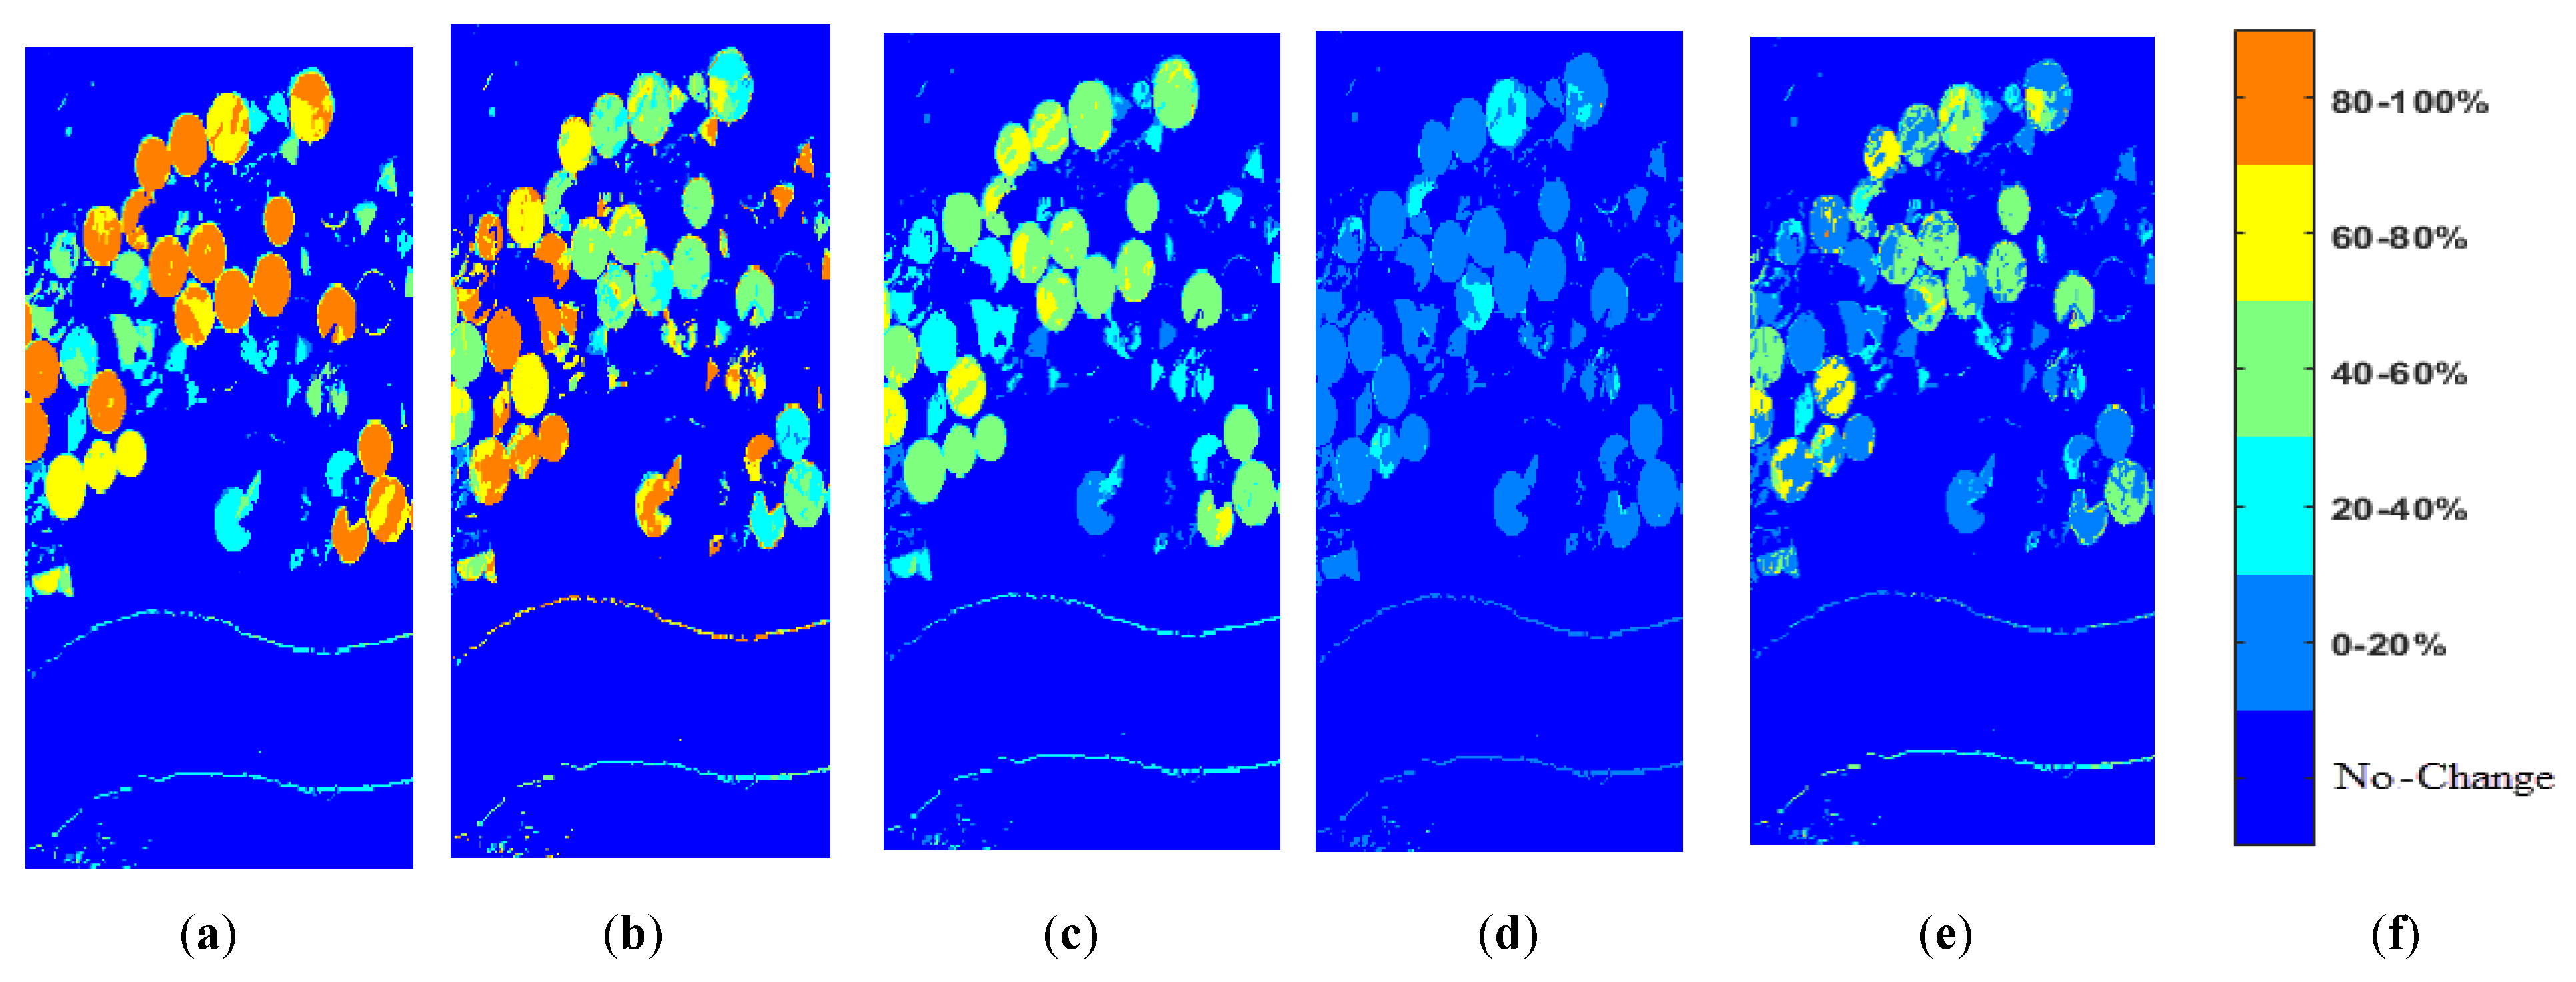
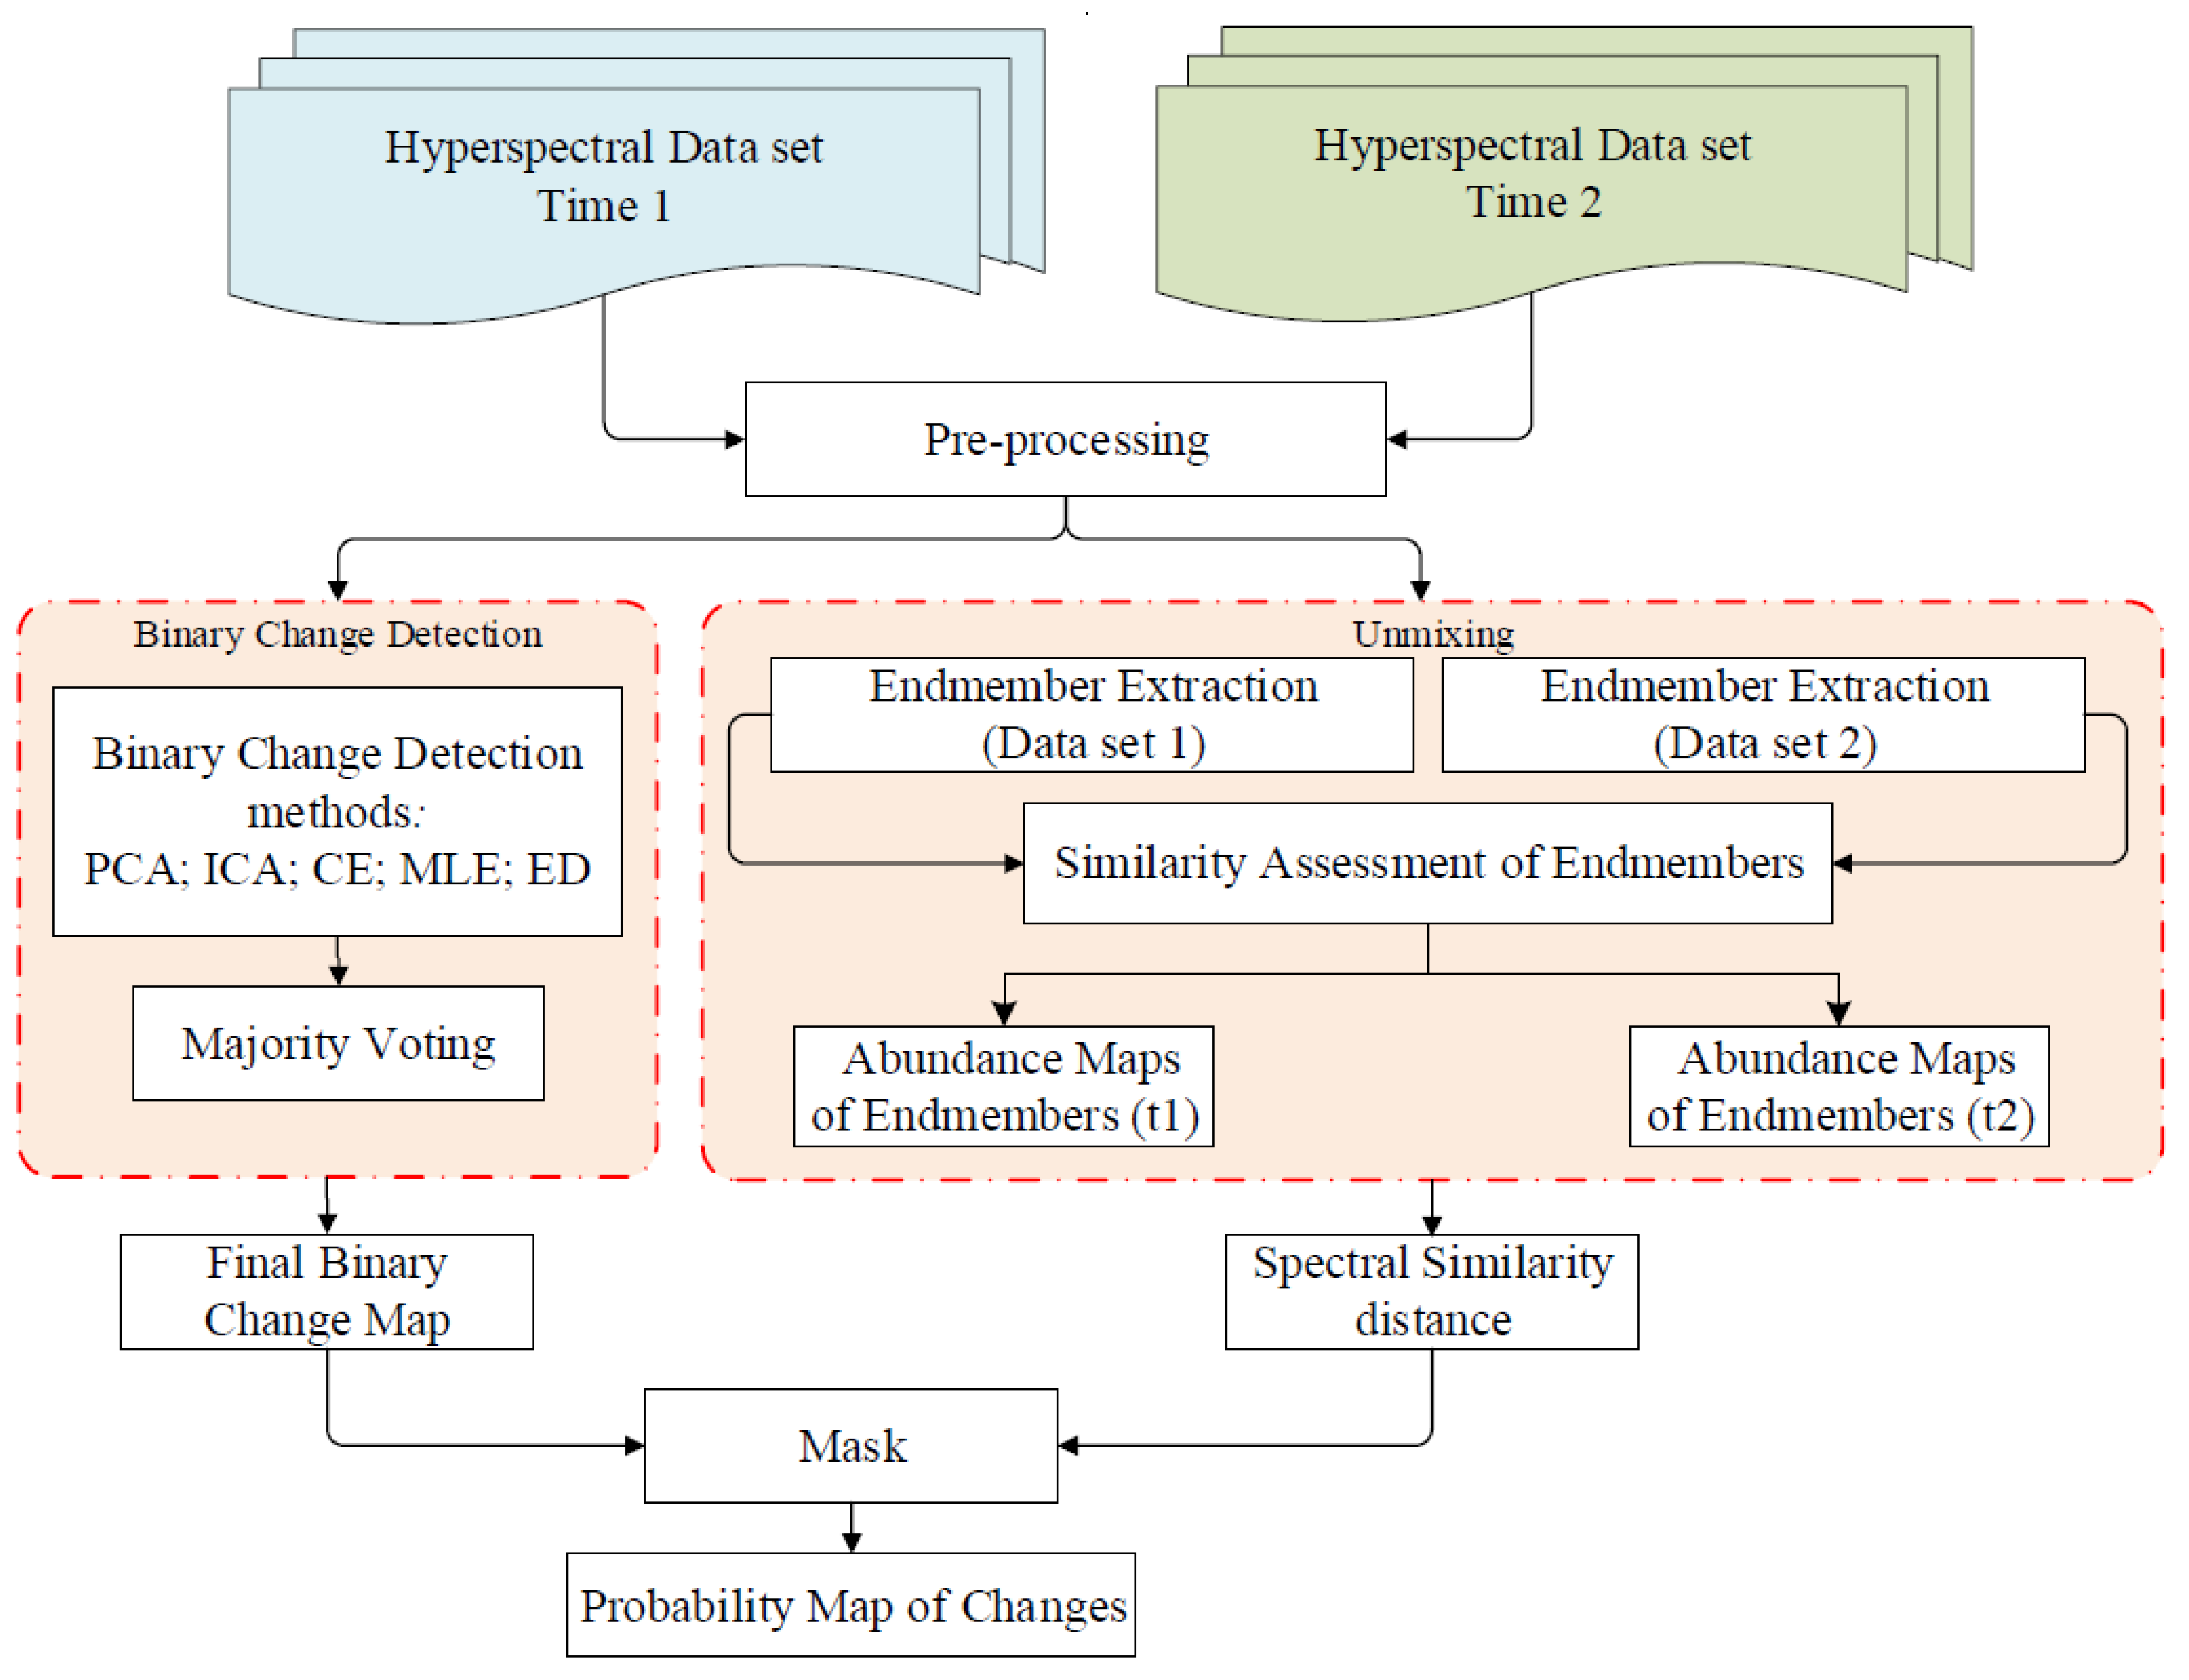
Change Detection (CD), which is a process of identifying changes that have occurred in a geographical area over the time, plays a key role in many applications, including assessing natural disasters, monitoring crops, and managing water resources. In the past decades, many CD techniques have been proposed. Hence, evaluating and analyzing of the probability of changes and interpreting them is an essential task which leads to better management of natural resources and the prevention of disasters. For this purpose, we adopted an approach to estimate the probability of changes that have occurred in the image scene. Based on this approach, changed pixels are categorized and labeled as probabilities (in percentage format). In this paper, the proposed framework consists of the following four steps. Firstly, this research produces a final binary change map (BCM) through combining the results of some of popular binary CD methods that have been proposed in the literature. Then an unmixing process is adopted and in the next step the spectral similarity of pixels is calculated in the abundance maps of endmembers. A measurement of spectral similarity identifies the finer spectral differences between the two hyperspectral images (HSIs). Finally, spectral similarity values are masked by the final BCM resulting in a probability map of changes. The experimental results verified that the method is able to obtain good results and may be well suited for hyperspectral CD applications.
Keywords: Change Detection; hyperspectral; probability map; spectral similarity Change Detection; hyperspectral; probability map; spectral similarity