Abstract
Information related to the impact of wildfire disturbances on ecosystems is of paramount interest to account for environmental loss, to plan strategies for facilitating ecosystem restoration, and to monitor the dynamics of vegetation restoration. Phenological metrics can represent a good candidate to monitor and quantify vegetation recovery after natural hazards like wildfire disturbances. Satellite observations have been demonstrated to be a suitable tool for wildfire disturbed areas monitoring, allowing both the identification of burned areas and the monitoring of vegetation recovery. This research study aims to identify post-fire vegetation restoration dynamics for the area surrounding Naples (Italy), affected by severe wildfires events in 2017. Sentinel-2 satellite data were used to extract phenological metrics from the estimated Leaf Area Index (LAI) and to relate such metrics to environmental variables in order to evaluate the vegetation restoration and landslide susceptibility for different land use classes.
1. Introduction
Wildfires represent one of the major agents of change as far as forest ecosystems are concerned. These natural hazards are monitored and studied at different stages, exploiting many and innovative tools. For example, post-fire studies are mainly targeted to quantify the impact of wildfire events on forests and monitor the recovery of natural environments. The study of post-fire vegetation restoration is of great importance for decision makers and landscape planners, as it can provide useful information to update landscape vulnerability maps, monitor forest recovery processes, and identify forest repopulation areas.
Besides being natural hazards, wildfires could determine the reduction of vegetated surface, and consequently, reduce the effect of soil protection provided by the tree root system, therefore triggering the possibility of landslide activation. Proper evaluation of post-fire vegetation restoration should not exclusively rely on fire severity and post-fire conditions, but also consider the plant conditions before the wildfire occurrence.
In this contest, satellite remote sensing represents a time- and cost-effective tool to monitor post-fire vegetation dynamics, especially over large areas. In particular, the Sentinel-2 MSI sensors, represents a concrete and available opportunity ho access free of charge data, featuring unprecedented tradeoff in spatiotemporal resolutions (10–60 m pixel size and 5-days revisit time), and represents a great occasion of improvement on such topic.
The objective of this contribution is to identify and characterize post-fire vegetation restoration dynamics for the study area surrounding Naples (Italy) using Leaf Area Index (LAI) generated from Sentinel-2 satellite data. The study case was interested by severe wildfire events during summer 2017 []. The specific objectives are: (i) to identify representative trajectories of vegetation restoration for different land use classes and (ii) to evaluate the land use vulnerability (e.g., landslide susceptibility) from identified restoration dynamics.
2. Materials and Methods
A database of 218 Sentinel-2 A and B acquisitions was processed in order to produce smoothed temporal series of leaf area index (LAI) values for the period 2016–2018. Sentinel-2 L2A data, atmospherically corrected using the MACCS-ATCOR Joint Algorithm (MAJA) [] and distributed by Theia in MUSCATE format, were downloaded and used for the analysis. All the spectral bands contained in the Sentinel-2 L2A product were first masked from cloud contaminated data and successively resampled to a 20 m spatial resolution according to the procedure described in []. Later, the biophysical processor [], available in ESA SNAP software, was used to compute LAI and multitemporal LAI observations stacked in a multidimensional datacube after applying an image coregistration step []. Finally, LAI time series were first smoothed using a Whittaker approach [] to avoid the residual noise rate affecting time series due to cloud contamination, and secondly, masked using a reference burned area map [].
During the time series analyses phase, each burned area was considered as a single Region of Interest (ROI) and used to compute phenological metrics from LAI for the pre-fire (year 2016) and post-fire (year 2018) periods. Phenological metrics, specifically the peak LAI and the seasonal cumulated value, were computed from LAI in the time period March 1 to September 30, and divided by the number of observation days in order to obtain the daily average LAI value of the smoothed time series. The 2012 Corine Land Cover (CLC) thematic map was used to aggregate time signatures according the land cover types. The difference Leaf Area Index (dLAI) phenological metric was finally computed subtracting the seasonal cumulated value of 2018 to the seasonal cumulated value of 2016, divided by the number of observation days.
Successively, dLAI values were compared against already available topographic and landslides hazard maps, in order to qualitatively investigate the environmental drivers related to specific fire vegetation restoration processes. Italian national landslide hazard maps (Piani di Assetto Idrogeologico, PAI [,]) represent the hazard in 5 PAI classes: 0 = Controlled area; 1 = Moderate; 2 = Medium; 3 = High; 4 = Very High.
3. Results and Discussion
During 2017, wildfire events mainly occurred in July (45.4%) and August (37.7%) (Figure S1), mostly in areas of very high landslide hazard (PAI 4 and PAI 3 classes representative for more than 43.15% the analized LAI time series) (Figure S2).
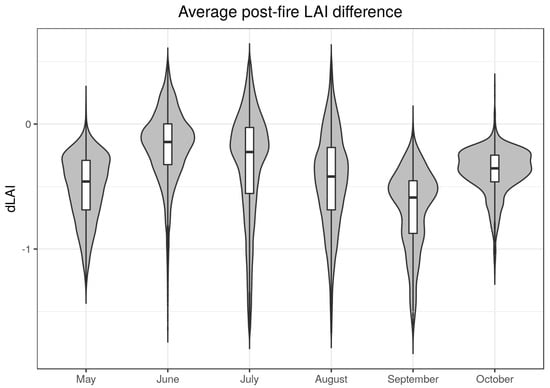
Wildfires that occurred during spring and early summer resulted in a lower dLAI (Figure 1), suggesting that vegetation had the time to start the restoration process before the end of the growing season. An hypothesis to explain the lower values of dLAI resulted for May is the presence of high residuals (dry leaves or branches) as heritage of the previous season that still had not started to be part of natural degradation processes due to already chilly temperatures and that represent ready-to-burn biomass in case of fire events, thus incrementing fire severity and damage, and therefore constraining the activities of post-fire vegetation regrowth in the successive season. Similarly, fire events taking place in autumn should result more intense (lower dLAI values) due to the higher presence of dry biomass at the ground level.

Figure 1.
Post-fire difference Leaf Area Index (dLAI) distribution aggregated by the month of wildfire occurrence in 2017.
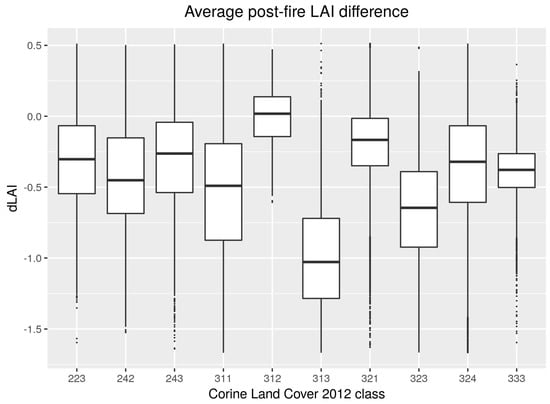
The most represented land cover classes were “transitional woodland-shrubs” (CLC code 324–32.48%), “natural grasslands” (CLC code 321–27.87%), and “broad-leaved forests” (CLC code 311–16.16%) (Table 1). Among those, the faster post-fire vegetation regrowth dynamic was observed for natural grasslands (dLAI = −0.2), followed by woodland-shrubs (dLAI = −0.3) and broad-leaved forests (dLAI = −0.5) (Figure 2).

Table 1.
Statistics on the distribution of burned pixels for the various Corine Land Cover 2012 classes.

Figure 2.
Distribution of dLAI values for the various Corine Land Cover 2012 classes corresponding to burned area pixels.
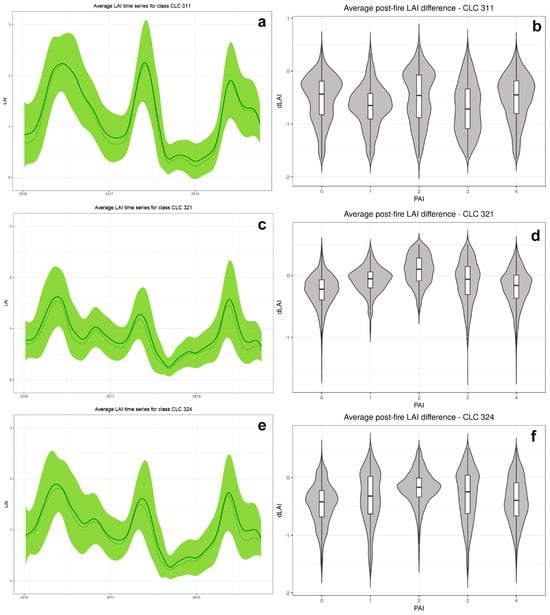
Figure 3 (left panels) shows average LAI time series profiles representative for specific land use classes along the pre-fire (2016), fire (2017), and post-fire (2018) three-year-period. A well-marked decrease in LAI values can be easily appreciated in 2017 due to fire events in the three selected land use classes (panel a, c, and e). Faster restoration processes, with lower dLAI values, were found for the classes corresponding to moderate (PAI = X) and medium (PAI = y) landslides hazards, suggesting that the restoration dynamics are slower in areas with higher landslides susceptibility (Figure 3).

Figure 3.
(a) Multitemporal series of LAI for burned area pixels corresponding to Corine Land Cover (CLC) class 311; (b) Distribution of dLAI values over the different PAI classes for CLC class 311; (c) Multitemporal series of LAI for burned area pixels corresponding to CLC class 321; (d) Distribution of dLAI values over the different PAI classes for CLC class 321; (e) Multitemporal series of LAI for burned area pixels corresponding to CLC class 324; (f) Distribution of dLAI values over the different PAI classes for CLC class 324.
No significant relation between vegetation recovery and terrain slope could be detected one year after wildfire occurrence (Figure S3).
4. Conclusions
The exploitation of biophysical indicators derived from Sentinel-2 satellite observations demonstrated to be a suitable tool to identify, describe, and monitor vegetation recovery in wildfire affected areas. Phenological metrics computed from multitemporal LAI series allowed to depict and interpret post-fire restoration dynamics featuring various land cover types. A faster restoration of natural grasslands ecosystems was found when compared against the transitional woodland-shrubs and broad-leaved forests. Areas corresponding to medium and moderate landslides hazard classes showed faster vegetation regrowth, suggesting that the restoration dynamics are slower in areas with higher landslides susceptibility.
Future perspectives of this research study lie in the development of automatic approaches to classify Sentinel-2 time series and operatively derive map of vegetation restoration typologies over burn-affected areas. For example, the application of advanced classification algorithms, such as Convolutional Neural Networks (CNNs), Random Forest (RF), or Support Vector Machines (SVM), should be tested and compared each other in order to identify which of those could better cope with the experimental case study, and moreover, these algorithms should be benchmarched with well-known algorithms (e.g., maximum likelihood) in order to appreciate the added value carried by state-of-the art classifiers.
Supplementary Materials
The following are available online at www.mdpi.com/2504-3900/18/1/10/s1, Figure S1: Temporal distribution as number of wildfire events during year 2017; Figure S2: Distribution of burned area pixels with respect to hazard Italian national landslide hazard PAI classes; Figure S3: Density scatterplot highlighting average LAI profiles differences (LAI 2016 minus LAI 2018) as function of the slope of the fire-affected area. Samples (pixels) belongs to 2017 fire affected areas.
Acknowledgments
This work contains modified Copernicus Sentinel data (2019). Digital Elevation Model and PAI (Italian National landslides hazard map) were downloaded from SINANET (ISPRA). Sentinel-2 MSI data used were available at no cost from Copernicus Open Access Hub. Copernicus Sentinel-2 data were processed at level 2A by CNES for the THEIA Land data center. Successive data processing was partly performed through the RUS (Research and User Support for Sentinel) on-line platform, designed to promote the uptake of the Sentinel data. The authors are grateful to the many individuals working on the development of free and open-source software for supporting the sharing of knowledge.
Author Contributions
F.F. and G.M. equally contributed to this work.
Conflicts of Interest
The authors declare no conflict of interest.
References
- Cicala, L.; Parrilli, S.; Angelino, C.V.; Fiscante, N.; Ullo, S.; Addabbo, P. Post-fire assessment of burned areas with very high resolution Sentinel-2 and Landsat-8 images. In GEOBIA 2018, Montpellier (France), 18–22 June 2018; p. 13123.
- Hagolle, O.; Huc, M.; Desjardins, C.; Auer, S.; Richter, R. MAJA Algorithm Theoretical Basis Document. 2017. Available online: https://doi.org/10.5281/zenodo.1209633 (accessed on 31 March 2019).
- Filipponi, F. Exploitation of Sentinel-2 Time Series to Map Burned Areas at the National Level: A Case Study on the 2017 Italy Wildfires. Remote. Sens. 2019, 11, 622. [Google Scholar] [CrossRef]
- Weiss, M.; Baret, F. S2ToolBox Level 2 Products: LAI, FAPAR, FCOVER. 2016. Available online: https://step.esa.int/docs/extra/ATBD_S2ToolBox_L2B_V1.1.pdf (accessed on 31 March 2019).
- Eilers, P.H.C. A perfect smoother. Anal. Chem. 2003, 75, 3631–3636. [Google Scholar] [CrossRef] [PubMed]
- ISPRA (2017) Mosaicatura nazionale delle aree a pericolosità da frana PAI (v. 3.0–Dicembre 2017). Available online: http://www.sinanet.isprambiente.it/it/sia-ispra/download-mais/mosaicature-nazionali-ispra-pericolosita-frane-alluvioni (accessed on 31 March 2019).
- Trigila, A.; Iadanza, C.; Bussettini, M.; Lastoria, B. Dissesto idrogeologico in Italia: Pericolosità e indicatori di rischio—Edizione 2018; ISPRA: Roma, Italy, 2018; ISBN 978-88-448-0901-0. [Google Scholar]
© 2019 by the authors. Licensee MDPI, Basel, Switzerland. This article is an open access article distributed under the terms and conditions of the Creative Commons Attribution (CC BY) license (https://creativecommons.org/licenses/by/4.0/).