1. Introduction
With the increasing adoption of wide-bandgap semiconductors such as SiC and GaN in high-power electronics, the thermal management of semiconductor devices has become critical. High thermal conductivity thermal interface materials (TIMs) are essential to minimize thermal contact resistance. Advanced fillers such as graphene, diamond nanosheets, and hexagonal boron nitride (h-BN) have been proposed, and their effectiveness strongly depends on the spatial continuity and orientation of the filler network. Excessive filler loading degrades mechanical strength and flexibility. Visualizing the spatial distribution of thermal conductivity is thus essential to optimize the filler structure. This study examines the correlation between the spatial distribution of thermal diffusivity and the internal filler structure in composite materials, employing both experimental and numerical methods. We proposed and have been developing a lock-in thermography-based laser periodic heating method to obtain the spatial thermal diffusivity distribution of composites [1]. In this study, the internal fiber-resin structure of CFRP (carbon fiber reinforced plastic) specimens was visualized using synchrotron X-ray computed tomography (SR-CT), meshed using GeoDict, and used to perform transient heat conduction simulations in ANSYS Fluent. The thermal diffusivity distribution obtained from simulations was compared with that measured by the lock-in thermography method.
2. Methods
2.1. Materials and Simulation
The CFRP laminate plate used for the measurement was fabricated from T700SC/#2592 prepreg (Toray Industries, Tokyo, Japan) with a [0/903]s stacking sequence. The sample size was 10 × 4 × t1.176 mm, as shown in Figure 1a. The out-of-plane thermal diffusivity distribution of this specimen was evaluated. SR-CT was performed at the BL8S2 beamline of the Aichi Synchrotron Radiation Center in Seto, Japan. The observation area was a 1.3 × 1.3 mm region of the specimen as shown in Figure 1b. To visualize the microstructure of carbon fibers with a diameter of 7 μm, a high-resolution optical system with a spatial resolution of 0.65 μm was employed. SR-CT data reconstructed from the X-ray transmission images were binarized using the simulation software GeoDict (2025). To prevent misidentification of voids as carbon fibers, the FiberFind module was utilized to extract the axial coordinates of the carbon fibers, enabling reconstruction of fiber regions. As a result, the reconstructed model from SR-CT successfully replicated the actual structure, including fiber-fiber contacts and fiber-resin interfaces. However, components other than fibers and resin, such as voids, were excluded, which is a future work in the image segmentation process. To perform thermal conduction simulations, a segment containing the full CFRP laminate structure was extracted from the SR-CT data as shown in Figure 1c. Mesh generation compatible with ANSYS Fluent R1 (ANSYS, Canonsburg, PA, USA) was then performed for finite element analysis. The final computational model consisted of 250 × 250 × 1850 voxels as shown in Figure 1d. Unsteady-state heat conduction simulations were conducted using the implicit Euler method, based on the thermal property summarized in Table 1. The boundary conditions included sinusoidal thermal input at the surface, with adiabatic conditions applied to the sides and rear surface. The voxel size was 0.65 μm, the heating frequency was 1 Hz, the time step was 0.01 s, and the simulation was run for three cycles with a convergence criterion of residuals less than 1 × 10⁻¹⁰. Lock-in analysis was applied to the 2D temperature-time history at the surface opposite to the heated side, yielding a distribution of phase delays to the input heat wave. This phase delay distribution was then converted to using Equation (4).
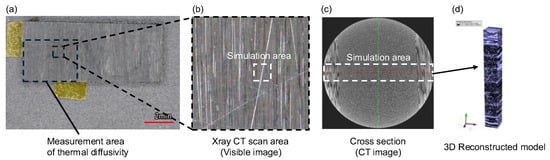
Figure 1.
(a) CFRP sample and measurement area of thermal diffusivity. (b) SR-CT scan area on CFRP sample. (c) Cross-sectional image of reconstructed SR-CT image. (d) 3D reconstructed image.

Table 1.
Thermophysical properties for numerical simulation.
2.2. Measurement Principle
To evaluate the distribution of the effective in the out-of-plane direction of the specimen, a 1-D quasi-steady-state heat conduction model is introduced. When the surface of the specimen is uniformly subjected to periodic rectangular wave heating at a frequency f, and the rear surface is thermally insulated, the temperature response of the specimen can be expressed as follows:
where is the AC temperature, is the input heat rate per unit area, is the thermal conductivity, , is the angular frequency, and is the thickness of the specimen. Since oscillates at the same harmonics of , then amplitude and phase at are shown as follows:
The phase distribution acquired from the infrared camera’s detector array is measured in the frequency domain and converted into a distribution through the fitting of Equation (2). When calculating from numerical simulation results, frequency-domain analysis imposes a high computational cost. In cases where the heating frequency is sufficiently high (), Equation (1) can be simplified as follows.
The phase delay is given by , where is referred to as the wavenumber. is obtained as follows:
By using Equation (4), can be determined from the phase delay at a single frequency, thereby reducing computational cost. However, in actual measurements, the absolute phase includes system-induced delays; therefore, Equation (4) is applied to the numerical simulation only.
2.3. Measurement Setup and Condition
The measurement apparatus is illustrated in Figure 2. The measurements were conducted using a cooled-type thermography camera InfReC H9000 (Nippon Avionics Co., Ltd., Yokohama, Japan) equipped with a 5X microscopic lens, which achieved a spatial resolution of 5 μm. The temperature response was processed using a digital lock-in process, allowing acquisition of the phase delay distribution. The semiconductor LASER beam was applied through a square-core multimode fiber and uniformly heated onto the surface. To minimize heat loss, the entire specimen was measured under a vacuum condition. The heating frequency ranged from 0.2 to 0.4 Hz, the laser power was set to 2500 mW, and the lock-in integration time corresponded to 120 cycles.
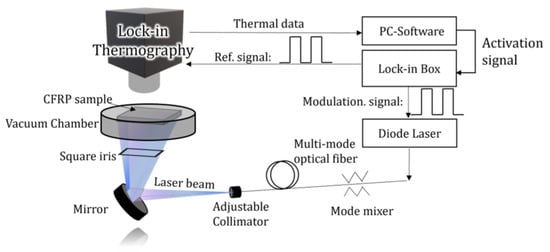
Figure 2.
Measurement apparatus.
3. Results and Discussion
Figure 3a shows the measured distribution. A striped pattern with alternating high and low values along the X-axis is observed. This trend was also confirmed in previous macroscale measurements of CFRP laminates. The average in the measured region is 0.457 mm2/s, which is in good agreement with the reported value [5]. An enlarged view of the same region used in the simulation is presented in Figure 3b. Based on the reconstructed CFRP model obtained from SR-CT, numerical simulation yielded the distribution shown in Figure 3c. The simulation and experimental results show a similar trend, particularly in region A. However, some differences are observed in another region. In CFRP laminates, the 0° plies near the front and back surfaces can become parallel to the X-ray beam direction depending on the rotation angle. As a result, X-ray transmission intensity becomes lower for the 0° layers than for the 90° layers. This leads to a relatively high level of noise in the fiber structure of the 0° layers. Such image degradation is considered to contribute to the differences observed in the distributions. The average obtained from the simulation was 0.443 mm2/s, with a difference of approximately 2.8% from the experimental result, demonstrating good agreement in absolute values.
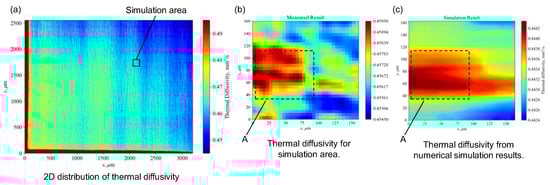
Figure 3.
(a) Thermal diffusivity distribution from the measurement. (b) Simulation area of measurement results. (c) Simulation results from SR-CT reconstructed CFRP model.
4. Conclusions
The thermal diffusivity distribution obtained by measurement was compared with that derived from heat conduction simulations based on synchrotron SR-CT at the same region of the CFRP specimen. A consistent trend was observed between the measured and simulated distributions. However, challenges remain in accurately modeling the fiber structure, and some differences in local distribution were identified. Future work will aim for full agreement between simulation and measurement, and further investigation will be conducted to clarify the correlation between the structural features and the factors contributing to the observed distribution. This approach offers valuable insights into the structural design of composite materials with enhanced thermal conductivity.
Author Contributions
Conceptualization, R.F. and S.B.; methodology, S.B.; writing—original draft preparation, R.F.; writing—review and editing, H.N.; funding acquisition, H.N. All authors have read and agreed to the published version of the manuscript.
Funding
This research was supported by JST, MIRAI Program (Grant Number JPMJMI22C1).
Institutional Review Board Statement
Not applicable.
Informed Consent Statement
Not applicable.
Data Availability Statement
The data will be made available upon reasonable request to the corresponding author.
Acknowledgments
The CFRP specimens were provided by Koyanagi and Ogihara Laboratories at Tokyo University of Science. The authors would like to express their sincere appreciation for this support.
Conflicts of Interest
The authors declare no conflicts of interest.
References
- Alasli, A.; Fujita, R.; Nagano, H. Thermophysical Properties Mapping of Composites by Lock-in Thermography: Applications on Carbon Fiber Reinforced Plastics. Int. J. Thermophys. 2022, 43, 176. [Google Scholar] [CrossRef]
- Harada, M.; Morioka, D.; Ochi, M. Thermal and mechanical properties of tetra-functional mesogenic type epoxy resin cured with aromatic amine. J. Appl. Polym. Sci. 2017, 135, 46181. [Google Scholar] [CrossRef]
- T700S Technical Data Sheet. Available online: https://toray-cfe.com/wp-content/uploads/2025/02/Torayca-T700S-Technical-Data-Sheet.pdf (accessed on 5 June 2025).
- Ji, X.; Matsuo, S.; Sottos, N.R.; Cahill, D.G. Anisotropic thermal and electrical conductivities of individual polyacrylonitrile-based carbon fibers. Carbon 2022, 197, 1–9. [Google Scholar] [CrossRef]
- Fujita, R.; Kudo, N.; Abe, S.; Fikry, M.M.; Koyanagi, J.; Ogihara, S.; Nagano, H. Lock-in Thermographic Measurement and Model-Based Evaluation of Effective Thermal Diffusivity to Quantify Early Stage Fatigue Damage of CFRP. In Proceedings of the Thermosense: Thermal Infrared Applications XLV, Orlando, FL, USA, 30 April–5 May 2023; Volume 12536, pp. 65–70. [Google Scholar]
Disclaimer/Publisher’s Note: The statements, opinions and data contained in all publications are solely those of the individual author(s) and contributor(s) and not of MDPI and/or the editor(s). MDPI and/or the editor(s) disclaim responsibility for any injury to people or property resulting from any ideas, methods, instructions or products referred to in the content. |
© 2025 by the authors. Licensee MDPI, Basel, Switzerland. This article is an open access article distributed under the terms and conditions of the Creative Commons Attribution (CC BY) license (https://creativecommons.org/licenses/by/4.0/).