Proceeding Paper

Crises, Financial Data and Public Sector Reform: Activity-Based Costing and Cost Allocation in Greece—A Case Study of the Independent Authority for Public Revenue †

by
Eleftheria Kyriakidou
1,2,* and
Athanasios Vazakidis
1
1
Department of Applied Informatics, University of Macedonia, 156 Str. Egnatia, GR 546 36 Thessaloniki, Greece
2
Independent Authority for Public Revenue, 57 Str. N. Plastira, GR 544 54 Thessaloniki, Greece
*
Author to whom correspondence should be addressed.
Presented at the 1st International Conference on Public Administration 2024, Katerini, Greece, 31 May–1 June 2024.
Proceedings 2024, 111(1), 29; https://doi.org/10.3390/proceedings2024111029
Published: 30 June 2025
(This article belongs to the Proceedings of 1st International Conference on Public Administration 2024)

Abstract

Under the international globalized environment, the impact of the financial crisis of 2008 and the recent financial effect of the COVID-19 economic recession have generated a new role for the state aimed at reducing vulnerability to a new financial shock. Cost analysis is currently an issue among public authorities, inhibiting enhanced productivity and the effectiveness and utility of public services and goods. This article aims to showcase that the basic priorities of a high degree of transparency and accountability of public spending are becoming more and more essential. The need for cost allocation is essential for states to be resilient under the current ‘spin’ of crises.

1. Introduction

According to the World Bank (1997), ‘Good government is not a luxury—it’s a vital necessity for development’ [1].
Entering a ‘spin’ of crises, controlling the budget of the state and supporting the economy were and are now more essential. The main purpose of this article is to present the fiscal data of the Greek state after the Greek crisis under the basic countermeasures taken to reduce public spending and under the structural reforms implemented in the Public Sector of Greece. Many states have faced financial crises under different circumstances. The Greek state had to make significant adjustments to its fiscal policy regimes and adopted new public management reforms under the International Monetary Fund (IMF), the European Central Bank (ECB) and the European Commission measures and guidelines.
Another objective of this article is to examine whether the implementation of activity-based costing (ABC) methods is possible in the public sector and how cost analysis can lead to public accountability. In this study, we present a cost analysis and we examine how to implement the ABC method in the Greek Independent Authority for Public Revenue (IAPR).
This paper is organized into six sections as follows. In Section 2, we present a short review on cost systems and public management. In Section 3, we present the financial data of the Greek central government (revenues, expenditures and others). In Section 4, we outline the main issues of Greek Adjustment Programs and the main structural changes in the Greek Ministry of Finance. In Section 5, we present the ABC method and we implement a cost analysis of the IAPR. Finally, in Section 6, we conclude the paper and discuss current and future perspectives on public accountability.

2. Literature Review

Reinhart and Rogoff (2008) [2] mentioned that serial default is a nearly universal phenomenon as countries struggle to transform themselves from emerging markets to advanced economies. Major default episodes are typically spaced some years (or decades) apart, creating an illusion that “this time is different” among policymakers and investors. The five “varieties” of economic crises—external default, domestic default, banking crises, currency crashes, and inflation outbursts—are also presented. In the recent financial crises, it was found that the countries experiencing sudden large capital inflows were at a higher risk of experiencing a debt crisis.
Accounting systems in the public sector involve recording and categorizing financial transactions on a cash basis and focus on budget compliance and accountability.
Traditional costing systems represent a costing method used to assign costs directly to products based on the volume of resources used. Activity-based costing (ABC) was pioneered by Copper, Kaplan and Johnson [3,4] and is a new costing method that assigns indirect costs to cost objects (product, services). Vazakidis et al. (2010) [5] examined the implementation of ABC in the Greek public sector in order to trace costs and determine ‘true’ costs through activities.

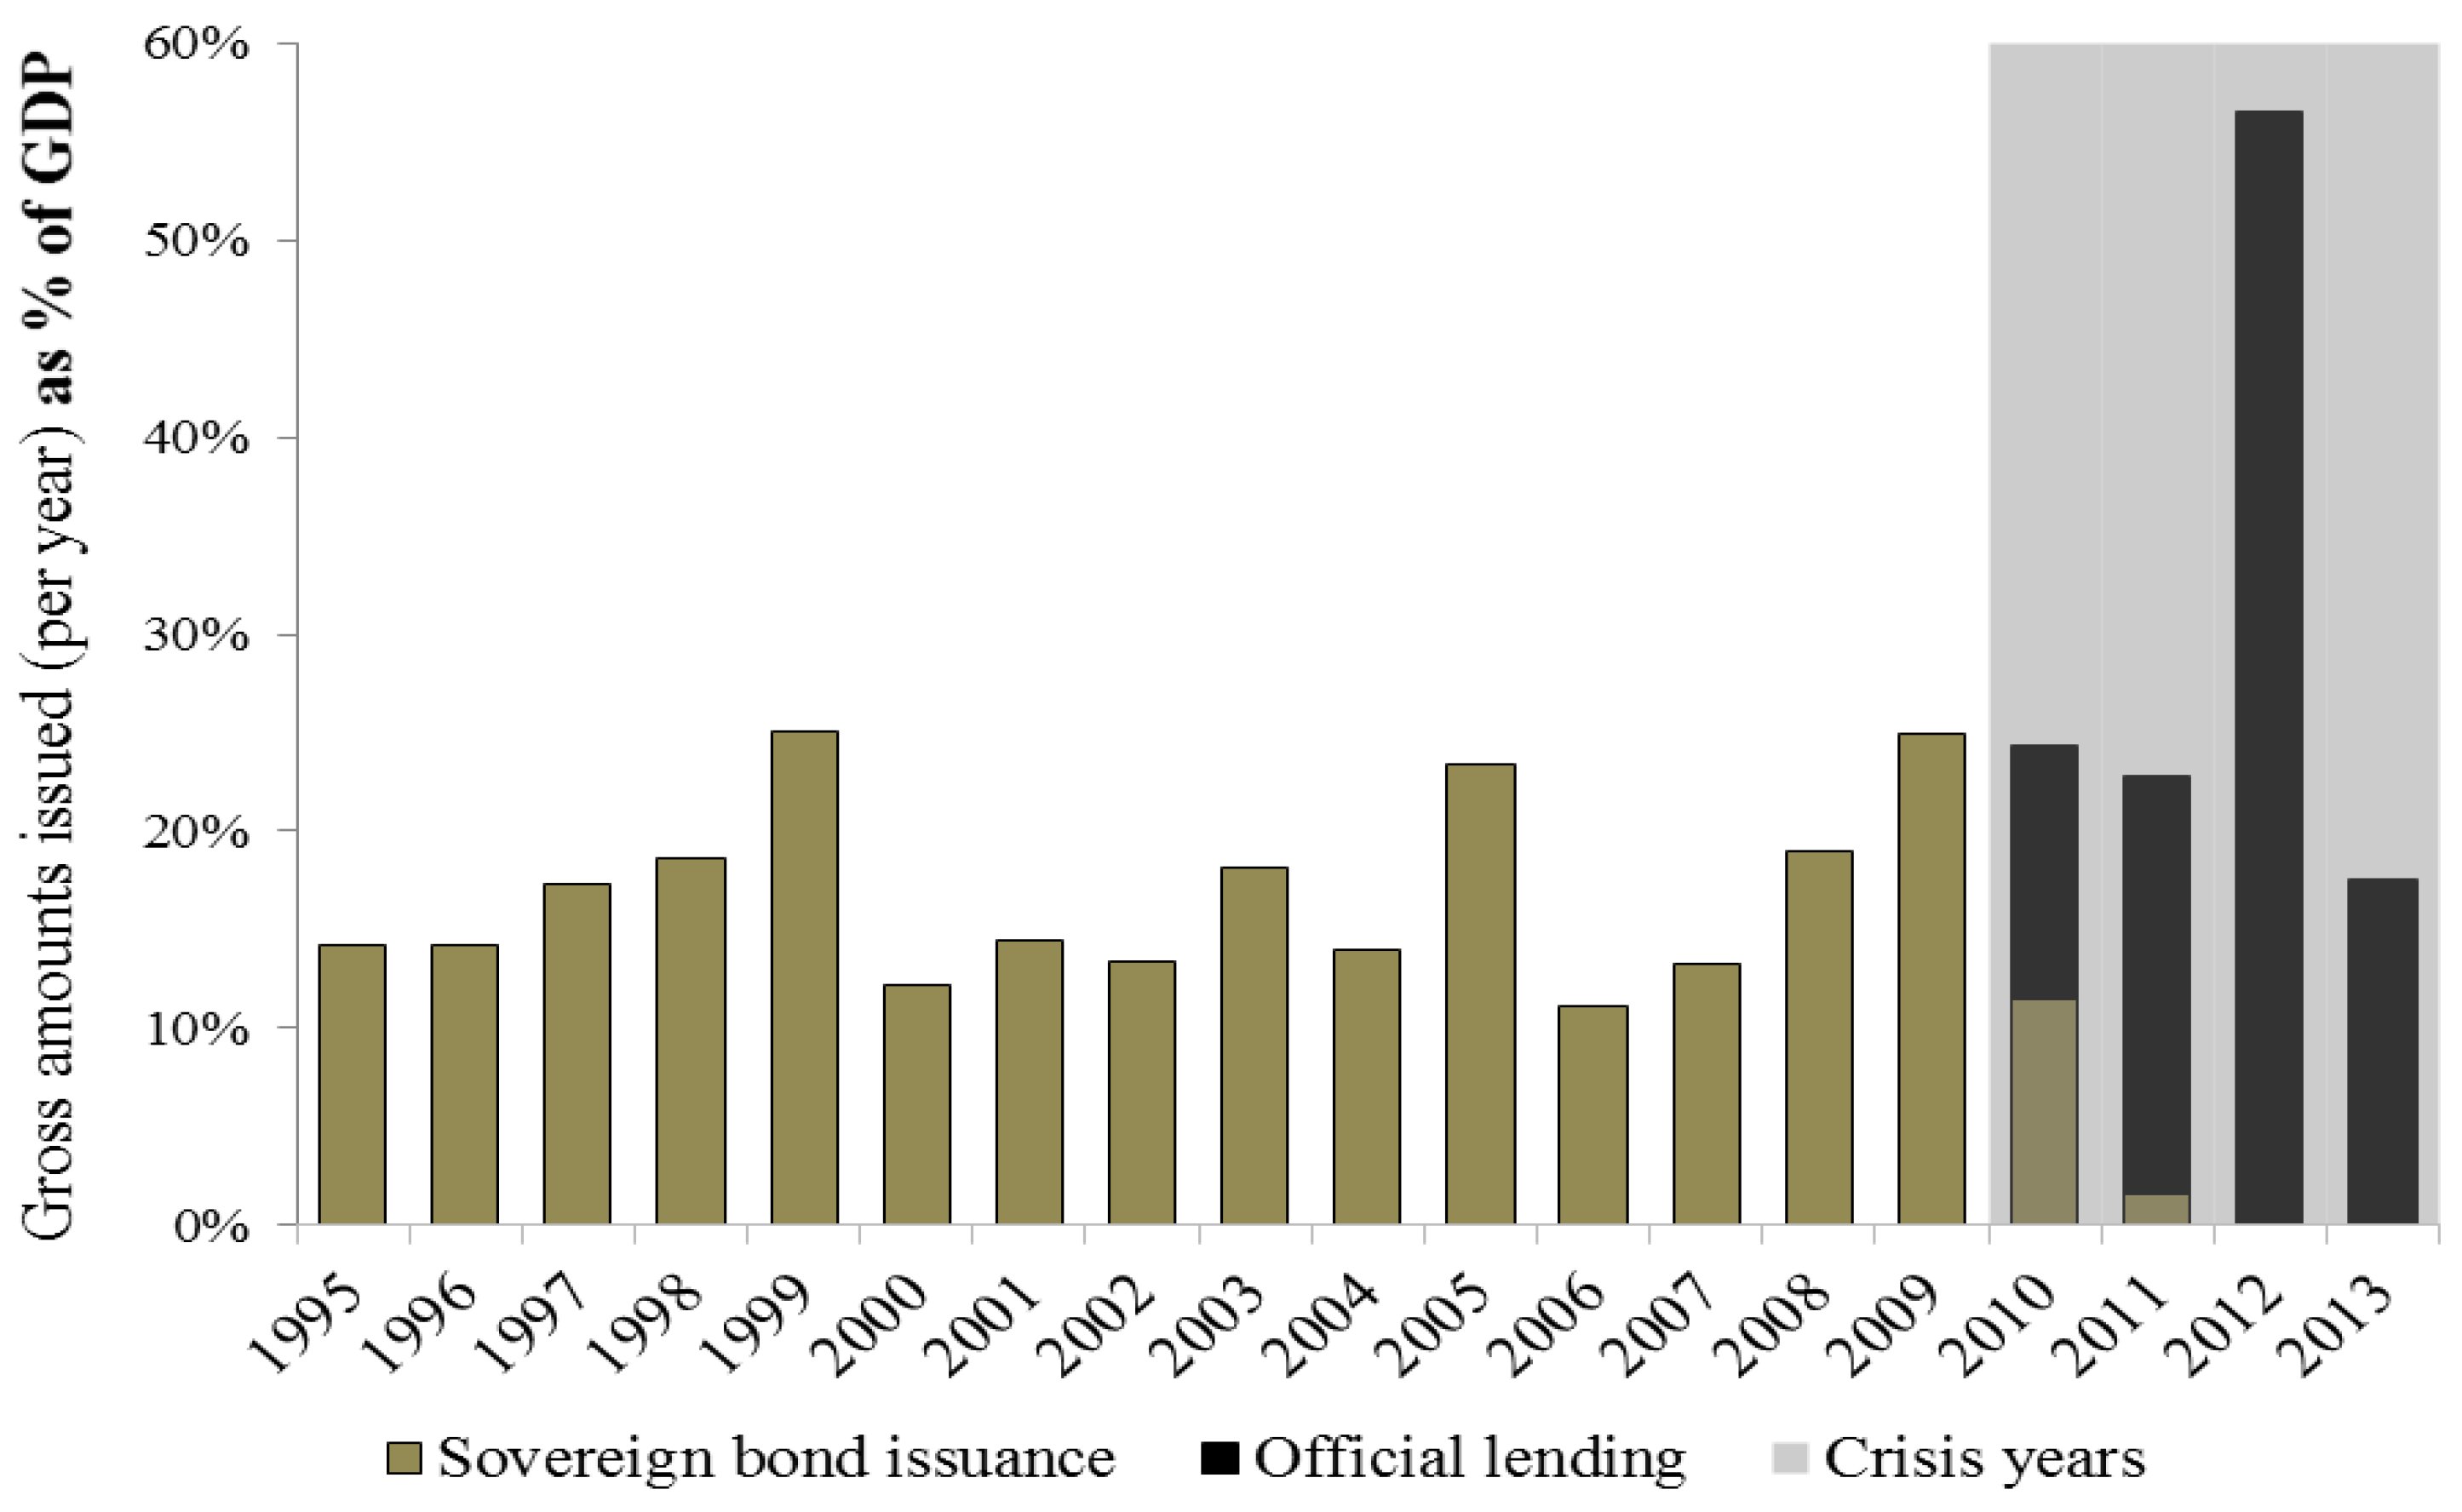
3. Analysis of Greek State Financial Data

This section is based on secondary data from annual reports of the Hellenic state, previously written data, articles and other literature sources.
The Greek fiscal crisis has been at the center of international interest over recent years. Following this, many discussions were made on GR-exit, which only ended with the advent of BR-exit. Many articles have been written analyzing the Greek crisis.
A very important analysis, in time and depth, was made by Reinhart and Trebesch, 2015 [6]. As presented, “The history of Greece is a narrative of debt, default and external dependence”. Since its independence in 1829, the Greek government has defaulted four times on its external creditors—with striking historical parallels. Each crisis is preceded by a period of heavy borrowing from foreign private creditors. As repayment difficulties arise, foreign governments step in, help to repay the private creditors, and demand budget cuts and adjustment programs as a condition for the official bailout loans. Political interference from abroad mounts and a prolonged episode of debt overhang and financial autarky follows. The following Figure 1 presents the Greek sovereign borrowing funds in the period 1995–2013 as a percent of GDP.
Kindreich (2017) [8] supported that the Greek financial crisis was a series of debt crises that started with the global financial crisis of 2008. In addition, the lack of accountability and proper oversight in so many aspects of Greek public finances compounded the problems.
The research methodology concerning government fiscal data is based on secondary data from the annual reports produced by the Hellenic Ministry of Finance and the Hellenic Court of Audit, and they are presented in the chart below.
The Figure 2 represents the changes in the main state data (revenues, expenditures, public debt interest, finance assets, net borrowing (m EUR)), for the period 2009–2018. It is important to highlight that state revenues had a minor increase, from 50 to 55 (b EUR), although the GDP of Greece had a major decrease, from 220 to 170 (b EUR) due to the increase in taxation. On the other hand, state expenditures had a major decrease, from 70 to 50 (b EUR), following austerity measures. Additionally, net borrowing, from 39 to 2 (b EUR), and public debt interest, from 12 to 7 (b EUR), had a major decrease, but should be viewed under the fact that new long-term loans were issued [9].
In the following Table 1 and Figure 3 below, an analysis of the main category of revenues and expenditures (m EUR) is presented. State revenues showed a major increase in direct taxes (individuals, entities, etc.), from 15 to 19 (b EUR), as the indirect taxes (VAT, duties, etc.), grants and non-tax data showed similar numbers. On the other hand, the major categories of state expenditures are fees, subsidies—grants and pensions of public servants, which showed similar numbers (pensions of public servants are moved under the category subsidies—grants). The state’s operating results, due to the measures taken, moved to positive numbers.
As Ozturk and Sozdemir (2014) [10] mentioned, it is possible to say that the current situation of Greece is the result of wrong policies applied in the last 25–30 years. This process is closely related with the financial extravagancy and insufficiency of Greece government, the unfair and infertile taxation system, unsustainable retirement, low competitive power, the populist practices of political parties, and organizational and political problems in the EU and Euro Zone.

4. Short Presentation of Greek Adjustment Programs and Public Structural Changes

4.1. Greek Adjustment Programs

Since 2008, Greece has faced a serious fiscal crisis, and three (3) Economic Adjustment Programs (Memorandums) were signed between Greece and the European Commission, European Central Bank and International Monetary Fund (IMF): in May 2010 (110 b EUR), February 2012 (130 b EUR), and July 2015 (86 b EUR).
The three (3) bailout programs (new loans with extremely severe warranties and guarantees) led to the following:
  • Austerity measures (reductions in wages/pensions, reductions in the cost of public services such as health, education and social benefits);
  • Reducing public investments;
  • Raising of taxes;
  • Reforms in labor market and public administration;
  • Privatization of state-owned assets (for 49 years to 99 years, public property such as ports, airports, railways, energy (electric, gas, wild, solar, etc.), revenues from archeological sites and monuments, etc.);
  • Banking systems (many high-risk loans and lower deposits led to recapitalization in 2013, 2014 and 2015); also, capital control measures were taken in June 2015.
More specifically, due to austerity measures, two major reductions in the public personnel cost were made: (a) a reduction and finally abolishment of Christmas, Easter and vacation allowances (from 14 to 12 wages: −15% until 2013 due to L.3845/5-2010 and L. 4093/10-2011) and (b) a reduction in allowances and benefits (−12% and −8% at the beginning of 2010 due to the implementation of L.3833/3-2010 and L.3845/5-2010).

4.2. Structural Changes at the Greek Ministry of Finance

Under the 1st and 2nd Adjustment Programs, major structural changes were implemented in many Greek authorities. More specifically, at the Greek General Secretariat for Public Revenue of Ministry of Finance, the number of organic units (divisions, departments, units) was reduced by 61% (from 3282 to 1285 units). Furthermore, the process of transitioning from paper statements to digital eStatements (financial statements of individual and legal entities) was initiated (on-going process). In parallel, this led to the more efficient use of the number of employees (mostly with university education, appr. 90%) since they moved to audit units and increased the number of auditors (from appr. 800 in 2011 to more than 1800 in 2013; auditors for tax audit and enforced collection). Additionally, an initial training program (mandatory attendance) and continuous yearly educational programs were developed.

4.3. The Independent Authority for Public Revenue of Greece (I.A.P.R.)

On 1 January 2017, the Independent Authority for Public Revenue was established by law 4389/2016, in line with the international standards regarding tax administration autonomy, replacing the GSPR. The authority is subject to parliamentary scrutiny, in accordance with the Parliament’s Rules of Procedure.
The mission of the IAPR is to safeguard public revenue by promoting tax compliance and combating tax evasion and smuggling, while providing high-quality services to citizens and businesses.
The IAPR management bodies are the Management Board (MB) and the Governor. There are four main levels in the organization structure of the IAPR:
  • 11 organic units directly reporting to the Governor;
  • 5 General Directorates;
  • Directorates (22 directorates, 4 stand-alone departments);
  • 13 Special Decentralized Services and Regional Services (including the YEDDEs, the DOYs, Customs and local Customs offices and the Chemical Labs).

5. Costing Accounting Methods at Public Authorities

5.1. Methodology of ABC Systems

According to Oseifuah (2014) [11] and Vazakidis and Karagiannis (2006) [12], relevant definitions are presented below:
Traditional Costing Accounting (TCA) methods tend to assign indirect costs based on something easy to identify (such as direct labor hours). This can make indirect cost allocation inaccurate (no actual relationship between cost pool and cost driver).
Activity-Based Costing (ABC) is a method for determining ‘true costs’. It assigns costs to activities, thus enabling more accurate cost information.
Time-Driven Activity-Based Costing (TD-ABC) requires fewer accounting transactions than the common ABC allocation method and still produces an accurate computation of product unit costs.

5.2. Implementation of ABC

Based on Vazakidis and Karagiannis (2006) [12] and Lima (2012) [13], the steps in the implementation of ABC are as follows:
  • Identify expenses (cost resources).
  • Identify end-products/services (outputs–cost objects).
  • Identify activities (cost pools).
  • Assign resources to activities (based on resource driver).
  • Trace/allocate overhead costs to activities and cost objects.
  • Assign activities to products/services (based on activity driver).
As mentioned before, activity-based costing methods (ABC and TD-ABC) determine ‘true’ costs by assigning more indirect costs (overhead) as direct costs through activities.

5.3. Cost Analysis of Independent Authority for Public Revenue (I.A.P.R.)

The cost analysis of the I.A.P.R. is based both on secondary data from annual reports of the IAPR and on primary data collected from accounting statements and from ‘Diavgeia’ (The Transparency Program initiative: www.diavgeia.gov.gr accessed on 1 February 2024), [14,15].
As presented on Table 2, the main expense category is the personnel expenses, accounting for more than 80% of the total expenses. The personnel cost shows an increase that is due to the recruitment of qualified new personnel and due to a new job-based pay system. Also, there is an increase in leasing expenses (up to 3.8%), expenses for banking services (up to 2.5%) and expenditure for Public Lotteries (up to 5.7%). We should also note that the categories ‘Compensation expenses (court decisions, etc.)’ and ‘Returns/refunds of special excise tax’ are not expenses that concern the authority’s operation but compensations or returns that concern taxation entries returned.
Taking into account that the main expense category is the personnel cost, better use of human resources is a main issue. The authority made changes in order to support staffing in audit, IT and land border line, islands and ports. (only 4% in IT, less than 10% auditors and other understaffing). At the Table 3, personnel of IARP is presented per category, as is documented at the end of 2022. Also, a new training system (initial, continuous) was developed so that employees could gradually acquire the appropriate professional skills and experience. Additionally, an innovative new job-based pay system based on qualifications, experience, duties, responsibilities and working conditions was issued in 2021.
The main activities of the IAPR are divided into the following:
  • Taxation: activities for valid statements/declarations, compliance for non-submission, non-payments and others and activities for audits, inspections, investigations and others.
  • Duties: activities for valid custom statements (imports and exports), compliance and others and activities for subsequent audits, prosecution checks, smuggling checks (energy, tobacco and alcohol), illegal trade, inspections and others.
  • Chemical analyses: activities for chemical analyses, classification statements and others and activities for audits, inspections (energy, tobacco and alcohol) and supporting measures for the protection of public health and the environment.
  • IT: activities for providing and supporting e-services to citizens, businesses and public sector bodies, with a view to facilitating transactions, reducing red tape and simplifying processes and others.
Gradually, many e-statements were developed (on-going process), facilitating and reducing the time required for transactions for citizens, businesses and the authority’s personnel. Also, many e-tools and online monitoring programs have been developed (like myCar, myProperty, myData and others). The authority is moving from everyday basic activities (gradually being replaced by e-statements, e-reports, e-notifications, etc.) to targeted activities (like audits, inspections, investigation, etc.) Additionally, the IARP has started to report its activities (on-going process), and so far, more than 100 activities are documented.
Below at Table 4 and Table 5, we present the number of audits, inspections on tax evasion, tax fraud, illegal trade, the shadow economy, imputations of undisclosed income and others.
Identifying public expenses–resources (‘inputs’), public goods services/products (‘outputs’) and the activities is the central issue in performing the cost analysis.

6. Conclusions

The absence of public accountability and proper oversight in so many aspects of Greek public finances (public deficit, public debt, public spending) have compounded the problems of the Greek economy (Kindreigh, 2017) [8].
The recent worldwide request for better transparency and quality of the public sector calls for managerial techniques to control the public sector’s spending and for the continuous improvement in the quality of the provided public services/goods. Governments nowadays are rethinking their models, trying to meet the needs of their citizens/consumers of public goods and services and to disseminate a ‘cost culture’ in the public administration (Kyriakidou et Vazakidis, 2020) [16].
Cost analysis is a challenging issue but it is needed to support accountability, transparency and performance measurement of public authorities. Cost allocation includes the recognition, measure and disclosure of financial transactions in order to provide the necessary information and to determine a unit cost or cost per unit of service. Cost accounting methods can provide allocation of the expenses and the volume of the resources used for the production of public goods and services and can help to determine ‘true’ costs (Vazakidis et Kyriakidou, 2020) [17].
As shown, during the Greek crisis, cost reduction was implemented by legislation and was not based on cost analysis of public authorities. As presented in the case of public authorities, structural changes based on new needs of operation and efficiency led to changes in the use of resources (human potential, scaling down organization structure, etc.), focusing on specific activities (methods, procedures, etc.) and providing better public services/goods (e-services, e-gov, e-tools, etc.).
The public sector currently still operates under the scope of satisfying regulations and legitimating the activities of the authorities. This makes it even more necessary to separate the political process from the financial management process. In order to improve processes and efficiency in the public sector, we need to identify and simplify activities. For an efficient public sector, we need to ensure efficient use of resources (financial, human, material, time, etc.), to recover costs for the provision of of public goods/services and to support the public value creation process.
Cost accounting methods offer a more comprehensive and accurate view of the public sector’s financial position and can also enhance the productivity, effectiveness and utility of public services and goods by improving the process.
Conventional corporate governance relies on a system of rules, practices and political processes but has limitations in managing problems efficiently under financial, social and environmental crises. On the other hand, sustainable governance relies on accounting systems’ support in order to identify objectives, procedures and rules, as a means to manage performance, risks and legitimacy. The aims of effective governance need to shift from political ambitions to responsible behavior, to meet social and national needs, to support socio-economic public value creation and to develop an improved decision-making framework.

Author Contributions

E.K.: conception and design of the analysis, collection and interpretation of data, writing, reviewing and editing the paper. A.V.: conception and design of the analysis, reviewing and editing the paper. All authors have read and agreed to the published version of the manuscript.

Funding

This research received no external funding.

Institutional Review Board Statement

Not applicable.

Informed Consent Statement

Not applicable.

Data Availability Statement

The raw data supporting the conclusions of this article will be made available by the authors on request.

Conflicts of Interest

The authors declare no conflicts of interest.

References

  1. World Bank. World Development Report, 1997: The State in A Changing World; The World Bank: Washington, DC, USA, 1997. [Google Scholar]
  2. Reinhart, C.M.; Rogoff, K.S. This Time is Different: A Panoramic View of Eight Centuries of Financial Crises; NBER Working Papers 13882; National Bureau of Economic Research, Inc.: Cambridge, MA, USA, 2008. [Google Scholar]
  3. Cooper, R.; Kaplan, R.S. The Design of Cost Management Systems; Prentice Hall: Englewood Cliffs, NJ, USA, 1991; p. 580. [Google Scholar]
  4. Johnson, H.T.; Kaplan, R.S. Relevance Lost Rise and Fall of Management Accounting; Harvard Business School Press: Boston, MA, USA, 1987. [Google Scholar]
  5. Vazakidis, A.; Karagiannis, I.; Tsialta, A. Activity-Based Costing in the Public Sector. J. Soc. Sci. 2010, 6, 376–382. [Google Scholar]
  6. Reinhart, C.M.; Trebesch, R. The Pitfalls of External Dependence: Greece, 1829–2015; Brookings Papers on Economic Activity; Economic Studies Program, The Brookings Institution: Washington, DC, USA, 2015; Volume 2, pp. 307–328. [Google Scholar]
  7. European Commission. The Second Economic Adjustment Programme for Greece: Fourth Review; Occasional Paper no. 192; European Commission: Brussels, Belgium, 2014. [Google Scholar]
  8. Kindreich, A. The Greek Financial Crisis (2009–2016); Chartered Financial Analyst (CFA) Institute: Charlottesville, VA, USA, 2017. [Google Scholar]
  9. Hellenic Ministry of Finance, Hellenic Court of Audit. Available online: https://minfin.gov.gr/apologismos-isologismos-kai-loipes-chrimatooikonomikes-katastaseis/ (accessed on 1 January 2024).
  10. Ozturk, S.; Sozdemir, A. Effects of Global Financial Crisis on Greece Economy. Procedia Econ. Financ. 2015, 23, 568–575. [Google Scholar] [CrossRef]
  11. Oseifuah, E.K. Activity Based Costing (ABC) in the public sector: Benefits and challenges. Probl. Perspect. Manag. 2014, 12, 581–587. [Google Scholar]
  12. Vazakidis, A.; Karagiannis, I. Activity-Based Costing in Higher Education: A Study of Implementing Activity-Based Costing in University of Macedonia. In Proceeding of the 5th Conference of the Hellenic Finance and Accounting Association, Thessaloniki, Greece, 15–16 December 2006; p. 11. [Google Scholar]
  13. Lima, C.M.F. The applicability of the principles of activity based costing in a higher education institution. Econ. Manag. Res. Proj. Int. J. 2012, 1, 57–65. [Google Scholar]
  14. The Independent Authority for Public Revenue. Available online: https://www.aade.gr/apologistikes-ektheseis (accessed on 1 February 2024).
  15. The Transparency Program Initiative. Available online: www.diavgeia.gov.gr (accessed on 1 February 2024).
  16. Kyriakidou, E.; Vazakidis, A. Financial Crisis and Public Reforms: Moving from Public Administration to Public Management. Cost Allocation and Performance Information for Decision making Process in the Public Sector. The Case of the Greek Public Sector under the Greek Crisis. In Proceedings of the 9th International Conference on Information and Communication Technologies in Agriculture, Food and Environment (HAICTA 2020), Thessaloniki, Greece, 24–27 September 2020; CEUR Workshop Proceeding. Volume 2761, pp. 252–262. [Google Scholar]
  17. Vazakidis, A.; Kyriakidou, E. Time-Driven Activity-Based Costing in the Public Sector. The Case of Greek General Chemical State Laboratory under the Greek Crisis. J. Soc. Sci. 2020, 16, 49–58. [Google Scholar] [CrossRef]
Figure 1. Greek sovereign borrowing after 1995 (as a percent of GDP). © 2015 by Carmen M. Reinhart and Christoph Trebesch [6], (sources: Bloomberg, Dealogic, and table 9 of European Commission (2014) [7]).
Proceedings 111 00029 g001
Figure 2. Greek government accounting revenues, expenditures, public debt interest, finance assets and net borrowing (m EUR) for the period 2009–2018 [9].
Proceedings 111 00029 g002
Figure 3. Greek state revenues and expenditures (m EUR) for the period 2011–2018 [9].
Proceedings 111 00029 g003
Table 1. Greek state revenue and expenditure data (m EUR), 2011–2018.
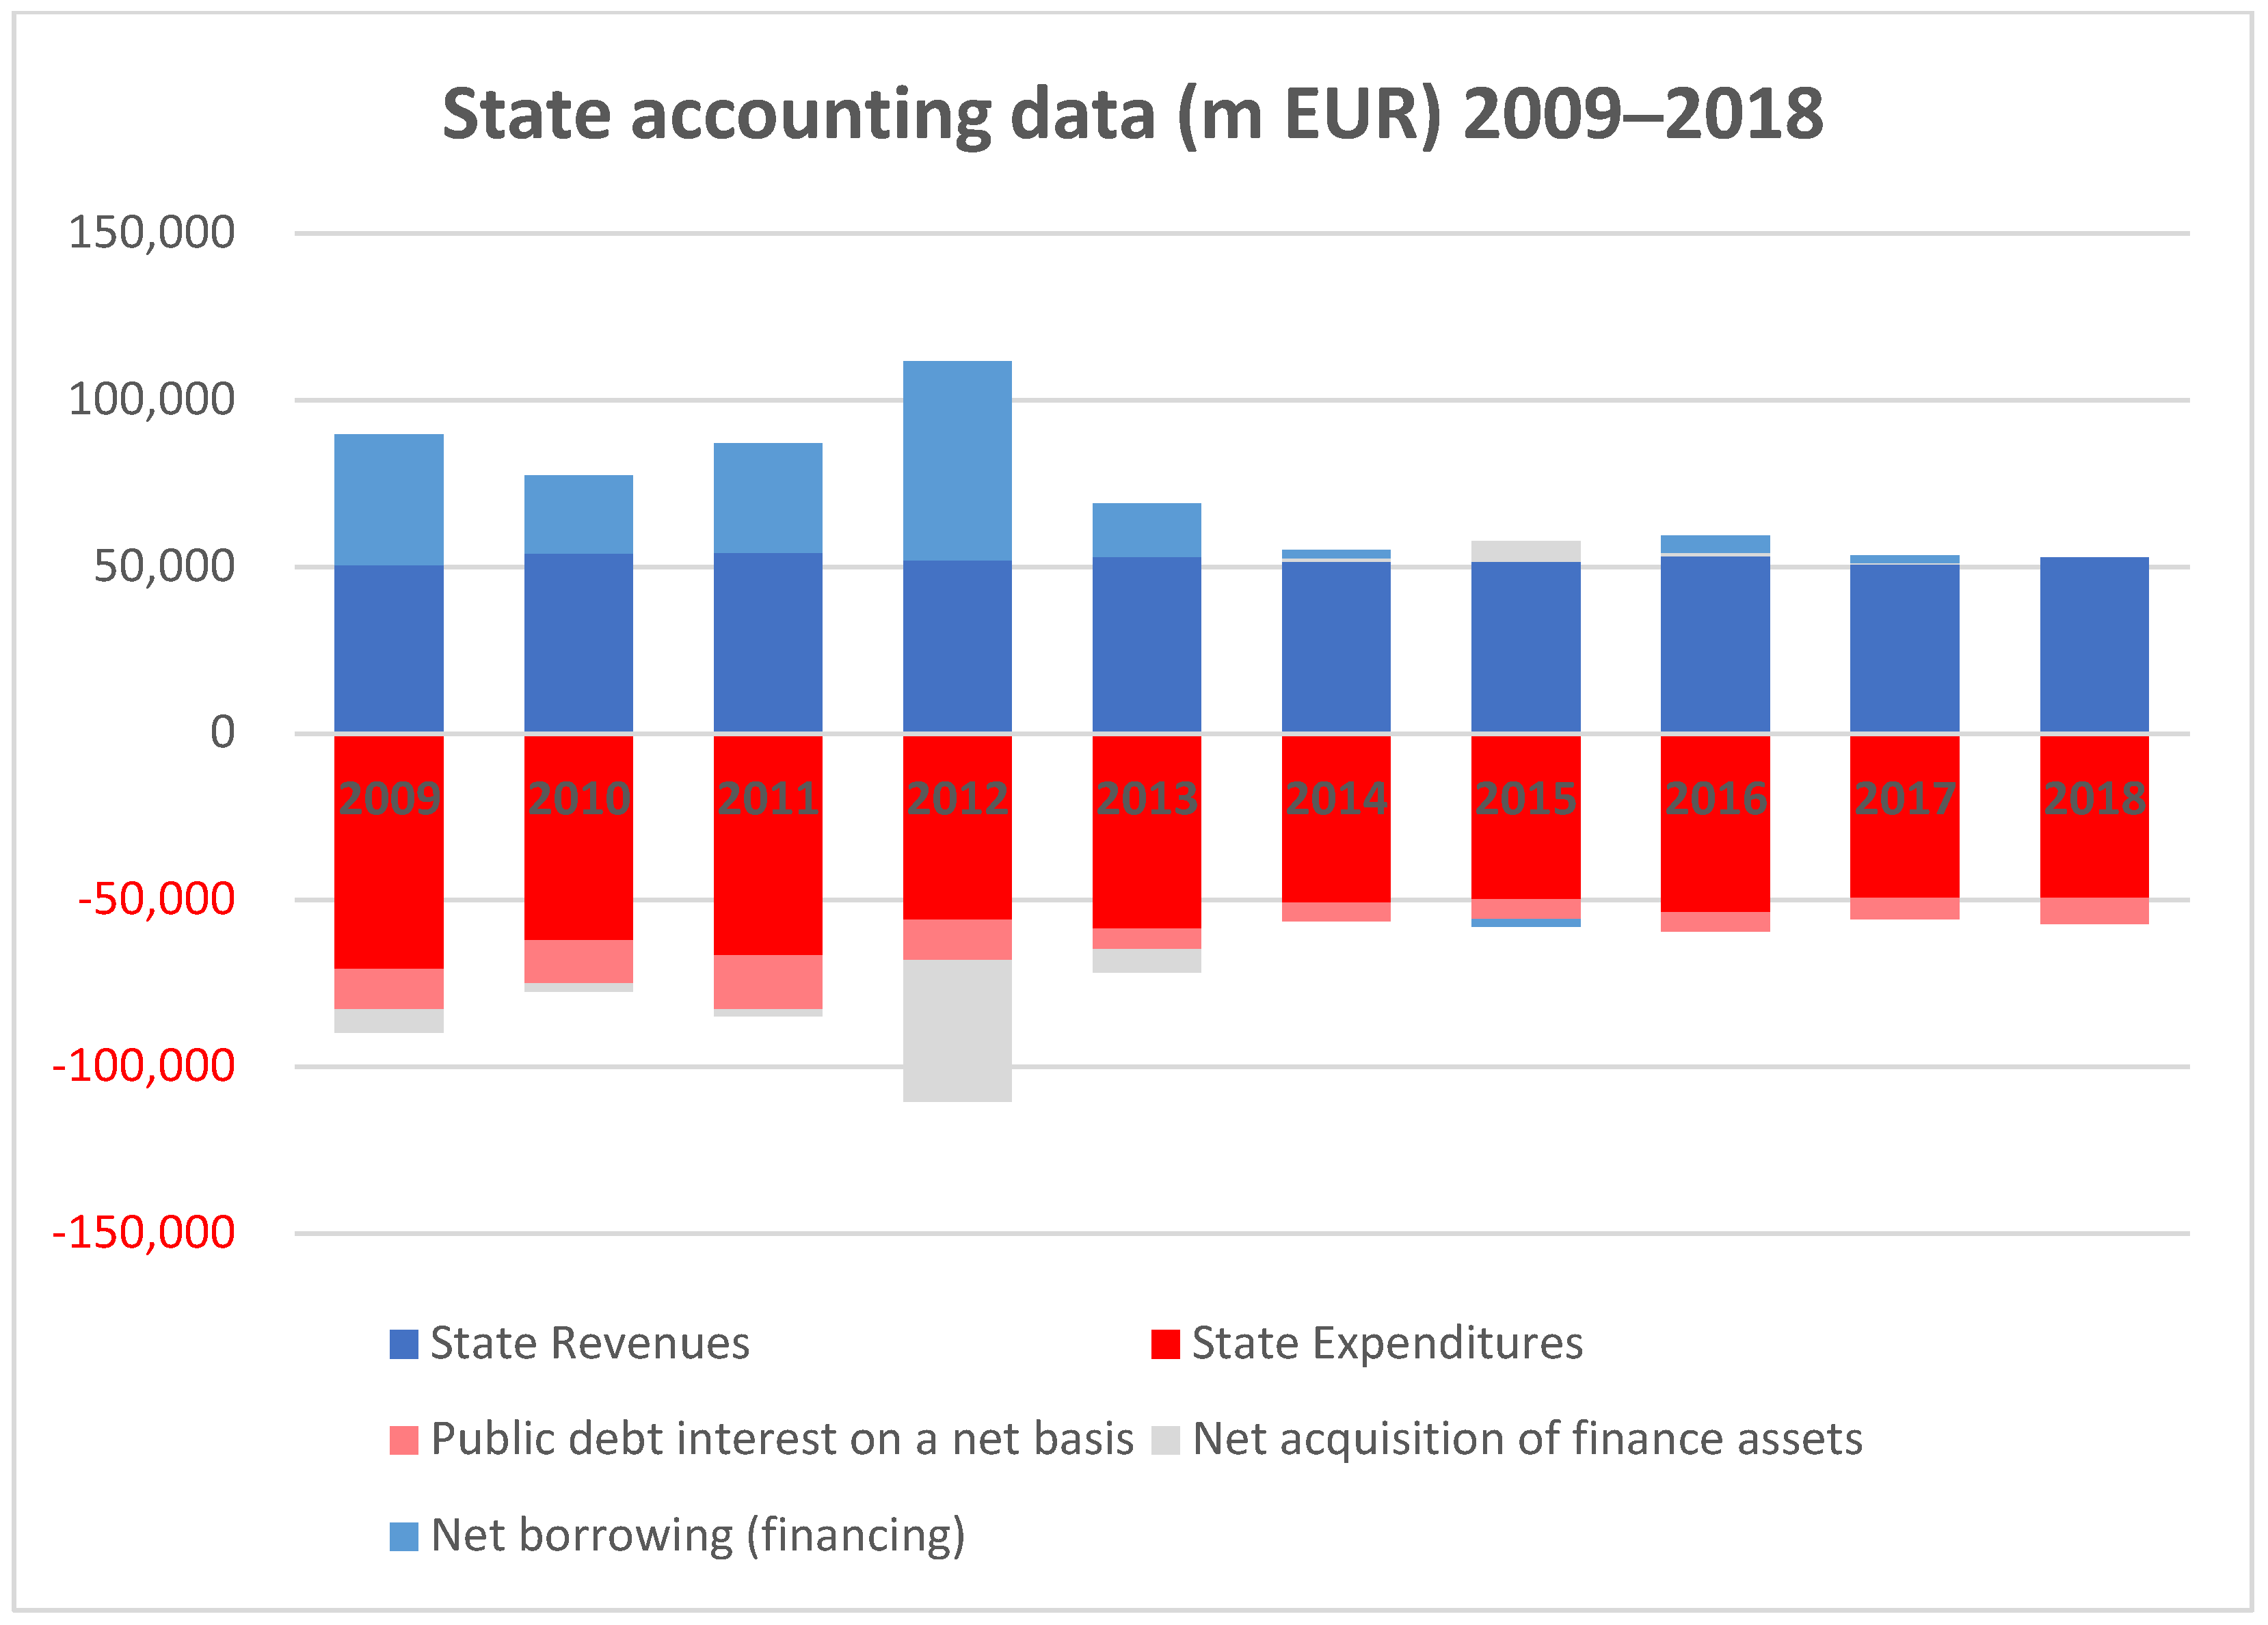
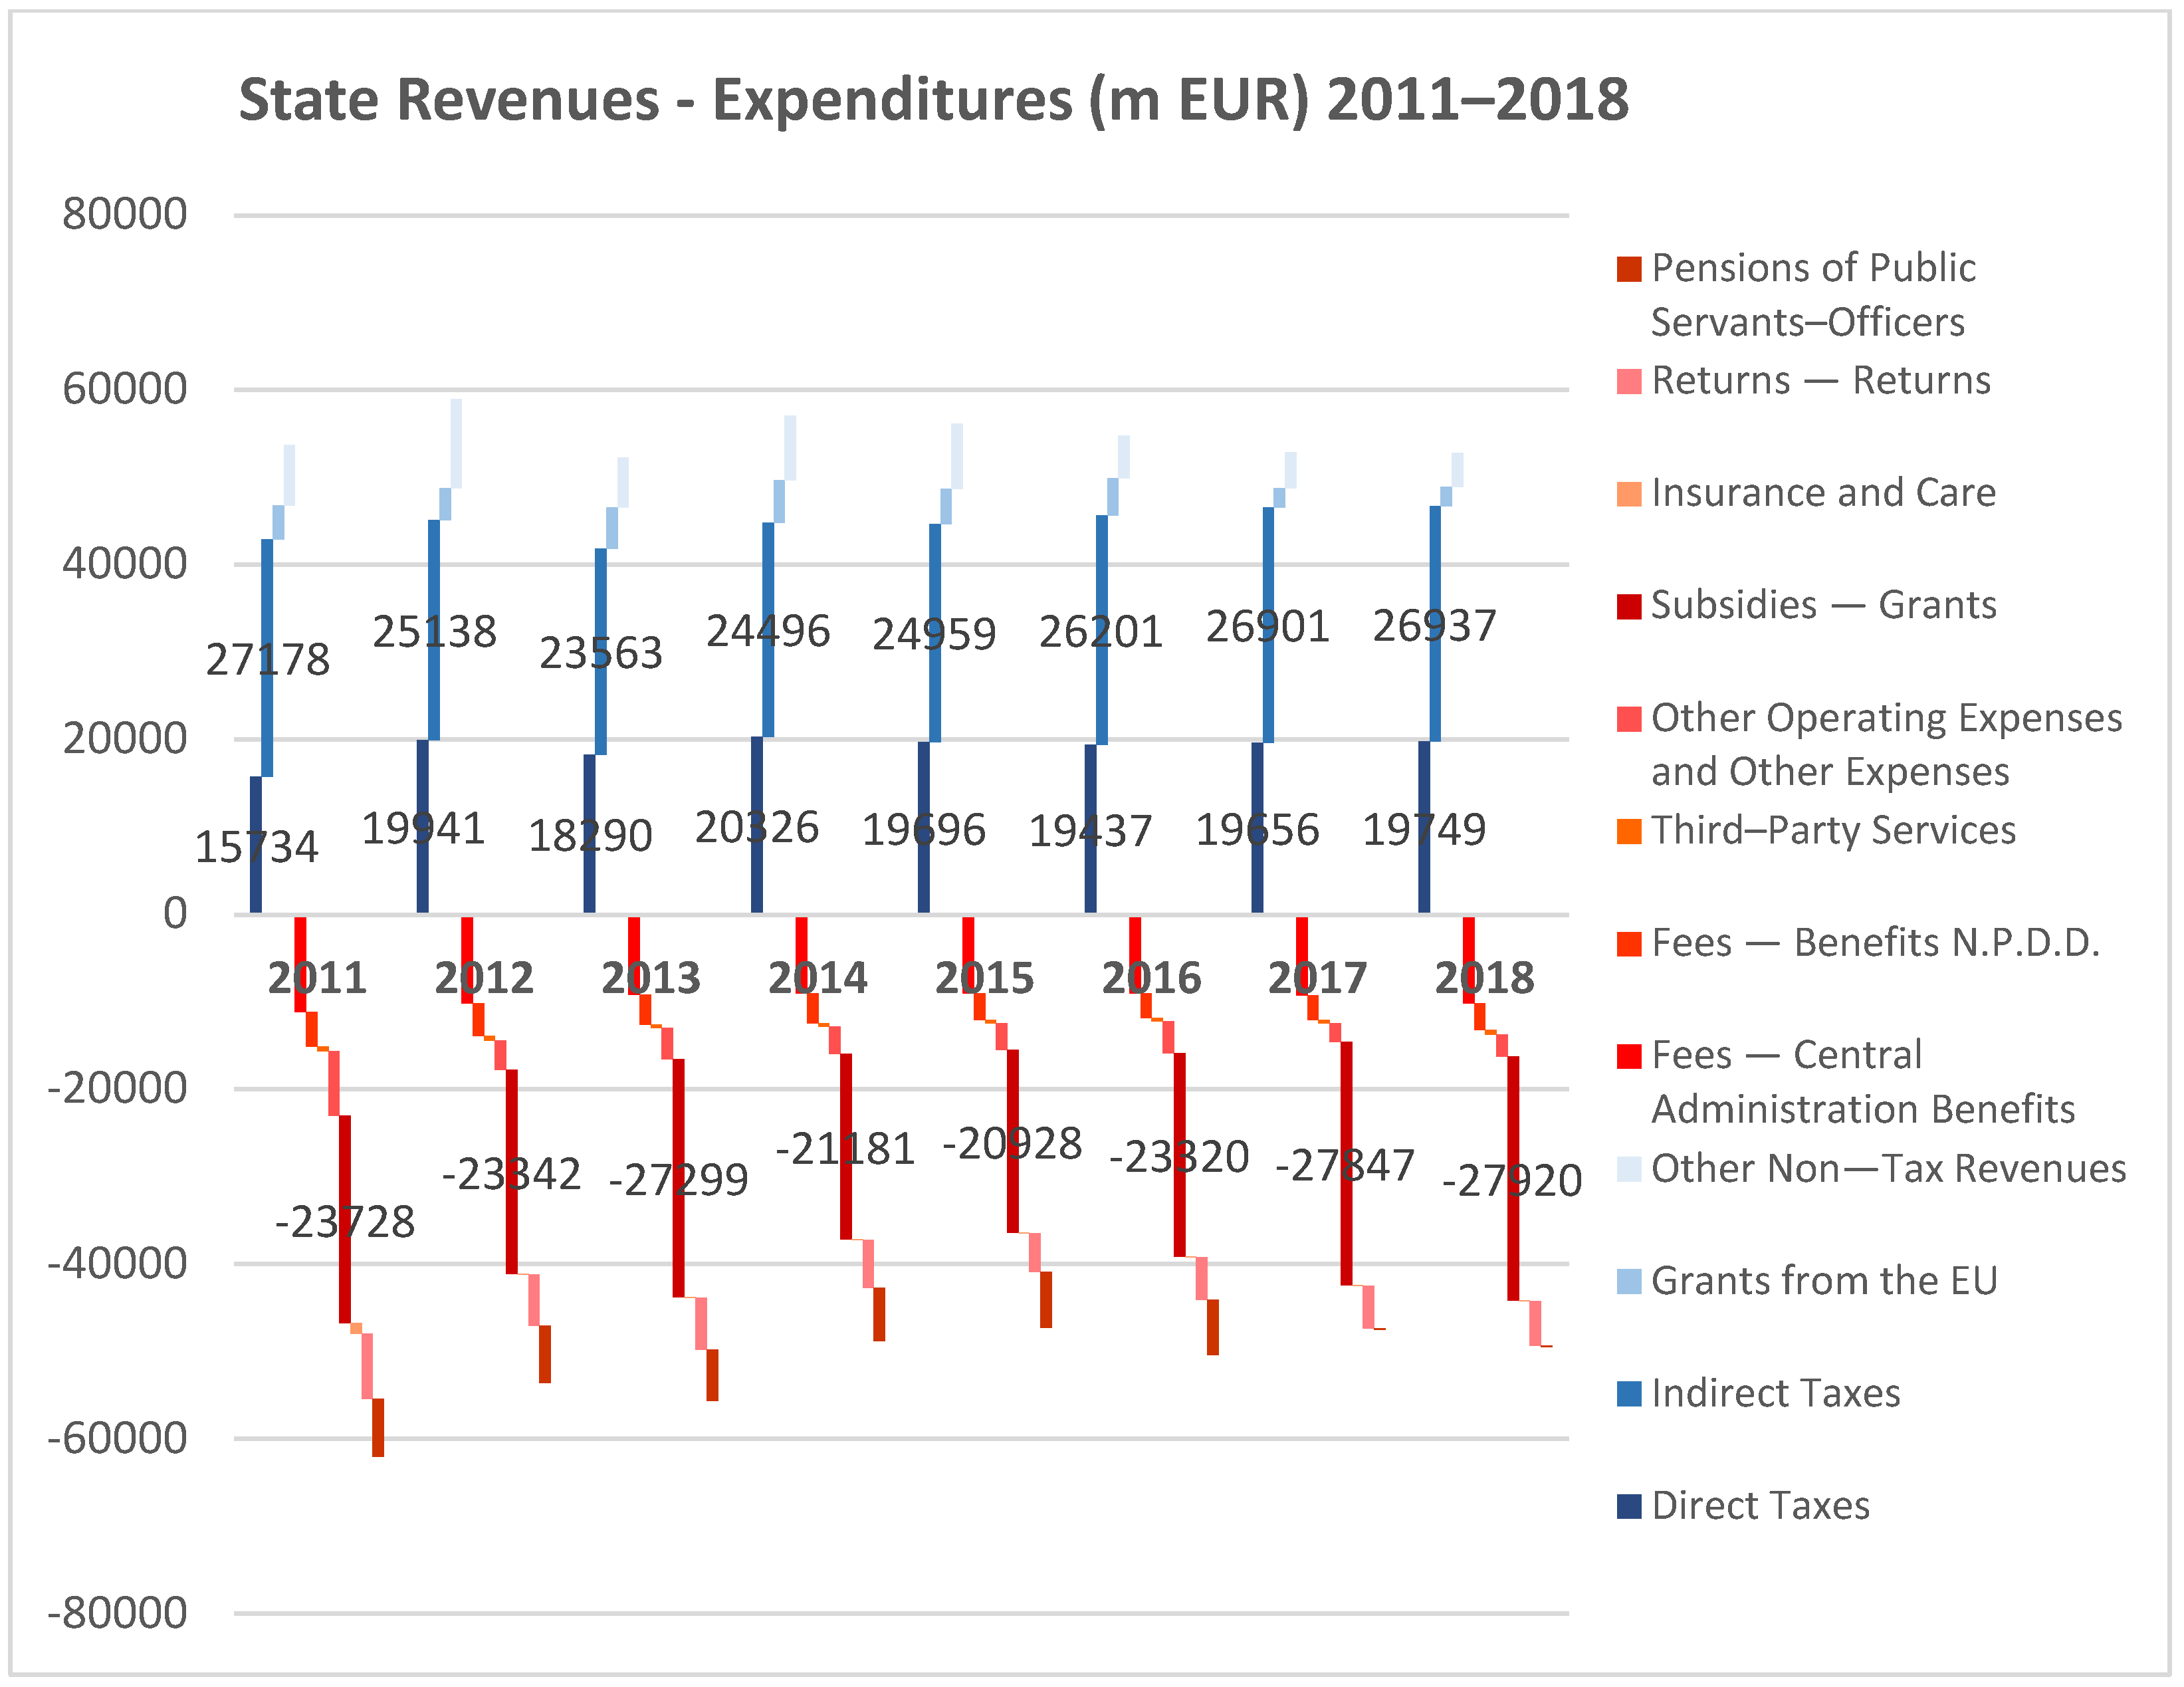
State Revenues and Expenditures (m EUR) 120112012201320142015201620172018
Direct Taxes15.73419.94118.29020.32619.69619.43719.65619.749
Indirect Taxes27.17825.13823.56324.49624.95926.20126.90126.937
Grants from the EU3.9003.6804.6944.8454.0364.2762.2372.248
Other Non-Tax Revenues6.89410.2235.7437.4117.4704.8694.0703.844
Fees—Central Administration Benefits−11.179−10.183−9.212−9.019−9.017−9.069−9.276−10.191
Fees—Benefits N.P.D.D.−3.957−3.743−3.385−3.426−3.070−2.770−2.838−3.063
Third-Party Services−518−478−412−422−395−403−375−515
Other Operating Expenses and Other Expenses−7.408−3.390−3.526−3.131−3.028−3.617−2.089−2.526
Subsidies—Grants−23.728−23.342−27.299−21.181−20.928−23.320−27.847−27.920
Insurance and Care−1.174−61−73−58−56−58−63−67
Returns—Returns−7.479−5.843−5.905−5.486−4.401−4.828−4.888−5.074
Pensions of Public Servants—Officers−6.572−6.564−5.868−6.110−6.411−6.370−132−113
State Operating Results6.2987.3901.37710.25910.8706.3647.3735.327
1 Source: Financial reports from Hellenic Ministry of Finance and Hellenic Court of Audit [9].
Table 2. IARP expenses (k EUR), 2017–2022.
IARP Expenses (k EUR) 1201720182019202020212022
Personnel expenses349.049367.388364.517376.099400.944413.510
Supplies of materials, equipment3665945.2255.95510.5296.530
Operating, maintenance, travel and other expenses11.48312.3326.0405.55713.04811.840
Expenses for legal and technical services10.3903.123826739
Expenses for banking services9491.1143.9718.6943.24912.723
Other expenses (third party)19.3383.1987.122465587594
Leasing expenses18.63518.98917.94217.67618.56919.063
Subscriptions/contributions to organizations4629462929302
Returns/refunds of special excise tax26.95028.97211300
Program costs4014600000
Compensation expenses and other (court decisions, etc.)5.922017.9929.04013.9397.112
Expenditure of public lotteries, etc.7.70012.93711.38722.73223.19028.625
Total451.229449.134434.260446.276484.091500.338
1 Source: IARP accounting statements [14].
Table 3. IARP’s personnel per category, end of 2022.
Personnel per Category 1Number%
Tax officers7.25466%
Customs officers2.34221%
Chemists2933%
Information technology officers2232%
Other officers9328%
Total11.044
1 Source: IARP annual reports [14].
Table 4. IARP’s number of financial audits (full and partial), 2017–2022.
Number of Financial Audits 1201720182019202020212022
Audit Center for Large Companies407417455442480593
Audit Center for Taxpayers of High Wealth9539501.4977611.200923
Taxation Services of Société Anonyme Companies2.4652.7712.2832.071
Regional Taxation Services22.95422.24622.82321.08911.82913.329
Audit Centers and Regional Taxation Services 10.48110.186
Total26.77926.38427.05824.36323.99025.031
1 Source: IARP annual reports [14].
Table 5. IARP’s number of financial inspections (on-site), 2017–2022.
Number of Financial Inspections (On-Site) 1201720182019202020212022
Regional Taxation Services86.59186.09279.31836.89439.13259.676
Services for Investigations and Safeguarding Public Revenue (Attica, Thessaloniki, Patras, Iraklion)18.14823.95225.46917.92325.30721.087
Total104.739110.044104.78754.81764.43980.763
1 Source: IARP annual reports [14].
Disclaimer/Publisher’s Note: The statements, opinions and data contained in all publications are solely those of the individual author(s) and contributor(s) and not of MDPI and/or the editor(s). MDPI and/or the editor(s) disclaim responsibility for any injury to people or property resulting from any ideas, methods, instructions or products referred to in the content.

