1. Introduction
Over the years many methods have been developed to study correlations and fluctuations in heavy-ion collisions. One technique is to examine forward-backward (FB) multiplicity correlations. A measure of the forward-backward correlation strength is the
forward-backward correlation coefficient . This observable is usually defined in terms of the Pearson correlation coefficient as the covariance of two multiplicity distributions in forward and backward pseudorapidity (
) intervals, divided by the product of their standard deviations:
In the above formula is the number of particles emitted in the backward (forward) pseudorapidity interval.
A major drawback of the FB correlation coefficient is the fact that in addition to carrying important information on the early dynamics of the heavy-ion collision, the coefficient
appears to be largely dominated by geometrical (volume) fluctuations, i.e., event-by-event fluctuations of the number of participant nucleons [
1,
2]. It is also subject to other types of statistical fluctuations, and depends on the total number of particles produced in a given rapidity bin as exemplified by Equation (
3) below.
In heavy-ion physics, two families of
strongly intensive quantities, namely observables that do not depend on system volume nor system volume fluctuations, were introduced in Ref. [
3]. The
observable belongs to one of them. In the context of forward-backward multiplicity fluctuation studies, the
quantity is defined by the combination of forward and backward first moments
, forward and backward scaled variances
and the covariance of forward and backward multiplicity distributions:
According to Ref. [
3], in terms of independent source models (That is, simple superposition models of statistically identical sources producing particles independently. An example of an independent source model is the Wounded Nucleon Model [
4].) of multi-particle production, the
observable does not depend on the number of sources nor on their event-by-event fluctuations. Thus it carries direct information on characteristics of the single source distribution.
This paper reports on a comparative study of forward-backward correlations and multiplicity fluctuations in experimental data and Monte Carlo (MC) HIJING simulations of Pb–Pb collisions at TeV. Both experimental data and simulations have been obtained in the framework of the ALICE experiment. The analysis focuses on two observables: the forward-backward correlation coefficient and the strongly intensive quantity .
2. Analysis Details
The experimental data sample, after a cut on vertex position cm, consists of 16 M minimum bias Pb–Pb events measured in Run I (2010) at TeV. The analysis was carried out for primary charged particles produced in forward and backward pseudorapidity intervals of width , symmetrically located around mid-rapidity (). The observables and were studied as a function of the centrality bin width () and as a function of the distance between the forward and backward intervals . In this analysis the gap, , was defined as the distance between the lower edge of the forward pseudorapidity window and the upper edge of the backward pseudorapidity window. The width of the centrality class was varied from , where the largest contribution from geometrical fluctuations was expected, down to centrality bin width. All observables were studied for different centrality classes of Pb–Pb collisions (from central to peripheral) in the kinematic region 0.2 Gev/ and , in full azimuthal angle ().
Results for the forward-backward correlations
and the strongly intensive quantity
were studied for two different centrality selection methods, both for the experimental data and MC HIJING simulations. The classification of the experimental data sample in terms of Pb–Pb event geometry was performed by using information from two independent ALICE centrality estimators: (a) the V0M, which provides centrality estimation in the range 0–80% of the total nuclear cross section based on charged particle multiplicity measurement in the V0 detector acceptance (
and
) and (b) ZDCvsZEM that allows for centrality determination in the range 0–40% of the total nuclear cross section based on the energy deposit of spectator nucleons in the ALICE Zero Degree Calorimeter (ZDC) correlated with two electromagnetic calorimeters (ZEM) [
5]. Similarly, for MC HIJING simulations, the centrality of the Pb–Pb collision in the first method was determined using the V0 estimator. Since the present version of the ALICE simulation framework does not provide event generator based calorimetric centrality selection which would coincide with the ALICE ZDCvsZEM, the second method was a direct selection of the impact parameter of the collision.
3. Results and Discussion
3.1. Forward-Backward Correlation Coefficient
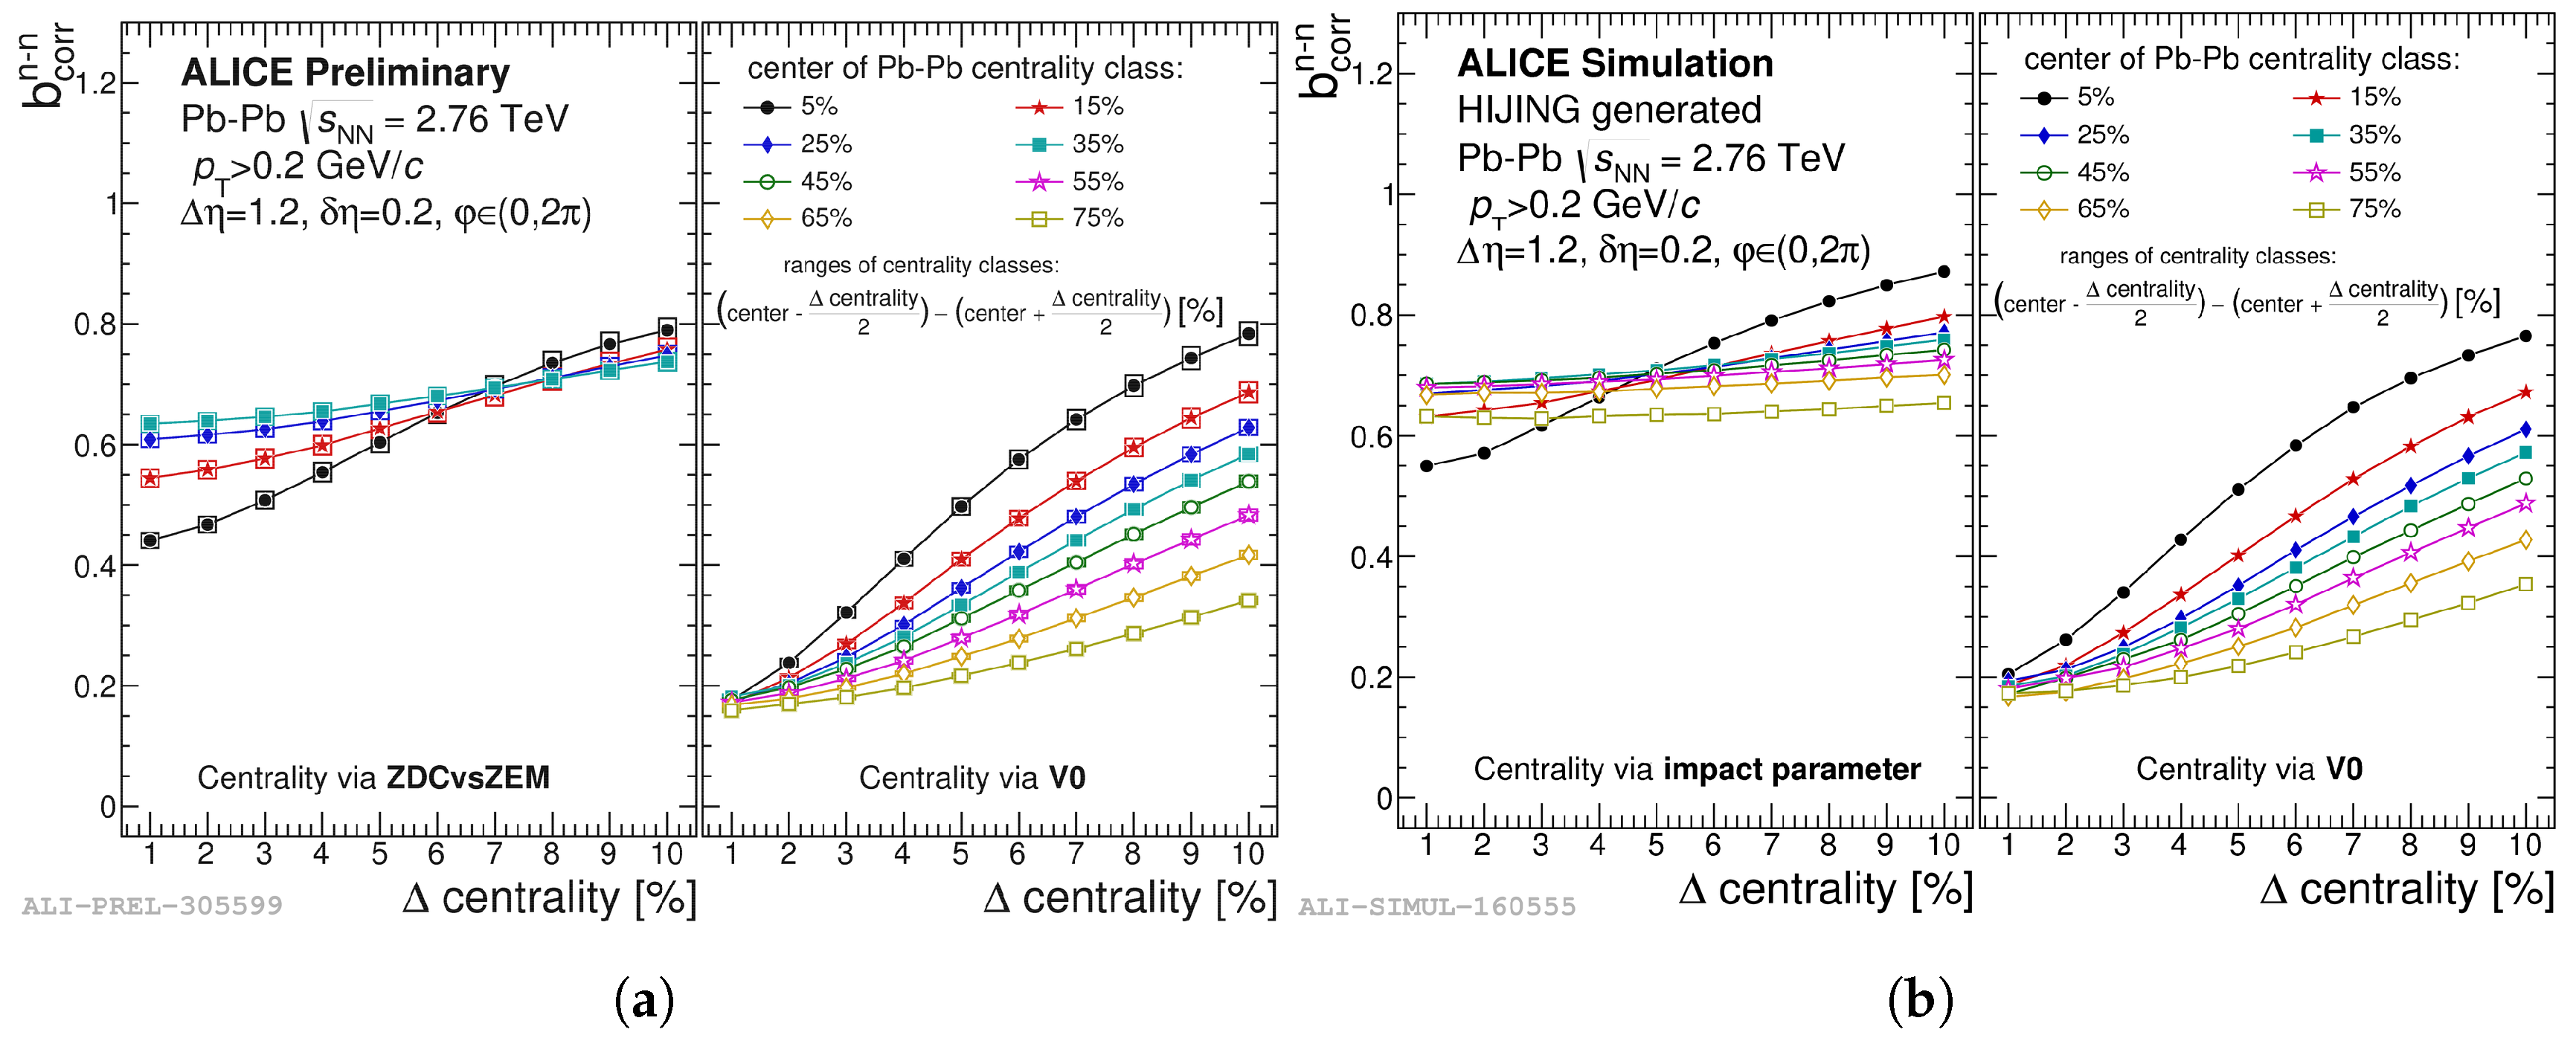
From the comparison between new Pb–Pb experimental data from ALICE,
Figure 1a, and MC HIJING simulations,
Figure 1b the following picture emerges on the behavior of
in relation to centrality bin size and chosen centrality selection method:
- (a)
In all panels of
Figure 1 a significant decrease of the correlation strength with decreasing size of the centrality class interval (from
to
) is observed, regardless of the chosen centrality selection method.
- (b)
There is an evident dependence of the forward-backward correlation coefficient on the centrality selection method. This is valid for all studied centrality classes of Pb–Pb collisions.
It should be noted that theoretical analysis presented in Ref. [
2] provides a qualitative explanation of the behavior observed in
Figure 1 for the FB correlation coefficient as a function of the centrality bin width. The paper derives the expression (Equation (
3)) for the forward-backward correlation coefficient in the Wounded Nucleon Model [
4], with particle emission from a single nucleon implemented according to the negative binomial multiplicity distribution (NBD):
Formula (
3) shows a clear dependence of the coefficient
on the scaled variance of the number of wounded nucleons (participants)
and on the parameters
,
k of the NBD.
From the above expression it is evident that the more reduced the fluctuation of participant nucleons (induced in our analysis by the reduction of the centrality bin width from
down to
) the smaller the value of the forward-backward correlation coefficient. The largest effect is expected for most central collisions, which is indeed the case in
Figure 1.
Clearly, also the observed dependence of
on centrality estimator can be read as a direct reflection of Formula (
3) in the experimental data and MC HIJING simulations. Indeed, different choice of centrality selection method (ZDCvsZEM, VZERO, impact parameter) leads to a different selection on the number of participants and to a different reduction of its fluctuations.
3.2. Strongly Intensive Quantity
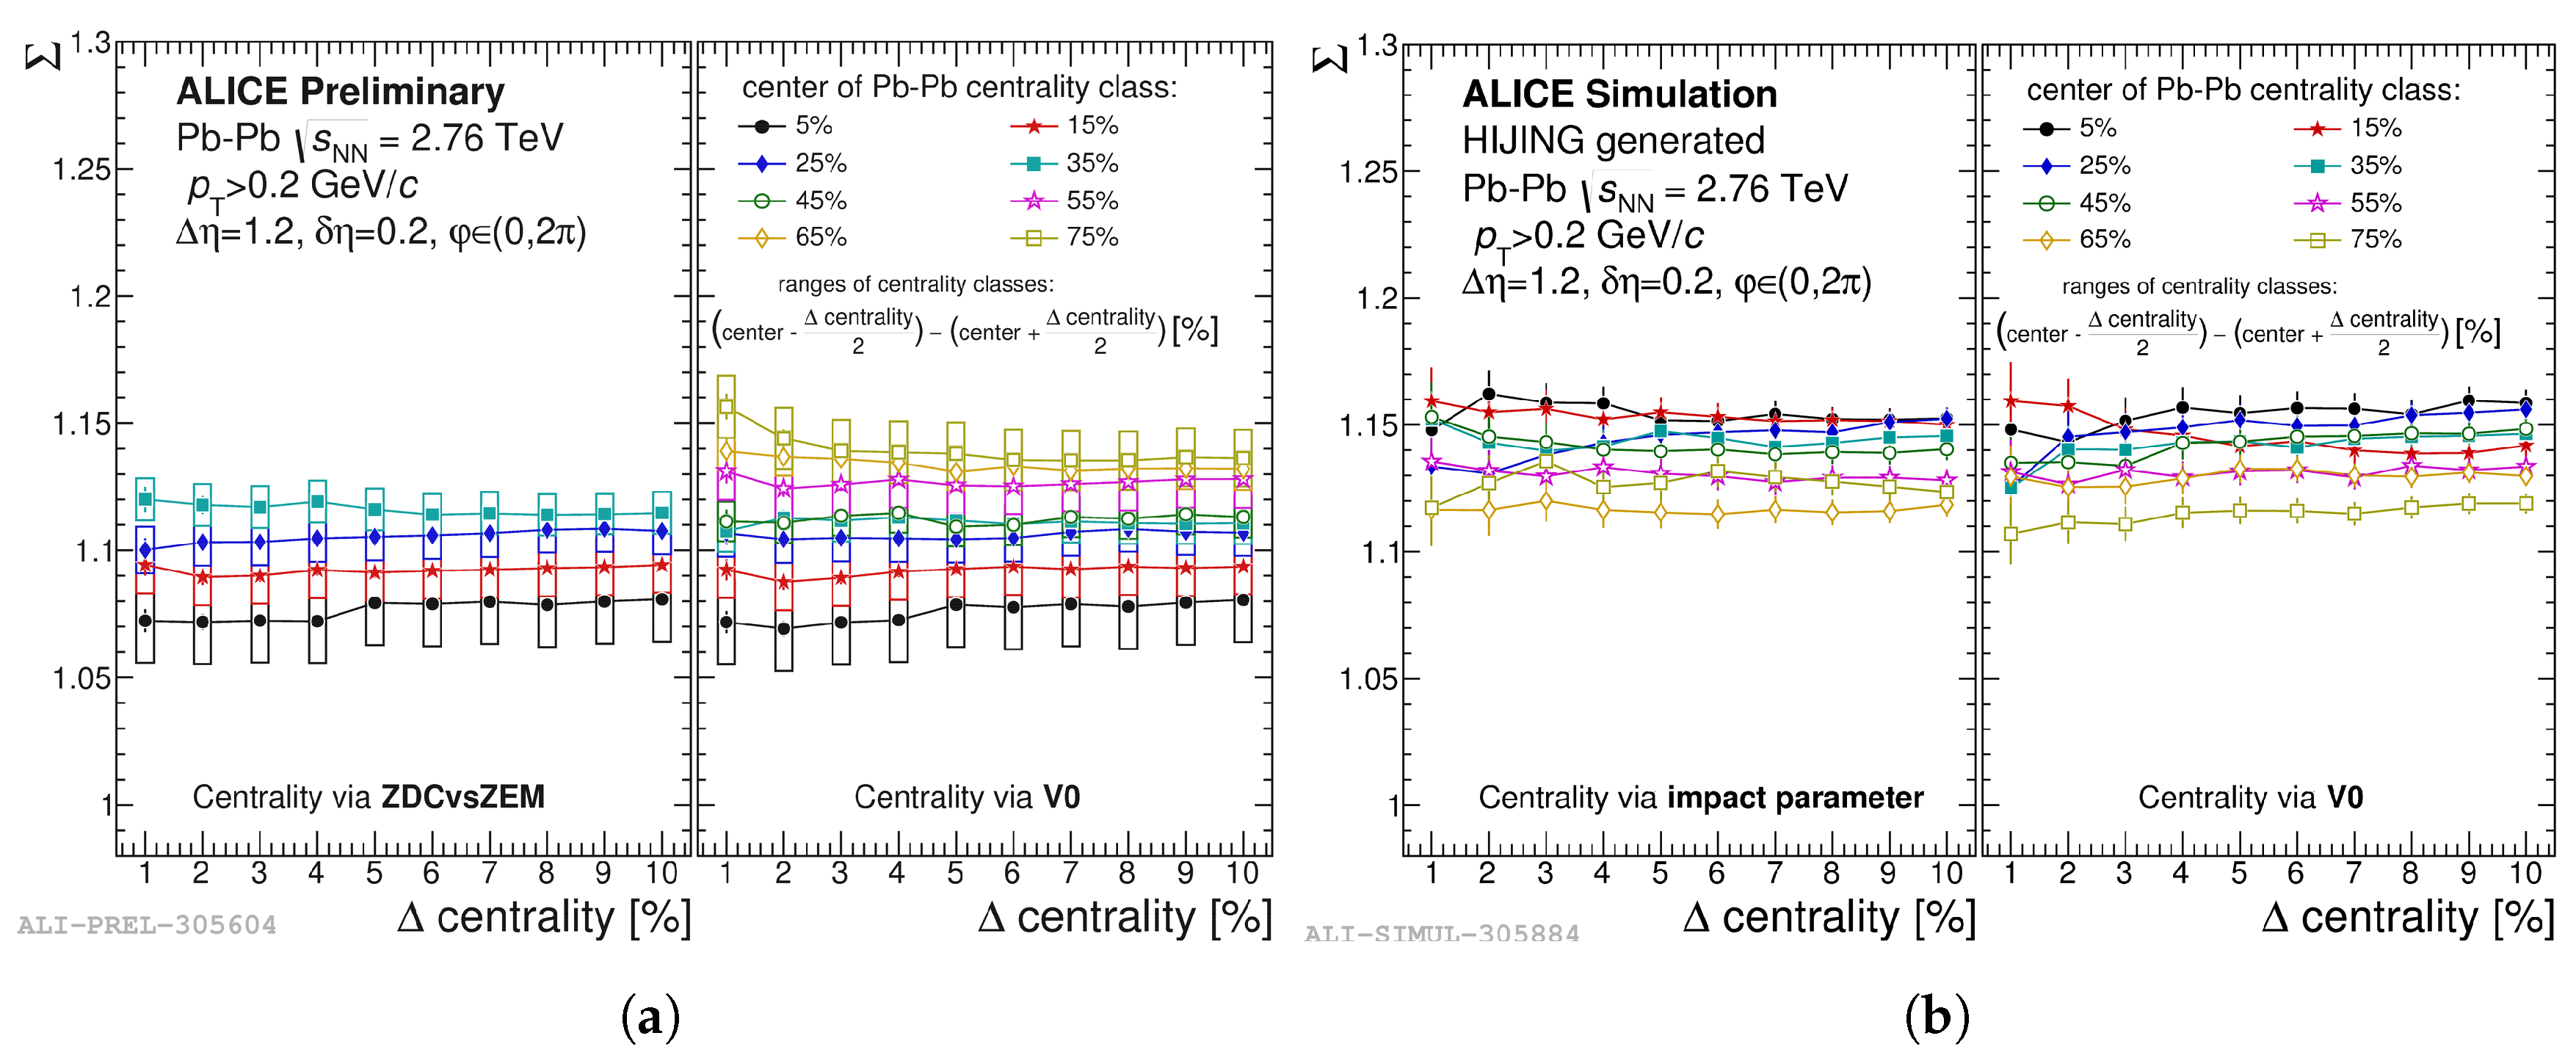
Figure 2 shows new ALICE results for the
quantity as a function of centrality bin width obtained for the experimental data and MC HIJING simulations of Pb–Pb collisions at
TeV. The main observations are:
- (a)
Contrary to the results obtained for the FB correlation coefficient , the data points measured for the observable appear unaffected by the reduction of centrality bin size. This behavior characterizes both the experimental data and MC HIJING results, regardless of the chosen centrality estimator. This implies that is insensitive to geometrical fluctuations.
- (b)
From the comparison between right and left panels of
Figure 2a,b, it is evident that the
observable is insensitive to the centrality selection method.
The lack of sensitivity to the centrality bin size and the centrality estimator, in both new ALICE experimental data and for MC HIJING simulations of Pb–Pb events, indicates that the observable indeed shows the properties of a strongly intensive quantity.
However, the most intriguing result emerges from the direct comparison of the behavior of
as a function of the centrality class between
Figure 2a and
Figure 2b. The MC HIJING simulations do not reproduce the centrality class dependence of
observed in the experimental data. It should be underlined that, in terms of independent source models, the strongly intensive quantity
should be only dependent on fluctuations arising from a single source emitting particles. This could imply the mechanism of particle production from the sources present in experimental data is not reproduced by MC HIJING simulations. It is important to mention here that some phenomenological models predict the ordering of observables like e.g., the FB long-range correlation (correlations between particles widely separated in rapidity,
) with centrality. Bearing the above in mind, the observed discrepancy between the ordering of the values of
with the centrality of Pb–Pb collision for the MC simulation and the experimental data is worth a further analysis, in the context of a possible new hint on the early dynamics of the ultra-relativistic heavy-ion collision.
4. Conclusions
New data on forward-backward multiplicity correlations and fluctuations in Pb–Pb collisions at TeV have been obtained in the ALICE experiment. In this paper a detailed study of the FB correlation coefficient , as well as a new analysis of the observable measured in Pb–Pb collision at TeV was carried out. In the case of the forward-backward correlation coefficient, information on the early dynamics of the collision is mixed with event-by-event geometrical fluctuations. Results for the coefficient show a large dependence on centrality bin width and centrality selection method for both experimental data and Monte Carlo HIJING simulations.
In this paper we also report a first measurement of the observable at ALICE energies. In experimental data and MC HIJING simulations, exhibits the properties of a strongly intensive quantity. As has been verified in this analysis, the values of do not depend on the centrality estimator and are basically insensitive to geometrical fluctuations. A detailed comparison of results obtained for the MC simulation and the experimental data has revealed a discrepancy between the ordering of the values of with the centrality of Pb–Pb collision. Taking into account that in terms of independent source models should carry information dependent only on characteristics of single sources, this finding is worth a further analysis in the context of a possible new information on the early dynamics of the ultra-relativistic heavy-ion collision.
