Abstract
In this work, we describe a cooperative air quality sensor architecture based on crowdfunded, mobile, electrochemical sensor based, monitoring systems. The platform aims to produce enhanced information on personal pollutant exposure and enable cooperative reconstruction of high resolution pictures of air pollution in the urban landscape. The calibrated devices are connected to smartphones that provide georeferenced visualization of personal exposure and session based log capabilities. A cloud based interface provides a sensor fusion based mapping capability exploiting google maps APIs. An in-lab calibration by linear regression with temperature correction has been computed and preliminary results have been reported. A small set of calibrated devices will be shipped to crowdfunders for extended field tests in different italian cities.
1. Introduction
Air quality is a significant concern for both healthy population and people suffering for different pathologies. Long or even short term exposure to significant pollution levels have been associated with the development or worsening of multiple pathologies ranging from Asthma to Lung Cancer [1]. Air quality patterns may significantly vary in space and time due to complex fluid dynamic effects occurring in the city landscape or to the hourly, daily and seasonal variation of human activities. However, most of the national states rely on the operation of networks of certified air quality monitoring stations in order to detect and monitor air quality in cities. Unfortunately, the average low spatial density of such networks do not permit to achieve the required resolution. As a result, consistent information on pollution at street level is still out of reach. On the other hand, this information can be paramount for assessing personal exposure to pollutant and for allowing informed choices like where to live or which route to avoid when moving through the city, etc., all having a significant impact on personal and public health and economy. In the end, monitoring the personal exposure to air pollutants, requires high spatial and temporal resolution data possibly recorded on the body. Several EU projects have explored the possibility to use air quality monitoring systems based on solid state sensors technologies but, still, limitations in terms of sensitivity, selectivity, stability have slowed down their commercial availability. In the last few years, though, several commercial systems have been proposed on the market for building pervasive sensing networks. These systems also allow to monitor pollution where the deployment of conventional analyzer is forbidden for costs or dimensional issues. Monitoring the personal exposure for health related issues, however, will require wearable systems that can continuously monitor the pollution levels to which a subject is exposed. The same systems could be used to cooperatively reconstruct a high resolution picture of street level pollution to the benefit of users that do not carry a personal analyzer. In this paper, we propose a prototype architecture for an intelligent solid state based air quality analyzer aiming to personal and cooperative air quality monitoring. The current system, based on electrochemical sensors, represent a new version of our previous one, that was based on MOX sensing devices [2]. The new device is designed to embed computational intelligent components aimed to partially correct for environmental and non-target pollutant interferents. A crowdfunding campaign, resulted in a significant interest that, overcoming the crowdfunding objectives, has allowed to build a limited number of devices that will be distributed to the crowdfunders for 1 month. During this period, crowdfunders will monitor their personal exposure while moving in the city and their recordings will be incepted by the backend infrastructure contributing to create a map of pollutants concentrations. In the following chapter, details on the monitoring device, the backend infrastructure, the calibration procedure and the crowdfunding campaign are given. Finally we conclude discussing the first results of the crowdfunding campaign and the expected results of its second stage encompassing the actual on the field measurement campaign.
2. Material and Methods
2.1. The MONICA 2.0 Architecture
An array of three electrochemical sensors form Alphasense, ltd. and an environmental RH + T sensor (sensirion SHT75) characterize the sensor node. The gas sensors are targeted to CO (CO-A4), NO2 (NO2-A43F) and O3 (OX-A431) that are among the most relevant air pollutants in city. Together they represent significant threats to human health with particular regard to long-term exposure (CO, NO2) and short term exposure (O3). They are also significantly correlated to car traffic and building heating pollution (CO, NO2) and secondary photochemical pollution (O3). A known cross interference between NO2 and O3 affect the respective sensors while all the sensors show a relevant response to temperature. The CO sensor (CO-A4) shows a noise level of 20 ppb and a sensitivity of 220 to 375 nA/ppm at 2 ppm. Conversely, the NO2 sensor should show a noise level of 15 ppb and a sensitivity of −175 to −450 nA/ppb at 2 ppm. Finally, the O3 sensor datasheet information shows a noise level of 15 ppb and a sensitivity of −200 to −650 nA/ppm at 1 ppb. The sensing array has been connected to a microcontroller unit, namely the STM32 Nucleo board (v. L432 KC) from ST microelectronics and in particular to its ADC unit (16 bit) using the Alphasense analog front end (AFE 810-0020-00). The firmware controls data acquisition and conversion providing a duty cycle with a variable sampling rate period of 1 to 75 s for the entire sensor array, furthermore oversampling techniques have been implemented to perform noise reduction.
Data transmission functionalities rely on an EDR 2.0 Bluetooth™ shield while power subsystem is based on a lithium battery which guarantees more than thirty hours of autonomy. The entire system is enclosed in a 12 × 10 × 6 cm box with three 3 × 3 cm fans that helps maintaining a constant air flow near the sensitive edge of the sensor units (see Figure 1). In order to operate, the sensor node is connected to a smartphone using the BT interface. Using the MONICA™ Android™ app, the smartphone provide for geolocalization and backend connectivity via 4G networks. Furthermore, the app provide the user with instantaneous and averaged personal exposure index, computing a norm of the concentrations, normalized to respective 8 h average limits set by EU. The same index is used for color coding the routes followed by the user when moving around the city, associating different colours to different concentrations (see Figure 2a).
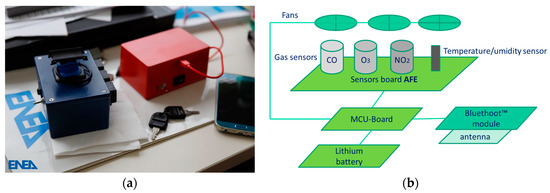
Figure 1.
(a) Two MONICA 2.0 system prototypes, one of which featuring a bike mounting device and (b) the MONICA 2.0 node architectural scheme.
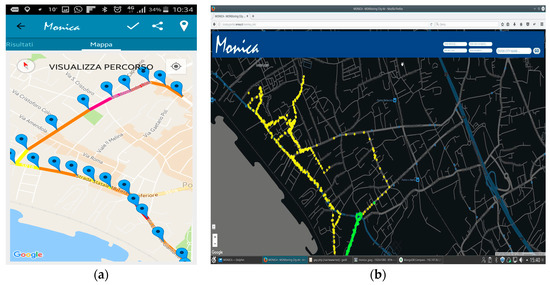
Figure 2.
(a) Android App activity showing the colour coded route during a mobility session and (b) an example of the web based pollution map built with simulated data.
Data recorded by the Android App is stored in a timestamped JSON document, grouped in a mobility session and sent to a single server NOSQL repository relying on MONGODB 2.4 [3], from which session data can be retrieved, whenever needed, by the user that provided it. These information are shared among all the user and are used to build a 2D map of air pollution in order to provide a detailed view to the benefit of all the contributing users that were not able to obtain a MONICA device via a web interface (see Figure 2b).
2.2. Lab Calibration Procedure
An in lab calibration setup have been devised for improving sensors accuracy. This aims to develop a linear calibration algorithm for single gases with temperature correction. The result of the calibration also permit to validate in-factory sensor calibration parameters extracting temperature/humidity dependencies of sensibility and zero gas output. The calibration architecture replicates the MONICA architecture in each subsystem while sensor array itself is located in a climatic chamber in which the pollutant can be mixed with the carrier gas (synthetic air) in arbitrary concentrations. The set point is changed according to a specified recipe spanning the predefined range of relevant concentrations. Humidity and temperature may be also changed. If needed, quaternary mixtures can be generated mixing different analytes for cross interference assessments.
3. Results and Conclusions
For the sake of brevity, we will focus our analysis on the CO sensor while similar results have been obtained by the other sensors. Figure 3a,b shows the response of one of the sensor (CO) while exposed to varying concentrations of the pollutant in the relevant air quality range. As we can see the sensor exhibit a quasi-linear behavior that can be captured with interesting accuracy by a univariate linear regression curve. Nonetheless, the signal dependence to temperature is significant and a temperature based linear correction was needed (see Figure 4a). A crowdfunding has been set up on the Eppela web site [4] with the aim of enhancing public interest and to develop a first fleet of 15 chemical multisensor units and their calibration. The campaign lasted three months including preparation and set up, ending on 17 December 2016. After a calibration refinement conducted with on field data, the first calibrated node are expected to be shipped to the funders on September 2017. Each of the most active funders (44 out of 103 contributors) will receive a MONICA™ node and will use it to produce and record pollution data for 40 days. Their data will be used to realize an effective field test of the architecture as well as building up high resolution maps of the air pollution in the time-space manifold including their routine routes in their cities (see Figure 4b).
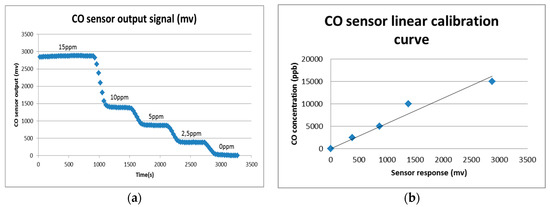
Figure 3.
(a) CO sensor response during in lab univariate calibration recordings and the corresponding linear calibration curve.
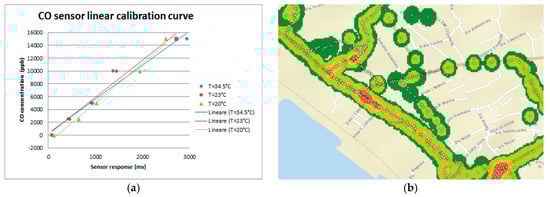
Figure 4.
(a) CO sensor linear calibration curves at different temperatures; (b) time averaged pollution maps generated by preliminary experiments conducted in the city of Portici (NA), Italy. Red areas indicates significant pollution in areas usually affected by high car traffic.
Conflicts of Interest
The authors declare no conflict of interest.
References
- World Health Organization (WHO). Health Risks of Air Pollution in Europe—HRAPIE Project: Recommendations for Concentration—Response Functions for Cost-Benefit Analysis of Particulate Matter, Ozone and Nitrogen Dioxide; WHO Regional Office for Europe: Copenhagen, Denmark, 2013; 60p. [Google Scholar]
- Capezzuto, L.; Abbamonte, L.; De Vito, S.; Massera, E.; Formisano, F.; Fattoruso, G.; Di Francia, G.; Buonanno, A. A maker friendly mobile and social sensing approach to urban air quality monitoring. In Proceedings of the IEEE 2014 Sensors, Valencia, Spain, 2–5 November 2014; pp. 12–16. [Google Scholar] [CrossRef]
- MONGODB Website. Available online: https://www.mongodb.com (accessed on June 2017).
- MONICA Eppela Website. Available online: https://www.eppela.com/it/projects/9652-monica-il-tuo-navigatore-personale-antismog (accessed on June 2017).
Publisher’s Note: MDPI stays neutral with regard to jurisdictional claims in published maps and institutional affiliations. |
© 2017 by the authors. Licensee MDPI, Basel, Switzerland. This article is an open access article distributed under the terms and conditions of the Creative Commons Attribution (CC BY) license (https://creativecommons.org/licenses/by/4.0/).