Proceeding Paper

Development and Evaluation of Tri-Axial Fiber Bragg Grating Force Sensor for Catheter †

1
School of Mechanical Engineering, Sungkyunkwan University, Suwon, Korea
2
SKKU Advanced Institute of Nanotechnology (SAINT), Sungkyunkwan University, Suwon, Korea
3
Symbiosis Centre for Nanoscience and Nanotechnology (SCNN), Symbiosis International University, Lavale, Pune, India
*
Authors to whom correspondence should be addressed.
Presented at the Eurosensors 2017 Conference, Paris, France, 3–6 September 2017.
These authors equally share the first authorship.
Proceedings 2017, 1(4), 549; https://doi.org/10.3390/proceedings1040549
Published: 24 August 2017
(This article belongs to the Proceedings of Proceedings of Eurosensors 2017, Paris, France, 3–6 September 2017)

Abstract

:
Avoiding the electromagnetic interference is one of the most difficult technical challenge during catheterization. The use of an optical fiber force sensor in the catheter can be an alternative. Herein, two flexure structures were designed for catheter tip and simulated using ANSYS to verify their sensitivity and durability. Fiber Bragg Grating sensors were configured to measure the tri-axial force exerted on the catheter tip. Calibrated result shows that an optical fiber force sensor can measure an axial force of up to 50 gF with an accuracy of 1 gF. Our calibration results demonstrate reliable measurement with high accuracy with repeatability.

1. Introduction

Percutaneous coronary intervention (PCI) is a minimally invasiveprocedure of the heart that is performed along theblood vessels inside the human body. PCI is carried out using a catheter. During a cardiac catheterization procedure, the physicianattempts to reach certain locations through the blood vessels andperform an examination or treatment on the tissues of the heart [1]. The catheter exertsvarious forces onto the blood vessel walls from its tip and sides asit moves inside the patient’s vasculature system. If the catheteris inserted manually, the physician senses the forces at the end of the catheter.
In general, solid state or electrical sensorsare used as a force sensor in a catheter to monitor the applied force [2]. However, such sensors cause electromagnetic interference (EMI) and problems may therefore occur during an operation. Fiber optic sensors have been used as an alternative device to prevent this problem. Such sensors have many advantages over conventional sensors, such as their insensitivity to electromagnetic fields, small weight, minimal intrusiveness, easy termination, and flexibility. Over the last 20 years, many fiber optic force sensors have been proposed. A bending type of fiber optic sensor can be applied to measure many different physical quantities, such as the voltage, strain, temperature, and pressure [3]. Fiber Bragg Grating (FBG), which is based on a fiber optic sensor, is very attractive owing to its inherent wavelength response and suitability for a multiplexed operation. In particular, FBG sensors can be developed for multi-array sensing in terms of strain and temperature; however, the temperature needs to be excluded for a contact force measurement of the heart. Moreover, the flexibility of the FBG is essential because catheters often need to be steered into various positions to fit into a human vessel [4]. Studying the contact force measurement of a steerable catheter is important because the steering of the catheter will create a change in the FBG reflection spectrum, which consequently affects the force measurement results [5]. Moreover, FBG sensors have an advantage in preventing EMI when used in operating rooms, which have many electronic devices, making them suitable for catheter application [6].
In this work, an FBG-based miniature fiber-optic based tri-axial force sensor is proposed. To achieve the desired sensitivity, the flexures were designed, fabricated, and simulated to determine their performance capability. An optical fiber force sensor was fabricated by attaching three FBG optical fibers to the selected flexure, and the performance of the force sensor was then evaluated using a three-channel optical interrogator.

2. Materials and Methods

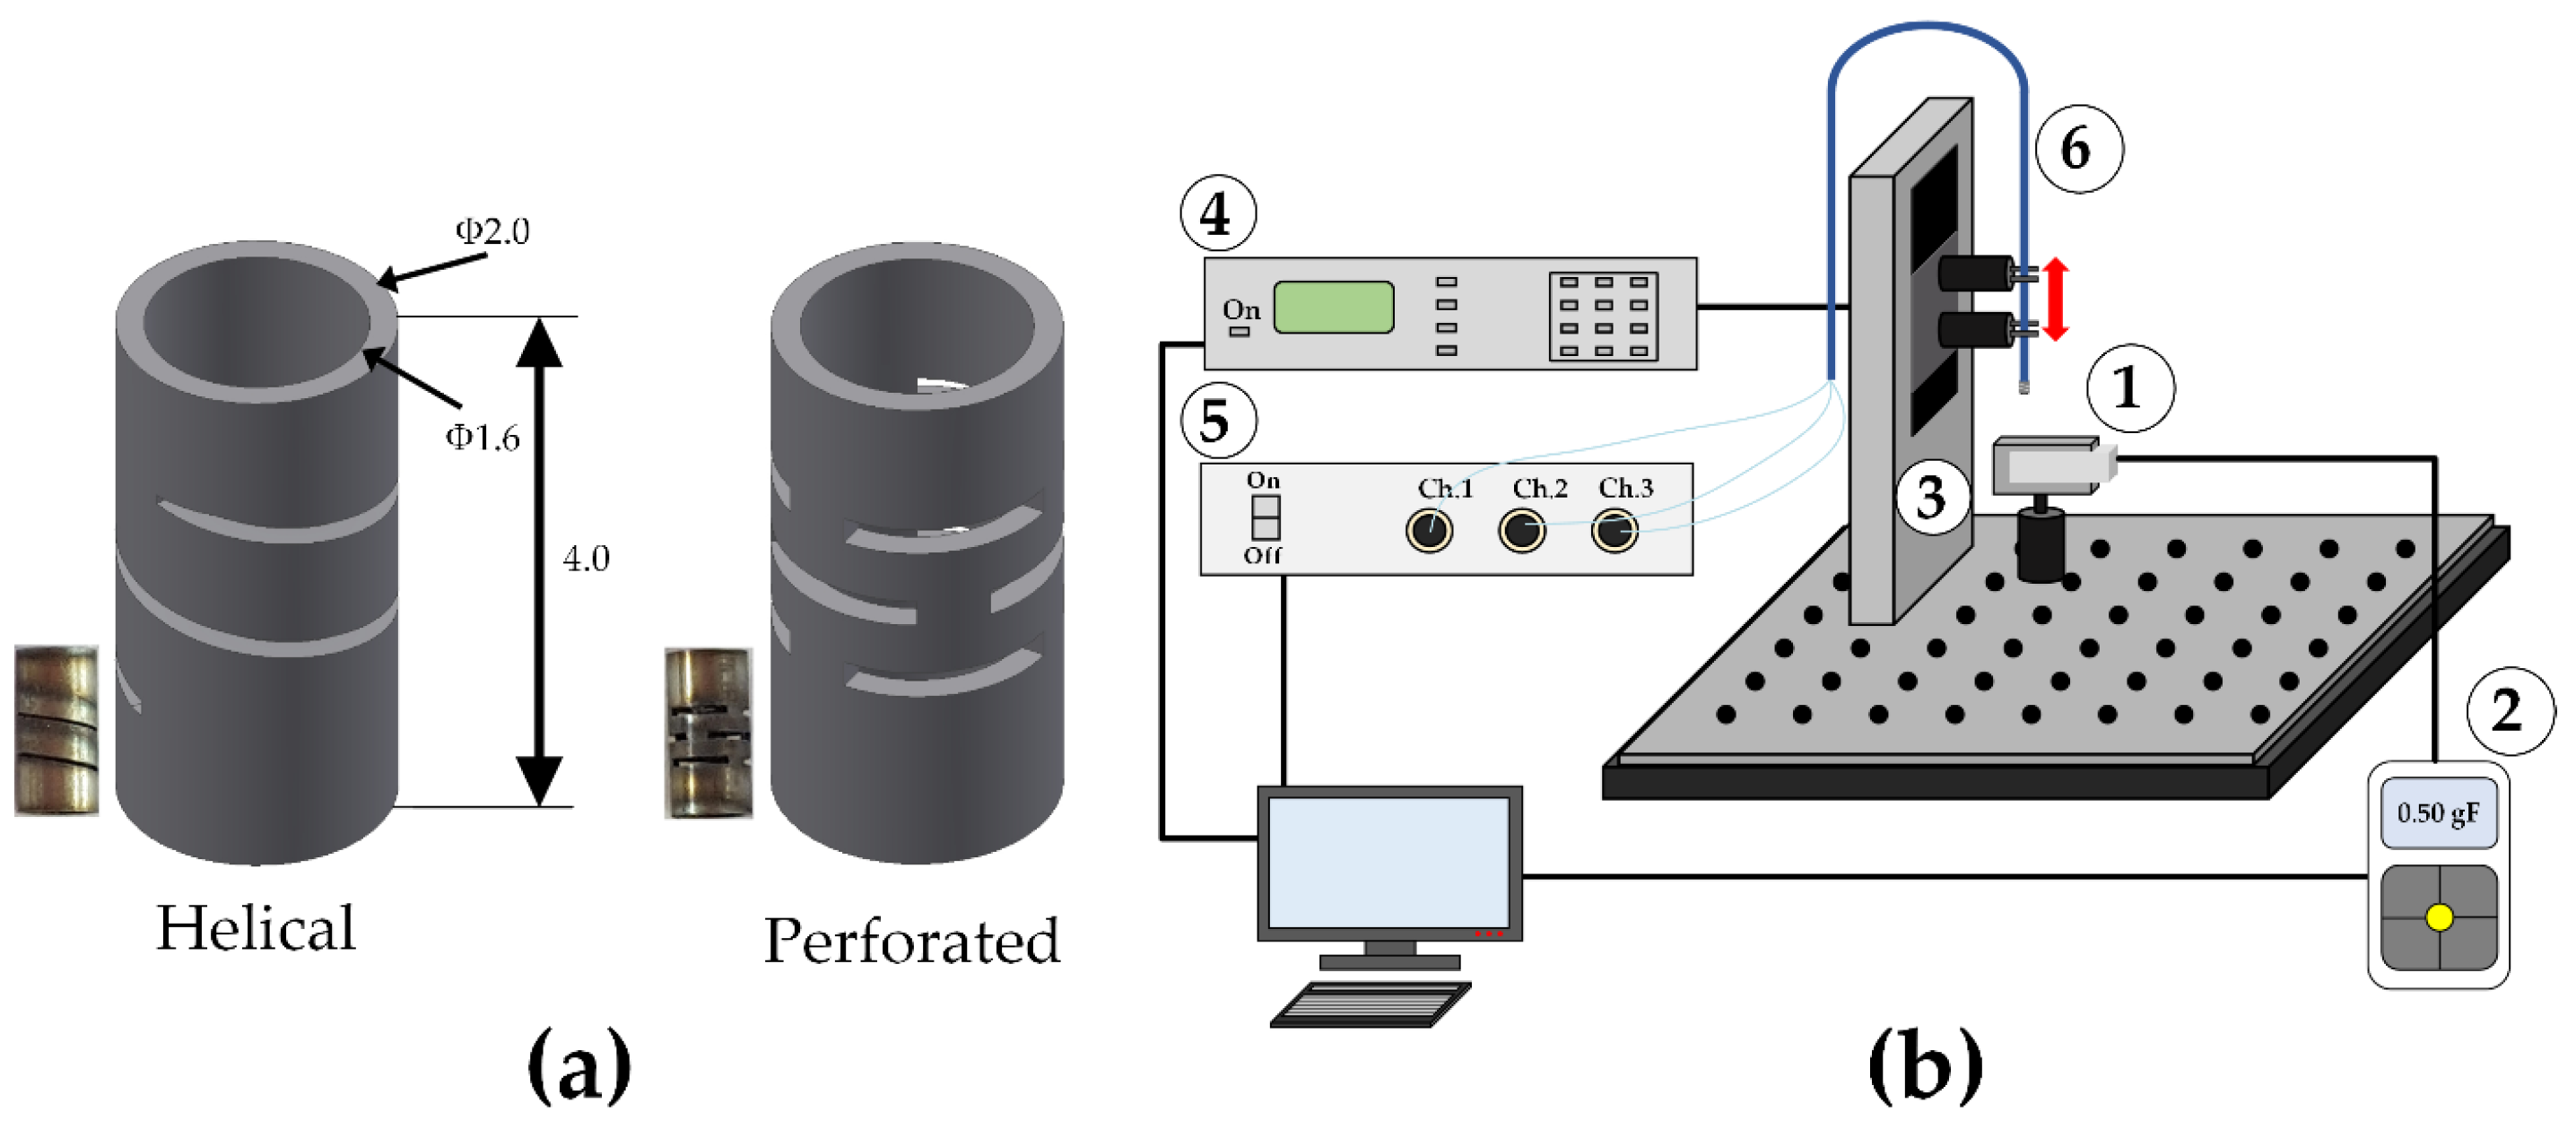
2.1. Flexure Structure Design and FBG Sensor Fabrication

Flexures convert the forces applied to the force sensor along a specific direction into a displacement or strain that can be measured by a transducer. The mechanical properties, size, and shape of the flexures determine the sensitivity, accuracy, and directional response of the force sensor. The stiffness of the flexures, and therefore the amount of deflection, is determined based on the dimensions and material properties of the components. In the present study, two types of flexures, helical and perforated, were designed and fabricated, as shown in Figure 1a. The stainless steel (SS) flexures have an outer diameter of 2 mm, inner diameter of 1.6 mm, and height of 4 mm. The only difference is the pattern used to make the flexures suitable for a force sensor application.
The FBG force sensor developed in this work had two parts, a flexure tip and fiber optic x. The FBG was designed using a FIBERPRO with a wavelength of 1550 nm, length of 1.5 m, and PI recoating. Three FBG optical fibers were attached along the flexure using resin (NOA68, NORLAND PRODUCTS Inc., Cranbury, NJ, USA) with 120° spacing to achieve vector force measurements. The FBG with flexure was connected with blue color of lumen which is elastomer with crossed wire structure so it was flexible and not torn from external force. The lumen has a high radius of curvature and can be protected inside the FBG.

2.2. Force Measurement Setup

The fabricated FBG force sensor was evaluated using a lab-developed force measurement setup, as shown in Figure 1b. The FBG sensor was mounted to a linear motion stage (UTS 50CC, NEWPORT) controlled through a motion controller (ESP301, NEWPORT) for precise motions of the FBG sensor tip, which was pressed to the load cell (MR04-025, MARK-10) to produce the required force. The load cell was connected to a PC to acquire data through a force gauge (M7i, MARK-10). The three FBG optical fibers are connected to a three-channel optical sensing interrogator (IFIS1010, FIBERPRO, Inc., Dae-Jeon, Korea) for recording the change in FBG wavelength. LabVIEW software was used to control the motion and acquire the FBG sensor force signal and applied force signal from the force gauge.

3. Results and Discussion

3.1. Operating Principle of FBG Sensor

The basic principle of operation commonly used in a FBG-based sensor system is to monitor the shift in wavelength of the returned “Bragg” signal with the changes in the measurements (e.g., strain and temperature). The Bragg wavelength, or resonance condition of a grating, is given by Equation (1)
λB = 2nΛ,
where n is the effective index of the core and Λ is the grating pitch [7]. With such a device, when injecting a spectrally broadband source of light into the fiber, narrowband spectral component at the Bragg wavelength is reflected by the grating. In the transmitted light, this spectral component is missing. Perturbations of the grating result in a shift in the Bragg wavelength of the device, which can be detected in either the reflected or transmitted spectrum. The strain response arises from both the physical elongation of the sensor (and corresponding fractional change in grating pitch) and the change in fiber index owing to the photoelastic effects.

3.2. Flexure Stress Distribution and Sensitivity

ANSYS software was used to analyze and evaluate the behavior of the designed and fabricated flexures under axial and lateral loadings to determine the amount of deformation under various axial and lateral loadings. As the main condition of a fabricated flexure, it should be able to withstand 50 gF; otherwise, the FBG sensor will be cut off. Figure 2a describes the flexure loading conditions at three different axes, i.e., 0°, 45°, and 90°. The sensitivity of the structure is the stress (MPa) divided by the force (gF), which in Figure 2b is compared between helical and perforated pattern structures for the three angles. The sensitivity of the helical structure is 8.70, 9.03, and 3.51 for the 0°, 45°, and 90° conditions, respectively. On the other hand, the sensitivity of the perforated pattern structure is 5.30, 6.93 and 0.19, respectively. The comparison of the sensitivity shows a 160%, 130%, and 1840% difference between the helical and perforated pattern structures. The condition at 90° shows the highest difference among the three. Lateral forces cause a higher twisting and deformation of the tube when compared to the corresponding axial loading. It should be noted that the sensitivity of a helical pattern structure is expected to be higher than that of a perforated pattern structure. Hence, for the FBG force sensor, we adopted a helical flexure structure.

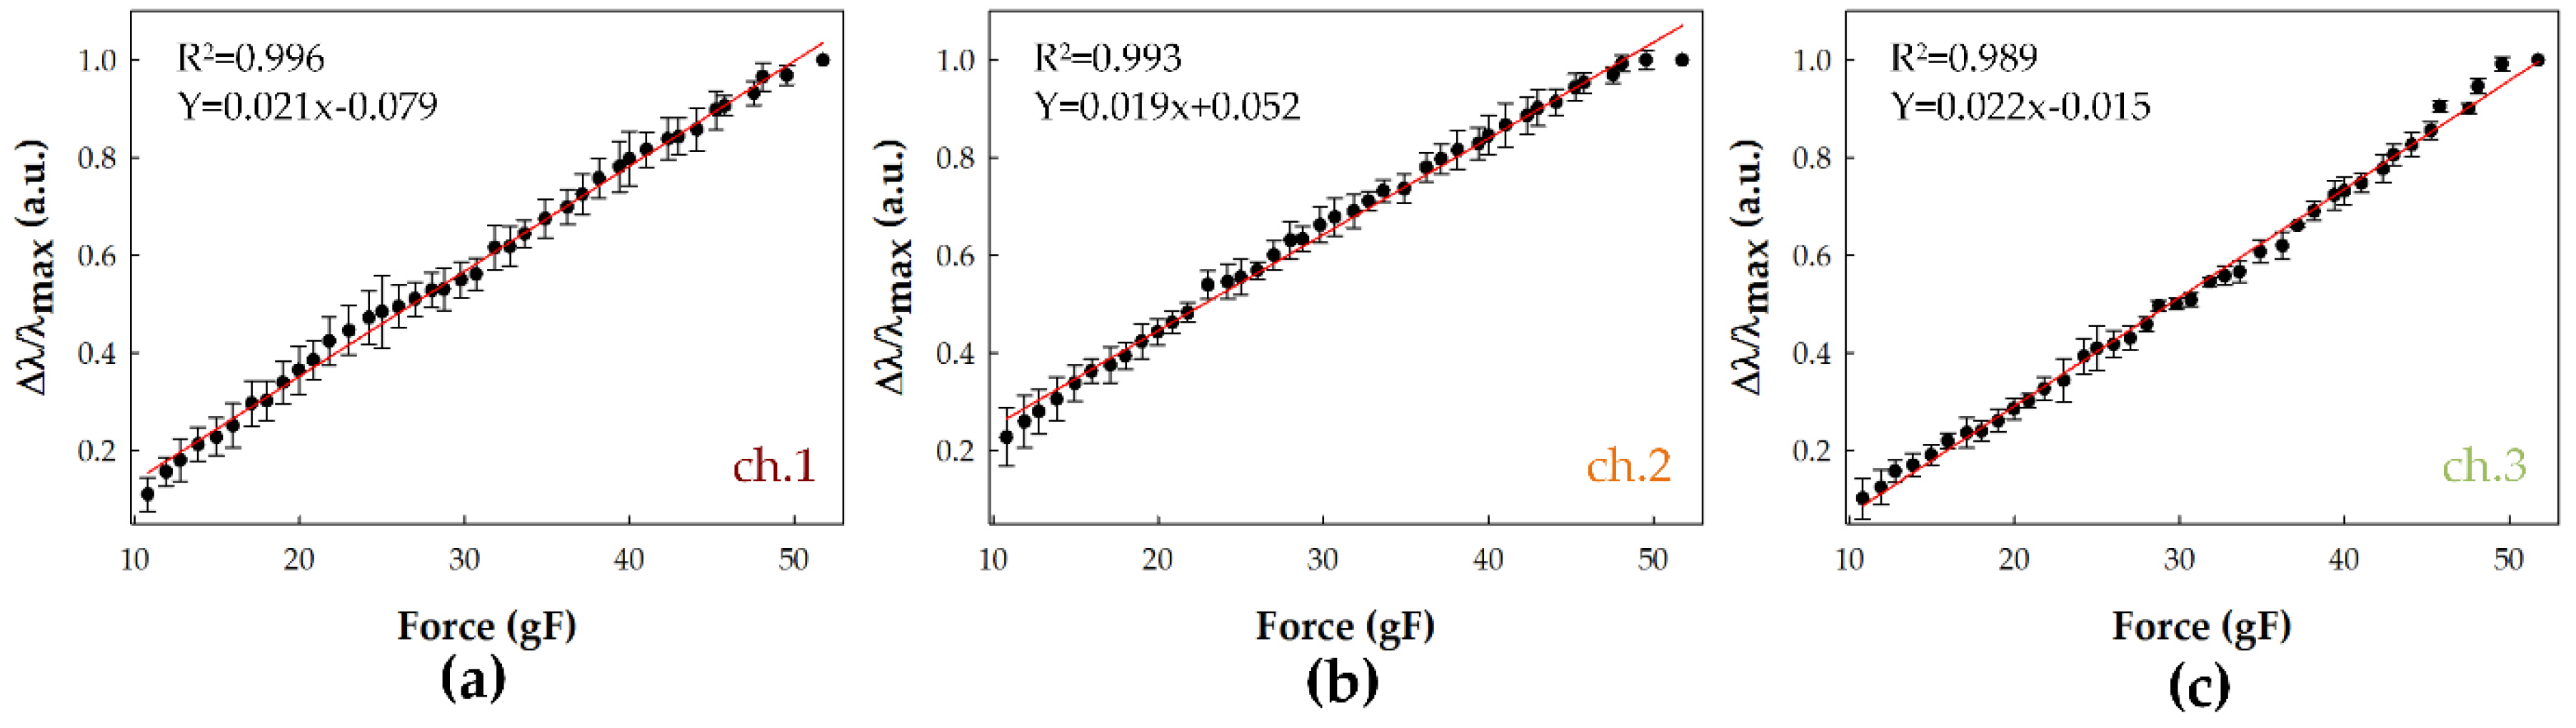
3.3. FBG Force Sensor Response

The force when pressing the tip of the FBG force sensor against the load cell was measured. The corresponding wavelength of the FBG sensor was recorded through the optical sensing interrogator. The wavelength of the interrogator has a resolution of 0.001 nm. To calibrate the relationship between the wavelength and force, the FBG force sensor was loaded with an increasing force in 1 gF increments up to a maximum operating axial force of approximately 50 gF, when the same force is exerted, the variations in wavelength are similar for each channel of the FBG sensor. The calibrated wavelength output is given through Equation (2):
Calibrated wavelength output = Δλ/λmax
where Δλ is the variation in wavelength, and λmax is variation in wavelength for the maximum force (50 gF) [8]. Under axial loading, the FBG force sensor has a calibrated wavelength output with a linear working range of 10 to 50 gF at a 1 gF resolution. The calibrated wavelength output was measured three times to determine its repeatability. The calibrated wavelength output was shown to be fairly linear with an R2 of over 0.970 for the three channels, and the slope of the calibrated wavelength output was 0.021, 0.019, and 0.022, as shown in Figure 3. The results showed high repeatability and stability.

4. Conclusions

In summary, we developed a tri-axial FBG force sensor for use in a catheter to avoid electromagnetic interference during a catheter operation. The FBG force sensor employs a three-channel FBG with a flexible tip structure and lumen. The FBG sensor was developed because an optical fiber can prevent EMI. Flexible structures were simulated using helical and perforated patternsto evaluate their strain and sensitivity. A helical pattern structure was shown to have a higher sensitivity than a perforated pattern structure. The FBG force sensor with a helical structure was measured within a linear working range of 10 to 50 gF. The FBG force sensor was carried out at a 1 gF resolution for accuracy and repeatability. The calibrated wavelength outputs showed a similar slope and accuracy among the three channels in real-time.

Acknowledgments

This work was supported by a grant of the Korea Health Technology R&D Project through the Korea Health Industry Development Institute (KHIDI), funded by the Ministry of Health & Welfare, Republic of Korea (grant number: HI14C0517).

Conflicts of Interest

The authors declare no conflict of interest.

References

  1. Polygerinos, P.; Puangmali, P.; Schaeffter, T.; Razavi, R.; Seneviratne, L.D.; Althoefer, K. Novel Miniature MRI-Compatible Fiber-Optic Force Sensor for Cardiac Catheterization Procedures. In Proceedings of the 2010 IEEE International Conference on Robotics and Automation (ICRA), Anchorage, AK, USA, 3–7 May 2010. [Google Scholar]
  2. Torres, B.; Payá-Zaforteza, I.; Calderón, P.A.; Adam, J.M. Analysis of the strain transfer in a new FBG sensor for structural health monitoring. Eng. Struct. 2011, 33, 539–548. [Google Scholar] [CrossRef]
  3. Kulkarni, A.; Na, J.; Kim, Y.; Kim, T. The plastic optical fiber cantilever beam as a force sensor. Microw. Opt. Technol. Lett. 2009, 51, 1020–1023. [Google Scholar] [CrossRef]
  4. Xu, L.; Ge, J.; Fok, M.P. Temperature-insensitive fiber-optic contact force sensor for steerable catheters. IEEE Sens. J. 2016, 16, 4771–4775. [Google Scholar] [CrossRef]
  5. Kersey, A.D.; Davis, M.A.; Patrick, H.J.; LeBlanc, M.; Koo, K.P.; Askins, C.G.; Putnam, M.A.; Friebele, E.J. Fiber grating sensors. J. Lightwave Technol. 1997, 15, 1442–1463. [Google Scholar] [CrossRef]
  6. Rao, Y.-J.; Webb, D.J.; Jackson, D.A.; Zhang, L.; Bennion, I. Optical in-fiber Bragg grating sensor systems for medical applications. J. Biomed. Opt. 1998, 3, 38–44. [Google Scholar] [CrossRef] [PubMed]
  7. Chung, K.M.; Liu, Z.; Lu, C.; Tam, H.Y. Highly sensitive compact force sensor based on microfiber Bragg grating. IEEE Photonics Technol. Lett. 2012, 24, 700–702. [Google Scholar] [CrossRef]
  8. Thiagalingam, A.; D’Avila, A.; Foley, L.; Guerrero, J.L.; Lambert, H.; Leo, G.; Ruskin, J.N.; Reddy, V.Y. Importance of Catheter Contact Force during Irrigated Radiofrequency Ablation: Evaluation in a Porcine Ex Vivo Model Using a Force-Sensing Catheter. J. Cardiovasc. Electrophysiol. 2010, 21, 806–811. [Google Scholar] [CrossRef] [PubMed]
Figure 1. (a) Helical and perforated pattern structure for force sensor tip with same dimensions (all dimensions are millimeter) (b) Schematic of the force measurement setup (1) load cell (2) force gauge (3) linear stage (4) motion controller (5) interrogator (6) FBG force sensor.
Proceedings 01 00549 g001
Figure 2. (a) Axial and lateral force at three degree conditions (b) sensitivity of helical and perforated pattern structure at three degree conditions.
Proceedings 01 00549 g002
Figure 3. The calibrated wavelength output response under every 1 gF axial loading for three channels of FBG force sensor.
Proceedings 01 00549 g003

