1. Introduction
Utilization of inexpensive and compact gas analyzers based on chemical sensors is usually confined to non-selective analysis of the systems with known composition. There is a clear need to develop relatively cheap and simple gas analyzers performing not only qualitative, but also quantitative analysis. It was previously supposed that this role could be played by multi-sensor systems, so called e-noses. However, reliability of these devices is low because a breakdown of one of the sensors leads to the failure of the whole device. Therefore, it is important to develop a device, which allows carrying out selective gas analysis using only one or two low-selective sensors. This task can be solved by means of non-stationary modes of device operation.
2. Materials and Methods
Sensitive material was prepared by sol-gel method. Surplus of hydrogen peroxide was added to the solution of tin acetate in the glacial acetic acid. Sol of α-tin acid was formed when small amount of ammonia add. Sol was precipitate by centrifuge. Tin dioxide nanopowder was formed as a result of tin acid calcination. Average size of SnO
2 granules was 4–6 nm [
1].
Glycol was added to nanopowder. Paste was placed onto special dielectric substrate with platinum electrodes. After calcination sensor was formed. In the present work we applied SnO2-based sensor with palladium and platinum additives (3% and 0.5% respectively).
Process analysis was organized using cycles with 15 s period. At the beginning of each period the sensor was heated up to 450 °C during 2 s and cooled to 100 °C during 13 s.
3. Results
3.1. Responses of Sensor
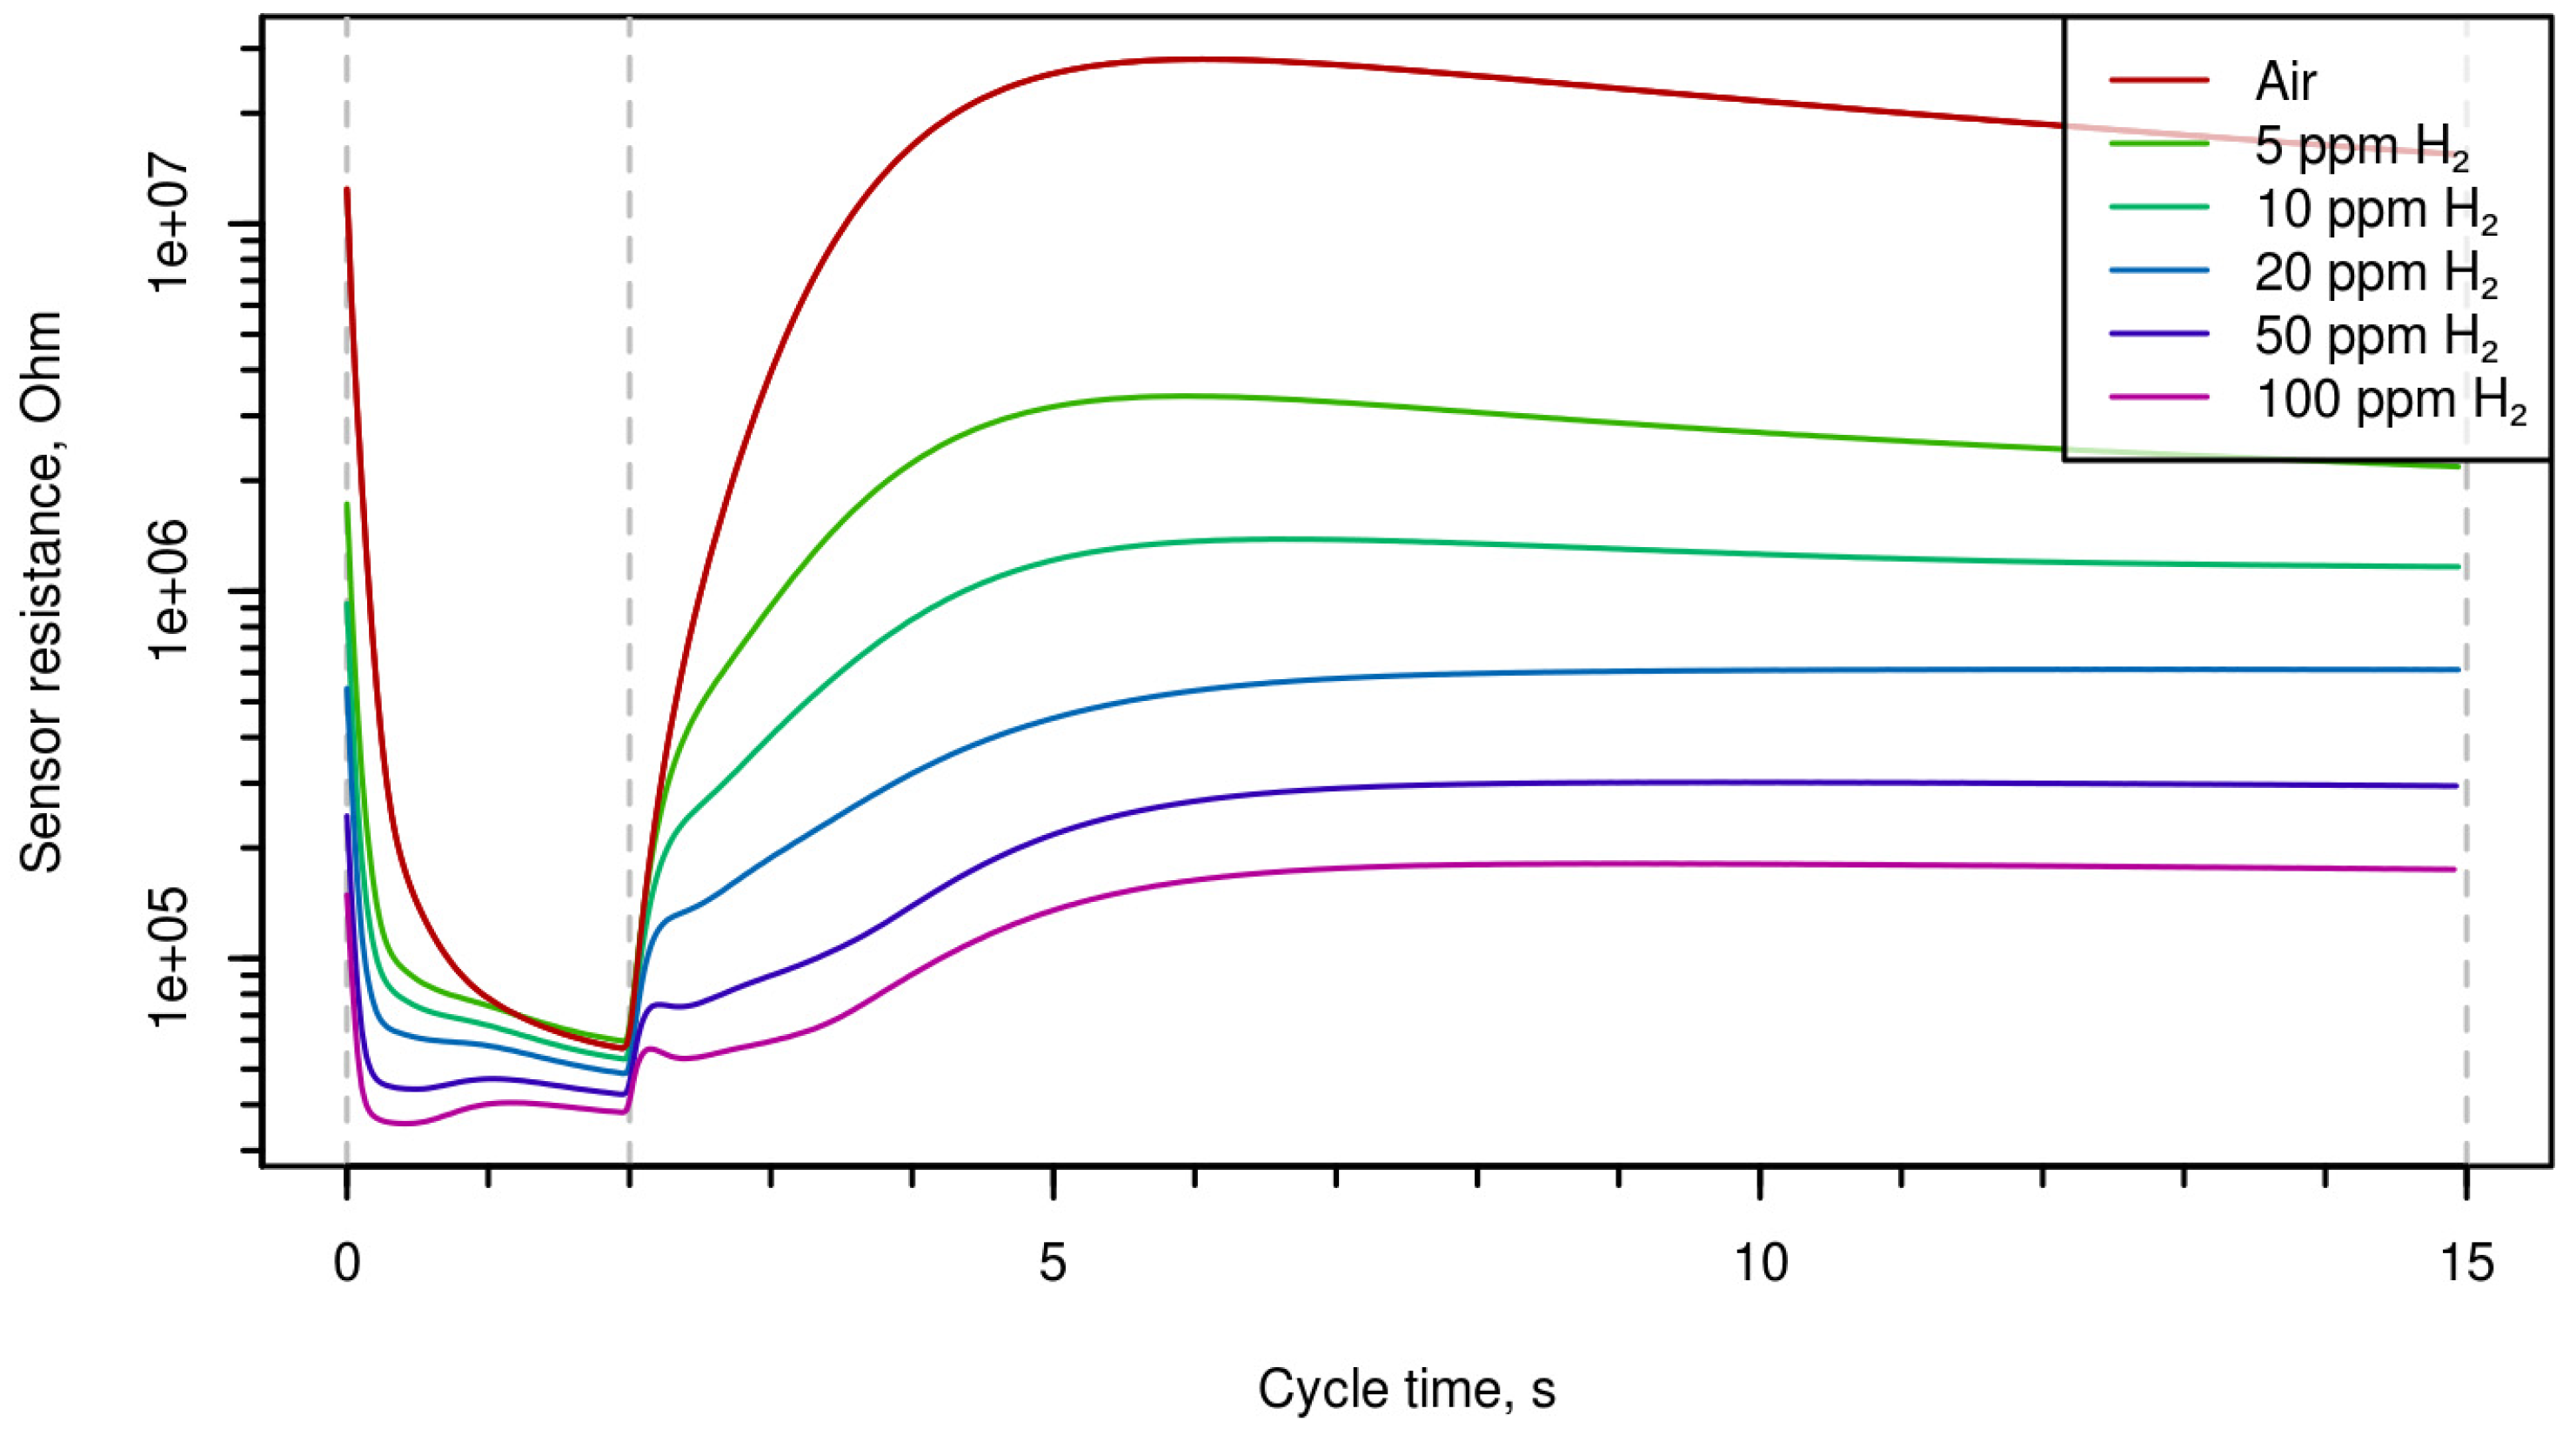
Time-resistance dependences during one period are shown in
Figure 1 (for different hydrogen concentrations),
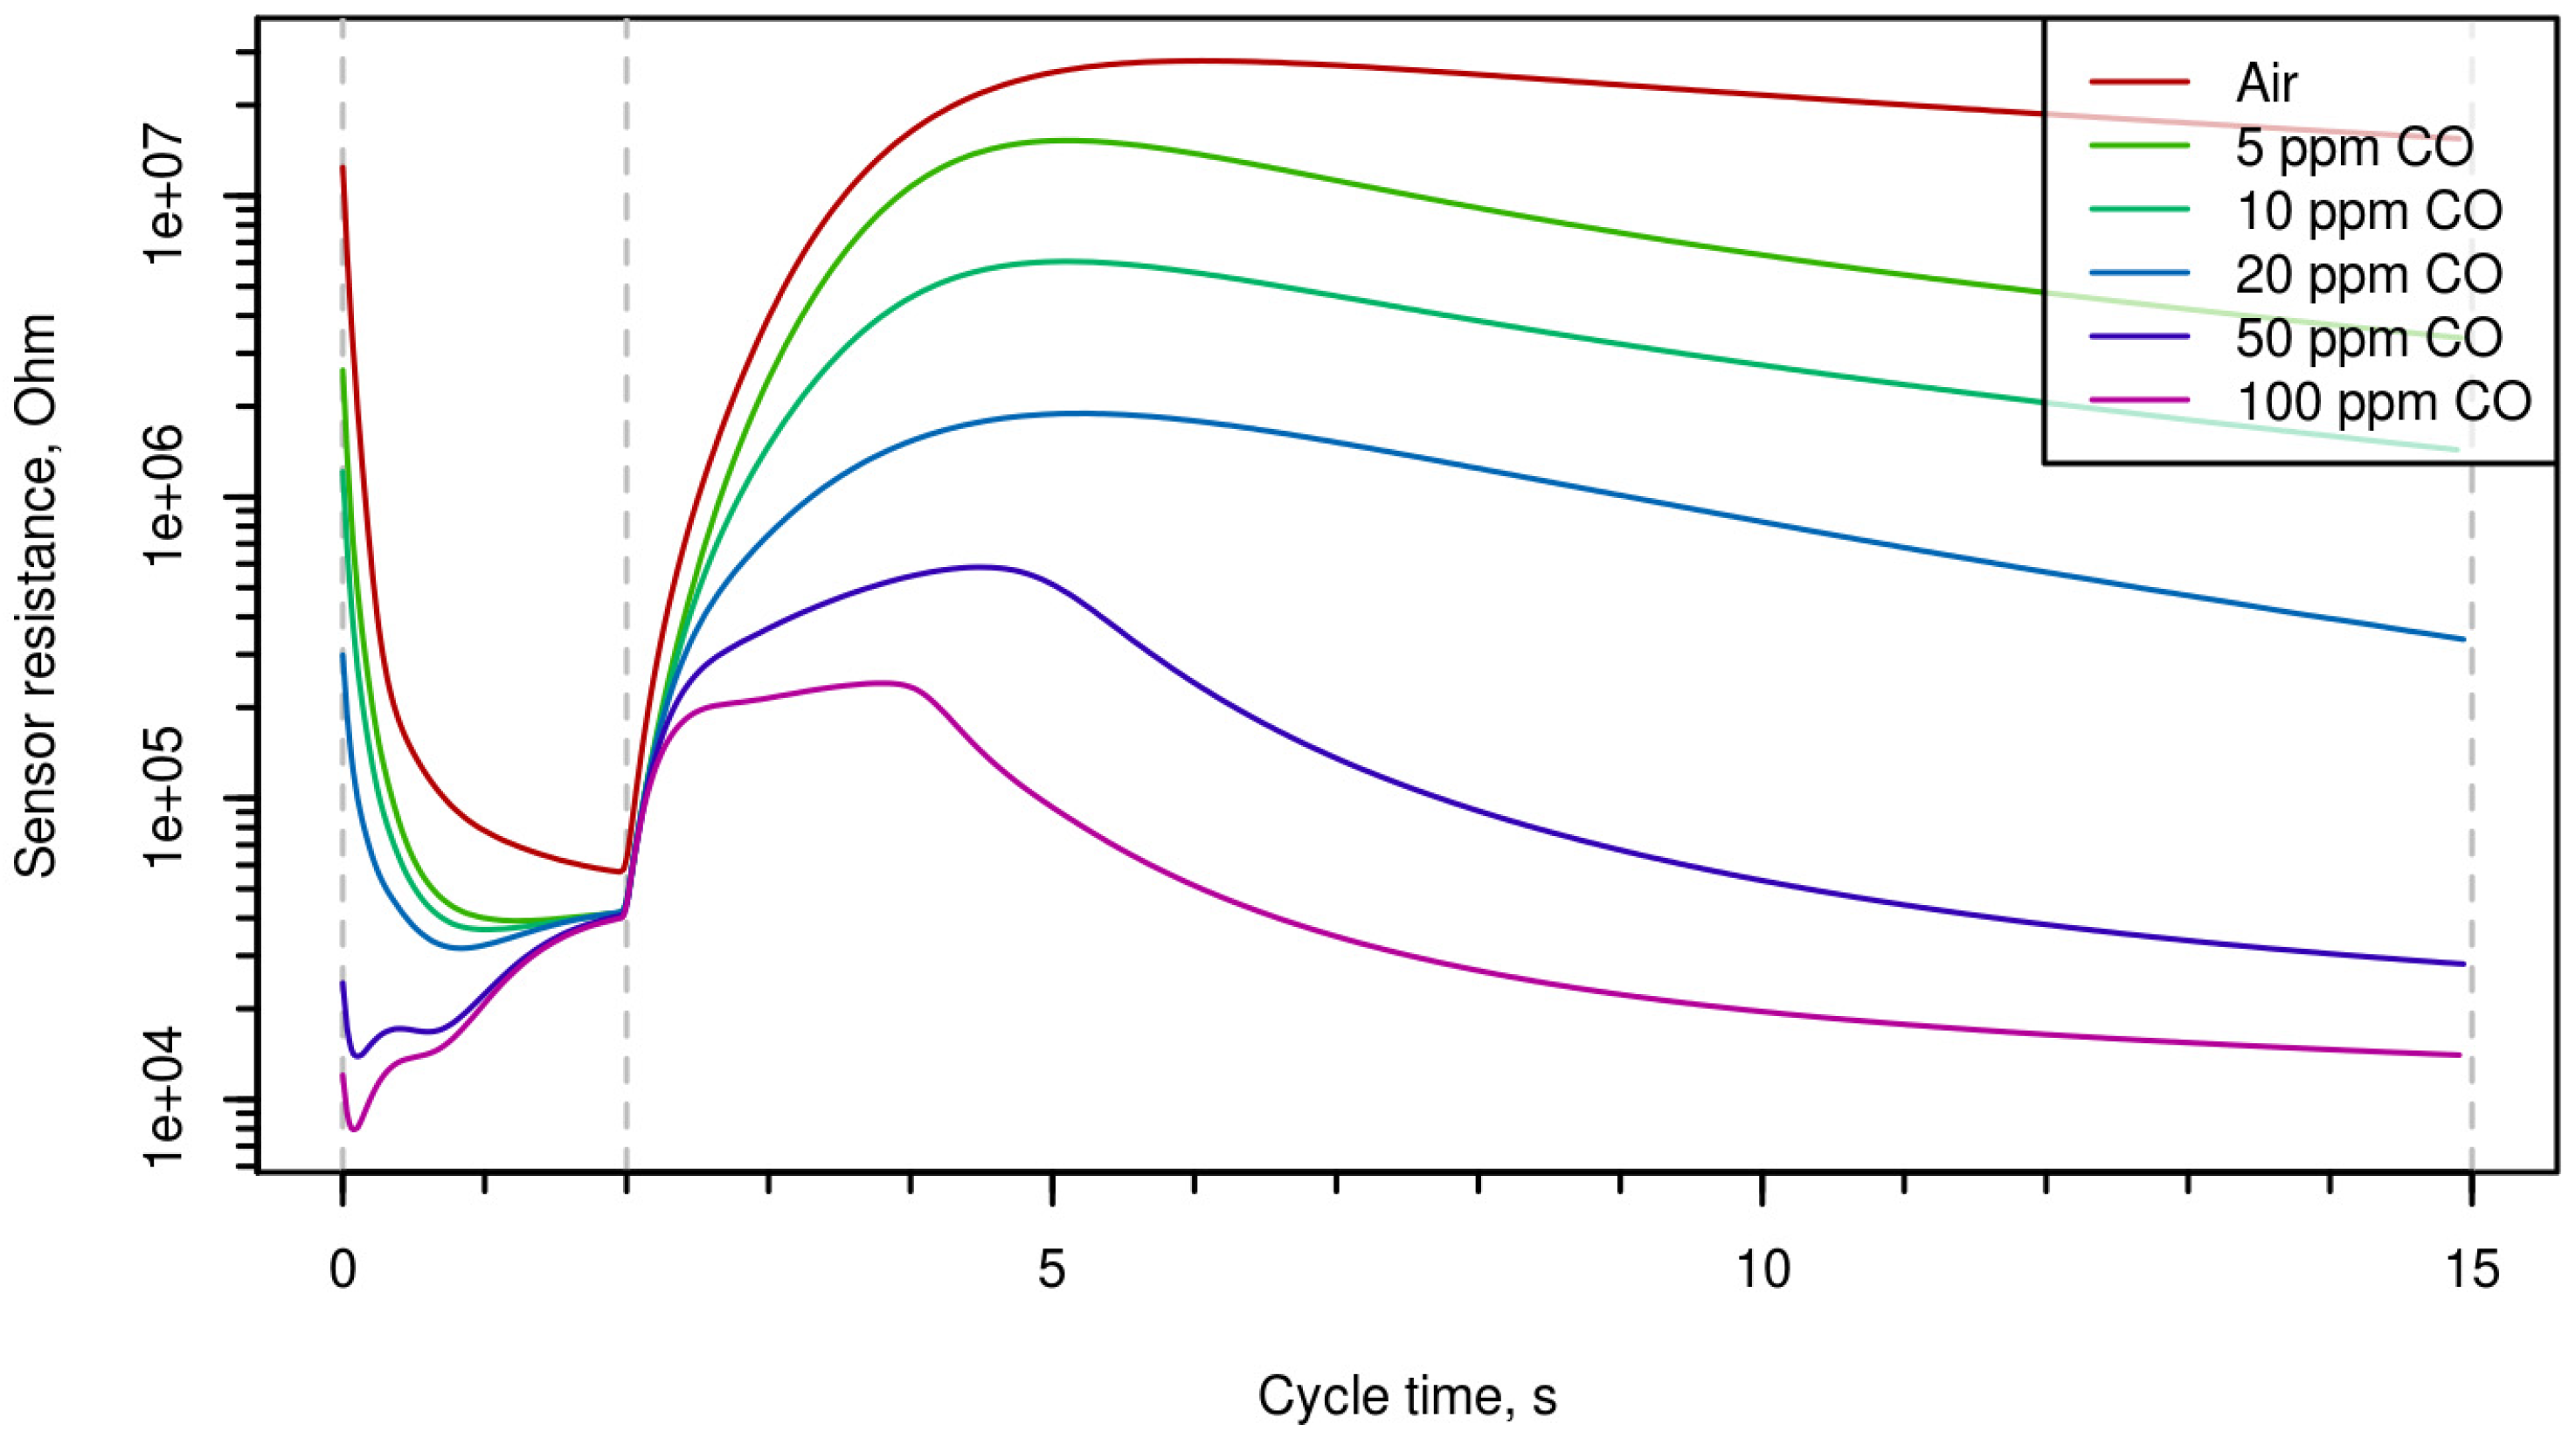
Figure 2 (different concentrations of CO),
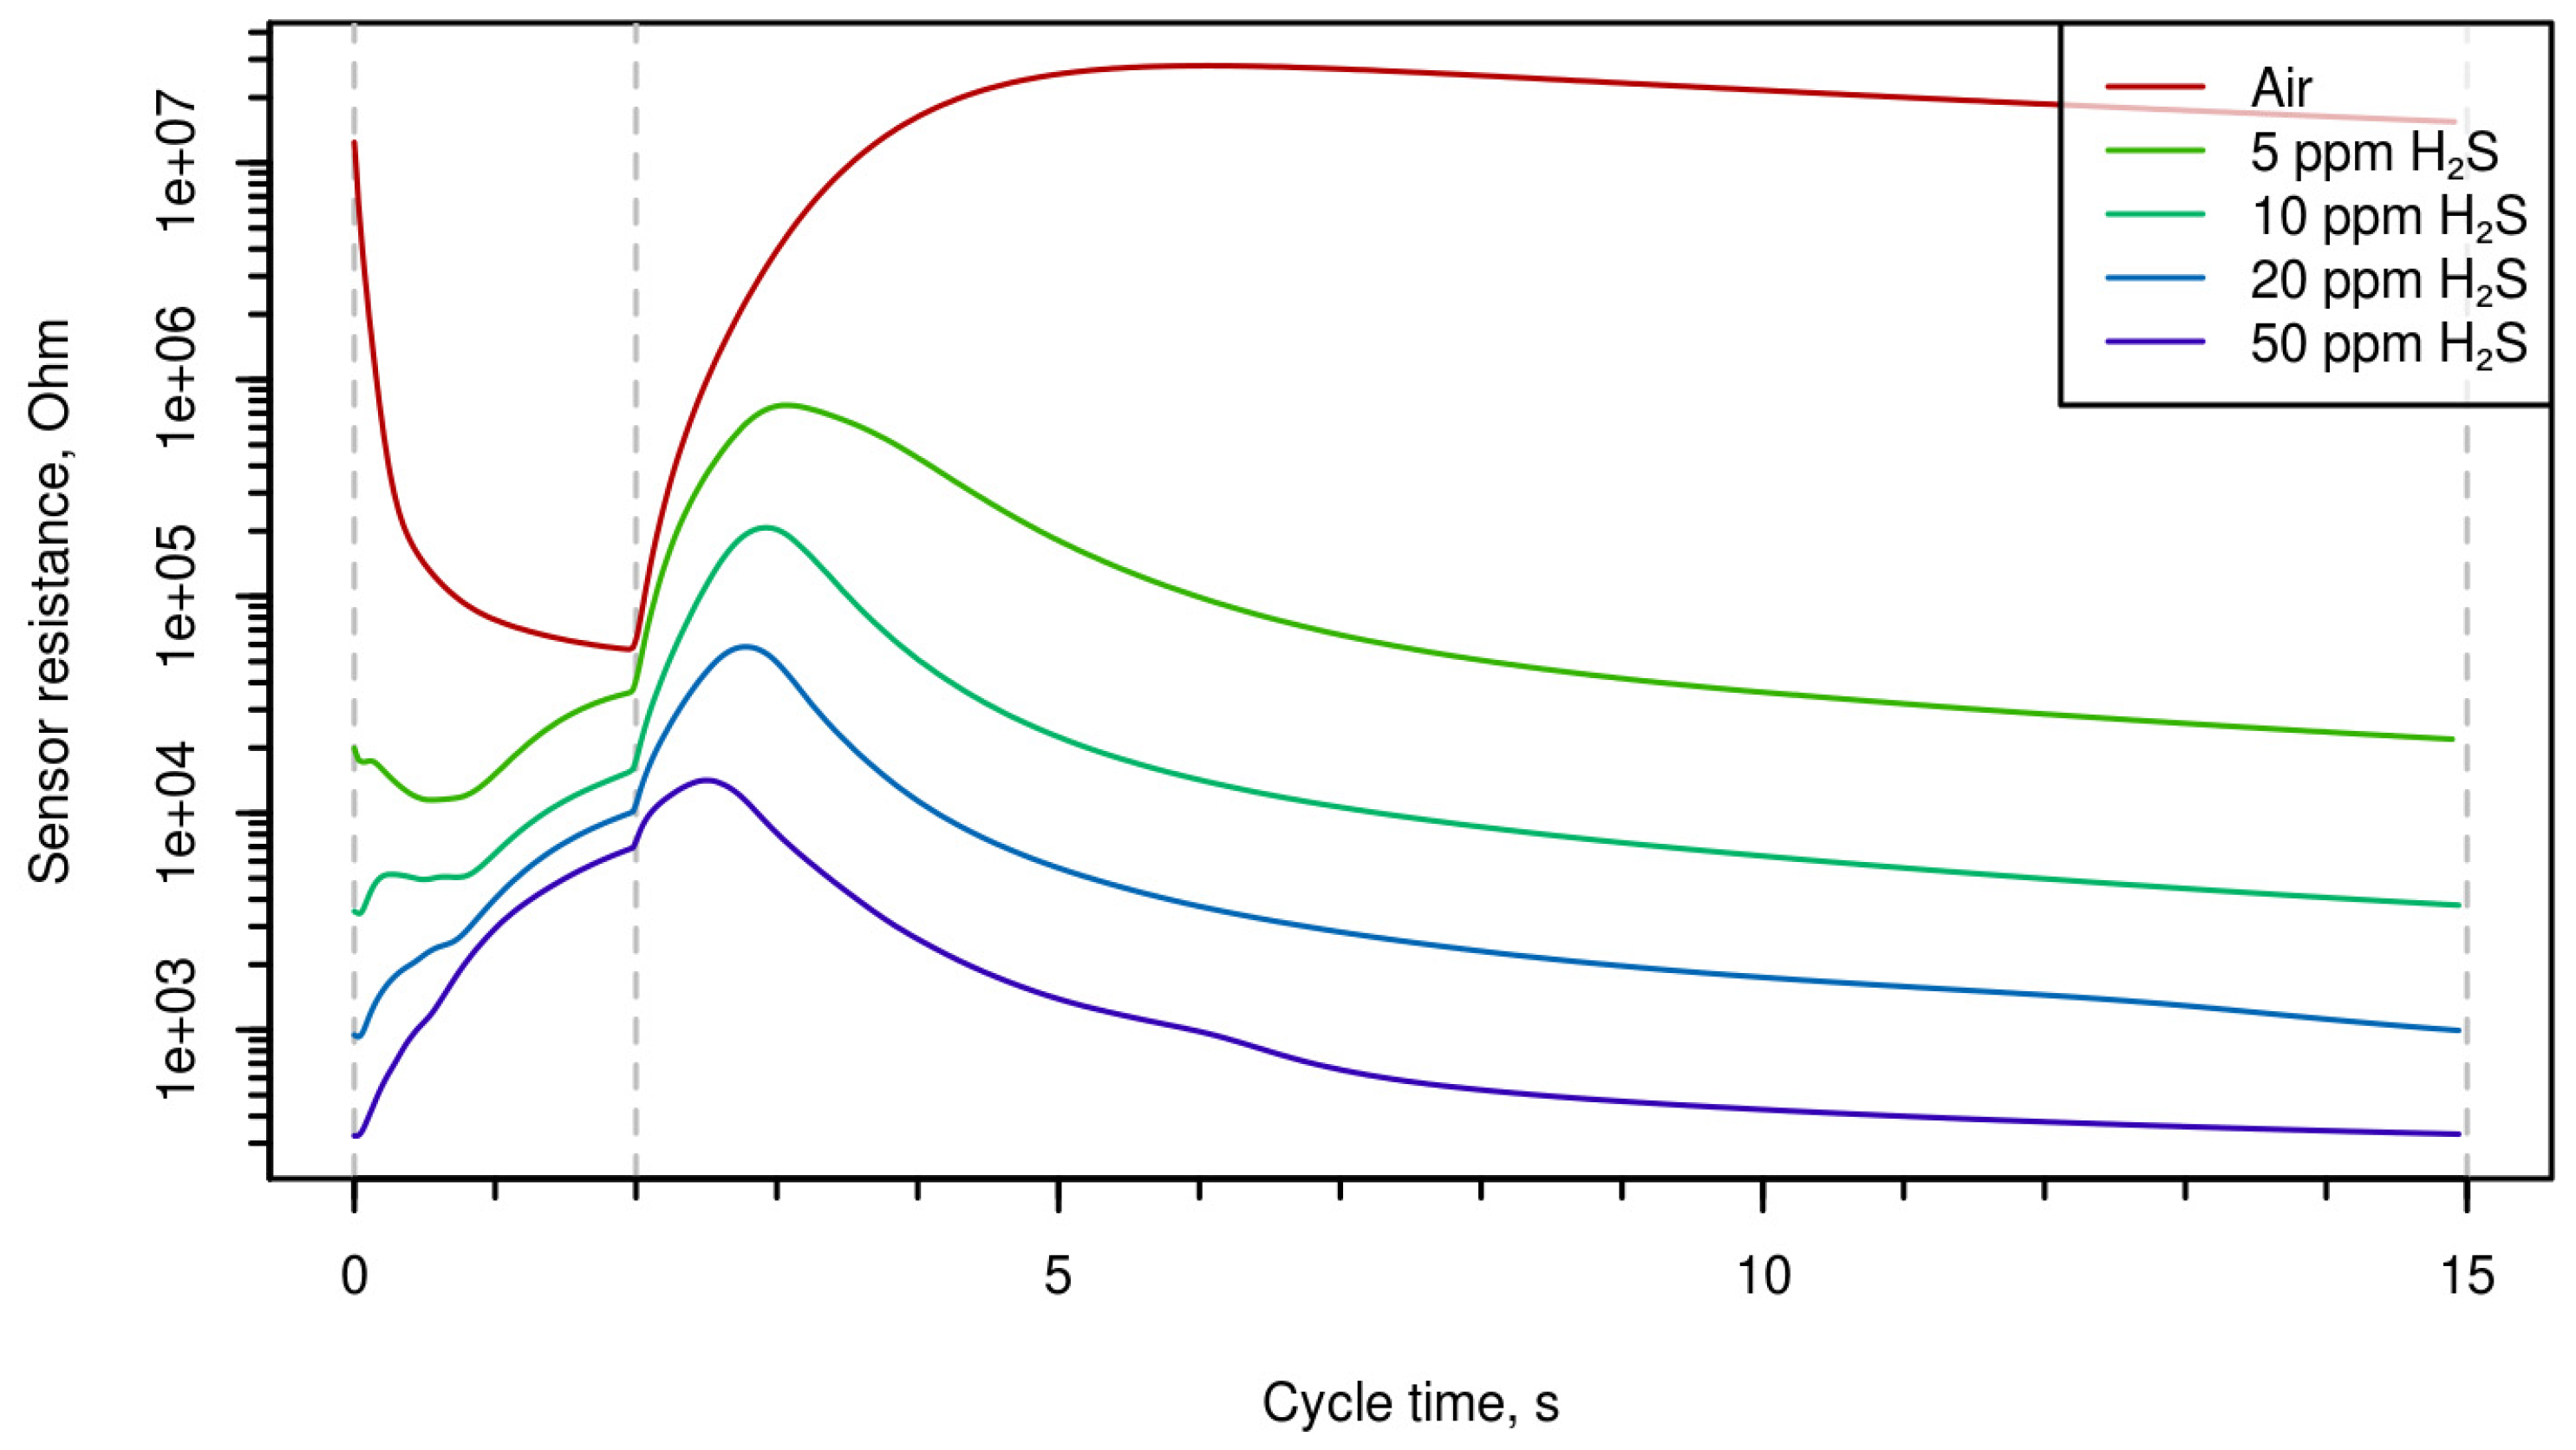
Figure 3 (different concentrations of H
2S). One can mention that the shape of the curves can characterize both the nature of the gas and its concentration.
3.2. Data Processing
Multi-dimensional data arrays obtained as a result of the experiments, after an appropriate mathematical processing, can be used for selective analysis of other gas systems, which differ from the initial ones by the composition. The values of the sensor resistance
R(
j) were read with a 50 Hz frequency. Each of the curves presented in
Figure 1,
Figure 2 and
Figure 3 was obtained by averaging the results of 45 of sensor heating and cooling cycles. Thus, each values of
R(
j), where
j = 1, 2, ..., 750, can be considered as a point in 750-dimensional space.
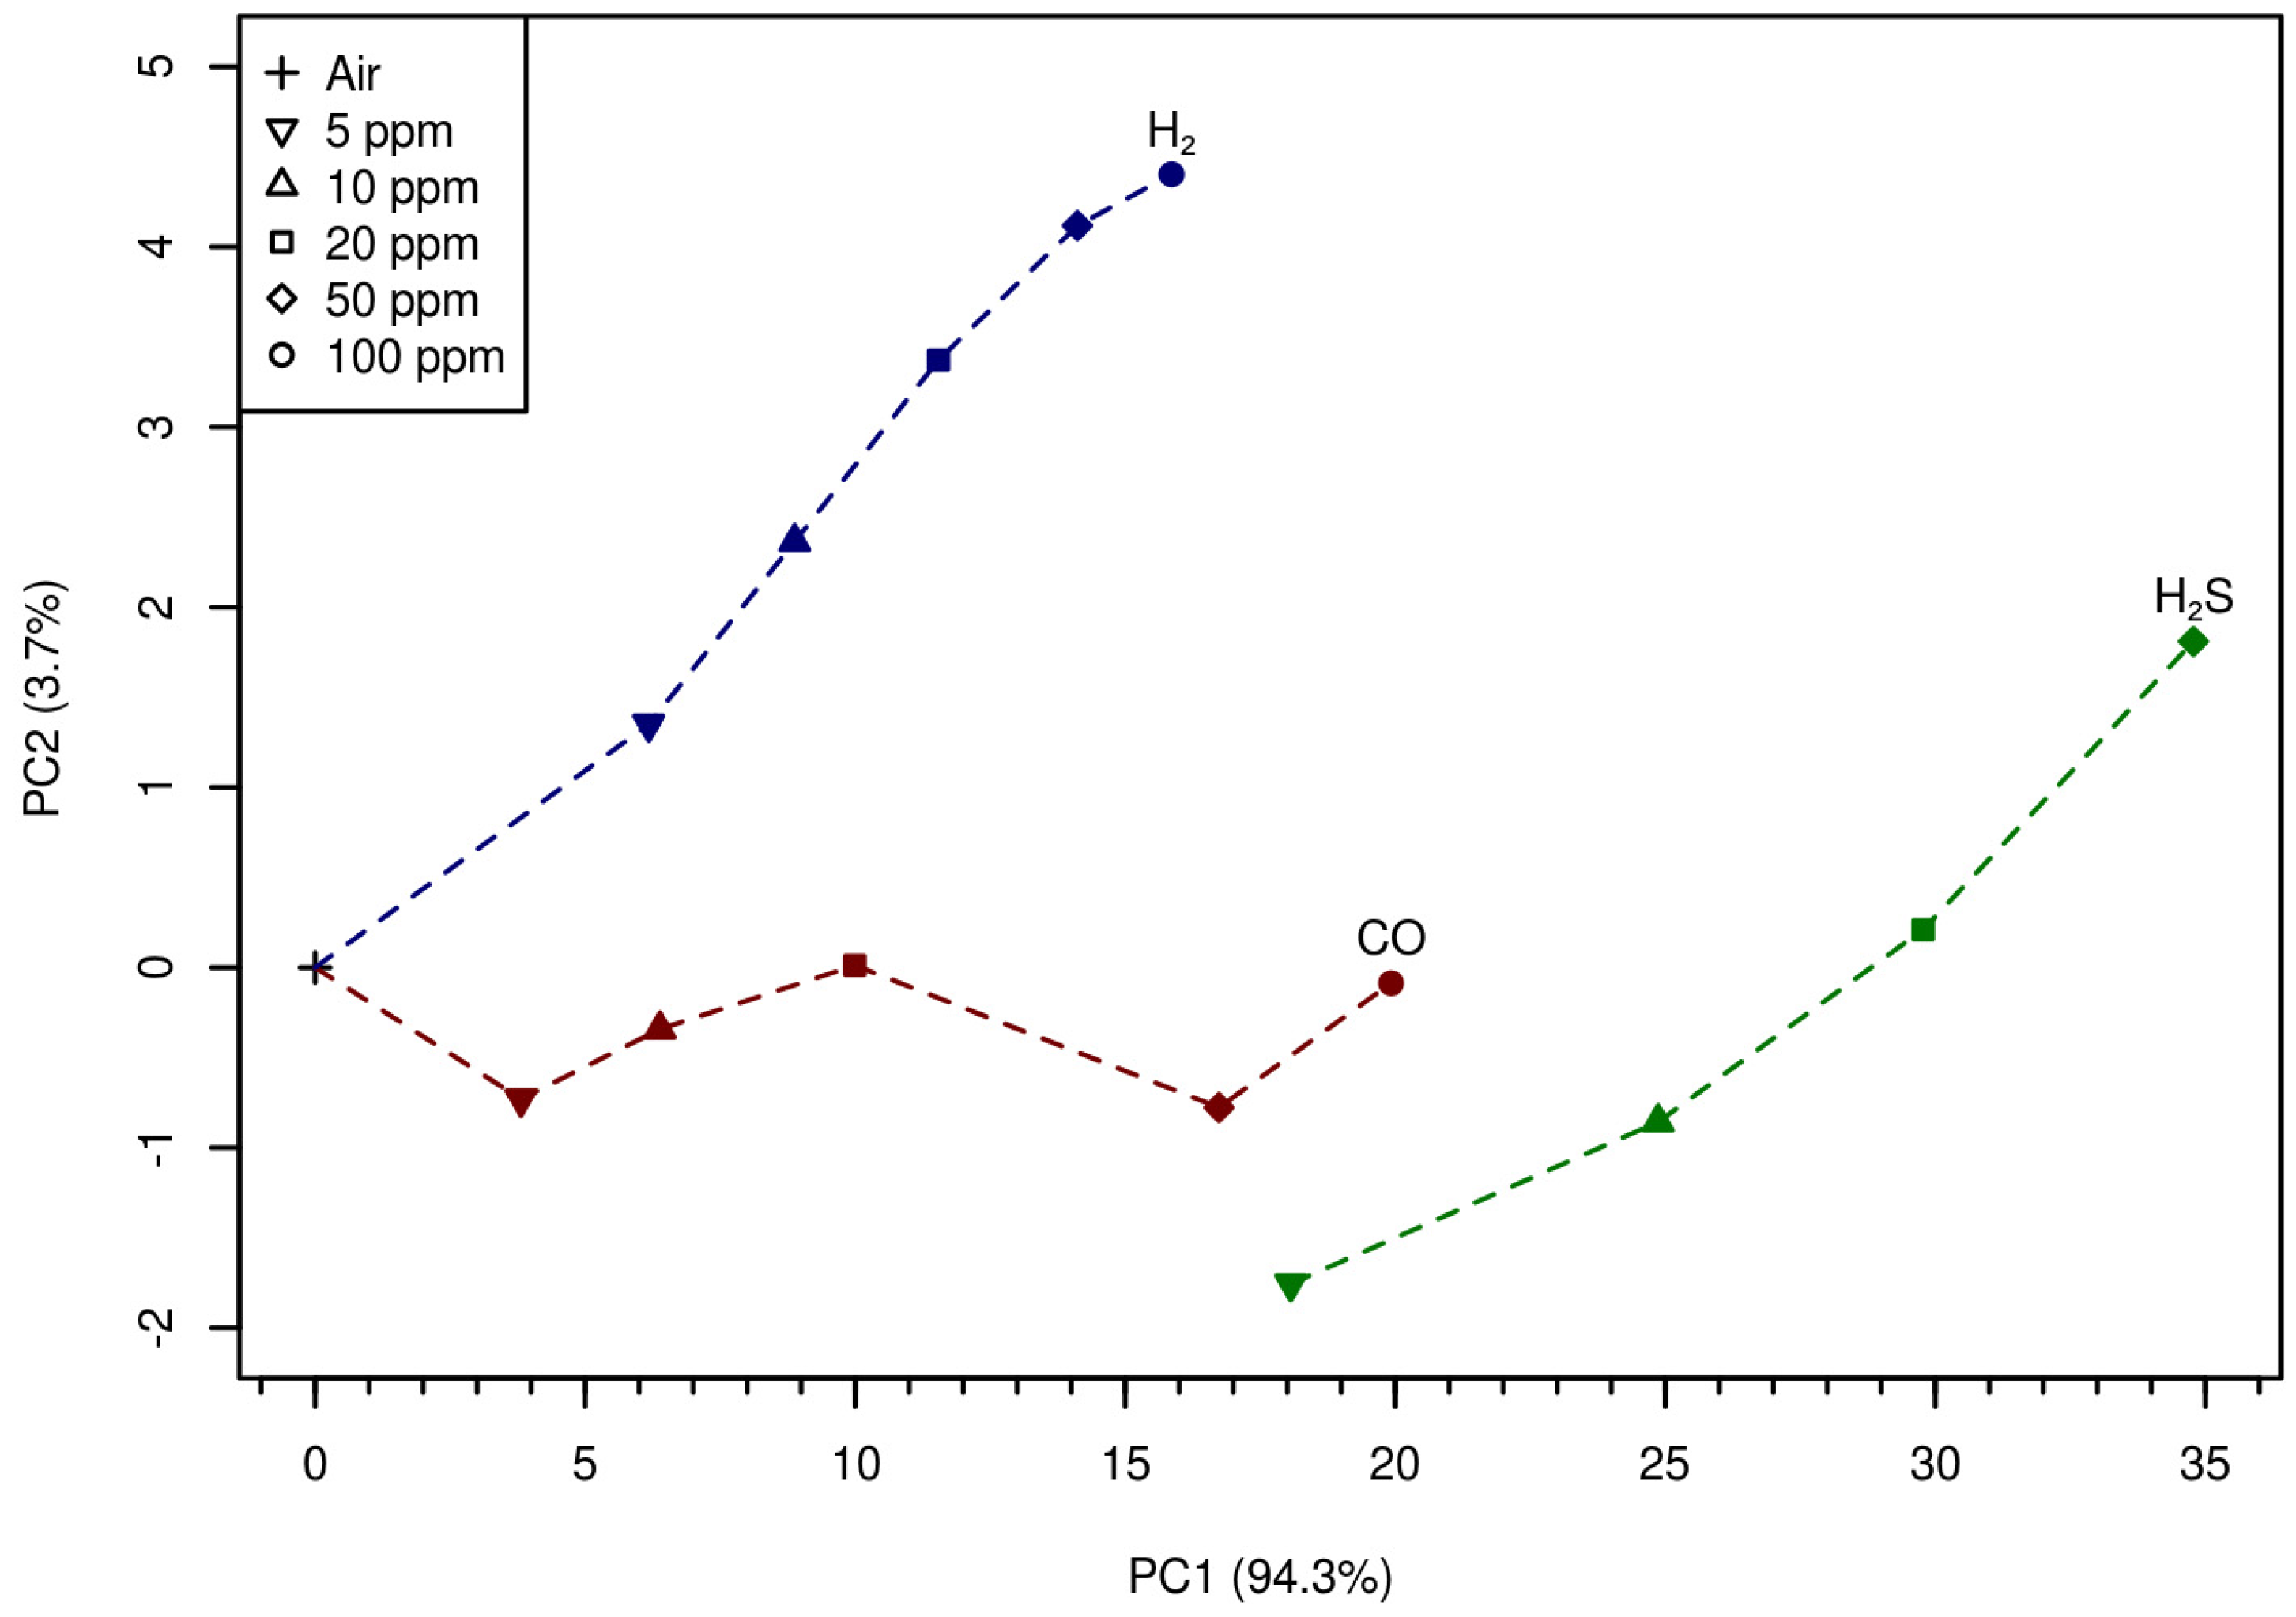
Figure 4 shows that after the transformation of the presented data
R(
j) by the principal component method (PCA), the dimension of the initial problem was reduced to two, with a loss of approximately 2% of the dispersion fraction.
The
Figure 4 shows as well that the MOX-sensor demonstrates good selectivity and reasonable monotone behavior at analyte concentrations higher that 5 ppm. This suggests that the approach under discussion is promising for qualitative and quantitative analysis of other gas systems.
All results were obtained using the
chemometrics package [
2], and software environment for statistical computing
R [
3]. All specified software is distributed under the terms of GPL licenses, versions 2 and 3.
4. Discussion
There are different reasons for a change of electrical resistance of sensor, whet its temperature is changed during gas analysis procedure. First, resistance of semiconductor material depends on temperature, even if this semiconductor is placed into vacuum or into inert gas. Second, chemisorptions of oxygen and other components of air under analysis is also temperature dependent. Third, temperature affects the kinetics of chemical interaction of analytes (reducing gases) and chemisorbed oxygen. Fourth, temperature determines parameters of the desorption of products of chemical interaction of reducing gases with chemisorbed oxygen. The first factor that is the sensing material resistance itself as a function of temperature is not influenced by the character of analyte, however other three factors are strongly affected by the composition of the gas under analysis.
Figure 1,
Figure 2 and
Figure 3 demonstrate that the shape of the curves presenting electrical resistance of the sensor as a function of temperature at temperature variation is considerably different for different analytes; this enables qualitative and quantitative analysis of gas using single semiconductor gas sensor. Multi-dimensional data treated using chemometrics approach permitted us to determine selectively the concentrations of carbon monoxide, hydrogen, and hydrogen sulfide.
5. Conclusions
It is shown that metal oxide semiconductor gas sensor characterized by restricted intrinsic selectivity can be used for selective analysis of gas. This approach makes possible the fabrication of simple and not very expensive gas analyzers with enhanced ability to carry out not only qualitative, but also quantitative gas analysis using temperature modulation and chemometrics approach.

 ,
, 