Article

Nitrogen Regulates the Concentration and Accumulation of Macronutrients in Vegetative and Reproductive Organs of Mexican Marigold (Tagetes erecta L.)


by
María Guadalupe Peralta-Sánchez
1,†,
Fernando Carlos Gómez-Merino
2,†,
Eréndira E. Hernández-Andrade
1 and
Libia Iris Trejo-Téllez
1,2,*
1
Laboratory of Plant Nutrition, Department of Soil Science, College of Postgraduates in Agricultural Sciences Montecillo Campus, Texcoco 56264, State of Mexico, Mexico
2
Department of Plant Physiology, College of Postgraduates in Agricultural Sciences Montecillo Campus, Texcoco 56264, State of Mexico, Mexico
*
Author to whom correspondence should be addressed.
These authors contributed equally to this work.
Nitrogen 2026, 7(1), 26; https://doi.org/10.3390/nitrogen7010026

Submission received: 5 January 2026 / Revised: 21 February 2026 / Accepted: 22 February 2026 / Published: 27 February 2026

Abstract

Nitrogen (N) is a key macronutrient that influences the uptake and partitioning of other essential elements in plants. In this research, we evaluated the effect of different N concentrations in the nutrient solution (0, 4.2, 8.4, and 12.6 mg L−1) during the flowering stage on the concentration and accumulation of macronutrients in organs of Mexican marigold (Tagetes erecta L.) ‘Inca’. After 40 days of treatment, plants were separated into leaves, flowers, stems, and roots to determine the concentrations of N, P, K, Ca, Mg, and S, as well as their accumulation based on dry biomass. Nitrogen supply significantly affected dry biomass production and its partitioning among organs, promoting biomass allocation to leaves and flowers while reducing relative root biomass at higher N concentrations. Nitrogen concentrations and accumulation increased in leaves, stems, and flowers as N supply increased, whereas an inverse relationship was observed in roots. When applying 8.4 and 12.6 mg N L−1, phosphorus displayed enhanced concentrations in leaves and stems, although root tissues did not change the concentration of this nutrient. When N was supplied at up to 8.4 mg L−1, the concentration of potassium rose in aboveground organs but decreased at the highest dose, while its accumulation in roots was reduced under high N concentrations tested. Calcium exhibited greater accumulation in the aboveground organs, particularly at 12.6 mg N L−1. Magnesium concentration and accumulation increased in aboveground organs with increasing N supply, whereas its accumulation in roots decreased. The highest concentrations of sulfur in leaves and stems were observed at 8.4 mg N L−1, and its accumulation in the aboveground organs tended to stabilize at the highest dose. Effect size analysis (partial ηp2) revealed that N supply explained a large proportion of the variance in macronutrient concentration and accumulation in aerial organs, whereas responses in roots were generally weaker and nutrient specific. Overall, our data indicate that intermediate N levels (8.4 mg L−1) boost a more efficient nutritional balance in the aboveground organs, while the highest dose predominantly enhances Ca and Mg accumulation. Understanding how these plants respond to nitrogen can help improve the quality of Mexican marigold crops and make better use of fertilizers.

1. Introduction

Plant nutrition has a direct influence on crop physiology, and among the most significant inputs involved are fertilizers, which have a direct impact on plant development, growth, yield, and quality [1]. There are 17 essential nutrients required for plant growth (C, H, O, N, P, K, Ca, Mg, S, Cl, Fe, Mn, Zn, B, Cu, Mo, and Ni), each fulfilling specific structural and metabolic functions. Without a balanced supply of these essential elements, plants cannot properly develop roots, stems, or leaves, leading to stunted growth, reduced productivity, or death [2,3]. Among them, nitrogen (N), phosphorus (P), and potassium (K) are primary macronutrients and constitute the main components of most commercial fertilizers [1,3].
Nitrogen is crucial for crop growth and yield. Plant roots principally absorb this element in two inorganic forms: nitrate (NO3) and ammonium (NH4+) [4]. Importantly, N may affect the uptake of other essential elements and is involved modulating adaptation strategies to nutrient deficiencies in a plethora of plant species [5].
Within the Asteraceae family, many crop species generally prefer nitrate (NO3) over ammonium (NH4+), as nitrate often results in better growth, higher biomass, and improved nutritional value, particularly in disturbed or well-aerated habitats [6]. For instance, artichoke (Cynara cardunculus) shows a preference for nitrate over ammonium [7,8]. Notably, Asteraceae has stepwise upgraded the N-C balance system via paleopolyploidization and tandem duplications of key metabolic genes, resulting in enhanced nitrogen uptake and fatty acid biosynthesis. In particular, Asteraceae species possess significantly more members of the Nitrate transporter 2 (NRT2) and NRT3 gene families, which encode dual-component transporters involved in high-affinity nitrate assimilation [9], compared to other taxa [6]. However, some Asteraceae species perform best when supplied with a combination of nitrate and ammonium, or ammonium nitrate [10], while the invasive species Solidago canadensis consistently exhibits a preference for NH4+ in different habitats [11].
Nitrogen availability also influences the uptake and balance of other macronutrients. There have been reports of synergistic interactions between nitrogen and potassium (K) [6]. In artichoke, increasing NO3 from 0 to 100% of the total N supplied in the nutrient solution increased shoot inorganic cations by 30% and organic anions by 2.3-fold [7]. In lettuce (Lactuca sativa), sole nitrate supply increased K and Ca concentrations compared to mixed NO3/NH4+ ratios [12], and modifying nitrate levels affected nutrient accumulation patterns under different K concentrations [13]. These findings illustrate the complex interactions between N form and macronutrient balance.
Plants cultivated in conditions of elevated ammonium availability exhibit depletion of cations, such as K+, Ca2+, and Mg2+. This depletion is caused by competition for shared transport proteins and is also a consequence of cellular charge balance [14]. In addition, excessive NH4+ may cause pH acidification in roots and shoots, oxidative stress, and decreased photosynthetic activity. Ammonium toxicity symptoms include root tissue discoloration, axis shrinkage, root hair disfigurement, and seedling death [15,16]. Various ammonium transport-related components, including non-electrogenic NH3 influx and electrogenic NH4+ influx, contribute to ammonium accumulation and toxicity. Tolerance mechanisms may involve interactions with K+ availability, nitrate signaling, auxins, nitric oxide, the urea cycle, polyamine metabolism, and aquaporins [17,18].
Sulfur (S) and N are closely related, as both elements are essential for protein synthesis. The availability of one affects the utilization of the other; that is, S deficiency reduces N use efficiency, leading to nitrate accumulation and reduced crop yield, whereas excess N can induce S deficiency [19]. S deficiency impairs N metabolism, resulting in higher levels of N in amide and NO3 forms. The ideal N:S ratio is approximately 15–16:1 in legumes and 11–12:1 in cereals [20]. When S availability is inadequate, nitrate utilization can be reduced, potentially leading to nitrate leaching and reduced N use efficiency [21]. Thus, the interaction between N and S strongly influences nutrient use efficiency and crop productivity.
The interaction of N with other macronutrients not only influences metabolism, but also nutrient use efficiency and the dynamics of nutrient accumulation in plant tissues. A moderate reduction in N does not necessarily lead to a decrease in crop yield, but may improve N use efficiency [22]. However, this can result in reduced accumulation of some nutrients, while others promote increased biomass production. The negative relationship between plant growth and nutrient concentration is known as the dilution effect and occurs when dry biomass accumulation increases at a faster rate than nutrient accumulation [23]. A synergistic effect is when nutrient accumulation increases at a faster rate than dry biomass accumulation. Both dilution and synergism may occur simultaneously in nitrogen fertilization experiments [23].
Interaction among nutrients can therefore yield antagonistic or synergistic outcomes that influence fertilizer use efficiency [24]. Under N fertilization, both dilution and synergism may occur simultaneously [23,25,26].
Marigold (Tagetes erecta L.) ‘Inca’ is a small-sized plant that is generally commercialized as a potted ornamental crop. The nutritional status of plants can serve as an indicator of their response to fertilization and nutrient accumulation. In ornamental species, nitrogen fertilization is commonly applied at the beginning of the growth phase; however, subsequent applications may have negative effects on plant quality and the environment [27]. Specifically, in marigold, evidence indicates that N promotes growth when applied in the appropriate form and at the appropriate time, whereas excess N delays flowering [28]. Similarly, N influences flowering time, which is also regulated by environmental factors such as photoperiod, temperature, and stress conditions [29]. In Calendula officinalis L., fertilization with N, P, and K increased leaf N and K contents, while N and P application increased P content [30]. These findings highlight that macronutrient responses to N supply may vary among species within Asteraceae.
The objective of this study was to determine the effect of different nitrogen concentrations in the nutrient solution on the concentration and accumulation of macronutrients (N, P, K, Ca, Mg, and S) in different organs (leaves, flowers, stems, and roots) of Mexican marigold (Tagetes erecta L.). This study provides novel insight into nitrogen-driven nutrient partitioning among different plant organs of T. erecta during the flowering stage by integrating both nutrient concentration and accumulation responses. While previous studies have focused primarily on growth or yield responses, information on organ-specific macronutrient dynamics under varying nitrogen supply remains limited. Beyond its ornamental value, T. erecta is also recognized as a medicinal and aromatic species, which highlights the relevance of optimizing nitrogen management.

2. Materials and Methods

2.1. Experimental Conditions and Plant Material

The study was conducted under controlled greenhouse conditions. Mean daytime and nighttime temperatures were 27 ± 2 °C and 13.5 ± 1.5 °C, respectively, with an average relative humidity of 37% during the day and 85% at night. The photoperiod lasted 11.5 h, and the average photosynthetic photon flux density (PPFD) was 720 µmol m−2 s−1.
Seedlings of Tagetes erecta L. ‘Inca’ were obtained from a commercial nursery (Plántulas de Tetela, S. A. de C. V., Cuernavaca, Morelos, Mexico). Seedlings were produced in 200-cell trays containing a peat-based substrate under full sunlight conditions, with temperatures maintained above 15 °C to ensure uniform growth and phytosanitary quality.

2.2. Experimental Management

Twenty-one-day-old seedlings were transplanted into 1 L black plastic pots containing a mixture of volcanic gravel (tezontle; particle size ≈ 3 mm) and perlite (60:40, v/v) under a soilless cultivation system.
After transplanting, seedlings were irrigated only with water for the first four days to promote establishment. Thereafter, irrigation was initiated using Steiner’s nutrient solution [31] at 5% of its original concentration. The solution was prepared using reagent-grade salts (J.T. Baker; Phillipsburg, NJ, USA). Micronutrients were supplied from the commercial product Tradecorp AZ™, at the following concentrations (mg L−1): 5 Fe, 2.33 Mn, 0.47 Zn, 0.19 Cu, 0.43 B, and 0.17 Mo [32].
Nutrient solutions were adjusted to pH 5.5 and applied through a drip irrigation system. Five daily irrigations of 50 mL per pot were applied using a timer-controlled system and ½ HP pumps.
To ensure physiologically homogeneous plants prior to treatment application, all apical flower buds were removed at 27 days after transplanting (DAT), when 100% of plants had developed visible buds, while lateral buds were retained. Nitrogen treatments were initiated at 30 DAT, when lateral buds had reached the flowering stage.

2.3. Treatments Evaluated

Treatment application began 30 days after transplanting (DAT) during the flowering stage. Treatments consisted of applying different nitrogen concentrations in the nutrient solution: 0, 4.2, 8.4, and 12.6 mg L−1. The formulation of the nutrient solutions was based on the methodology described elsewhere [33], corresponding to the first part of this study, in which physiological parameters were evaluated in Tagetes erecta. In that study, diluted nutrient solutions were shown to be appropriate for open hydroponic conditions with high irrigation frequency, providing the basis for selecting the nitrogen concentration range used here. Nitrogen was supplied predominantly as nitrate; urea was included only in the highest N treatment to adjust total nitrogen concentration. Although different salts were used to adjust nitrogen levels, the experimental design focused on nitrogen availability rather than on the effects of specific accompanying ions. In this phase, macronutrient concentration and accumulation were analyzed under the same growing conditions. The treatment application period lasted 40 days.

2.4. Experimental Design

A completely randomized design was used, with 140 replicates per treatment. The experimental unit consisted of one pot containing a single plant.

2.5. Study Variables

After 40 days of treatment application, Mexican marigold plants were separated by organ (leaves, flowers, stems, and roots) and properly labeled. Samples were then transported to the laboratory and dried in a forced-air oven (Riossa, HCF-125; Guadalajara, Mexico) at 70 °C for 72 h. After drying, the different plant organs were weighed using an analytical balance (Adventurer Ohaus Pro, AV213C; Parsippany, NJ, USA). Dry biomass of each organ was recorded and used as an indicator of growth and biomass partitioning. Once separated, labeled, and dried, samples were ground using a stainless-steel mill. For each treatment, nutrient analyses were conducted in triplicate using composite samples. Each composite sample consisted of the corresponding organ collected from four randomly selected plants, from which dry biomass was previously determined. Dried samples were then ground using a stainless-steel mill.
Nitrogen determination was performed using the micro-Kjeldahl method [34]. For the determination of P, K, Ca, Mg, and S, 0.5 g of previously ground plant tissue was weighed, a diacid mixture of HNO3:HClO4 (2:1, v/v) was added, and samples were digested on a hot plate at 160 °C. Finally, samples were analyzed using an inductively coupled plasma optical emission spectrometer (ICP-OES) (Agilent, 725-ES; Santa Clara, CA, USA).
The accumulation of N, P, K, Ca, Mg, and S in leaves, flowers, stems, and roots was calculated based on nutrient concentration data and previously determined dry biomass.

2.6. Data Analysis

Data were subjected to analysis of variance (ANOVA) according to the established experimental design using the SAS statistical package version 9.3 [35]. Mean comparisons were performed using Tukey’s test at a significance level of p ≤ 0.05. In addition, effect sizes were calculated to assess the magnitude of the nitrogen effect on macronutrient concentration and accumulation. Partial eta-squared (ηp2) values were obtained from the ANOVA models and interpreted as the proportion of variance explained by nitrogen concentration in the nutrient solution.

3. Results

3.1. Dry Biomass and Biomass Partitioning

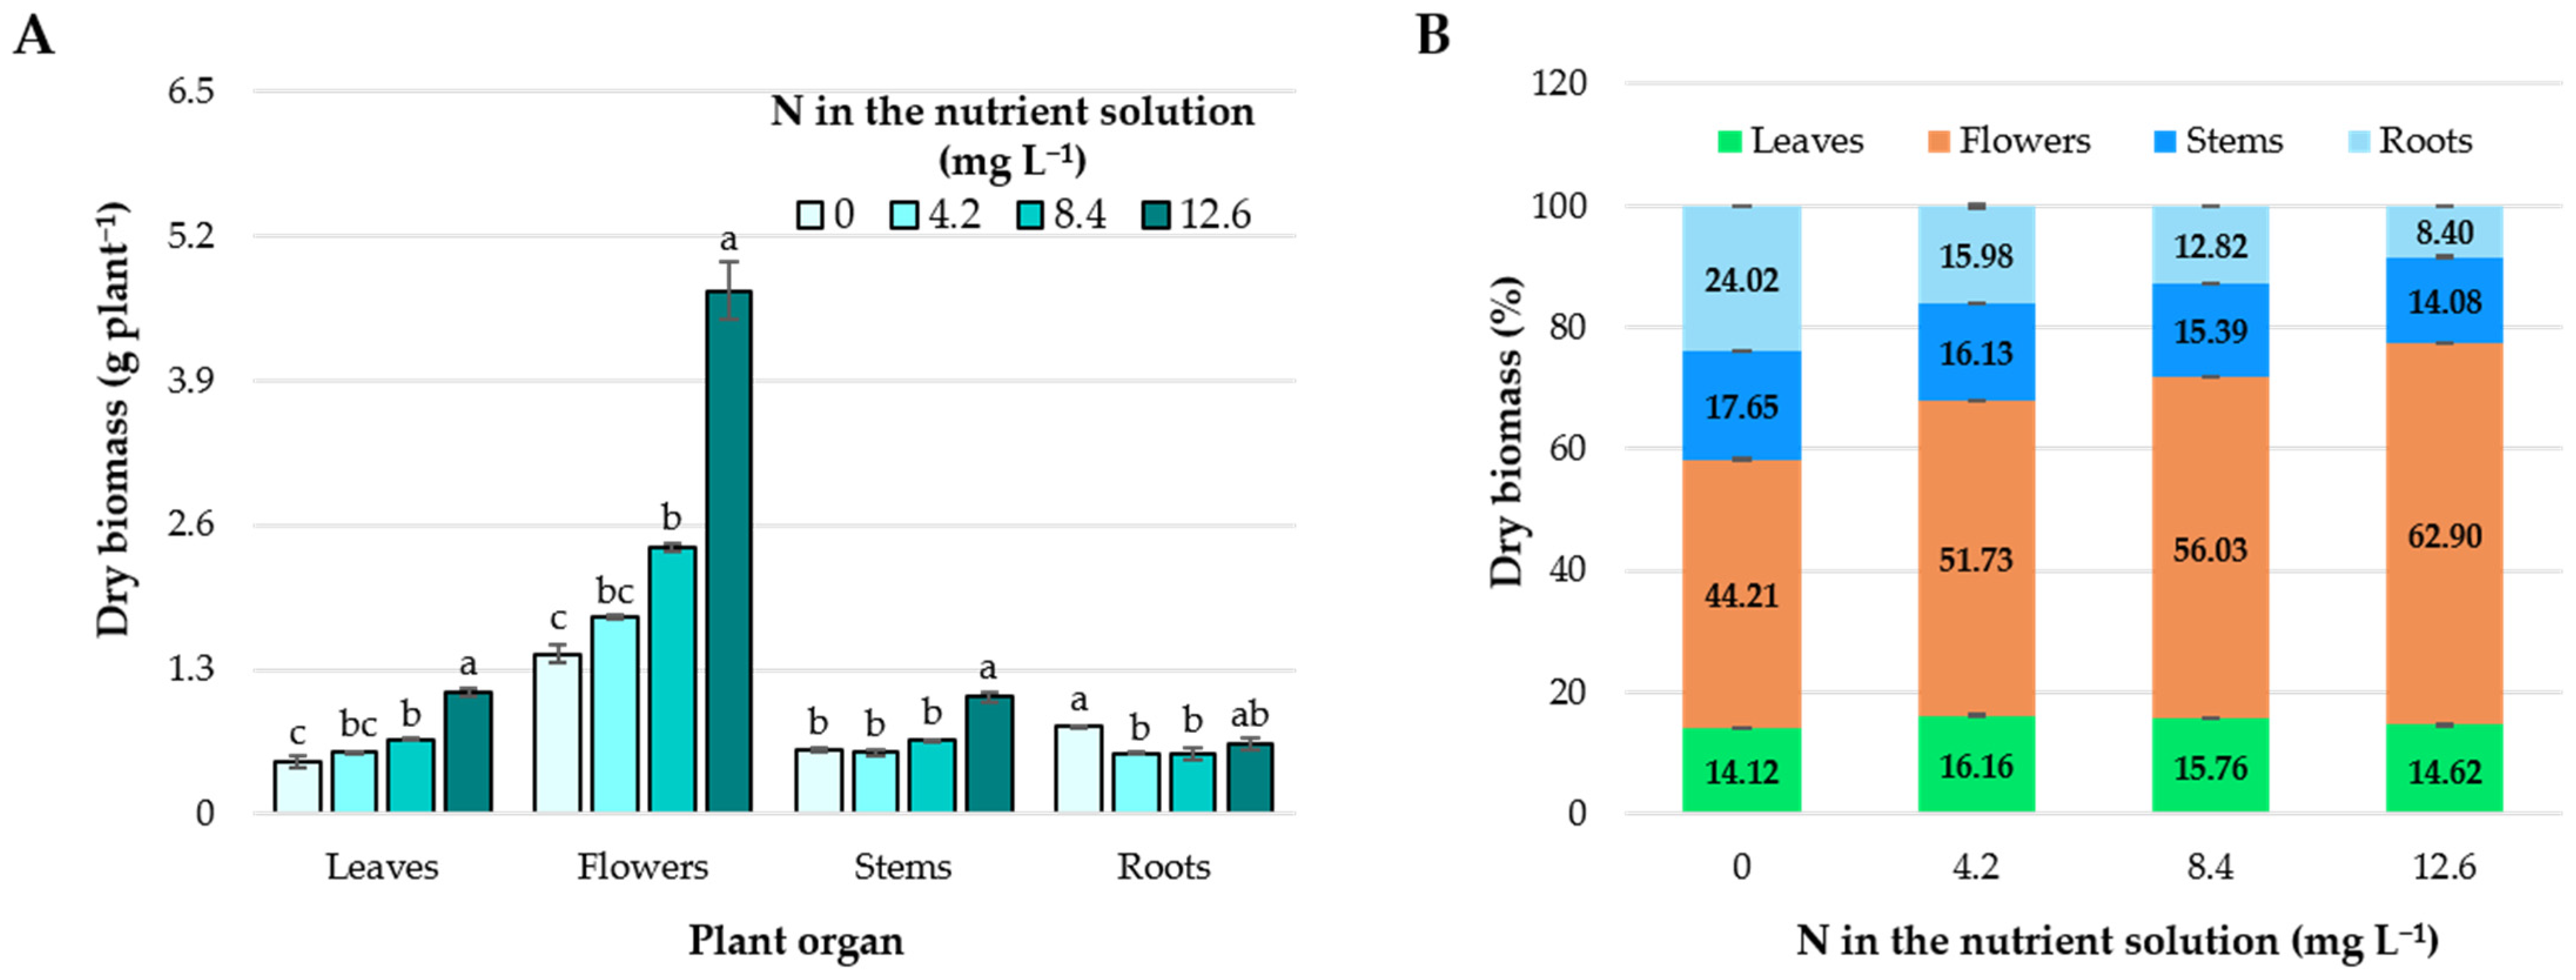
Dry biomass per organ increased with nitrogen concentration in the nutrient solution, particularly in leaves and flowers, where a direct relationship between both factors was observed. Compared with the treatment without nitrogen, the application of 12.6 mg N L−1 increased leaf dry biomass by 20.0, 46.2, and 137.5% relative to the 0, 4.2, and 8.4 mg N L−1 treatments, respectively, while in flowers, the corresponding increases were 22.7, 66.0, and 226.3%. In contrast, root dry biomass showed an inverse trend, with higher values in the treatment without N and a relative decrease as N concentration increased, whereas stems exhibited a moderate and less consistent increase across treatments (Figure 1A).
Dry biomass partitioning among organs was also markedly affected by nitrogen concentration in the nutrient solution (Figure 1B). Increasing N supply promoted a preferential allocation of biomass to flowers, whose relative contribution increased from approximately 44% under N deprivation to about 63% at 12.6 mg N L−1. In contrast, root biomass allocation showed the most pronounced response, with plants grown without nitrogen allocating nearly three times more biomass to roots than those supplied with the highest N concentration. Stem biomass contribution decreased moderately with increasing N, while the proportion allocated to leaves remained relatively stable across treatments (14–16%). Overall, these results indicate that increased nitrogen availability shifted biomass partitioning toward reproductive organs at the expense of root development.

3.2. Nitrogen

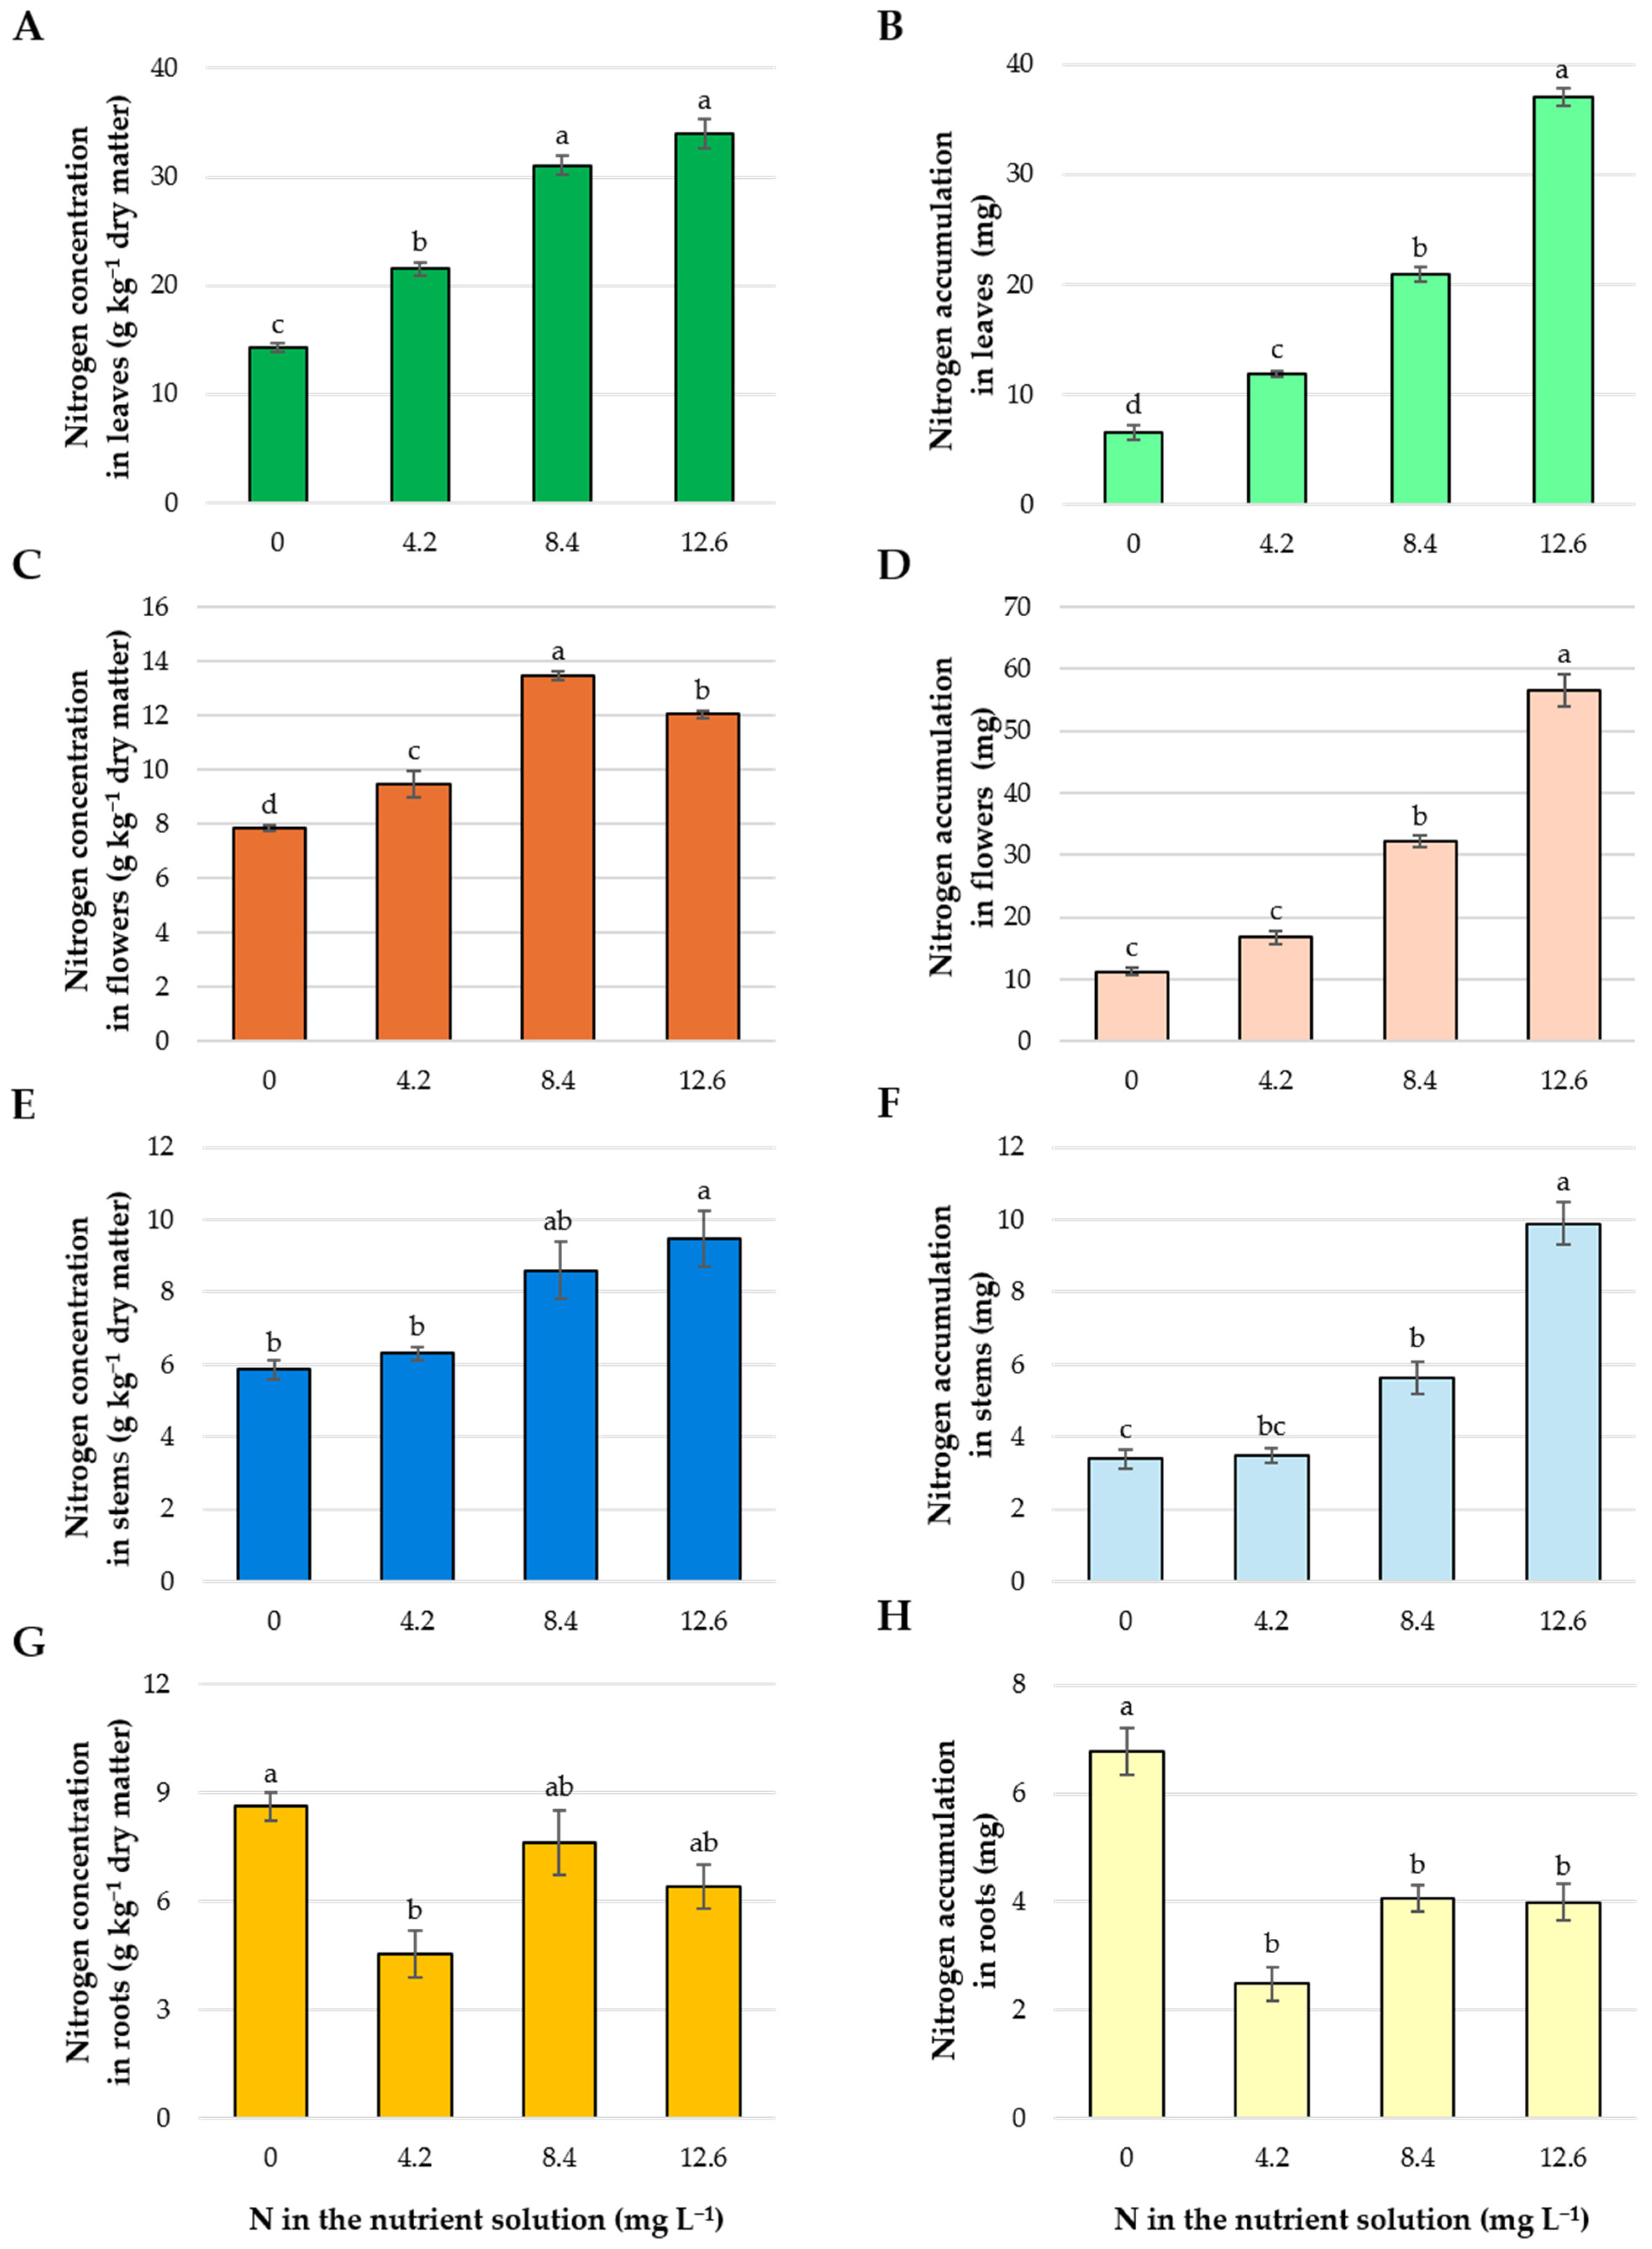
Statistically significant differences in N concentration were observed in all plant organs. In leaves, a positive relationship was observed between the applied N dose and N concentration, with values recorded at 8.4 and 12.6 mg N L−1 exceeding 30 g kg−1 dry matter and being statistically higher than those observed in the other treatments (Figure 2A). In flowers, N concentration increased up to 8.4 mg N L−1 and decreased significantly at the highest N dose (12.6 mg L−1) (Figure 2C). In stems, N concentration showed an overall increasing trend with N supply, reaching the highest value at 12.6 mg N L−1 (Figure 2E). In contrast, in roots, the overall trend was opposite to the amount of N added to the nutrient solution, with a gradual decrease as the N dose rose (Figure 2G).
Nitrogen accumulation in all evaluated organs also showed statistically significant differences, following a trend similar to that observed for N concentration. Overall, increasing N concentration in the nutrient solution resulted in a significant increase in N accumulation in leaves, flowers, and stems (Figure 2B,D,F), whereas the highest root N accumulation was recorded in the control treatment (Figure 2H).

3.3. Phosphorus

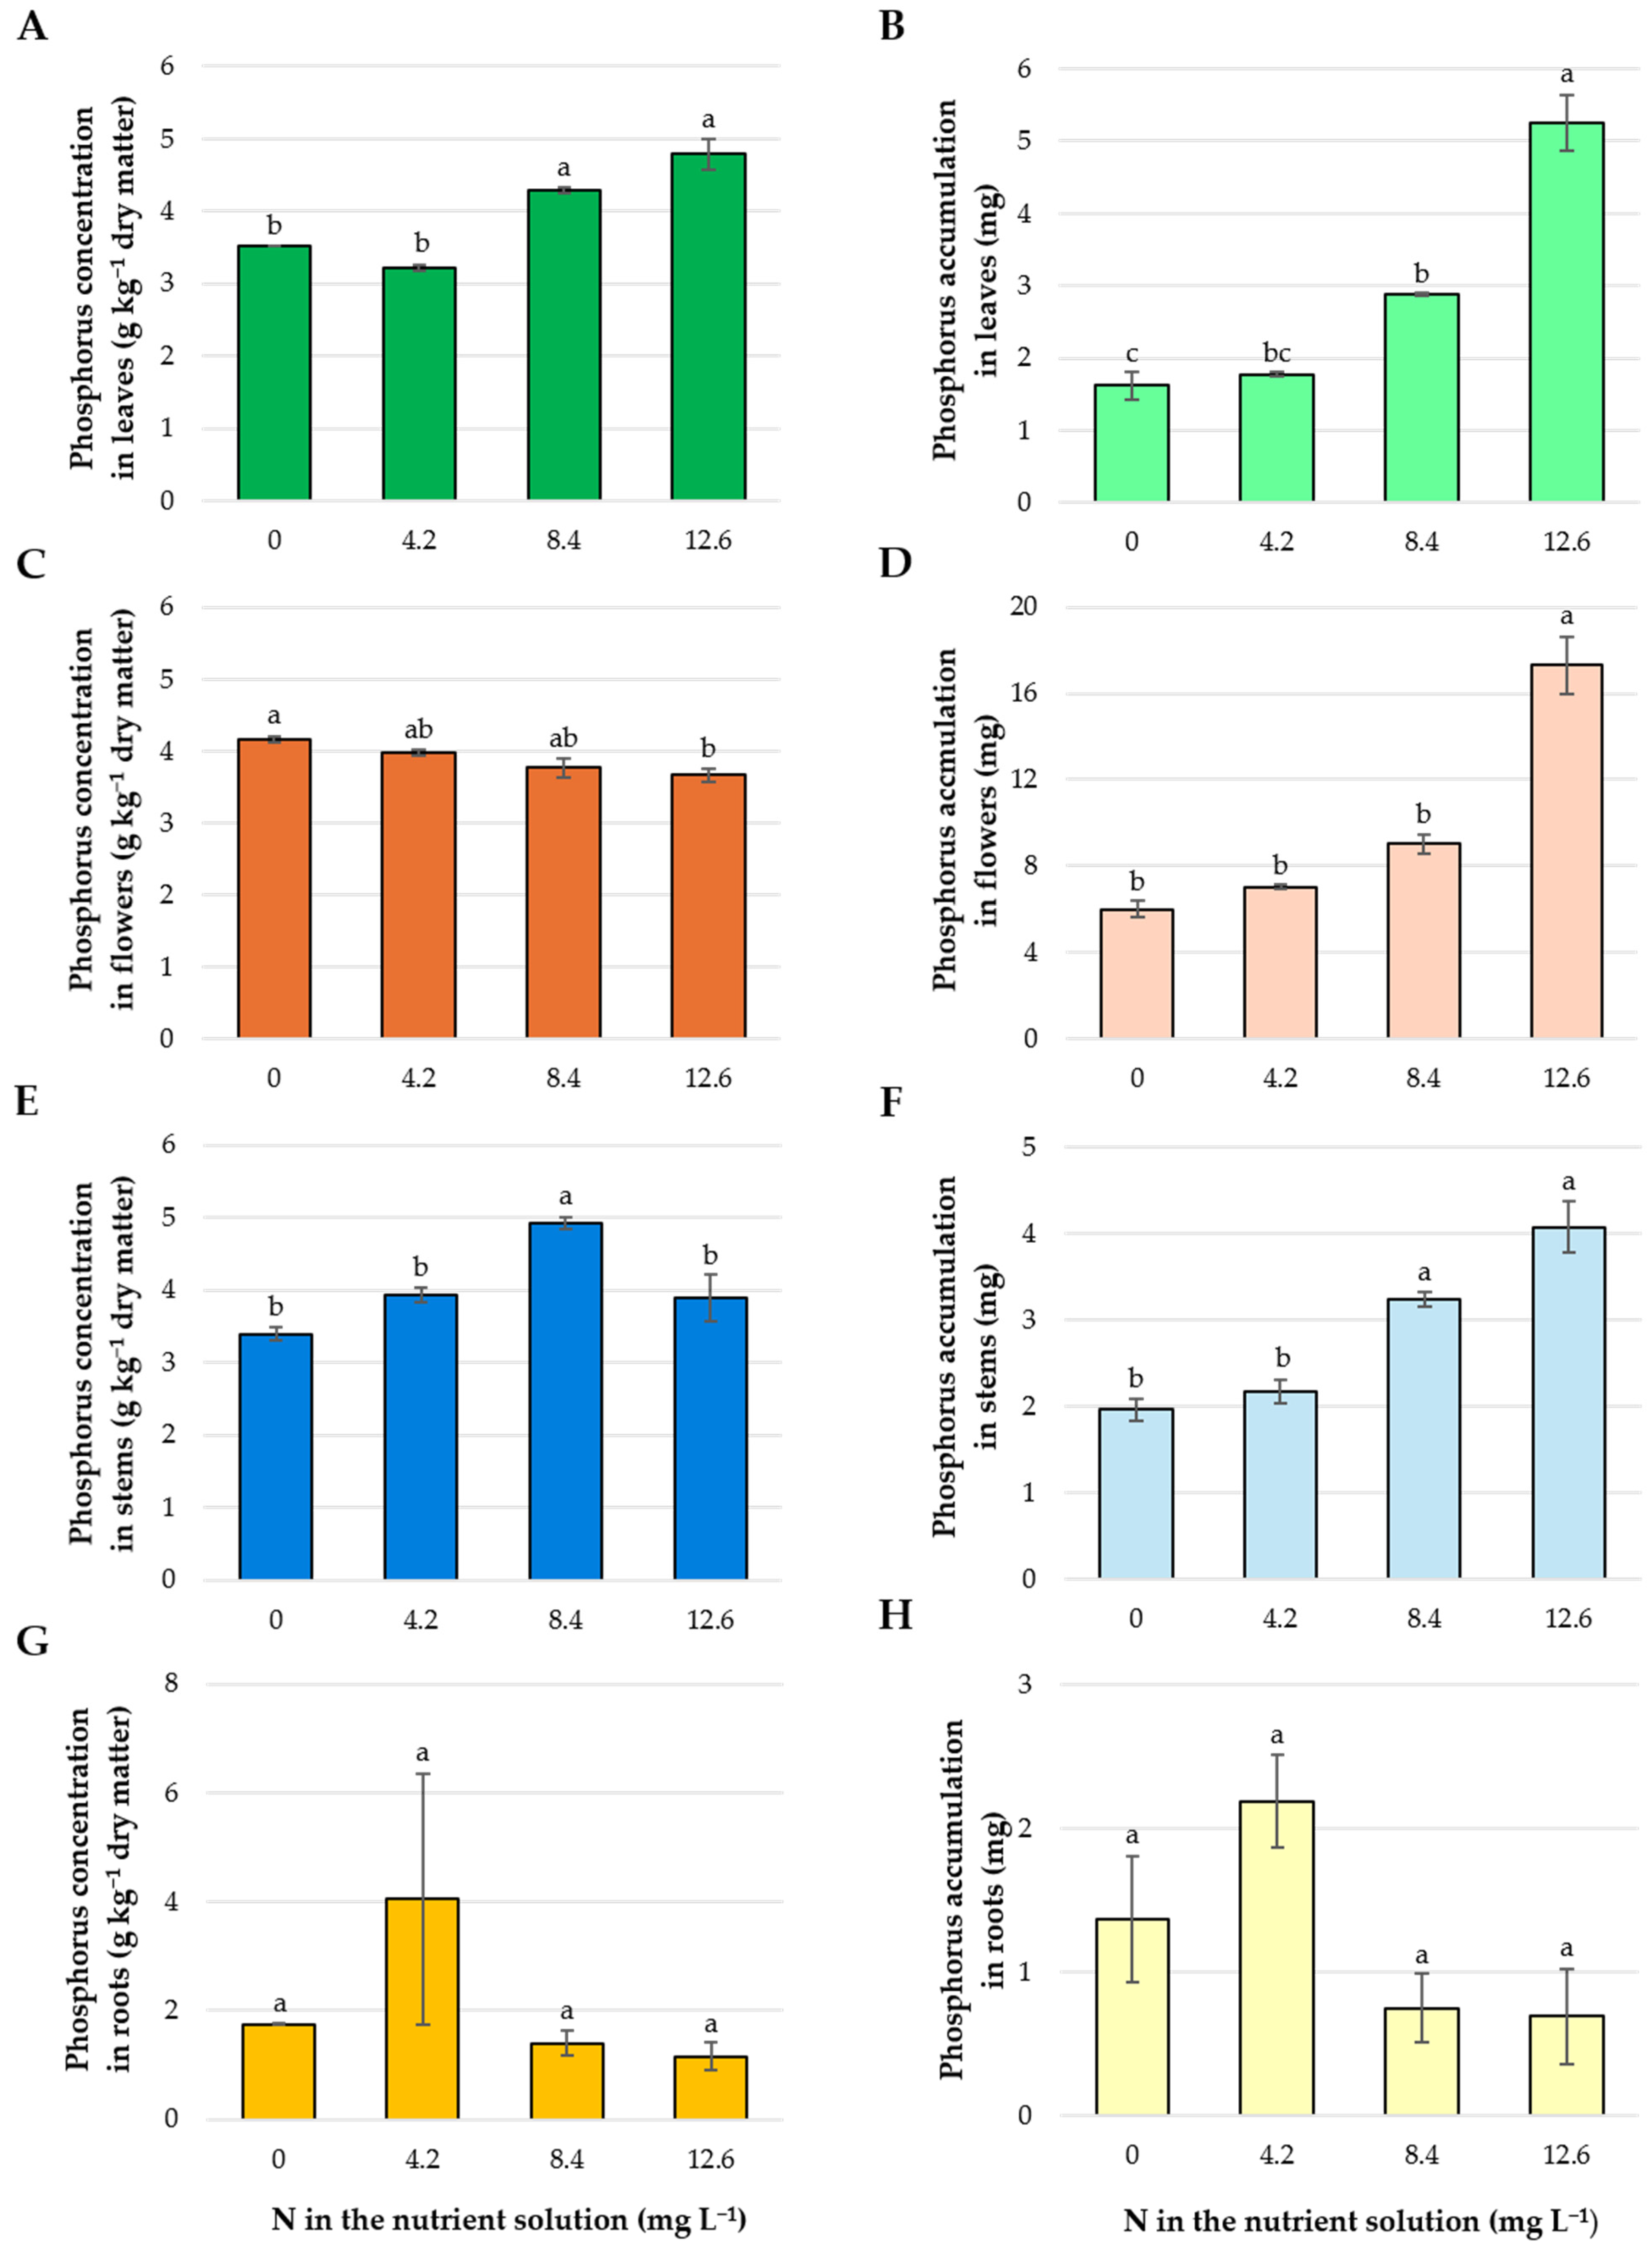
The order of P concentration among the different plant organs, regardless of the N level in the nutrient solution, was as follows: leaves > stems > flowers > roots (Figure 3).
Leaf P concentration was statistically higher at the two highest N doses compared with the other treatments (Figure 3A). In flowers, P concentration showed differences only between the control and the treatment with the highest N dose in the nutrient solution, exhibiting a negative relationship; that is, increasing N dose gradually reduced P concentration in this organ (Figure 3C). In stems, plants treated with 8.4 mg N L−1 showed a significantly higher P concentration than those subjected to the other treatments (Figure 3E). In roots, no statistically significant differences in P concentration were observed among the different treatments (Figure 3G).
At the two highest N concentrations, the following order of P accumulation was observed: flowers > leaves > stems (Figure 3). A positive relationship was observed between P accumulation in leaves, flowers, and stems and the N concentration in the nutrient solution (Figure 3B,D,F). In roots, no statistically significant differences in P accumulation were observed among the evaluated treatments (Figure 3H).

3.4. Potassium

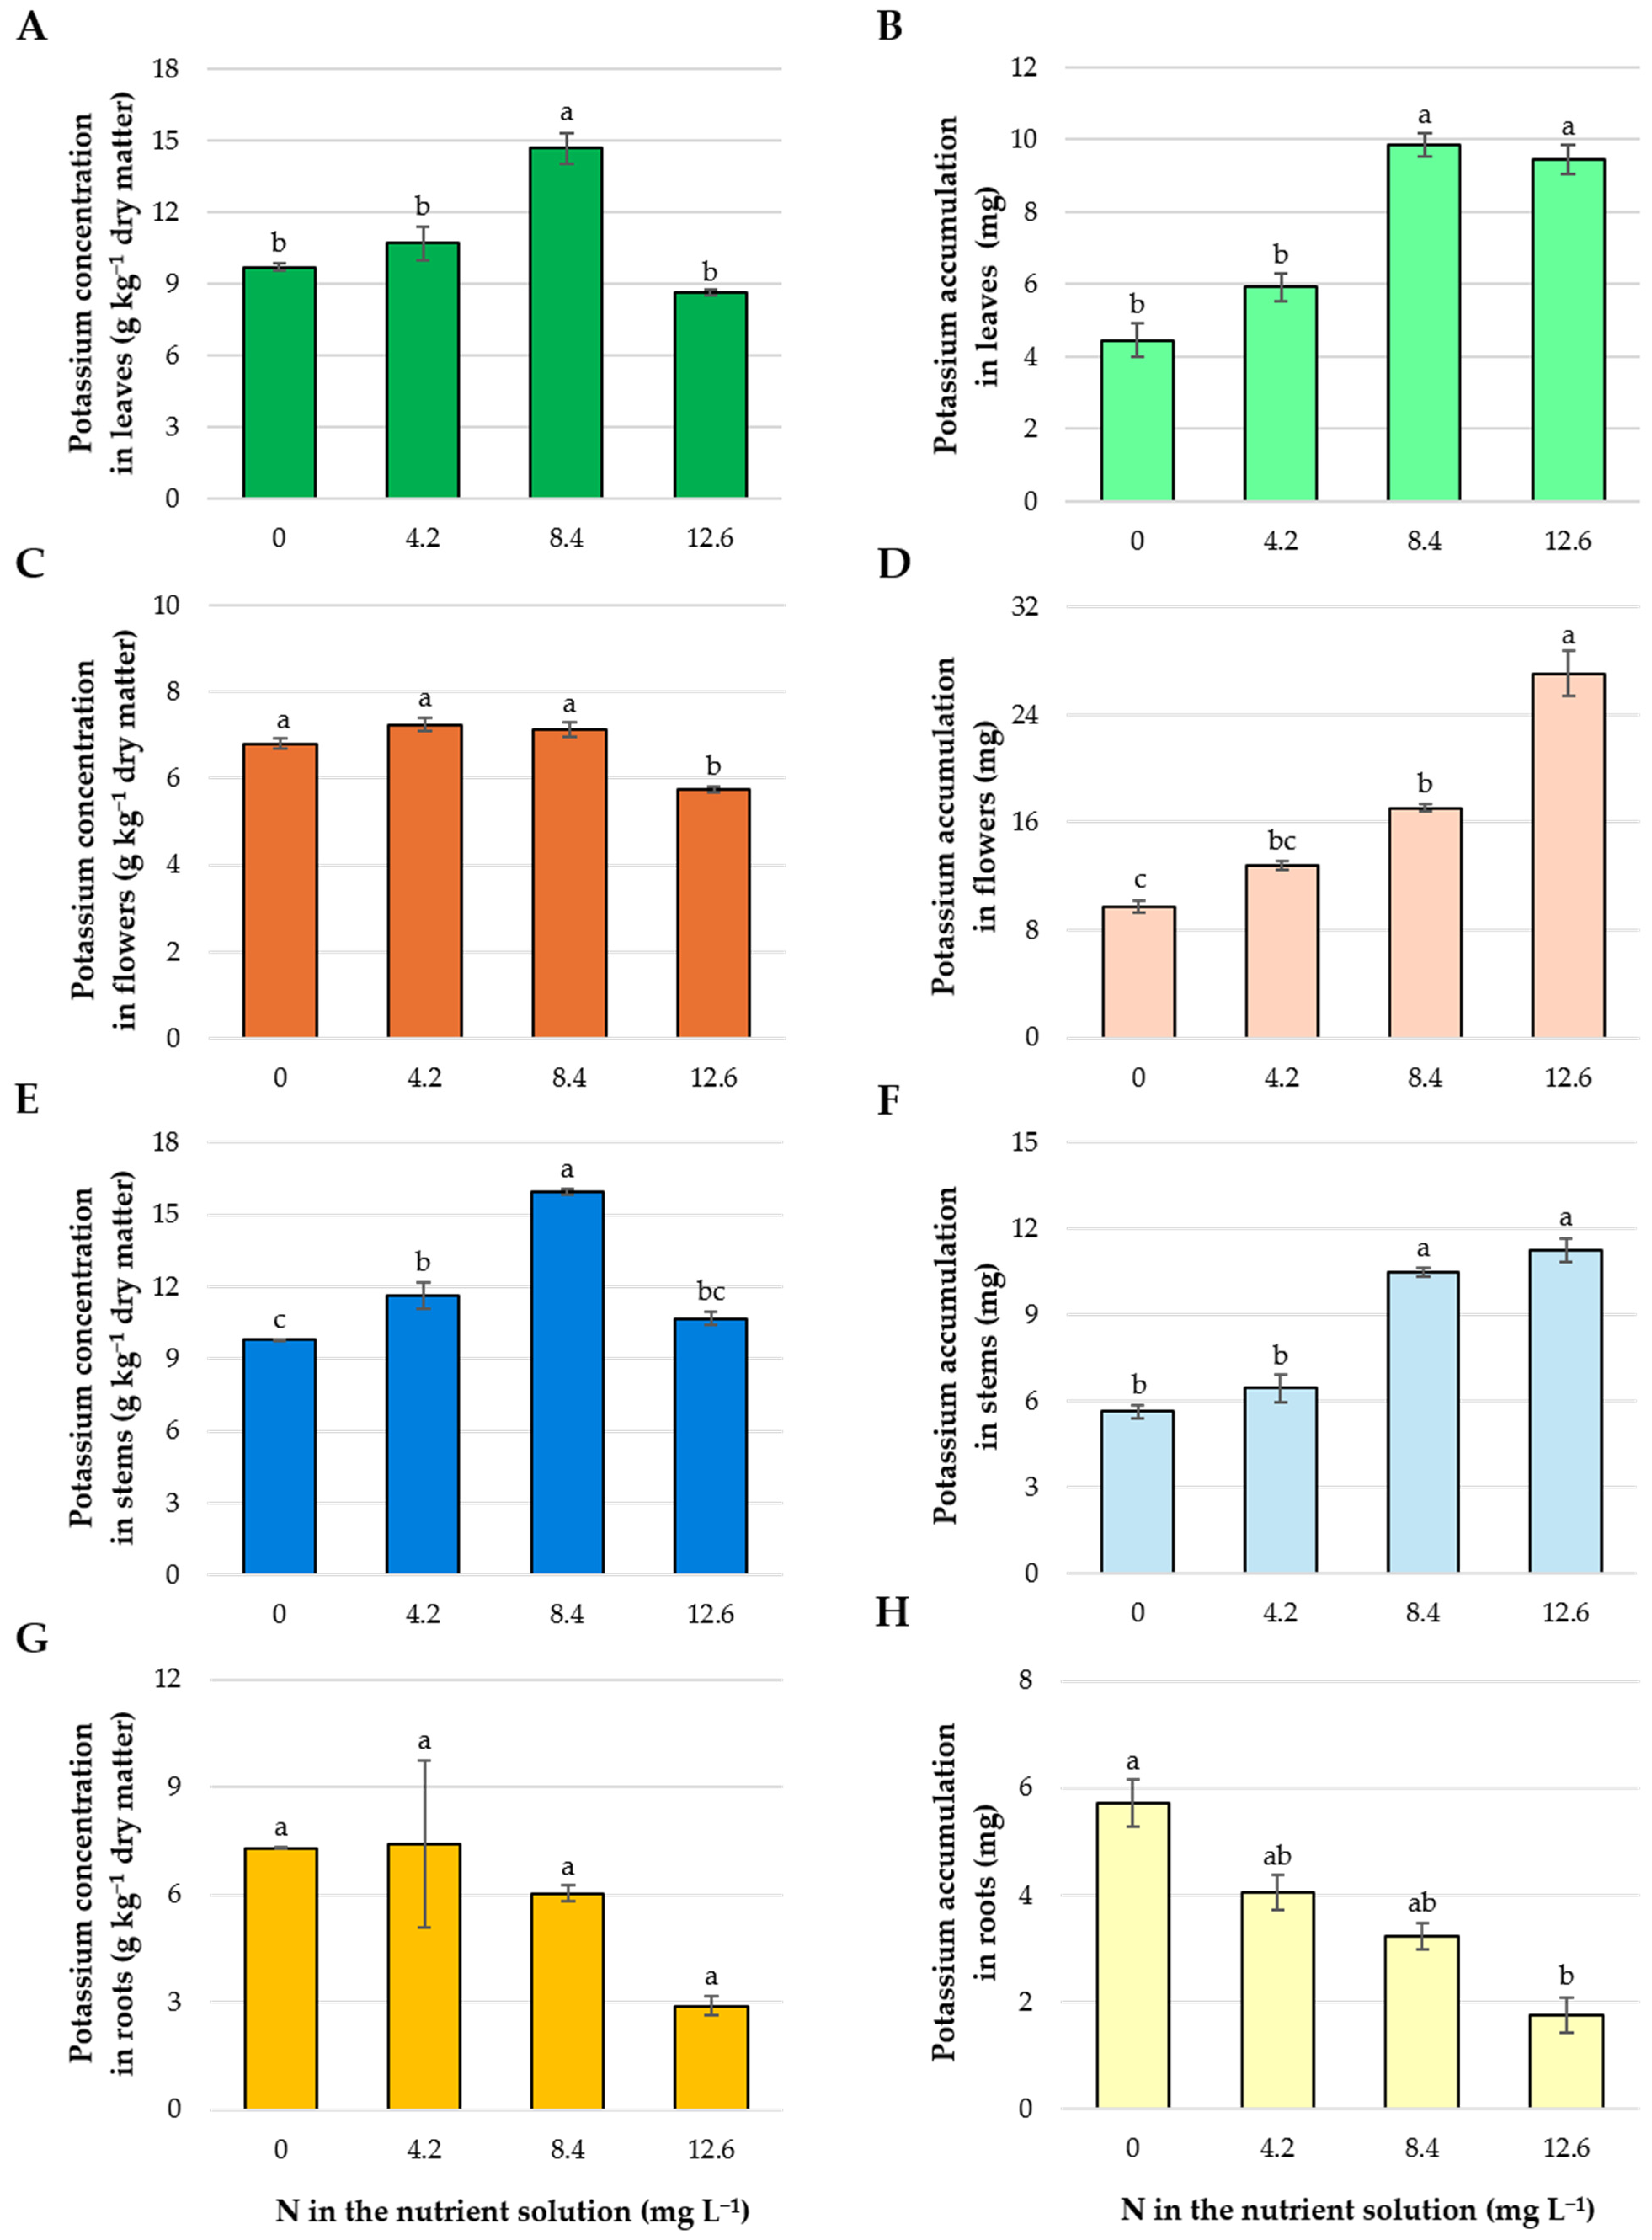
Potassium (K) concentration in leaves and stems showed a positive relationship with N concentration in the nutrient solution within the range of 0–8.4 mg L−1. In contrast, at the highest N concentration in the nutrient solution, K concentration in both organs decreased significantly (Figure 4A,E). A similar trend was observed in flowers, where a non-significant increase in K concentration was recorded within the same range (0 to 8.4 mg N L−1); however, the highest N dose resulted in a reduction in K concentration in flowers (Figure 4C). In roots, the behavior was similar to that observed in the other organs, although no statistically significant differences among treatments were found (Figure 4G).
Significant differences in K accumulation were found in all plant organs as a function of the evaluated N treatments. The order of K accumulation was as follows: flowers > stems > leaves > roots. In leaves, flowers, and stems, a positive relationship was established between K accumulation and N concentration in the nutrient solution, with the highest N concentration being associated with the highest K accumulation (Figure 4B,D,F). In roots, high N doses in the nutrient solution significantly reduced K accumulation (Figure 4H).

3.5. Calcium

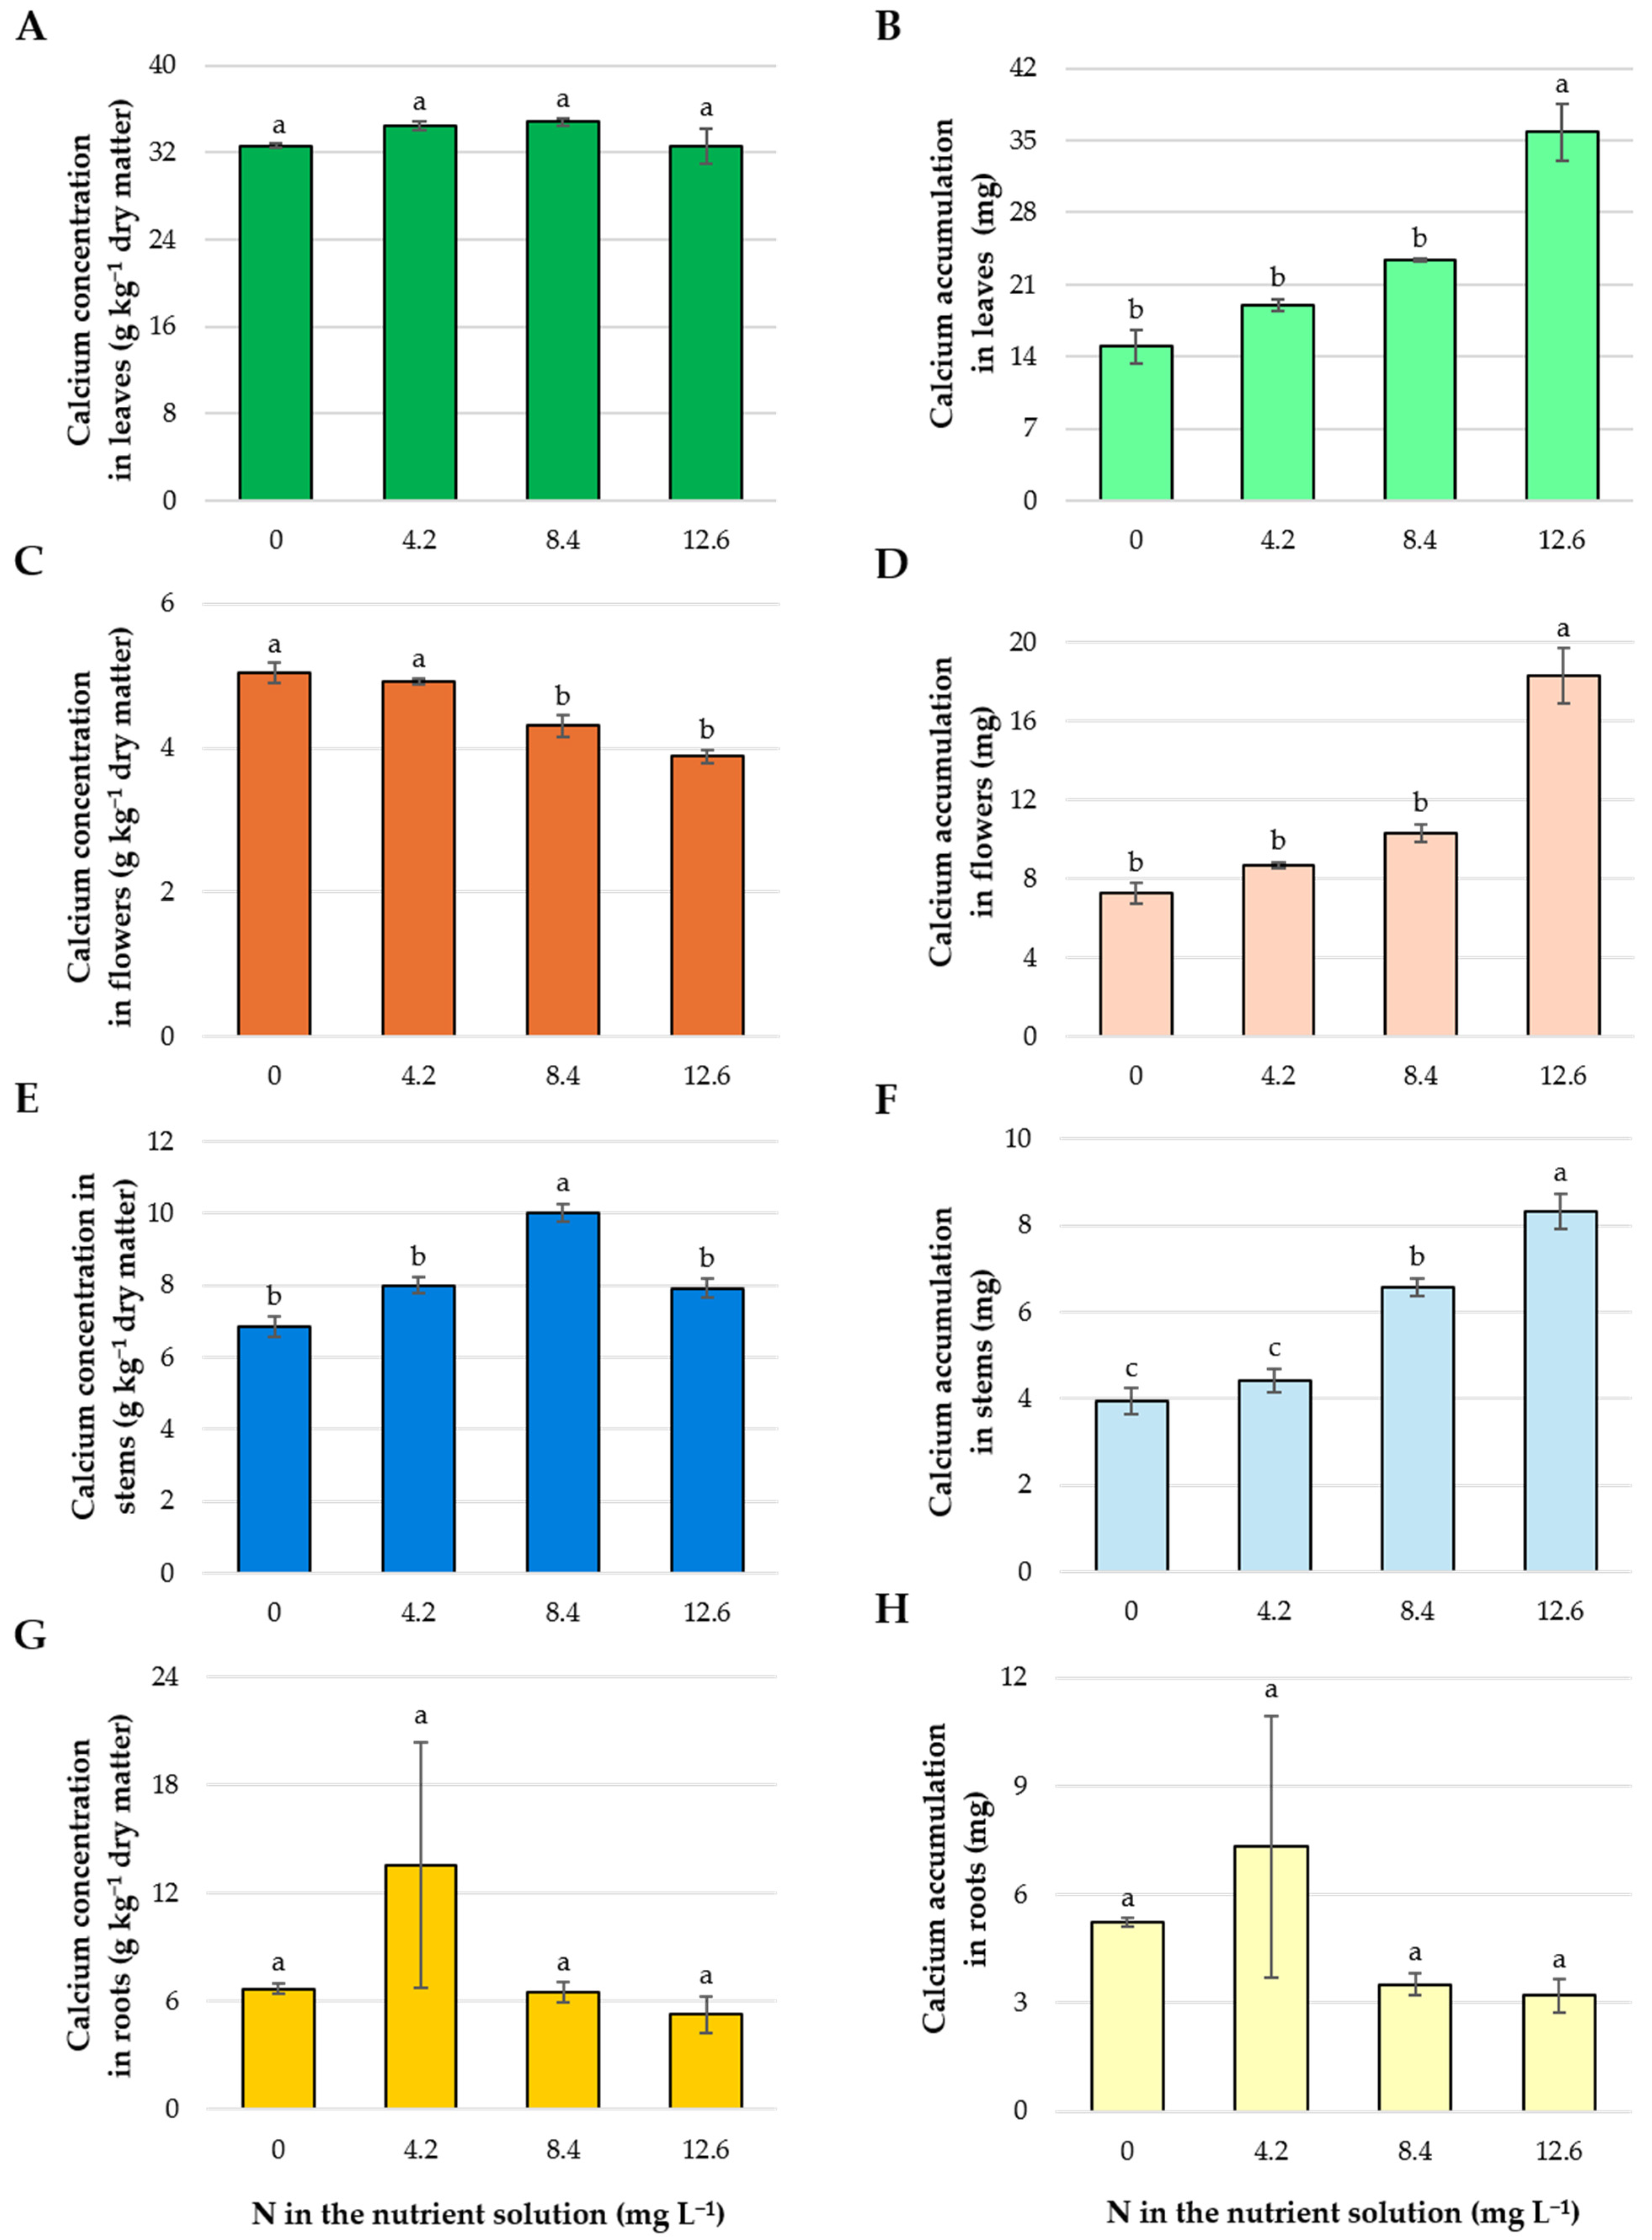
In leaves and roots, Ca concentration was not significantly affected by the different N concentrations in the nutrient solution (Figure 5A,G). In flowers, Ca concentration decreased significantly when N concentration in the nutrient solution was equal to or greater than 8.4 mg L−1 (Figure 5C). In stems, statistically significant differences among treatments were observed, with the 8.4 mg N L−1 dose resulting in a higher Ca concentration than the other treatments (Figure 5E).
Calcium accumulation in leaves, flowers, and stems (Figure 5B,D,F) was significantly higher at the N concentration of 12.6 mg L−1 in the nutrient solution compared with the other treatments. In roots, the different N concentrations in the nutrient solution did not significantly affect Ca accumulation (Figure 5H).

3.6. Magnesium

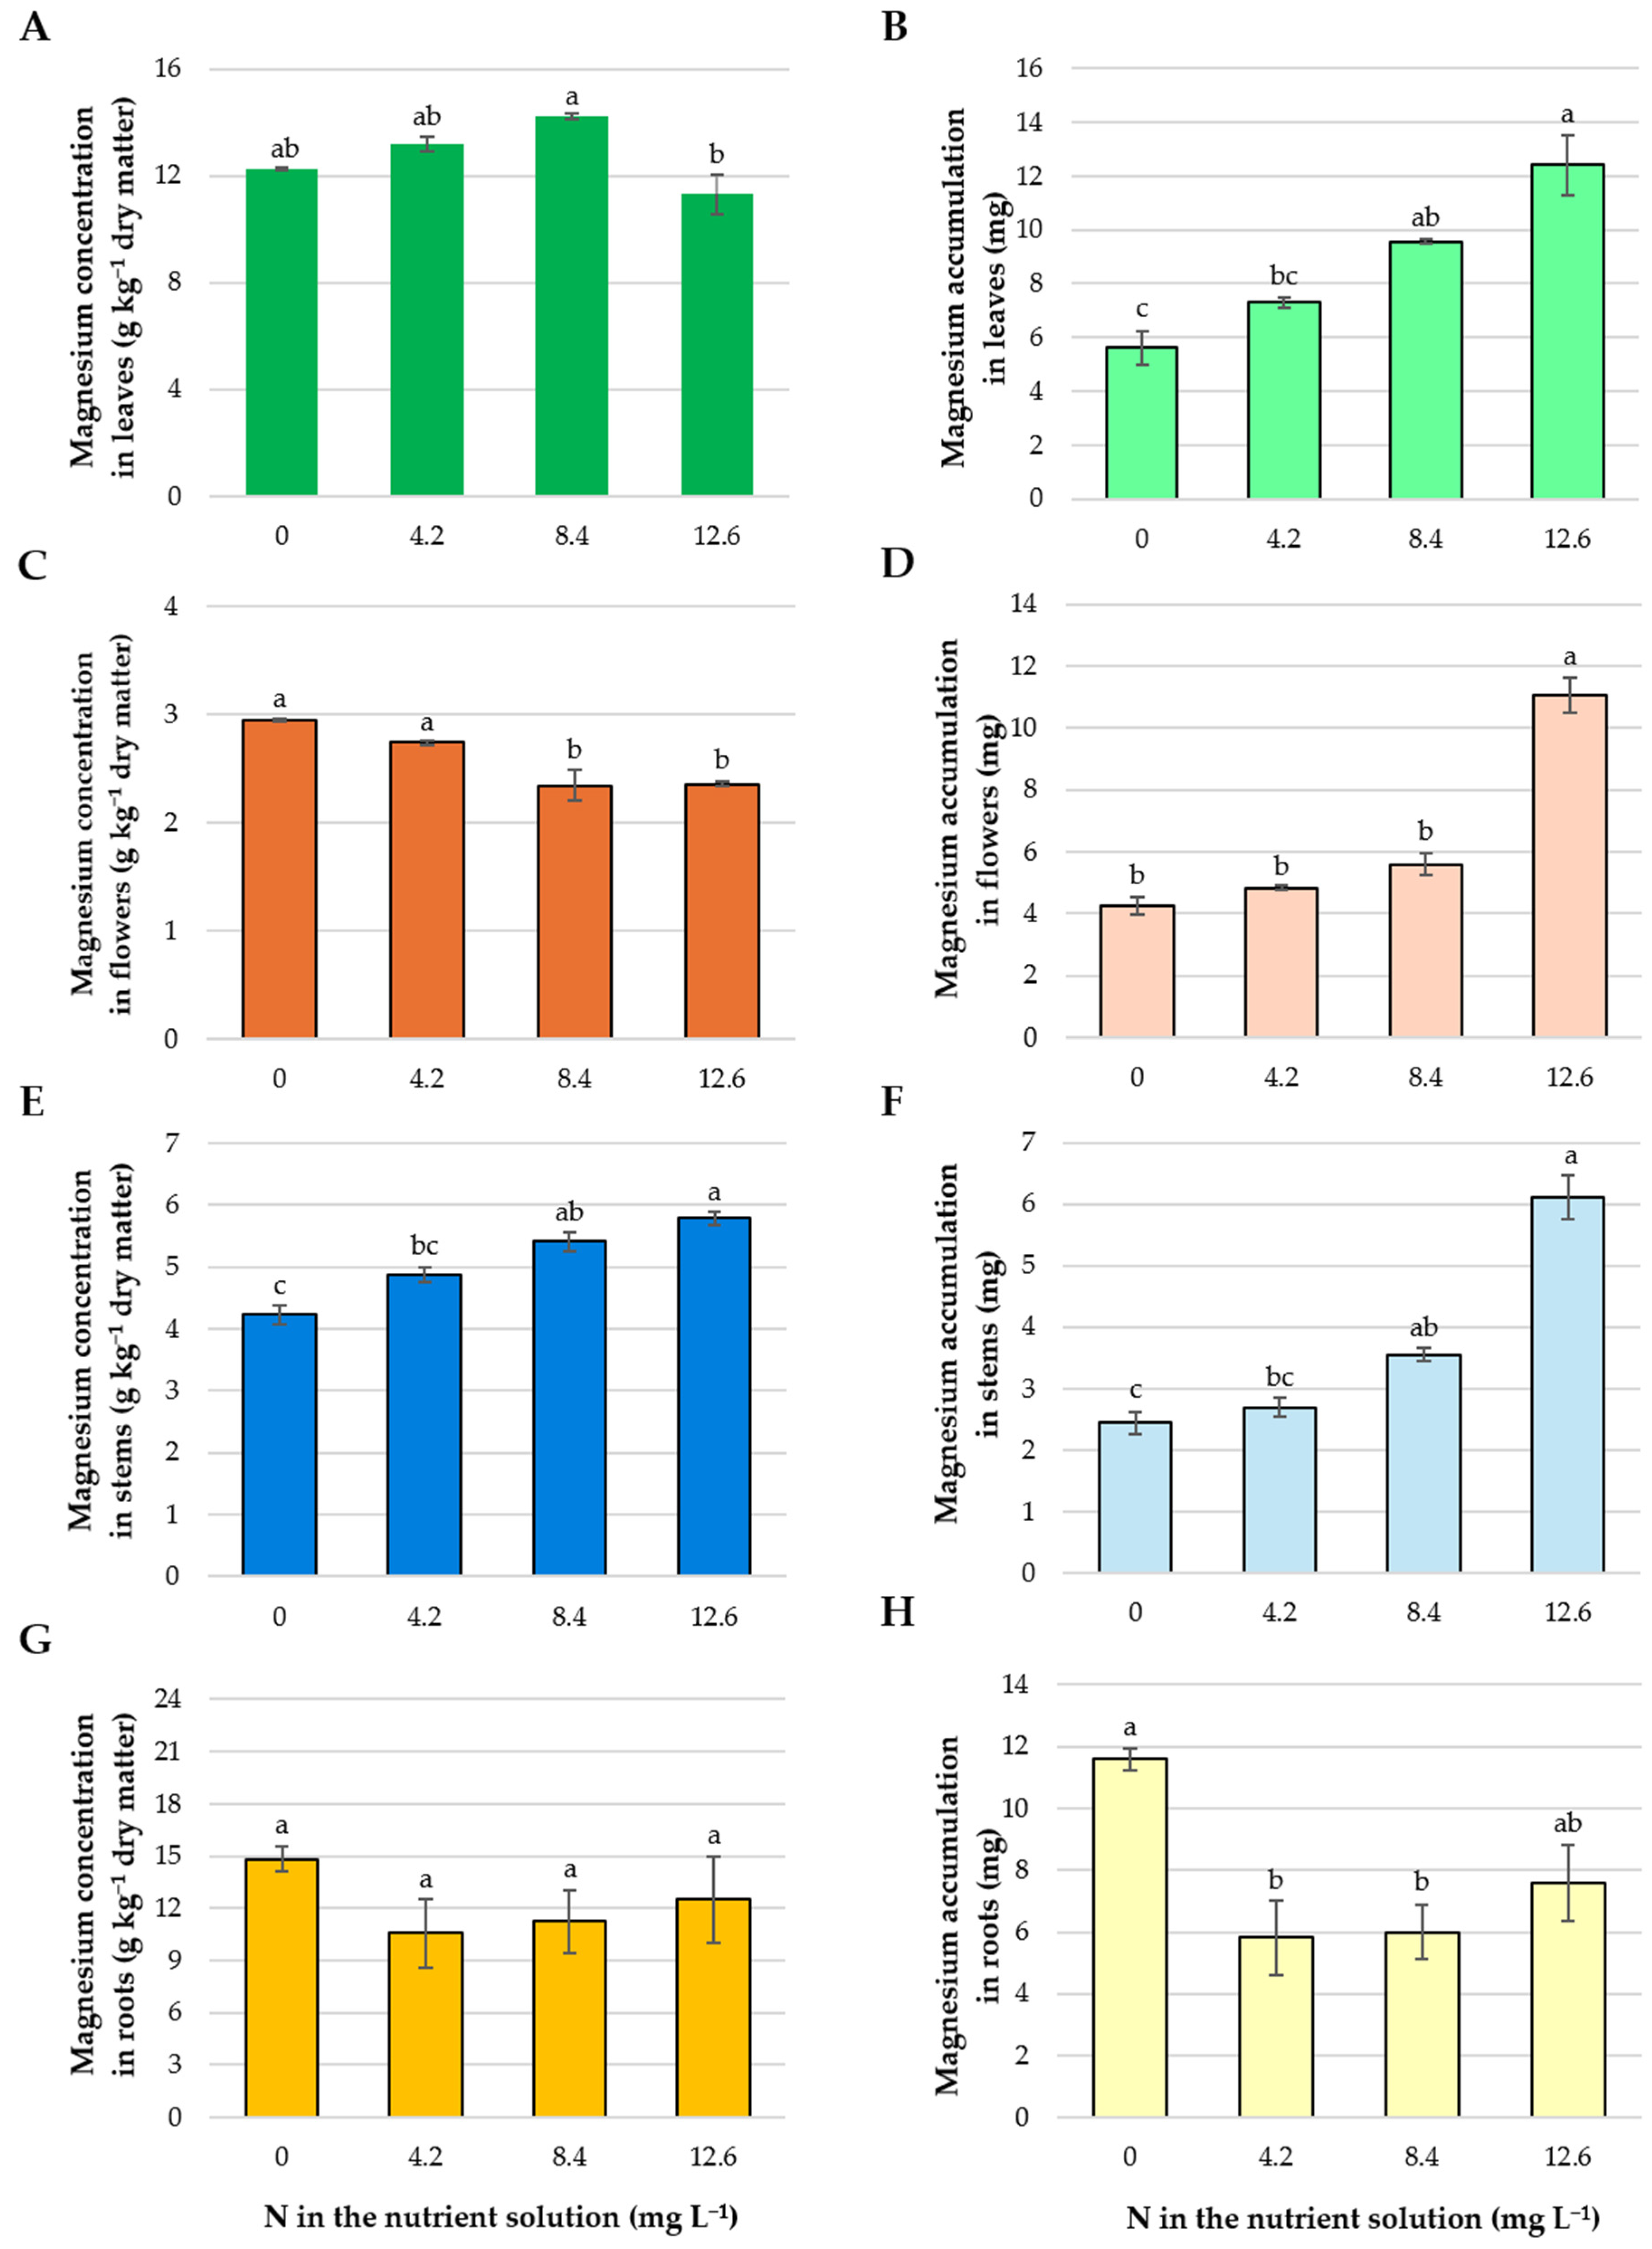
A positive relationship was observed between N dose in the nutrient solution within the range of 0 to 8.4 mg L−1 and Mg concentration in leaves and stems (Figure 6A,E). In contrast, in flowers, increasing N dose reduced Mg concentration (Figure 6C). As observed for other macronutrients, Mg concentration in roots was not significantly affected by the evaluated treatments (Figure 6G).
Magnesium accumulation showed statistically significant differences in all plant organs of Mexican marigold (Figure 6). A direct relationship was observed between Mg accumulation and N concentration in the nutrient solution; that is, higher N concentrations in the nutrient solution were associated with greater Mg accumulation in leaves, flowers, and stems (Figure 6B,D,F). In roots, by contrast, an inverse relationship was observed between Mg accumulation and N dose in the nutrient solution (Figure 6H).

3.7. Sulfur

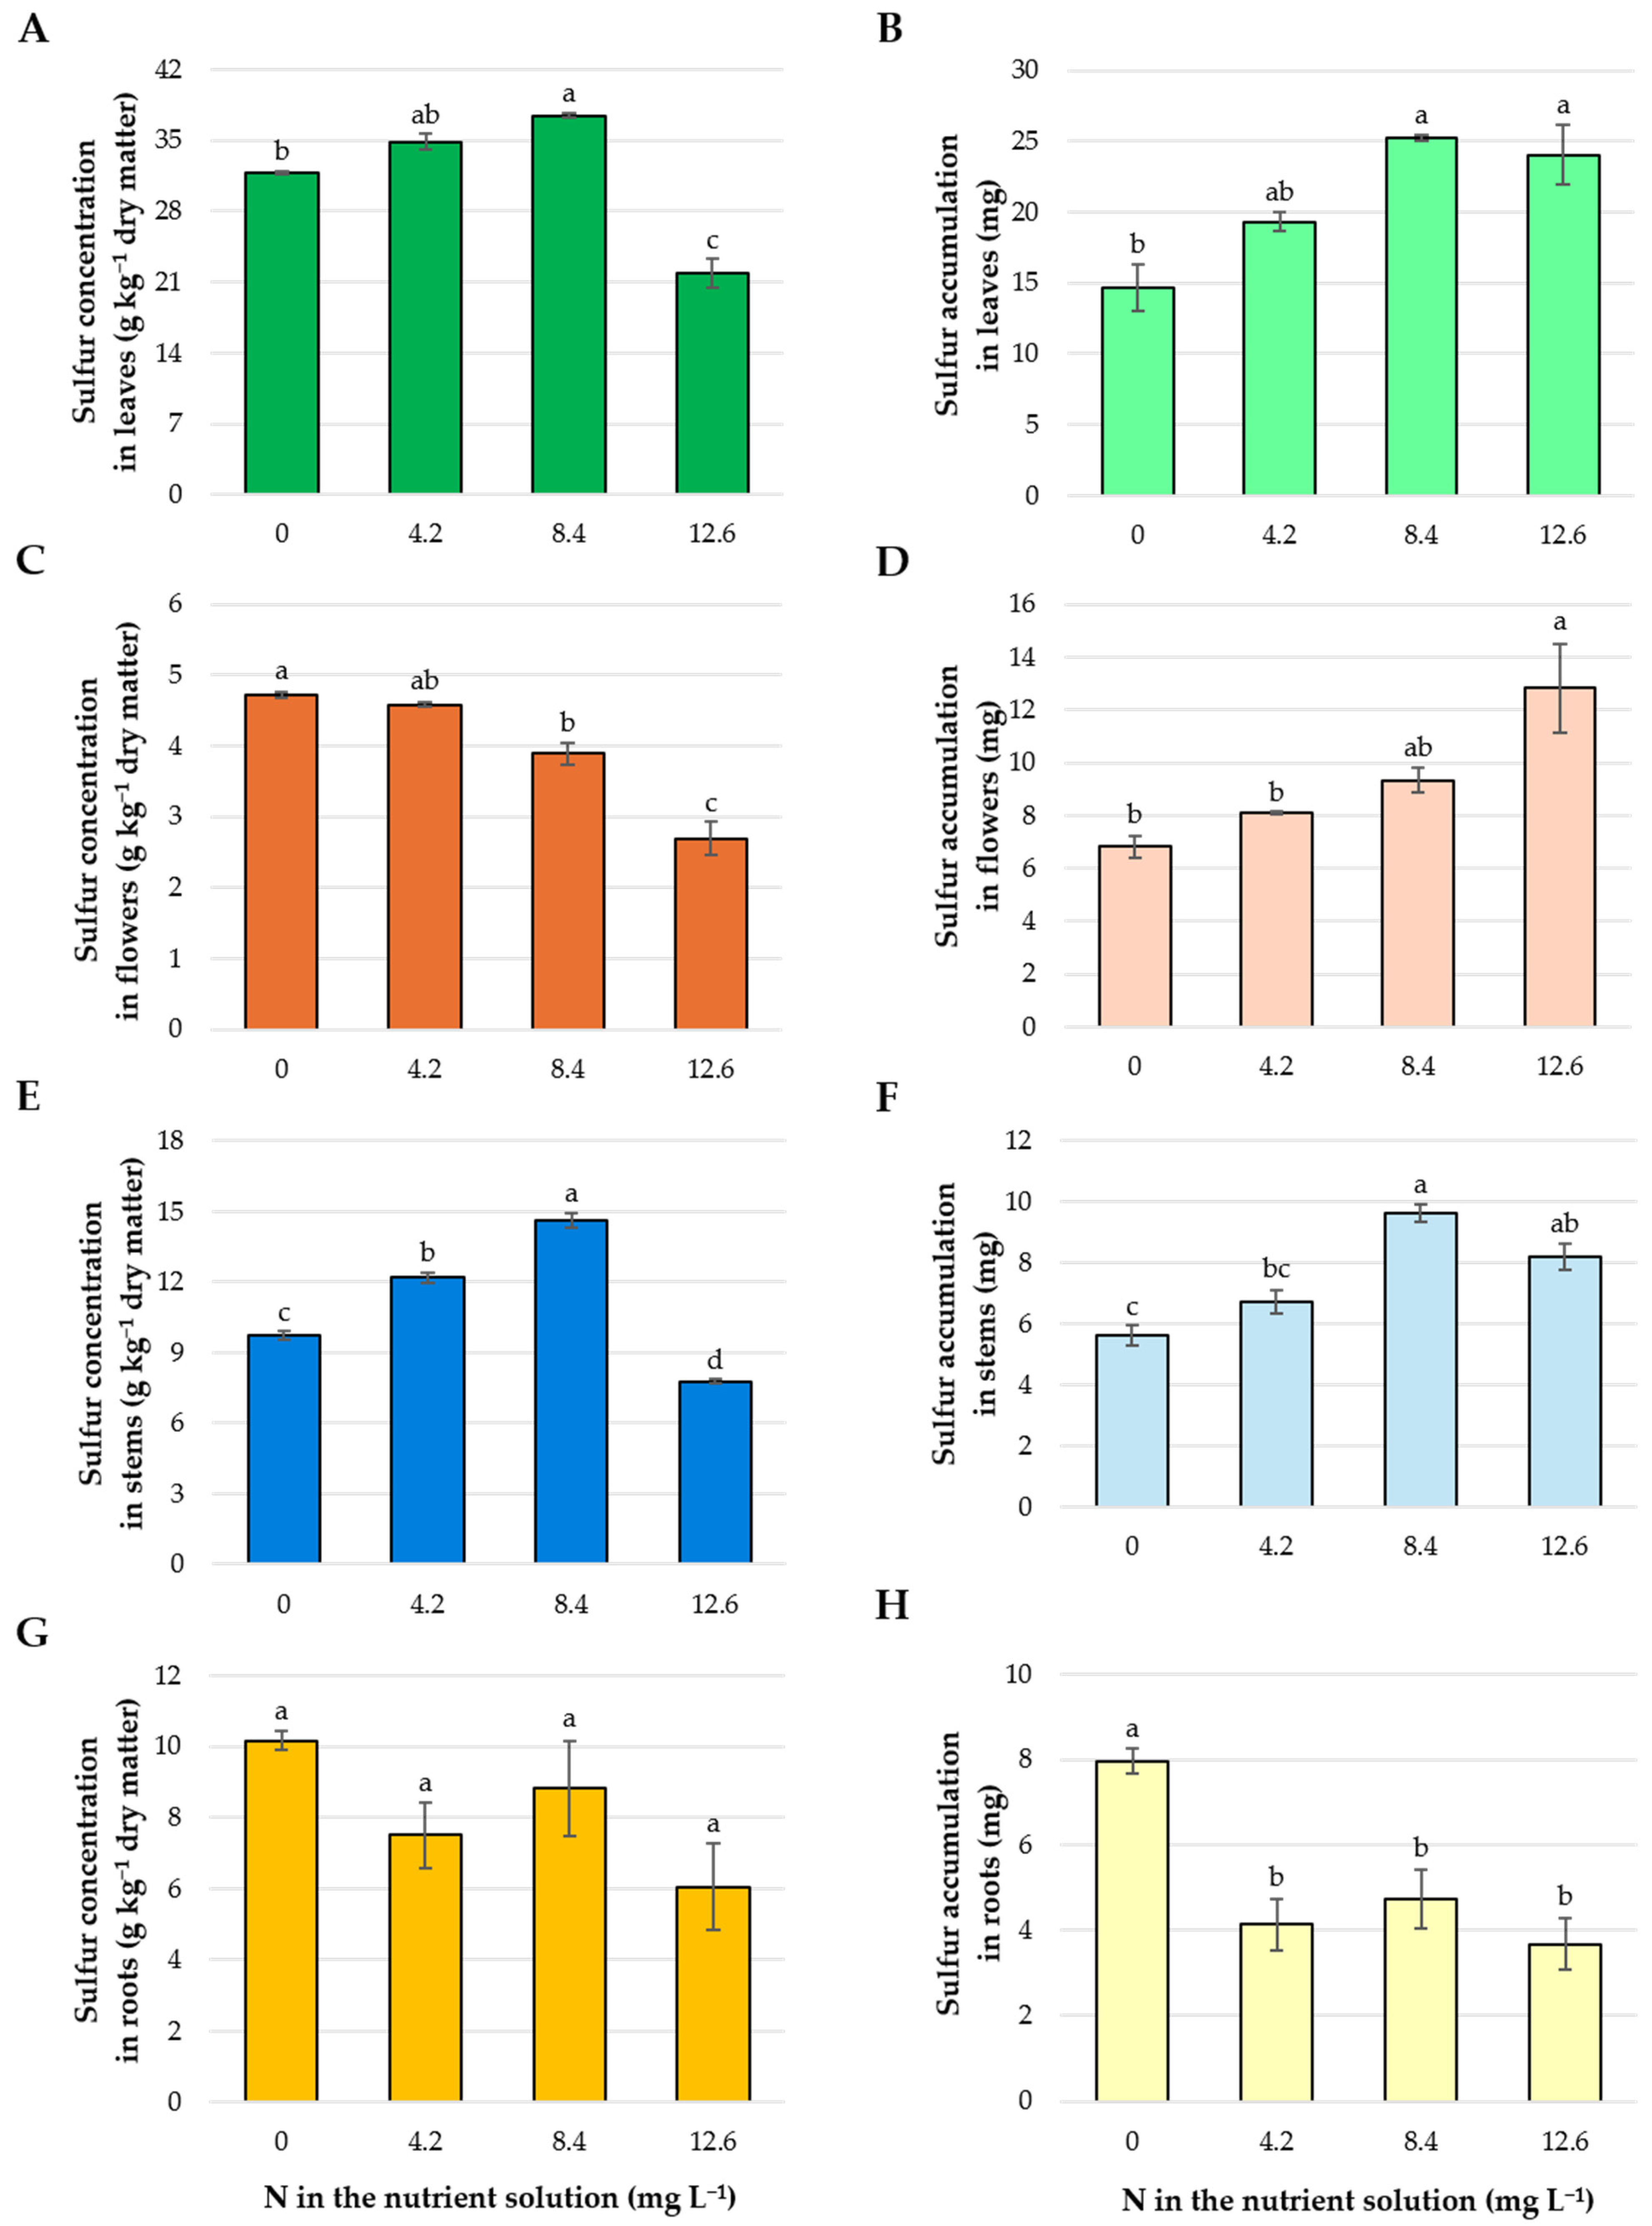
The order of sulfur accumulation in Mexican marigold organs was leaves > flowers > stems > roots, with statistically significant differences among treatments (Figure 7). In the treatments with 8.4 mg N L−1 in the nutrient solution, the highest S concentration was recorded in leaves (Figure 7A) and stem (Figure 7E). In flowers, the absence of N and the lowest N dose in the nutrient solution favored an increase in S concentration (Figure 7C). In roots, no statistically significant differences in S concentration were observed among treatments (Figure 7G).
The order of S accumulation in Mexican marigold organs was as follows, leaves > flowers > roots > stems, with statistically significant differences observed among treatments (Figure 7). Within the range of 0 to 8.4 mg N L−1 in the nutrient solution, positive trends in S accumulation were observed in leaves, flowers, and stems. Notably, at the highest N dose (12.6 mg L−1), the values obtained did not differ statistically from those recorded at the 8.4 mg N L−1 dose in the nutrient solution (Figure 7B,D,F).
Partial eta-squared values for macronutrient concentration indicated that nitrogen supply accounted for a large proportion of the variance in leaves, flowers, and stems (ηp2 generally > 0.85), whereas lower effect sizes (ηp2 ≈ 0.22-0.27) were observed in roots, particularly for P, Ca, and Mg (Table S2). In terms of macronutrient accumulation, strong effects of nitrogen were observed in aerial organs (ηp2 ≥ 0.7). In roots, effect sizes were highest for N, K, and S, intermediate for Mg, and lowest for P and Ca, indicating a differential sensitivity of root nutrient accumulation to nitrogen supply (Table S3).

4. Discussion

Nitrogen is the essential element that most strongly limits crop yield [36]. It is a critical constituent of proteins, phospholipids, nucleic acids, photosynthetic pigments, hormones, vitamins, and alkaloids, which makes it a vital element for plant growth and development [37]. In particular, N significantly influences flowering time [29] and plays a fundamental role in adaptation to abiotic stress, such as deficiencies of essential elements [38]. Because N is a scarce nutrient in most crop production systems, it is critical to understand the mechanisms that control growth by integrating and responding to signals of N deficiency; the allocation, distribution, and metabolism of this element can respond to abiotic stress, with the distribution of resources, both biomass and nutrients, reflecting plant growth and adaptation strategies [5,39]. In this context, the results presented here for Mexican marigold provide relevant information on macronutrient concentrations and their partitioning (accumulation) among different plant organs as a function of nitrogen supply in the nutrient solution.

4.1. Dry Biomass and Biomass Partitioning

Nitrogen availability markedly influenced dry biomass production and its partitioning among organs in Mexican marigold during the flowering stage. Increasing N concentration in the nutrient solution enhanced biomass accumulation in aerial organs, particularly flowers, while root biomass proportion decreased progressively (Figure 1). This pattern is consistent with classical resource allocation theory, which predicts that plants adjust biomass distribution according to the most limiting resource [40]. Under nitrogen limitation, greater allocation to roots enhances nutrient foraging capacity, whereas improved nutrient availability favors shoot growth and reproductive development. The observed reduction in relative root biomass with increasing N supply agrees with previous reports showing that nutrient enrichment reduces root investment and increases shoot:root ratios [41,42]. Meta-analyses indicate that nutrient limitation produces the strongest allocation responses among environmental factors tested [43,44]. In the present study, plants grown without N allocated nearly three times more biomass to roots compared with those supplied with the highest N concentration, indicating a strong plastic response of the root system to N availability. Notably, increasing nitrogen supply also promoted preferential allocation of biomass to flowers. A similar increase in reproductive effort with increasing nitrogen availability has been reported by Reekie and Bazzaz [45].
Within this allocation context, the greater variability observed in root nutrient measurements, particularly at 4.2 mg N L−1, may reflect a transitional allocation response between nitrogen deprivation and sufficiency. At low but non-zero N supply, plants may differ in the extent to which they prioritize root exploration versus shoot growth, resulting in greater heterogeneity among individuals. This interpretation is consistent with the comparatively smaller effect sizes detected in roots for several nutrients, suggesting a weaker and more variable response to nitrogen supply relative to aerial organs. Overall, these results demonstrate that nitrogen not only regulates total biomass production but also drives significant shifts in biomass partitioning and organ-specific nutrient dynamics during the flowering stage.

4.2. Nitrogen

In this study, N concentrations and accumulation in leaves, stems, and flowers were directly related to the concentration of this element in the nutrient solution; in contrast, an opposite trend was observed in roots (Figure 2). These results indicate that, regardless of N concentration in the nutrient solution, preferential accumulation occurs in the aboveground organs, with higher amounts in leaf blades, favoring the synthesis of enzymes and photosynthetic pigments as well as the structure of photosystems and the chloroplast as a whole [39,46]. Conversely, in roots, nitrogen has a significant influence on absorption activity and morphology [47].
Nitrogen deficiency increases the proportion of sucrose export from source leaves toward storage tissues such as roots, which reduces the synthesis of amino acids and starch in leaves. This variation in the C/N ratio also affects N translocation from roots to the shoot [48]. This response was observed in roots of the control treatment, where N accumulation was significantly higher as compared to the other treatments.
The highest N concentration in the nutrient solution (12.6 mg L−1) resulted in greater N accumulation in flowers. However, in this species, intermediate N levels have been reported to promote more efficient synthesis of pigments related to floral coloration and development, such as carotenoids [33]. Additionally, structures such as pods, seeds, and inflorescences have been described as dominant sink organs during the reproductive phase [49,50].

4.3. Phosphorus

A positive correlation exists between N and P partitioning in higher plants; species that accumulate more N in leaves also tend to accumulate more P [39]. This agrees with the results obtained in the present study, in which the treatment with 8.6 mg N L−1 increased P concentration in leaves and stems, as well as its accumulation in stems (Figure 3). Quantitatively, P accumulation in leaves increased by 224.8% at 12.6 mg N L−1 relative to the control, exceeding the proportional increase observed in leaf biomass (137.5%). This disproportionate increase suggests a synergistic enhancement of P acquisition and allocation under high nitrogen supply. A similar but less pronounced pattern was observed in stems (108%), whereas roots did not show a consistent positive response, reflecting organ-specific regulation of P partitioning. The synergistic association between both nutrients can be explained by the fact that N supply may promote P acquisition and utilization through the induction of phosphate transporters and the activation of mechanisms that increase P availability, such as organic acid exudation and phosphatase enzyme activity [51].
In roots, neither P concentration nor accumulation showed significant differences among treatments (Figure 3H). This pattern is consistent with the existence of phosphate homeostasis mechanisms, in which the activities of the transporters of the PHT1 family mainly depend on external P availability and aim to ensure stable uptake according to metabolic requirements [52]. In addition, plant cells store phosphate in vacuoles through tonoplast transporters involved in both influx (PHT5) and efflux (VPE), which contribute to maintaining a buffered and relatively constant internal reserve, even when metabolic demand in the shoot increases [53,54].
It is noteworthy that both N and P accumulation were higher in leaves than in stems and roots (Figure 2 and Figure 3). Leaves are more metabolically active compared to other organs, and, therefore, they require higher N and P accumulations to meet the energetic demands. Conversely, stems and roots contain a greater amount of storage and mechanical support tissues, which are rich in cellulose, hemicellulose, and lignin, and hence require lower amounts of N and P to feed their metabolic activities [1].

4.4. Potassium

Increasing N concentration in the nutrient solution enhanced both K concentration and accumulation in leaves, stems, and flowers (Figure 4). Nitrogen was supplied in the nutrient solutions mainly as nitrate (NO3). Nitrate absorption comprises a net influx of negative charges into the root, which increases the demand for cations such as K+ to maintain electrochemical balance. Moreover, NO3 uses K+ as a counterion during its transport from the root to the shoot [55]. Potassium is essential for stomatal regulation, maintenance of cellular turgor, and phloem transport of photoassimilates [56,57]. All those roles are especially critical in tissues with photosynthetic activity and high energy demand, such as leaves and flowers, under higher N supply. In flowers, the maximum K accumulation observed at the highest N dose reflects the high demand for carbohydrates and energy during reproductive development.
Conversely, roots showed a decrease in both K concentration and accumulation as N concentration in the nutrient solution increased. This decrease suggests that K uptake stays about the same and that the main change happens in internal reallocation, with more K moving toward the shoot as nitrate encourages growth and metabolic activity in aboveground tissues. These results demonstrate that N availability influences K partitioning, leading to its enhanced accumulation in the leaves, stems, and flowers of Mexican marigold.

4.5. Calcium

Increasing N concentration in the nutrient solution resulted in increased Ca accumulation in shoot organs, with the 12.6 mg N L−1 treatment producing the highest Ca accumulation values in leaves, stems, and especially flowers (Figure 5). This is consistent with evidence indicating that NO3 uptake (the main N form supplied in the nutrient solutions) stimulates the influx of cations such as Ca2+ and K+ to maintain ionic balance during NO3 transport and assimilation [58]. In several crops, including rice, wheat, maize, squash, and tomato, N supply in the form of NO3 has been shown to increase Ca accumulation in shoots [59], which agrees with the higher Ca accumulation observed in Mexican marigold treated with the highest N dose.
Additionally, the interaction between Ca and N suggests that Ca2+-mediated signaling may be involved in the primary nitrate response and in the regulation of gene expression associated with N assimilation [60,61], including genes encoding essential enzymes such as nitrate reductase (NR) and glutamine synthetase (GS) [62].
The lower Ca accumulation in roots compared with leaves, as well as the lack of significant response of this variable to N treatments in the nutrient solution, results from Ca transport and distribution patterns. Calcium mobility within the plant is limited and occurs almost exclusively through the xylem driven by transpiration flow, which favors its accumulation in organs with higher transpiration rates such as leaves and stems. In contrast, roots, as organs with lower transpiration, accumulate lower Ca amounts [63].

4.6. Magnesium

The results show that Mg concentration and accumulation in leaves and stems increased as N availability in the nutrient solution increased up to 8.4 mg L−1 (Figure 6A,B,E,F), whereas Mg accumulation in roots decreased at higher N doses (Figure 6H). This pattern is in full agreement with the key role of Mg in photosynthetically active tissues, where it participates in photosynthesis, protein synthesis, and the activation of numerous enzymes [64,65]. Approximately three-quarters of foliar Mg is associated with protein synthesis and ribosome function, and a relevant fraction participates directly in Rubisco activation and ATP generation during photosynthesis [65,66]. Therefore, a greater N supply, which increases the demand for photosynthetic proteins, is associated with greater Mg accumulation in leaves and stems, as observed in this study.
In contrast, the reduction in Mg accumulation in roots under high N doses is consistent with reports indicating that Mg is a highly mobile element that is preferentially redistributed to organs with higher metabolic and photosynthetic activity [66]. Likewise, the decrease in Mg concentration in flowers as N dose increased can be interpreted in the context of the nutrient dilution effect, which has been widely described when biomass increase is not accompanied by proportional nutrient accumulation [66]. Although flower dry biomass increased markedly at 12.6 mg N L−1 (up to 226% compared with 8.4 mg N L−1), Mg concentration decreased by approximately 20.1% relative to the control treatment, indicating a dilution effect in which biomass accumulation outpaced Mg accumulation. A similar but less pronounced reduction (7.2%) was observed at 4.2 mg N L−1. This interpretation is supported by the strong nitrogen effect on flower biomass (ηp2 = 0.969; Table S1), as well as on stems (ηp2 = 0.949) and leaves (ηp2 = 0.954), whereas the effect on root biomass was comparatively lower (ηp2 = 0.715). These results contrast with the more moderate proportional variation observed in Mg concentration (Table S2), reinforcing the interpretation of a biomass-driven dilution response.

4.7. Sulfur

In this study, the highest S concentrations and accumulation in leaves and stems were recorded at 8.4 mg N L−1 (Figure 7). This behavior is consistent with the close metabolic interdependence between N and S, as both converge in cysteine synthesis, which represents the junction between nitrate, sulfate, and carbon assimilation [67,68].
Sulfate assimilation has been shown to be coordinated with nitrate assimilation, such that deficiency of one of these nutrients limits the efficiency of the other [67]. Consequently, the results obtained suggest that moderate N levels prompt a more efficient S accumulation in aboveground organs, whereas relative excess N does not translate into greater S allocation, possibly due to metabolic constraints in the sulfate assimilation pathway.
The higher S concentration in flowers under lower N availability (Figure 7C) is consistent with reports indicating that S actively participates in the synthesis of sulfur-containing amino acids and antioxidant compounds, whose accumulation may be induced when growth is not excessively boosted by N [69]. Likewise, the absence of significant differences in S concentration in roots is in full agreement with the existence of homeostatic mechanisms regulating the uptake and storage of this element [67].

4.8. Integrated Response to Nitrogen Supply

Effect size analysis (partial ηp2) confirmed that nitrogen supply explained a substantial proportion of the variance in macronutrient concentration, accumulation, and biomass responses in aerial organs (Tables S1–S3), whereas root responses were weaker and more stable, indicating tighter homeostatic regulation of nutrient uptake and storage.
The 8.4 mg N L−1 concentration was best for increasing nutrient concentration, while the highest dose (12.6 mg L−1) mainly favored total Ca and Mg accumulation in aboveground organs. Quantitatively, nitrogen supply revealed contrasting nutrient dynamics, with some elements exhibiting dilution patterns under high biomass production, whereas others showed synergistic increases in accumulation relative to biomass growth. These findings highlight the complexity of nitrogen-driven nutrient interactions during the flowering stage.

5. Conclusions

Differential N supply in the nutrient solution significantly influenced macronutrient concentration, accumulation and biomass partitioning in Mexican marigold during the flowering stage. Moderate to high N levels (8.4 and 12.6 mg N L−1) enhanced nutrient accumulation in aboveground organs and promoted preferential allocation to leaves and flowers while reducing relative root biomass.
Nitrogen therefore acted as a key regulator of macronutrient partitioning within the plant. Moderate to high N availability improved the nutritional status of aerial organs, which is particularly relevant for ornamental crops, where foliage and reproductive structures determine commercial quality. Optimizing N concentration in the nutrient solution therefore represents a practical strategy to enhance nutrient use efficiency and support sustainable ornamental plant production.

Supplementary Materials

The following supporting information can be downloaded at https://www.mdpi.com/article/10.3390/nitrogen7010026/s1. Table S1. Partial eta squared (ηp2) values for the effect of nitrogen supply on dry biomass production and partitioning among organs in Mexican marigold; Table S2. Partial eta squared (ηp2) values for the effect of nitrogen supply on macronutrient concentration in different organs of Mexican marigold; Table S3. Partial eta squared (ηp2) values for the effect of nitrogen supply on macronutrient accumulation in different organs of Mexican marigold.

Author Contributions

Conceptualization, L.I.T.-T. and F.C.G.-M.; methodology, M.G.P.-S.; software, L.I.T.-T.; validation, F.C.G.-M., E.E.H.-A. and L.I.T.-T.; formal analysis, L.I.T.-T.; investigation, M.G.P.-S.; resources, L.I.T.-T. and F.C.G.-M.; data curation, L.I.T.-T.; writing—original draft preparation, L.I.T.-T.; writing—review and editing, F.C.G.-M. and E.E.H.-A.; visualization, L.I.T.-T. and F.C.G.-M.; supervision, L.I.T.-T.; project administration, L.I.T.-T.; funding acquisition, L.I.T.-T. and F.C.G.-M. All authors have read and agreed to the published version of the manuscript.

Funding

This research received no external funding.

Data Availability Statement

Dataset available on request from the authors.

Conflicts of Interest

The authors declare no conflicts of interest.

References

  1. Jiang, D.; Gong, H.; Niklas, K.J.; Wang, Z. Allocation of nitrogen and phosphorus in the leaves, stems, and roots of Artemisia: A case study in phylogenetic control. Front. Plant Sci. 2024, 15, 1445831. [Google Scholar] [CrossRef]
  2. Kirkby, E.A. Introduction, definition and classification of nutrients. In Marschner Mineral Nutrition of Plants, 4th ed.; Rengel, Z., Cakmak, I., White, P.J., Eds.; Elsevier-Academic Press: London, UK, 2023; pp. 50–75. [Google Scholar]
  3. Solberg, M. Plant nutrition: Essential elements, uptake mechanisms, and physiological significance. Int. Res. J. Plant Sci. 2025, 16, 1–2. [Google Scholar]
  4. Lal, B.; Nayak, V.; Kumar, A.; Kumar, P. A Perspective View of Nitrogen: Soil, Plants and Water. In Agriculture, Livestock Production and Aquaculture: Advances for Smallholder Farming Systems Volume 1; Kumar, A., Kumar, P., Singh, S.S., Trisasongko, B.H., Rani, M., Eds.; Springer International Publishing: Cham, Switzerland, 2022; pp. 113–135. [Google Scholar]
  5. Ye, J.Y.; Tian, W.H.; Jin, C.W. Nitrogen in plants: From nutrition to the modulation of abiotic stress adaptation. Stress Biol. 2022, 2, 4. [Google Scholar] [CrossRef] [PubMed]
  6. Shen, F.; Qin, Y.; Wang, R.; Huang, X.; Wang, Y.; Gao, T.; He, J.; Zhou, Y.; Jiao, Y.; Wei, J.; et al. Comparative genomics reveals a unique nitrogen-carbon balance system in Asteraceae. Nat. Commun. 2023, 14, 4334. [Google Scholar] [CrossRef] [PubMed]
  7. Elia, A.; Santamaria, P.; Serio, F. Ammonium and nitrate influence on artichoke growth rate and uptake of inorganic ions. J. Plant Nutr. 1996, 19, 1029–1044. [Google Scholar] [CrossRef]
  8. Akkal-Corfini, N.; Robin, P.; Menasseri-Aubry, S.; Corson, M.S.; Sévère, J.P.; Collet, J.M.; Morvan, T. Fate of nitrogen from Artichoke (Cynara cardunculus L. var. scolymus (L.)) crop residues: A review and lysimeter study. Nitrogen 2021, 2, 41–61. [Google Scholar] [CrossRef]
  9. Krapp, A.; David, L.C.; Chardin, C.; Girin, T.; Marmagne, A.; Leprince, A.S.; Chaillou, S.; Ferrario-Méry, S.; Meyer, C.; Daniel-Vedele, F. Nitrate transport and signalling in Arabidopsis. J. Exp. Bot. 2014, 65, 789–798. [Google Scholar] [CrossRef]
  10. dos Santos, K.S.; Martins, V.C.; de Oliveira, S.C.F.; Monteiro, G.G.T.N.; Neto, C.F.O.; Souza, J.M.M. Different concentrations of ammonium nitrate (NH4 NO3) affect nitrogen metabolism and the development of Acmella oleracea L. (Asteraceae) grown in vitro. Rev. Multidisc. Nord. Mineiro 2025, 6, 3435. [Google Scholar]
  11. Guan, M.; Pan, X.-C.; Sun, J.-K.; Chen, J.-X.; Kong, D.-L.; Feng, Y.-L. Nitrogen acquisition strategy and its effects on invasiveness of a subtropical invasive plant. Front. Plant Sci. 2023, 14, 1243849. [Google Scholar] [CrossRef]
  12. Lara-Murrieta, P.; Armenta-Ayala, J.O.; González-Balcázar, A.; Pérez-Angulo, C.; Cruz-Bojorquez, J.E.; Angulo-Castro, A. Different nitrate/ammonium relationships and light intensity and their effect on growth and nutritional content of hydroponic lettuce (Lactuca sativa L.). Bioagro 2025, 37, 167–178. [Google Scholar] [CrossRef]
  13. Alvarado-Camarillo, D.; Valdez-Aguilar, L.A.; González-Fuentes, J.A.; Rascón-Alvarado, E.; Peña-Ramos, F.M. Response of hydroponic lettuce to aeration, nitrate and potassium in the nutrient solution. Acta Agric. Scand. Sect. B-Soil Plant Sci. 2020, 70, 341–348. [Google Scholar] [CrossRef]
  14. Coleto, I.; Marín-Peña, A.J.; Urbano-Gámez, J.A.; González-Hernández, A.I.; Weiming, S.; Guangjie, L.; Marino, D. Interaction of ammonium nutrition with essential mineral cations. J. Exp. Bot. 2023, 74, 6131–6144. [Google Scholar] [CrossRef]
  15. Pan, W.L.; Madsen, I.J.; Bolton, R.P.; Graves, L.; Sistrunk, T. Ammonia/ammonium toxicity root symptoms induced by inorganic and organic fertilizers and placement. Soil Fert. Crop Nutr. 2016, 108, 2485–2492. [Google Scholar] [CrossRef]
  16. Rivero-Marcos, M.; Calleja-Satrustegui, A.; Ariz, I. The counteracting role of nitrate during ammonium toxicity in plants. Hort. Plant J. 2026, 12, 49–61. [Google Scholar] [CrossRef]
  17. Esteban, R.; Ariz, I.; Cruz, C.; Moran, J.F. Review: Mechanisms of ammonium toxicity and the quest for tolerance. Plant Sci. 2016, 248, 92–101. [Google Scholar] [CrossRef]
  18. Xie, L.B.; Sun, L.N.; Zhang, Z.W.; Chen, Y.E.; Yuan, M.; Yuan, S. Phenotype assessment and putative mechanisms of ammonium toxicity to plants. Int. J. Mol. Sci. 2025, 26, 2606. [Google Scholar] [CrossRef]
  19. Jamal, A.; Moon, Y.-S.; Abdin, M.Z. Sulphur—A general overview and interaction with nitrogen. Aust. J. Crop Sci. 2010, 4, 523–529. [Google Scholar]
  20. Carciochi, W.D.; Salvagiotti, F.; Pagani, A.; Nahuel, I.; Reussi-Calvo, N.I.; Eyherabide, M.; Sainz-Rozas, H.R.; Ciampitti, I.A. Nitrogen and sulfur interaction on nutrient use efficiencies and diagnostic tools in maize. Eur. J. Agron. 2020, 116, 126045. [Google Scholar] [CrossRef]
  21. Talukdar, L.; Dutta, S.; Dutta, P.; Hussain, J. Nitrogen and Sulphur interaction on nutrient use efficiency in field crops: A review. Pharma Innov. 2022, 11, 1372–1376. [Google Scholar]
  22. Sun, J.; Li, W.; Li, C.; Chang, W.; Zhang, S.; Zeng, Y.; Zeng, C.; Peng, M. Effect of different rates of nitrogen fertilization on crop yield, soil properties and leaf physiological attributes in banana under subtropical regions of China. Front. Plant Sci. 2020, 11, 613760. [Google Scholar] [CrossRef] [PubMed]
  23. Britz, E.; Cyster, L.; Samuels, I.; Cupido, C.; Masemola, L.; Ngcobo, N.; Manganyi, F.; Müller, F. Nitrogen fertilization increases the growth and nutritional quality of the forage legume, Calobota sericea—A preliminary investigation. Heliyon 2023, 9, e13535. [Google Scholar] [CrossRef]
  24. Rietra, R.P.J.J.; Heinen, M.; Dimkpa, C.O.; Bindraban, P.S. Effects of nutrient antagonism and synergism on yield and fertilizer use efficiency. Commun. Soil Sci. Plant Anal. 2017, 48, 1895–1920. [Google Scholar] [CrossRef]
  25. Riedel, W.E. Mineral-nutrient synergism and dilution responses to nitrogen fertilizer in field-grown maize. J. Plant Nutr. Soil Sci. 2010, 173, 869–874. [Google Scholar] [CrossRef]
  26. Kaspari, M.; Welti, E.A.R. Nutrient dilution and the future of herbivore populations. Trends Ecol. Evol. 2024, 39, 809–820. [Google Scholar] [CrossRef] [PubMed]
  27. Souri, M.K.; Rahmani, R.; Ahmadi, M.; Rezainejad, A. Morphophysiological and nutrient uptake characteristics of marigold (Tagetes spp.) under different levels of nitrogen fertilization. Horticult. Int. J. 2018, 2, 64–67. [Google Scholar]
  28. Sumangala, H.P.; Badu, K.R.; Rupa, T.R. Nutrient uptake by African marigold (Tagetes erecta L.) as influenced by fertigation, irrigation and mulching. J. Pharmacogn. Phytochem. 2018, 7, 2005–2009. [Google Scholar]
  29. Zhang, S.; Liu, Y.; Du, M.; Shou, G.; Wang, Z.; Xu, G. Nitrogen as a regulator for flowering time in plant. Plant Soil 2022, 480, 1–29. [Google Scholar] [CrossRef]
  30. Ahmad, I.; Jabeen, N.; Ziaf, K.; Dole, J.M.; Khan, M.A.S.; Bakhtavar, M.A. Macronutrient application affects morphological, physiological, and seed yield attributes of Calendula officinalis L. Can. J. Plant Sci. 2017, 97, 906–916. [Google Scholar]
  31. Steiner, A. The Universal Nutrient Solution. In Proceedings of the 6th International Congress on Soilless Culture, Lunteren, The Netherlands, 29 April–5 May 1984; Volume 29, pp. 633–649. [Google Scholar]
  32. Trejo-Téllez, L.I.; Peralta-Sánchez, M.G.; Gómez-Merino, F.C.; Rodríguez-Mendoza, M.N.; Serrato-Cruz, M.A.; Arévalo-Becerril, A.E. Sodium chloride on dry biomass and macronutrient cations absorption in cempasuchil (Tagetes erecta Linn.). Rev. Mex. Cienc. Agríc. 2013, 4, 979–990. [Google Scholar]
  33. Peralta-Sánchez, M.G.; Gómez-Merino, F.C.; Tejeda-Sartorius, O.; Trejo-Téllez, L.I. Nitrogen nutrition differentially affects concentrations of photosynthetic pigments and antioxidant compounds in Mexican marigold (Tagetes erecta L.). Agriculture 2023, 13, 517. [Google Scholar] [CrossRef]
  34. Alcántar-González, G.; Sandoval-Villa, M. Handbook of Chemical Analyses of Plant Tissues; Mexican Society of Soil Science: Chapingo, México, 1999; p. 156. [Google Scholar]
  35. SAS Institute Inc. SAS/STAT Users Guide, version 9.3; SAS Institute Inc.: Cary, NC, USA, 2011. [Google Scholar]
  36. Guo, J.; Jia, Y.; Chen, H.; Zhang, L.; Yang, J.; Zhang, J.; Hu, X.; Ye, H.; Li, Y.; Zhou, Y. Growth, photosynthesis, and nutrient uptake in wheat are affected by differences in nitrogen levels and forms and potassium supply. Sci. Rep. 2019, 9, 1248. [Google Scholar] [CrossRef] [PubMed]
  37. Wang, Q.; Li, S.; Li, J.; Huang, D. The utilization and roles of nitrogen in plants. Forests 2024, 15, 1191. [Google Scholar] [CrossRef]
  38. Zayed, O.; Hewedyn, O.A.; Abdelmoteleb, A.; Ali, M.; Youssef, M.S.; Roumia, A.F.; Seymour, D.; Yuan, Z.C. Nitrogen journey in plants: From uptake to metabolism, stress response, and microbe interaction. Biomolecules 2023, 13, 1443. [Google Scholar] [CrossRef]
  39. Cheng, J.; Yu, S. Nitrogen allocation among leaves and roots mediates the interaction between plant life history trade-off and density dependence. Front. Plant Sci. 2025, 16, 1549801. [Google Scholar] [CrossRef]
  40. Bloom, A.J.; Chapin, F.S., III; Mooney, H.A. Resource limitation in plants-an economic analogy. Ann. Rev. Ecol. Syst. 1985, 16, 363–392. [Google Scholar] [CrossRef]
  41. Ericsson, T. Growth and shoot: Root ratio of seedlings in relation to nutrient availability. Plant Soil. 1995, 168, 205–214. [Google Scholar] [CrossRef]
  42. Hermans, C.; Hammond, J.P.; White, P.J.; Verbruggen, N. How do plants respond to nutrient shortage by biomass allocation? Trends Plant Sci. 2006, 11, 610–617. [Google Scholar] [CrossRef] [PubMed]
  43. Poorter, H.; Nagel, O. The role of biomass allocation in the growth response of plants to different levels of light, CO2, nutrients and water: A quantitative review. Aust. J. Plant Physiol. 2000, 6, 595–607. [Google Scholar] [CrossRef]
  44. Poorter, H.; Niklas, K.J.; Reich, P.B.; Oleksyn, J.; Poot, P.; Mommer, L. Biomass allocation to leaves, stems and roots meta-analyses of interspecific variation and environmental control. New Phytol. 2012, 193, 30–50. [Google Scholar] [CrossRef]
  45. Reekie, E.G.; Bazzaz, F.A. Reproductive effort in plants. Carbon Allocation to reproduction. Amer. Nat. 1987, 129, 876–896. [Google Scholar] [CrossRef]
  46. Evans, J.R.; Clarke, V.C. The nitrogen cost of photosynthesis. J. Exp. Bot. 2019, 70, 7–15. [Google Scholar] [CrossRef]
  47. Gu, J.; Li, Z.; Mao, Y.; Struik, P.C.; Zhang, H.; Liu, L.; Wang, Z.; Yang, J. Roles of nitrogen and cytokinin signals in root and shoot communications in maximizing of plant productivity and their agronomic applications. Plant Sci. 2018, 274, 320–331. [Google Scholar] [CrossRef] [PubMed]
  48. Asad, M.A.U.; Guan, X.; Zhou, L.; Qian, Z.; Yan, Z.; Cheng, F. Involvement of plant signaling network and cell metabolic homeostasis in nitrogen deficiency-induced early leaf senescence. Plant Sci. 2023, 336, 111855. [Google Scholar] [CrossRef] [PubMed]
  49. Schjoerring, J.K.; Bock, J.G.H.; Gammelvind, L.; Jensen, C.R.; Mogensen, V.O. Nitrogen incorporation and remobilization of different shoot components of field-grown winter oilseed rape (Brassica napus L.) as affected by rate of nitrogen application and irrigation. Plant Soil 1995, 177, 255–264. [Google Scholar] [CrossRef]
  50. Malagoli, P. Dynamics of nitrogen uptake and mobilization in field-grown winter oilseed rape (Brassica napus) from stem extension to harvest: I. Global N flows between vegetative and reproductive tissues in relation to leaf fall and their residual N. Ann. Bot. 2005, 95, 853–861. [Google Scholar] [CrossRef]
  51. Maistry, P.M.; Muasya, A.M.; Valentine, A.J.; Chimphango, S.B.M. Increasing nitrogen supply stimulates phosphorus acquisition mechanisms in the fynbos species Aspalathus linearis. Funct. Plant Biol. 2015, 42, 52–60. [Google Scholar] [CrossRef]
  52. Raghothama, K.G. Phosphate acquisition. Annu. Rev. Plant Physiol. Plant Mol. Biol. 1999, 50, 665–693. [Google Scholar] [CrossRef]
  53. Poirier, Y.; Jaskolowski, A.; Clúa, J. Phosphate acquisition and metabolism in plants. Curr. Biol. 2022, 32, 623–629. [Google Scholar] [CrossRef] [PubMed]
  54. Yang, S.-Y.; Lin, W.-Y.; Hsiao, Y.-M.; Chiou, T.-J. Milestones in understanding transport, sensing, and signaling of the plant nutrient phosphorus. Plant Cell 2024, 36, 1504–1523. [Google Scholar] [CrossRef]
  55. Coskun, D.; Britto, D.T.; Kronzucker, H.J. The nitrogen-potassium intersection: Membranes, metabolism, and mechanism. Plant Cell Environ. 2017, 40, 2029–2041. [Google Scholar] [CrossRef]
  56. Roelfsema, M.R.; Hedrich, R. In the light of stomatal opening: New insights into ‘The watergate’. New Phytol. 2005, 167, 665–691. [Google Scholar] [CrossRef] [PubMed]
  57. Zörb, C.; Senbayram, M.; Peiter, E. Potassium in agriculture—Status and perspectives. J. Plant Physiol. 2014, 171, 656–669. [Google Scholar] [CrossRef]
  58. Fageria, V.D. Nutrient interactions in crop plants. J. Plant Nutr. 2001, 24, 1269–1290. [Google Scholar] [CrossRef]
  59. Kawasaki, T. Metabolism and physiology of calcium and magnesium. In Science of the Rice Plant; Matsuo, T., Kumazawa, K., Ishii, R., Ishihara, K., Hirata, H., Eds.; Food and Agricultural Policy Research Center: Tokyo, Japan, 1995; pp. 412–419. [Google Scholar]
  60. Riveras, E.; Alvarez, J.M.; Vidal, E.A.; Oses, C.; Vega, A.; Gutiérrez, R.A. The calcium ion is a second messenger in the nitrate signaling pathway of Arabidopsis. Plant Physiol. 2015, 169, 1397–1404. [Google Scholar] [CrossRef]
  61. Liu, K.-H.; Niu, Y.; Konishi, M.; Wu, Y.; Du, H.; Sun Chung, H.; Li, L.; Boudsocq, M.; McCormack, M.; Maekawa, S.; et al. Discovery of nitrate–CPK–NLP signalling in central nutrient–growth networks. Nature 2017, 545, 311–316. [Google Scholar] [CrossRef] [PubMed]
  62. Xing, Y.; Zhu, Z.-L.; Wang, F.; Zhang, X.; Li, B.-Y.; Liu, Z.-X.; Wu, X.-X.; Ge, S.-F.; Jiang, Y.-M. Role of calcium as a possible regulator of growth and nitrate nitrogen metabolism in apple dwarf rootstock seedlings. Sci. Hortic. 2021, 276, 109740. [Google Scholar] [CrossRef]
  63. Wu, C.; Xia, N.; Wang, W. Exogenous calcium on calcium accumulation, uptake and utilization in tomato. Horticulturae 2025, 11, 986. [Google Scholar] [CrossRef]
  64. Cakmak, I.; Yazici, A.M. Magnesium: A forgotten element in crop production. Better Crops 2010, 94, 23–25. [Google Scholar]
  65. Verbruggen, N.; Hermans, C. Physiological and molecular responses to magnesium nutritional imbalance in plants. Plant Soil 2013, 368, 87–99. [Google Scholar] [CrossRef]
  66. Gerendás, J.; Führs, H. The significance of magnesium for crop quality. Plant Soil 2013, 368, 101–128. [Google Scholar] [CrossRef]
  67. Kopriva, S.; Rennenberg, H. Control of sulphate assimilation and glutathione synthesis: Interaction with N and C metabolism. J. Exp. Bot. 2004, 55, 1831–1842. [Google Scholar] [CrossRef] [PubMed]
  68. Jobe, T.O.; Zenzen, I.; Karvansara, P.R.; Kopriva, S. Integration of sulfate assimilation with carbon and nitrogen metabolism in transition from C3 to C4 photosynthesis. J. Exp. Bot. 2019, 70, 4211–4221. [Google Scholar] [CrossRef] [PubMed]
  69. Liu, S.; Cui, S.; Zhang, X.; Wang, Y.; Mi, G.; Gao, Q. Synergistic regulation of nitrogen and sulfur on redox balance of maize leaves and amino acids balance of grains. Front. Plant Sci. 2020, 4, 576718. [Google Scholar] [CrossRef] [PubMed]
Figure 1. Dry biomass (g plant−1) in leaves, flowers, stems, and roots (A), and dry biomass partitioning (%) among plant organs (B) of Mexican marigold (Tagetes erecta L.) plants treated with different nitrogen concentrations in the nutrient solution during the flowering stage. Means ± SD followed by different letters within each organ indicate statistically significant differences among nitrogen treatments (Tukey, p ≤ 0.05).
Nitrogen 07 00026 g001
Figure 2. Nitrogen concentration (g kg−1 dry matter) in leaves (A), flowers (C), stems (E), and roots (G), and nitrogen accumulation (mg) in leaves (B), flowers (D), stems (F), and roots (H) of Mexican marigold (Tagetes erecta L.) plants treated with different nitrogen concentrations in the nutrient solution during the flowering stage. Means ± SD followed by different letters within each subfigure indicate statistically significant differences (Tukey, p ≤ 0.05).
Nitrogen 07 00026 g002
Figure 3. Phosphorus concentration (g kg−1 dry matter) in leaves (A), flowers (C), stems (E), and roots (G), and phosphorus accumulation (mg) in leaves (B), flowers (D), stems (F), and roots (H) of Mexican marigold (Tagetes erecta L.) plants treated with different nitrogen concentrations in the nutrient solution during the flowering stage. Means ± SD followed by different letters within each subfigure indicate statistically significant differences (Tukey, p ≤ 0.05).
Nitrogen 07 00026 g003
Figure 4. Potassium concentration (g kg−1 dry matter) in leaves (A), flowers (C), stems (E), and roots (G), and potassium accumulation (mg) in leaves (B), flowers (D), stems (F), and roots (H) of Mexican marigold (Tagetes erecta L.) plants treated with different nitrogen concentrations in the nutrient solution during the flowering stage. Means ± SD followed by different letters within each subfigure indicate statistically significant differences (Tukey, p ≤ 0.05).
Nitrogen 07 00026 g004
Figure 5. Calcium concentration (g kg−1 dry matter) in leaves (A), flowers (C), stems (E), and roots (G), and calcium accumulation (mg) in leaves (B), flowers (D), stems (F), and roots (H) of Mexican marigold (Tagetes erecta L.) plants treated with different nitrogen concentrations in the nutrient solution during the flowering stage. Means ± SD followed by different letters within each subfigure indicate statistically significant differences (Tukey, p ≤ 0.05).
Nitrogen 07 00026 g005
Figure 6. Magnesium concentration (g kg−1 dry matter) in leaves (A), flowers (C), stems (E), and roots (G), and magnesium accumulation (mg) in leaves (B), flowers (D), stems (F), and roots (H) of Mexican marigold (Tagetes erecta L.) plants treated with different nitrogen concentrations in the nutrient solution during the flowering stage. Means ± SD followed by different letters within each subfigure indicate statistically significant differences (Tukey, p ≤ 0.05).
Nitrogen 07 00026 g006
Figure 7. Sulfur concentration (g kg−1 dry matter) in leaves (A), flowers (C), stems (E), and roots (G), and sulfur accumulation (mg) in leaves (B), flowers (D), stems (F), and roots (H) of Mexican marigold (Tagetes erecta L.) plants treated with different nitrogen concentrations in the nutrient solution during the flowering stage. Means ± SD followed by different letters within each subfigure indicate statistically significant differences (Tukey, p ≤ 0.05).
Nitrogen 07 00026 g007
Disclaimer/Publisher’s Note: The statements, opinions and data contained in all publications are solely those of the individual author(s) and contributor(s) and not of MDPI and/or the editor(s). MDPI and/or the editor(s) disclaim responsibility for any injury to people or property resulting from any ideas, methods, instructions or products referred to in the content.