Article

Vertical Patterns and Influencing Factors of Soil Stoichiometry on Near-Naturally Restored Lands: A Case Study from the Loess Plateau, China


1
College of Resources and Environment, Shanxi Agricultural University, Taigu 030801, China
2
School of Land Science and Technology, China University of Geosciences Beijing, Beijing 100083, China
3
Key Laboratory of Land Consolidation and Rehabilitation, Ministry of Natural Resources, Beijing 100035, China
4
Technology Innovation Center for Ecological Restoration in Mining Areas, Ministry of Natural Resources, Beijing 100083, China
5
State Key Laboratory of Efficient Utilization of Agricultural Water Resources, College of Land Science and Technology, China Agricultural University, Beijing 100193, China
*
Author to whom correspondence should be addressed.
Nitrogen 2026, 7(1), 25; https://doi.org/10.3390/nitrogen7010025
Submission received: 31 December 2025 / Revised: 19 February 2026 / Accepted: 21 February 2026 / Published: 26 February 2026

Abstract

China has implemented extensive land restoration programs and now leads the world in artificial forest area. However, such plantations often face degradation, largely due to soil nutrient deficiency. In contrast, near-natural restoration tends to result in better soil quality, ecosystem integrity, and stability. This study focuses on three near-naturally restored sites on the Loess Plateau—a critical part of China’s National Ecological Security Barrier System, which has undergone substantial ecological restoration in recent decades. Using soil stoichiometry to assess nutrient balance and land sustainability, we investigated two forest types (Betula platyphylla, BP; Larix principis-rupprechtii, LP) and a mixed shrubland (Ostryopsis davidiana and Cotoneaster multiflorus, OD–CM). Soil profiles were sampled at 20 cm intervals from the surface to bedrock. We measured soil carbon (C), nitrogen (N), and phosphorus (P) contents, along with key environmental factors. The results show the following: (1) The two forest lands exhibited similar C and N levels, which were 1.23–1.26 and 1.40–1.51 times higher, respectively, than those in the shrubland. (2) Lower C/N (BP: 25.05; LP: 23.46) and higher N/P (BP: 4.83; LP: 5.00) in the forest lands indicated lower nitrogen limitation versus the shrubland (C/N: 28.55; N/P: 3.44). (3) Key influencing factors varied across land restoration types, indicating that the vegetation community’s composition mediates nutrient cycling through nutrient uptake and litter input. (4) Relative to plantations in the same region, near-naturally restored lands had 3.47–5.64 times higher C content and 1.51–2.51 times higher N content. Moreover, near-natural communities exhibited higher C/N (21.68–30.56) and C/P (85.92–132.97) compared to plantations (C/N: 8.8–13.1; C/P: 9.16–31.2), reflecting more efficient nitrogen and phosphorus utilization. Thus, near-natural land restoration enhances soil carbon sequestration, nitrogen fixation, and nutrient use efficiency on the Loess Plateau, supporting its promotion as a superior land management strategy for enhancing land sustainability and ecosystem services in this area.

1. Introduction

China’s 14th Five-Year Plan for National Economic and Social Development emphasizes enhancing ecosystem quality and stability to advance green development and promote harmonious coexistence between humans and nature. A key measure in this effort is the implementation of major projects for the protection and restoration of critical ecosystems. According to China’s 2023 National Land Change Survey Data, China had established 9.24 × 10⁵ km2 artificial forests by 2023, ranking first globally [1]. However, artificial forest lands commonly face degradation issues such as tree dieback, low growth rates, and high mortality [2,3], with soil nutrient deficiency being a major cause [4].
As a fundamental component of ecosystems, soil supplies water and essential nutrients for plant growth [5]. Soil nutrient content and elemental stoichiometry regulate plant growth [5], community succession [6], and ecosystem structure and function [7,8,9]. Soil stoichiometry thus serves as an indicator of regional soil nutrient balance [7,8,9,10], land ecosystem stability [11], and ecosystem nutrient limitations [7,10] (Table A1). The soil carbon (C)-to-nitrogen (N) ratio (C/N) is inversely related to microbial activity [12], reflecting net accumulation versus mineralization of soil organic matter, and it can help predict nitrate leaching risk [13]. The carbon (C)-to-phosphorus (P) ratio (C/P) indicates net mobilization or immobilization of P by microbial biomass and thus influences plant P availability [14,15,16,17]. The nitrogen-to-phosphorus ratio (N/P) serves as a critical determinant of soil nutrient limitation types—identifying whether N, P, or both limit plant growth—and further influences photosynthetic product allocation, metabolic rates, and community composition and succession [12,18,19].
Beyond their diagnostic value, soil C–N–P ratios provide an integrative, process-based constraint on soil functioning because they link organic matter quality with nutrient availability and the elemental demands of microbes and plants. When the resource C:N:P ratio deviates from microbial biomass requirements, microorganisms adjust nutrient-acquisition strategies and extracellular enzyme investment toward the limiting element, thereby regulating decomposition rates and the balance between nutrient mineralization and immobilization [20,21,22,23]. Stoichiometric regulation of microbial processing is central to soil carbon sequestration because microbial growth and turnover generate necromass that can become a major precursor of persistent soil organic matter when stabilized by mineral associations [24,25]. Consequently, shifts in C:N:P ratios can determine whether fresh plant inputs promote net carbon persistence or accelerate turnover across soil horizons [24]. Integrating plant inputs, microbial transformations, and mineral protection within a stoichiometric framework therefore helps explain variations in fertility, nutrient losses, and long-term carbon stability [25,26].
Near-natural restoration is an approach employing artificial planting techniques to establish forests that resemble regional natural forests in terms of species composition and community structure [27,28]. Compared with common tree plantations, near-natural ecosystems exhibit higher soil quality [29], greater ecosystem quality and stability [27,30], and enhanced ecosystem services [31,32]. As such, near-natural restoration is considered the highest standard in ecological restoration [33].
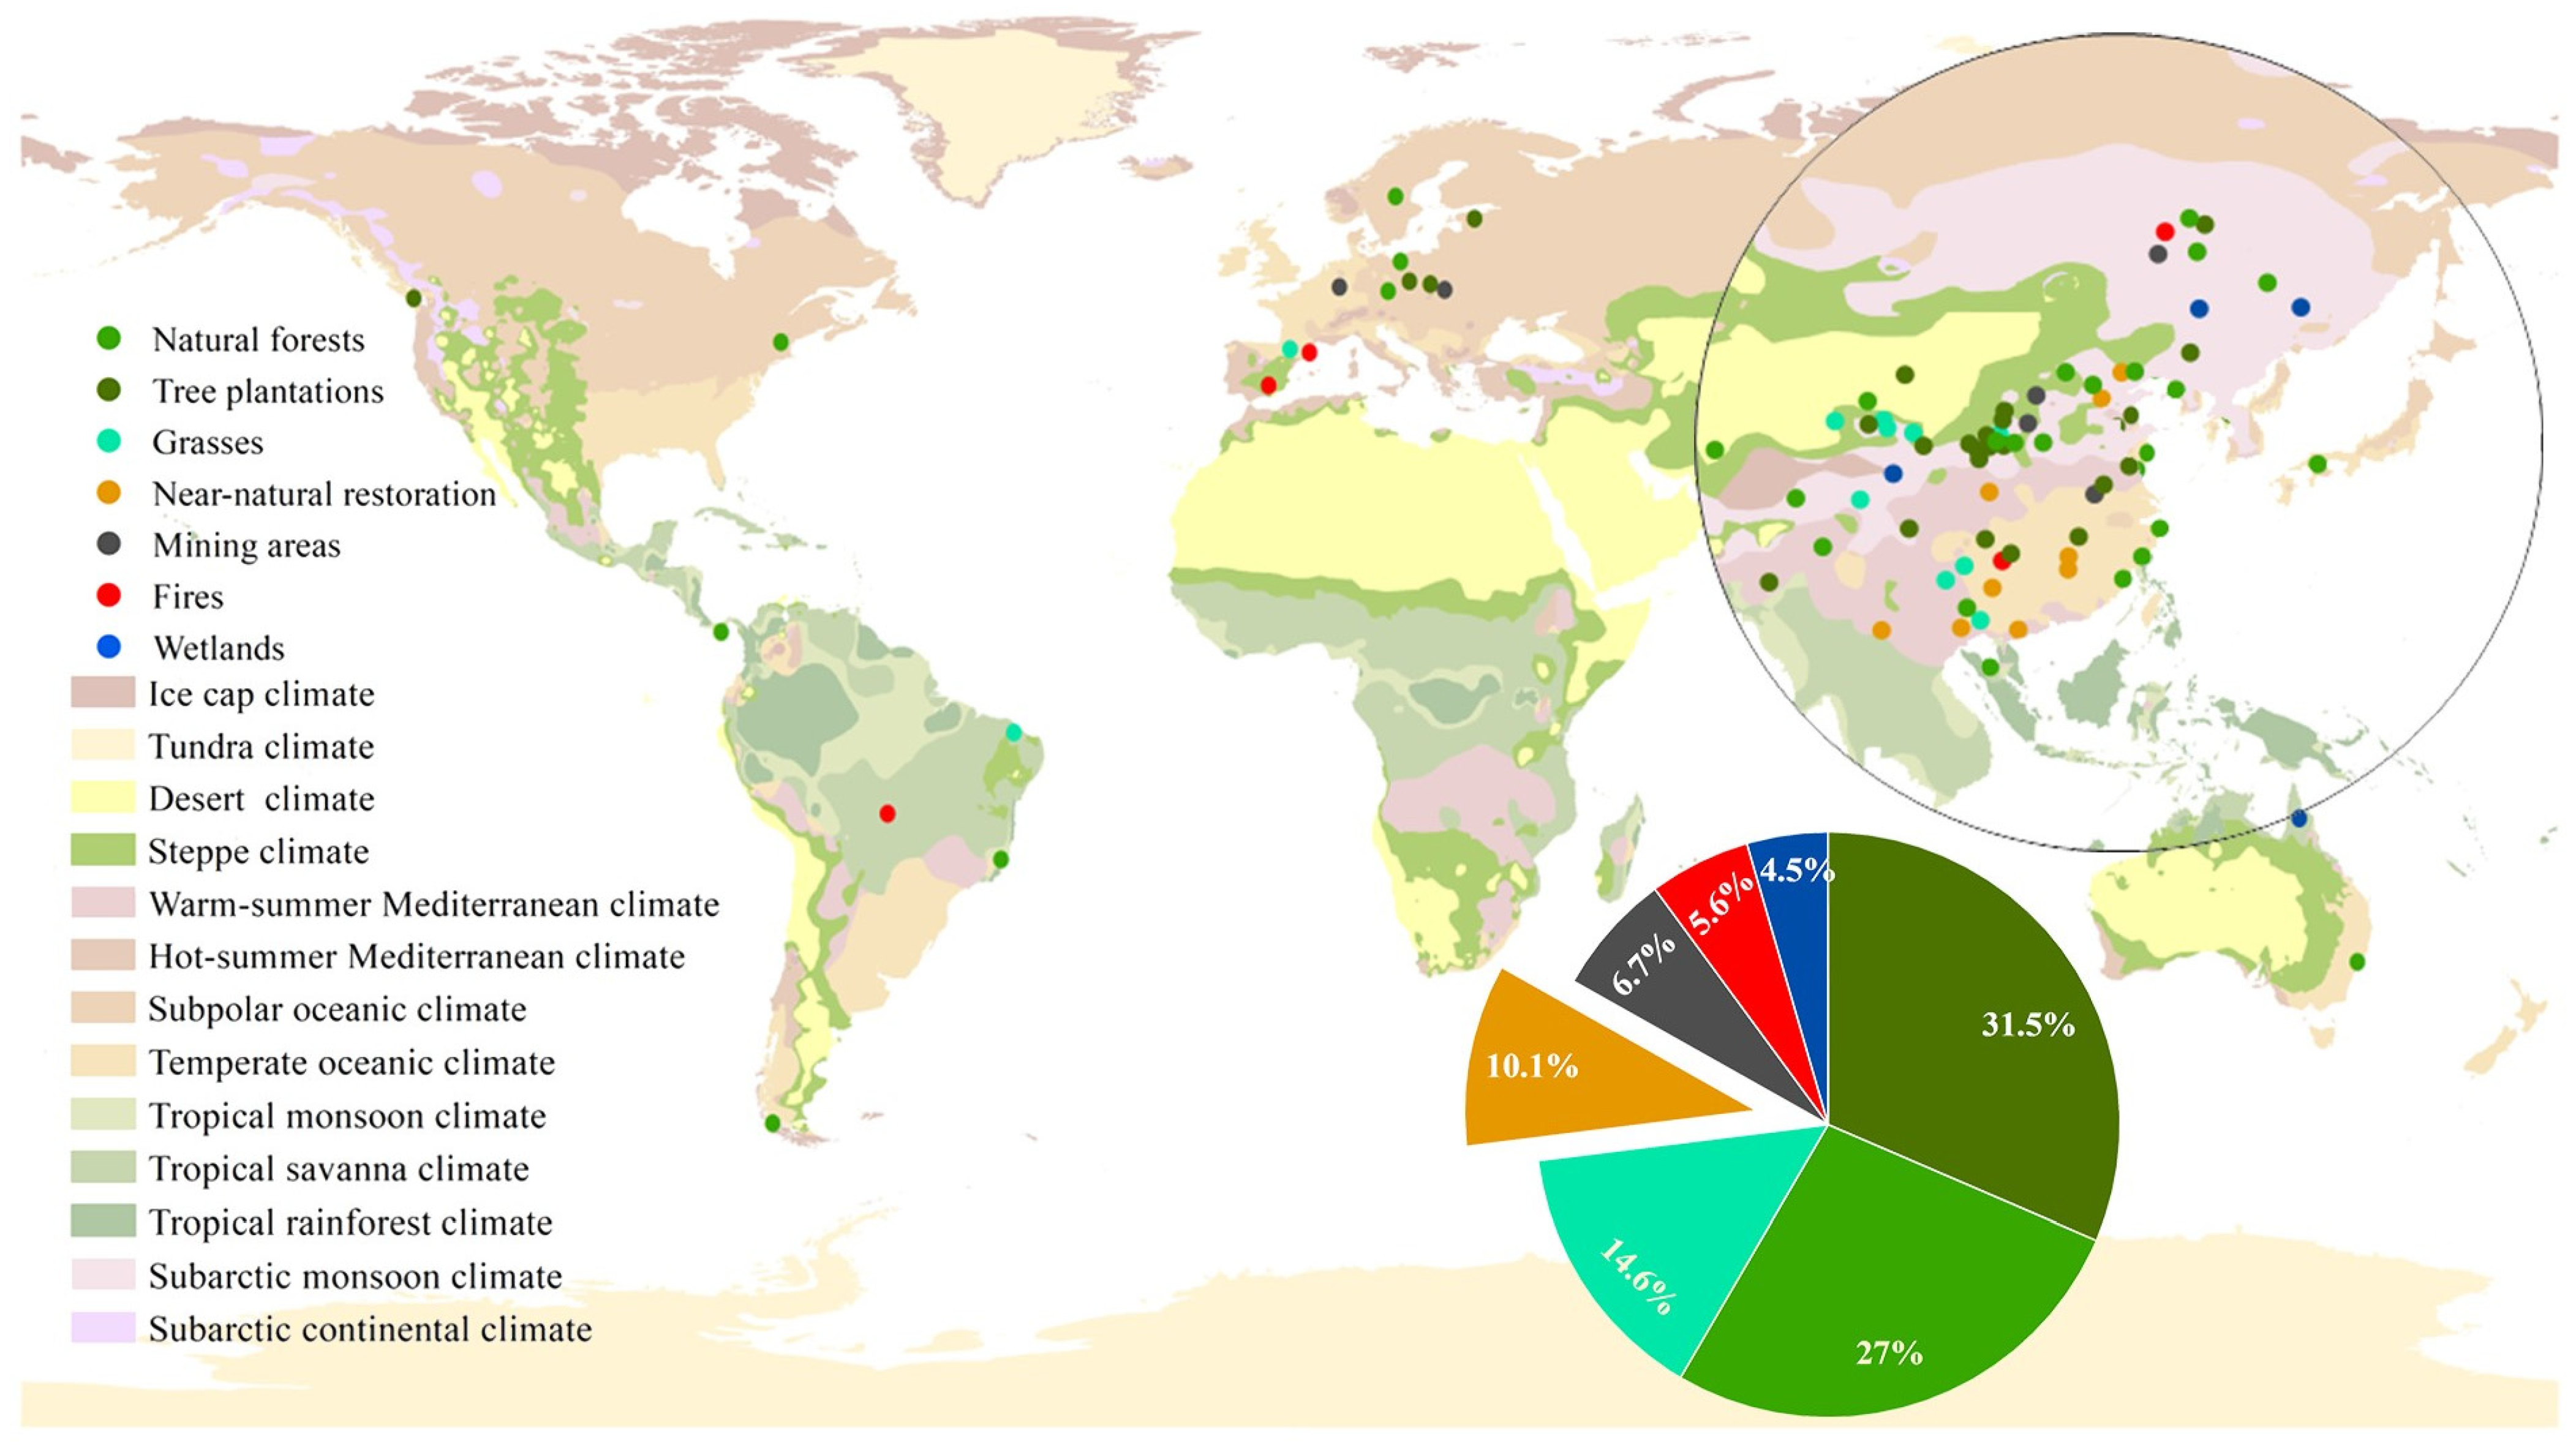
Currently, soil stoichiometry studies have been carried out in land restoration areas across various bioclimatic zones. Our incomplete statistics show that over the past five years, most related studies have been conducted in China and Europe, with sporadic distributions in America and Australia (Figure A1). The majority focused on three ecosystem types: tree plantations (28 articles), natural forests (24 articles), and grassland (13 articles) (Figure A1, Table S1). However, near-naturally restored lands have received far less attention (only nine articles). Tree plantations and natural forests accounted for 58.5%, and near-natural restoration only accounted for 10.1%. This disparity is especially pronounced on China’s Loess Plateau: Although numerous studies on soil stoichiometry have been conducted on other ecosystems, near-natural restoration areas have received minimal attention, with only one relevant study published in the last five years (Figure A1). Given the aforementioned advantages of near-natural land ecosystems in soil quality and ecosystem stability, understanding their soil stoichiometric characteristics could provide valuable reference for diagnosing nutrient limitations in degraded artificial forest lands.
In China’s “Three Zones and Four Corridors” National Ecological Security Barrier System, the Loess Plateau serves as an essential ecological barrier in one of the three ecological security zones. Over recent decades, large-scale land restoration programs have been implemented on China’s Loess Plateau, such as the Three North Shelter Forest Program, the “Grain for Green” Project, and the Shan Shui Initiative. However, similarly to other regions, extensive artificial forest lands in this area are experiencing degradation due to imbalanced plant–soil nutrient relationships [9]. In this study, soil stoichiometry and its influencing factors on three near-naturally restored lands in a loess hilly region were examined and further compared with published data of two artificial forest lands (including a TNSFP (Three-North Shelterbelt Forest Program) stand) in the same region, aiming to provide a scientific basis for strategy formulation and technique optimization of land restoration. The specific objectives of the study are as follows: (1) to reveal the vertical differentiation characteristics of C, N and P contents in three near-natural ecological restoration types; (2) to reveal the vertical differentiation characteristics of C/N, C/P and N/P in three near-natural ecological restoration types; (3) to explore influencing factors of soil stoichiometry in three near-natural ecological restoration types.

2. Materials and Methods

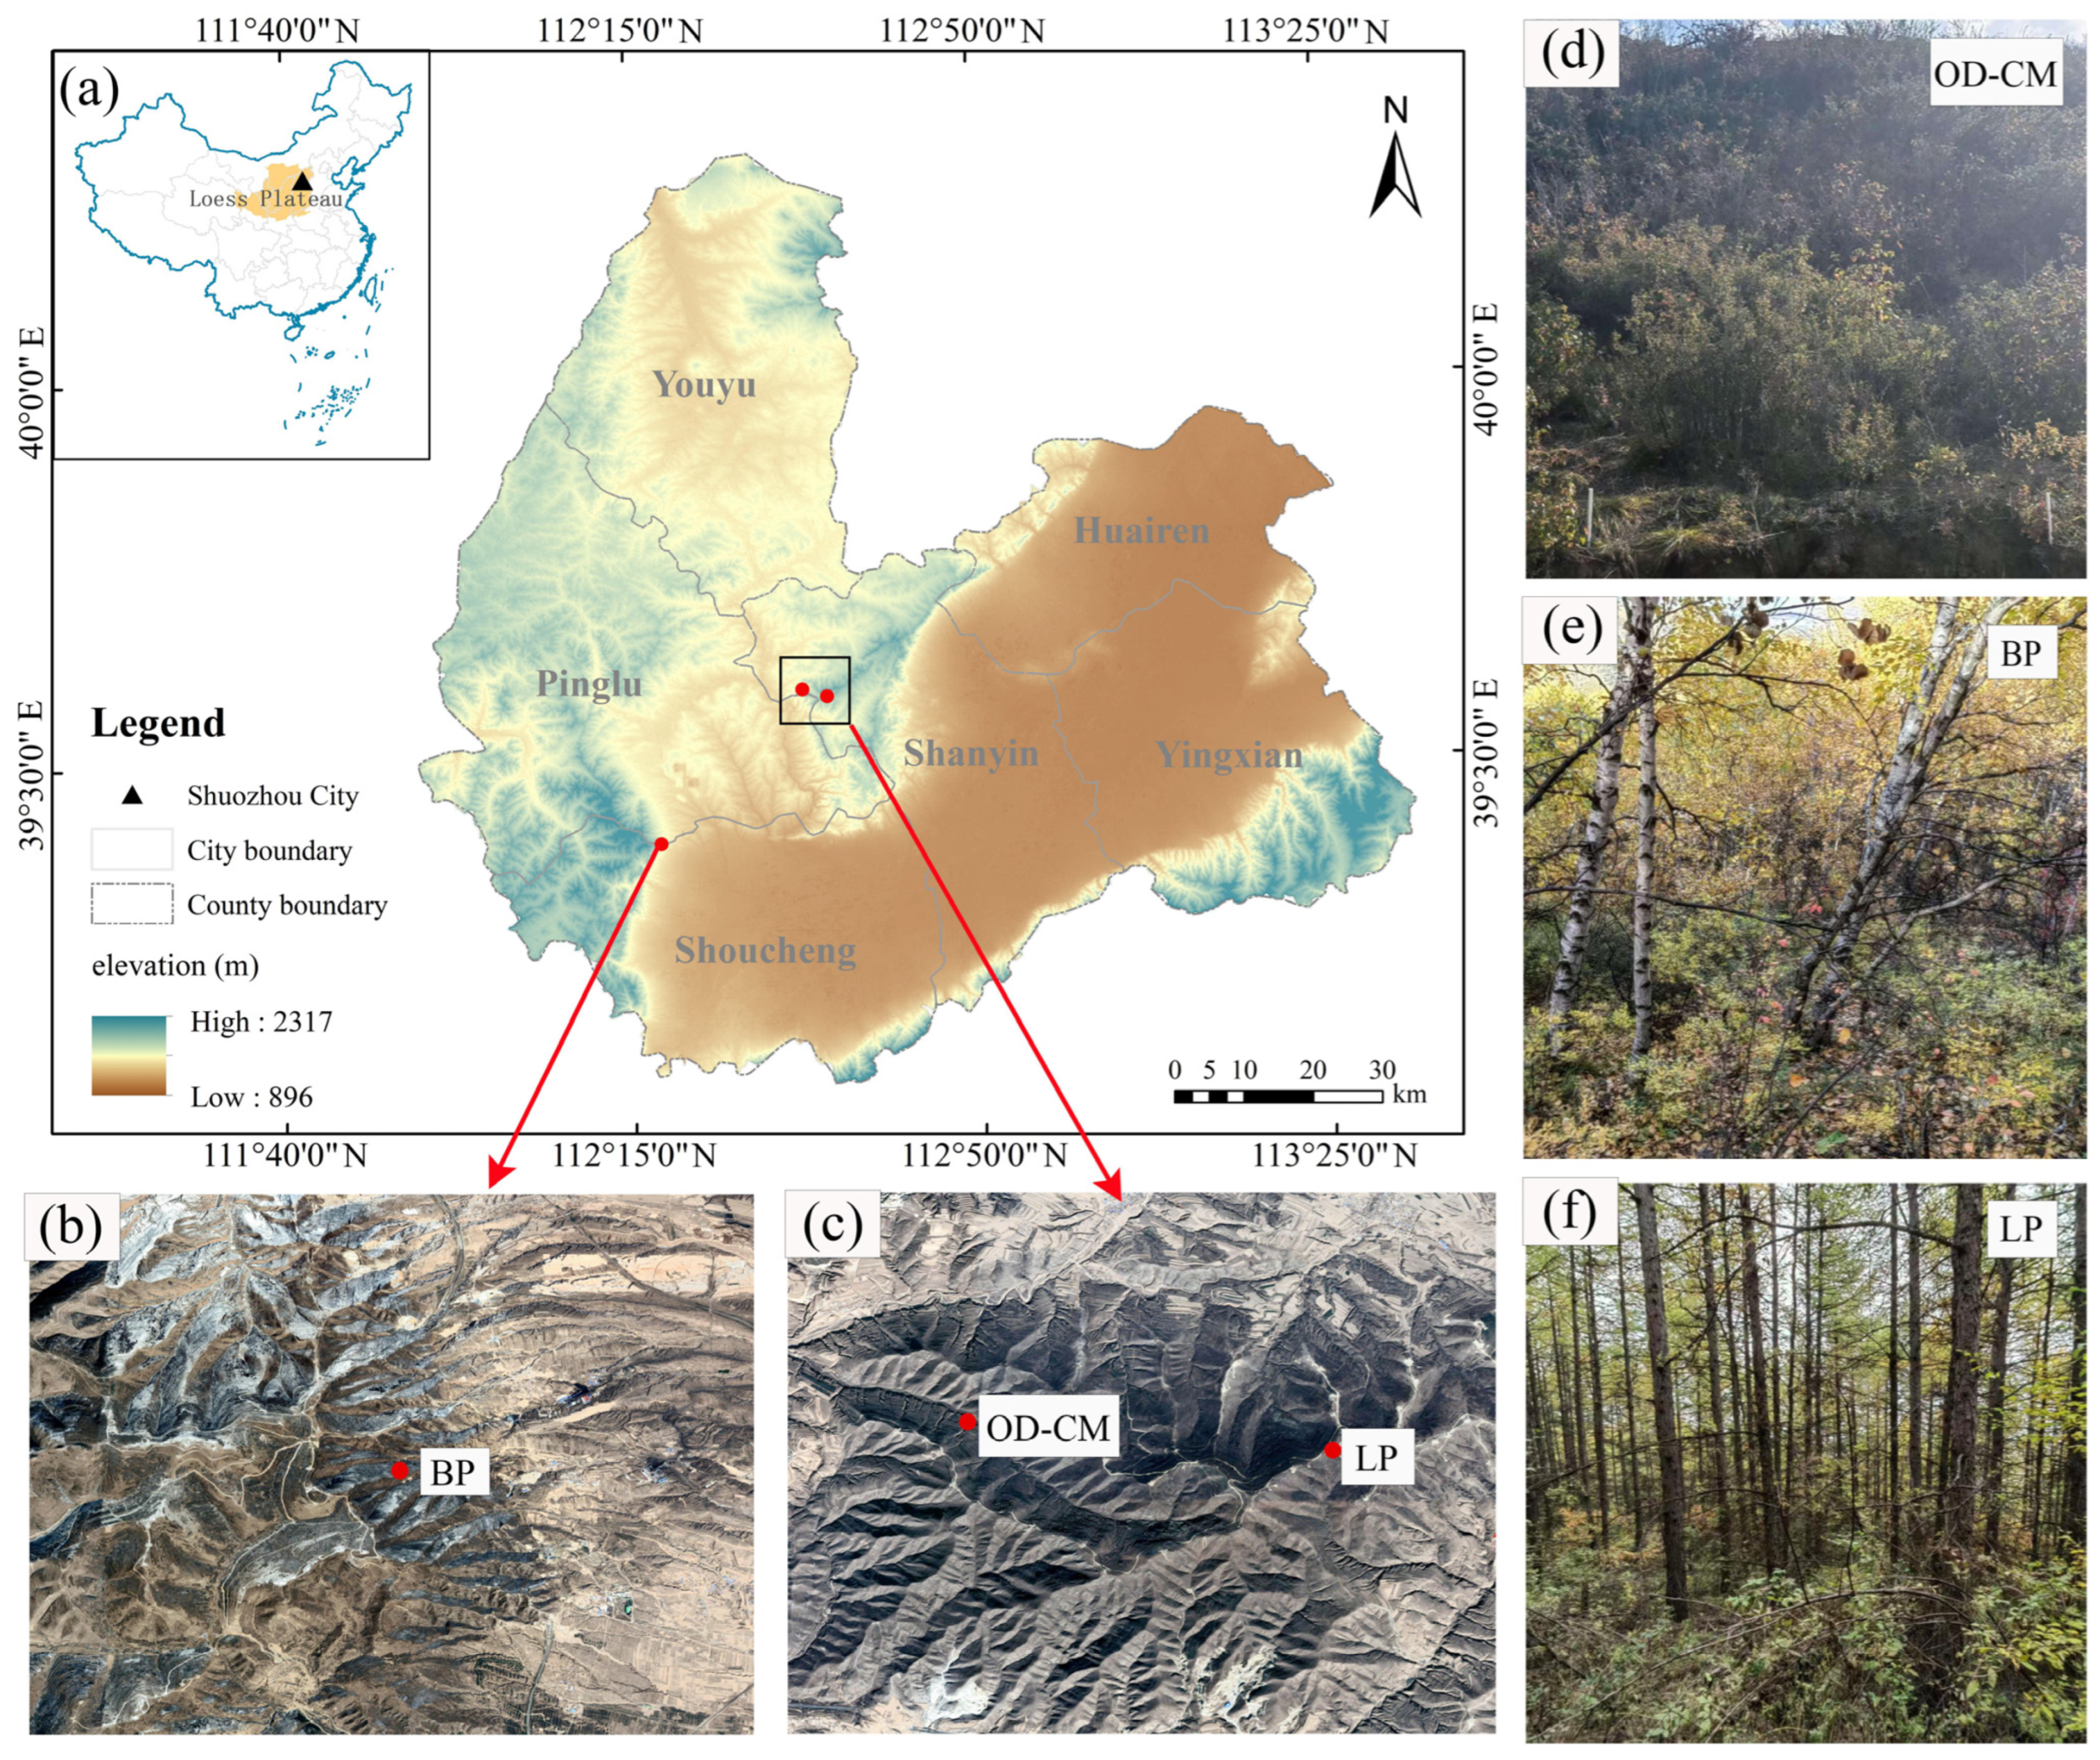
2.1. Study Area

Our study was conducted in Shuozhou City, Shanxi Province (39°19′50.8″ N, 112°25′24.8″ E; Figure 1a). This area lies within a typical agro-pastoral ecotone, with an average altitude exceeding 1000 m. The region features a loess hilly landscape, flanked by Guancen Mountain to the west and Hongtao Mountain to the east. It belongs to both the Haihe River and the Yellow River basins. Characterized by a temperate continental monsoon climate, the area experiences four distinct seasons. The mean annual precipitation is approximately 420 mm, increasing from the northwest to the southeast. The mean annual temperature ranges from 3.6 °C to 7.3 °C, with annual sunshine duration between 2600 and 3100 h. The average wind speed is 2.5–4.2 m/s, reaching a maximum of 20 m/s. The major soil type is Kastanozems according to the World Reference Base for Soil Resources [34]. As a typical mining city and a key component of the national coal production base in northern Shanxi, Shuozhou has suffered from substantial land degradation due to mining activities. Consequently, land restoration is crucial for reconciling the mining industry with sustainable development.

2.2. Field Survey and Sampling

Field surveys and sampling were carried out during the growing season of 2023 (June to September). Three typical near-natural restoration types were selected: a mixed shrub community of Ostryopsis davidiana and Cotoneaster multiflorus (OD-CM), a Betula platyphylla community (BP), and a Larix principis-rupprechtii community (LP) (Figure 1b–f). For each restoration type, three 25 m × 25 m quadrats were established. Every quadrat was positioned more than 10 m from the forest edge to minimize edge effects. Five soil profiles were excavated at the four corners and the center of each quadrat. Soil samples were collected at 20 cm intervals from the surface down to bedrock. For each layer, two kinds of soil samples were collected: undisturbed soil samples were obtained using ring knives, and disturbed soil samples were collected with a shovel. Additionally, altitude (Alt), slope, slope aspect, and soil thickness were recorded for each quadrat (Table 1).

2.3. Laboratory Analysis

Undisturbed soil samples were oven-dried at 105 °C for 24 h to determine soil bulk density (SBD) and soil water content (SWC). Disturbed soil samples were air-dried and then disaggregated with a rubber hammer. Then, they were passed through a 2 mm sieve to remove visible roots, rocks, and plant debris. A portion of each soil sample was further sieved through a 0.149 mm sieve. These processed soils were used for analyzing soil chemical characterization. Soil organic carbon (C) content was measured using the H2SO4-K2Cr2O7 oxidation method [35]. Total nitrogen (N) content was determined by the micro-Kjeldahl method, and total phosphorus (P) was analyzed using spectrophotometry [36]. Available nitrogen (AN) was measured by the alkaline diffusion method, and available phosphorus (AP) was determined colorimetrically. Available potassium (AK) was extracted with 1 mol/L NH4OAc and quantified by flame spectrometry [37]. Soil pH was measured in a 1:2.5 soil–water suspension. The soils in the study area are developed primarily from loess parent material, and field observations confirmed that gravel content in the soil profiles is extremely low (near zero). Therefore, the gravel fraction was not considered in the relevant calculations.

2.4. Statistical Analysis

Soil stoichiometric ratios (C/N, C/P, and N/P) were calculated on a molar basis. Statistical significance was assessed using one-way analysis of variance (ANOVA), followed by post hoc analyses including Dunnett’s test, the least significant difference (LSD) procedure, Duncan’s multiple range test, and contrast analyses, with the significance level set at p < 0.05. Prior to ANOVA, the normality assumption was evaluated using the Shapiro–Wilk test. When variables did not conform to a normal distribution, appropriate data transformations (natural logarithmic, square root, or derivative transformations) were applied to improve normality before analysis. Independence of observations was ensured through the experimental design. All dependent variables analyzed were continuous, and comparisons were conducted among two or more categorical independent groups. Two-way ANOVA was applied to assess the effects of restoration type (R), soil depth (D), and their interaction on stoichiometric variables. Pearson correlation analysis was conducted to examine relationships between soil stoichiometric indicators and environmental factors. Redundancy analysis (RDA) was performed to identify key factors influencing soil stoichiometry under each restoration type. All statistical tests and correlation analyses were conducted using SPSS 22.0, and figures were generated using Origin 2024.

3. Results

3.1. Vertical Differentiation of Soil C, N, and P Contents Under Different Restoration Types

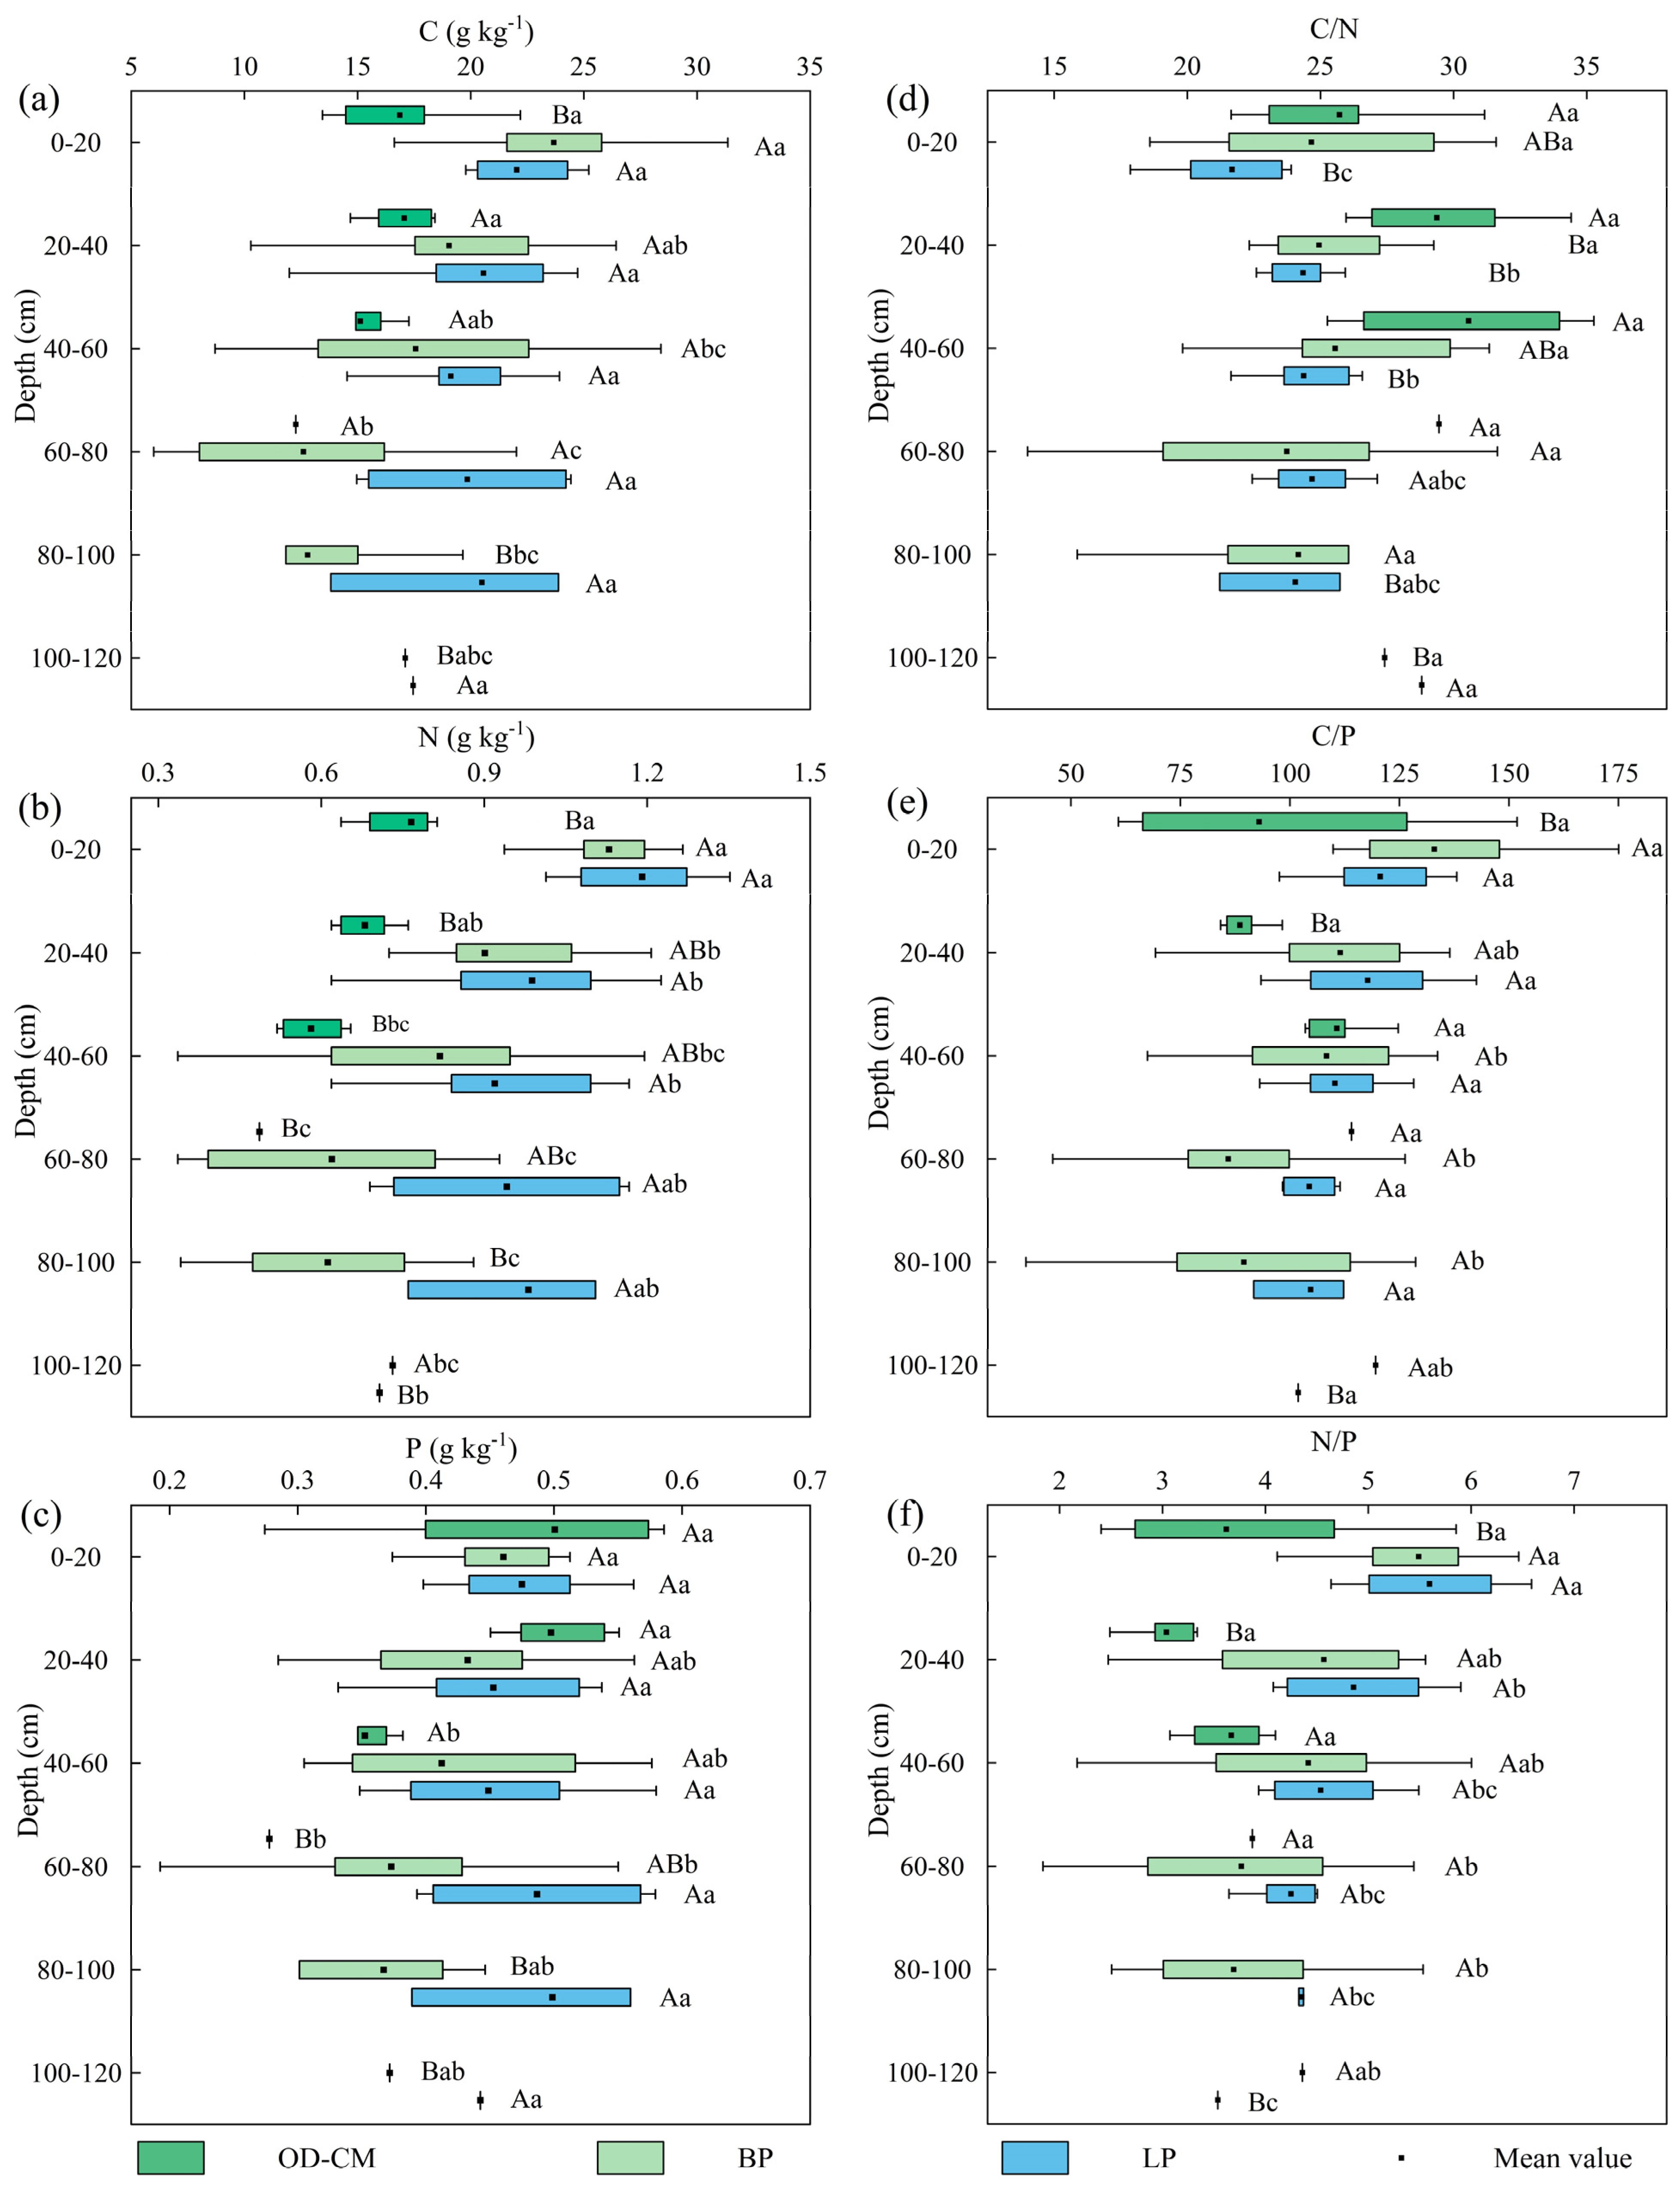
Soil C content decreased with increasing depth across all land restoration types (Figure 2a). Both BP and LP exhibited higher C content in each soil layer compared to OD-CM, particularly in the top layer (0–20 cm), where BP (23.67 g kg−1) and LP (22.03 g kg−1) significantly exceeded OD-CM (16.87 g kg−1) (p < 0.05). BP had the highest surface C content among the three restoration types; however, its C content decreased with depth. In the 40–100 cm layer, the C content of BP (12.61–17.57 g kg−1) was consistently lower than that of LP (19.12–20.49 g kg−1).
Similarly to C, the N content also decreased with soil depth under all restoration types (Figure 2b). In the top layer, N content followed the following order: LP (1.19 g kg−1) > BP (1.16 g kg−1) > OD-CM (0.77 g kg−1). BP and LP had significantly higher N content than OD-CM in all soil layers (p < 0.05). Among the restoration types, LP maintained the highest N content throughout the soil profile, including the middle and lower layers (20–100 cm), with values ranging from 0.92 to 0.99 g kg−1. BP ranked second in N content, but as its N content declined more sharply with depth, the difference between LP and BP increased from 5.31% in the 0–20 cm layer to 60.66% in the 80–100 cm layer.
In contrast to C and N, the decline in P content with soil depth was less pronounced (Figure 2c). Unlike the ranking observed for C and N, OD-CM showed higher P content in the 0–40 cm layer (0.50 g kg−1) compared to BP (0.46–0.47 g kg−1) and LP (0.43–0.45 g kg−1), although these differences were not statistically significant (p > 0.05). Below 40 cm (40–80 cm), however, BP and LP surpassed OD-CM in P content. Between the two arbor stands, LP showed 2.17% to 35.14% higher P content than BP across different soil layers.

3.2. Vertical Differentiation of Soil Stoichiometric Ratios Under Different Restoration Types

The vertical variation in soil C/N varied with restoration types (Figure 2d). Key observations are summarized as follows: (1) In the 0–20 cm layer, the C/N ranked as OD-CM (25.71) > BP (24.66) > LP (21.68), with a significant difference between OD-CM and LP (p < 0.05). (2) The same ranking persisted in the 20–100 cm layer, but the disparity between OD-CM and the two arbor stands increased from 1.05–4.03 (0–20 cm) to 5.01–6.19 (40–60 cm). In contrast, the difference between the two arbor stands (BP and LP) decreased from 2.98 (0–20 cm) to 0.60 (40–60 cm). (3) The three restoration types exhibited distinct vertical trends in C/N: OD-CM showed an increasing C/N with depth (from 25.71 in 0–20 cm to 30.56 in 40–60 cm); BP maintained relatively stable C/N values across layers (23.73–25.55); LP had a low C/N in the top layer (21.68), which stabilized between 24.05 and 24.68 in deeper layers.
Soil C/P exhibited different vertical trends compared to C/N (Figure 2e): (1) In the 0–20 cm layer, C/P ranked as BP (132.97) > LP (120.61) > OD-CM (92.95). The values for BP and LP were similar and significantly higher than those of OD-CM (p < 0.05). (2) With increasing depth, the difference in C/P between OD-CM and the two arbor stands gradually diminished, reaching similar levels at 40–60 cm. Between the two arbor stands, while BP had a higher C/P than LP in the top layer, this relationship reversed in the 20–100 cm layer, where BP (85.92–111.48) showed lower values than LP (104.41–117.76), and the difference widened with depth. (3) Vertically, C/P increased with depth under OD-CM but decreased under BP and LP.
The vertical differentiation of soil N/P ratio is shown in Figure 2f: (1) In the 0–20 cm layer, N/P ranked as LP (5.59) > BP (5.49) > OD-CM (3.62). BP and LP had similar values, both significantly higher than OD-CM (p < 0.05). (2) Although the disparity between OD-CM and the arbor stands decreased with depth, it remained evident. (3) N/P increased with depth under OD-CM but decreased under BP and LP. Across the entire soil profile, the N/P ranked as LP > BP > OD-CM.

3.3. Factors Influencing Soil Stoichiometry

3.3.1. Effects of Restoration Types, Soil Depth, and Their Interaction

Two-way ANOVA revealed that (1) the restoration type significantly affected soil C, N, P, C/N, C/P, and N/P (p < 0.001; Table 2). Soil depth significantly influenced C, N, and P (p < 0.001) but not the stoichiometric ratios. The interaction effect between restoration type and soil depth was significant for soil C, N, P, and C/P (p < 0.01 for C and N; p < 0.05 for P and C/P). (2) Partial η2 values indicated that soil depth had a greater impact on C, N, and P, while restoration type exerted a stronger influence on C/N, C/P, and N/P (Table 2).

3.3.2. Correlations with Environmental Factors

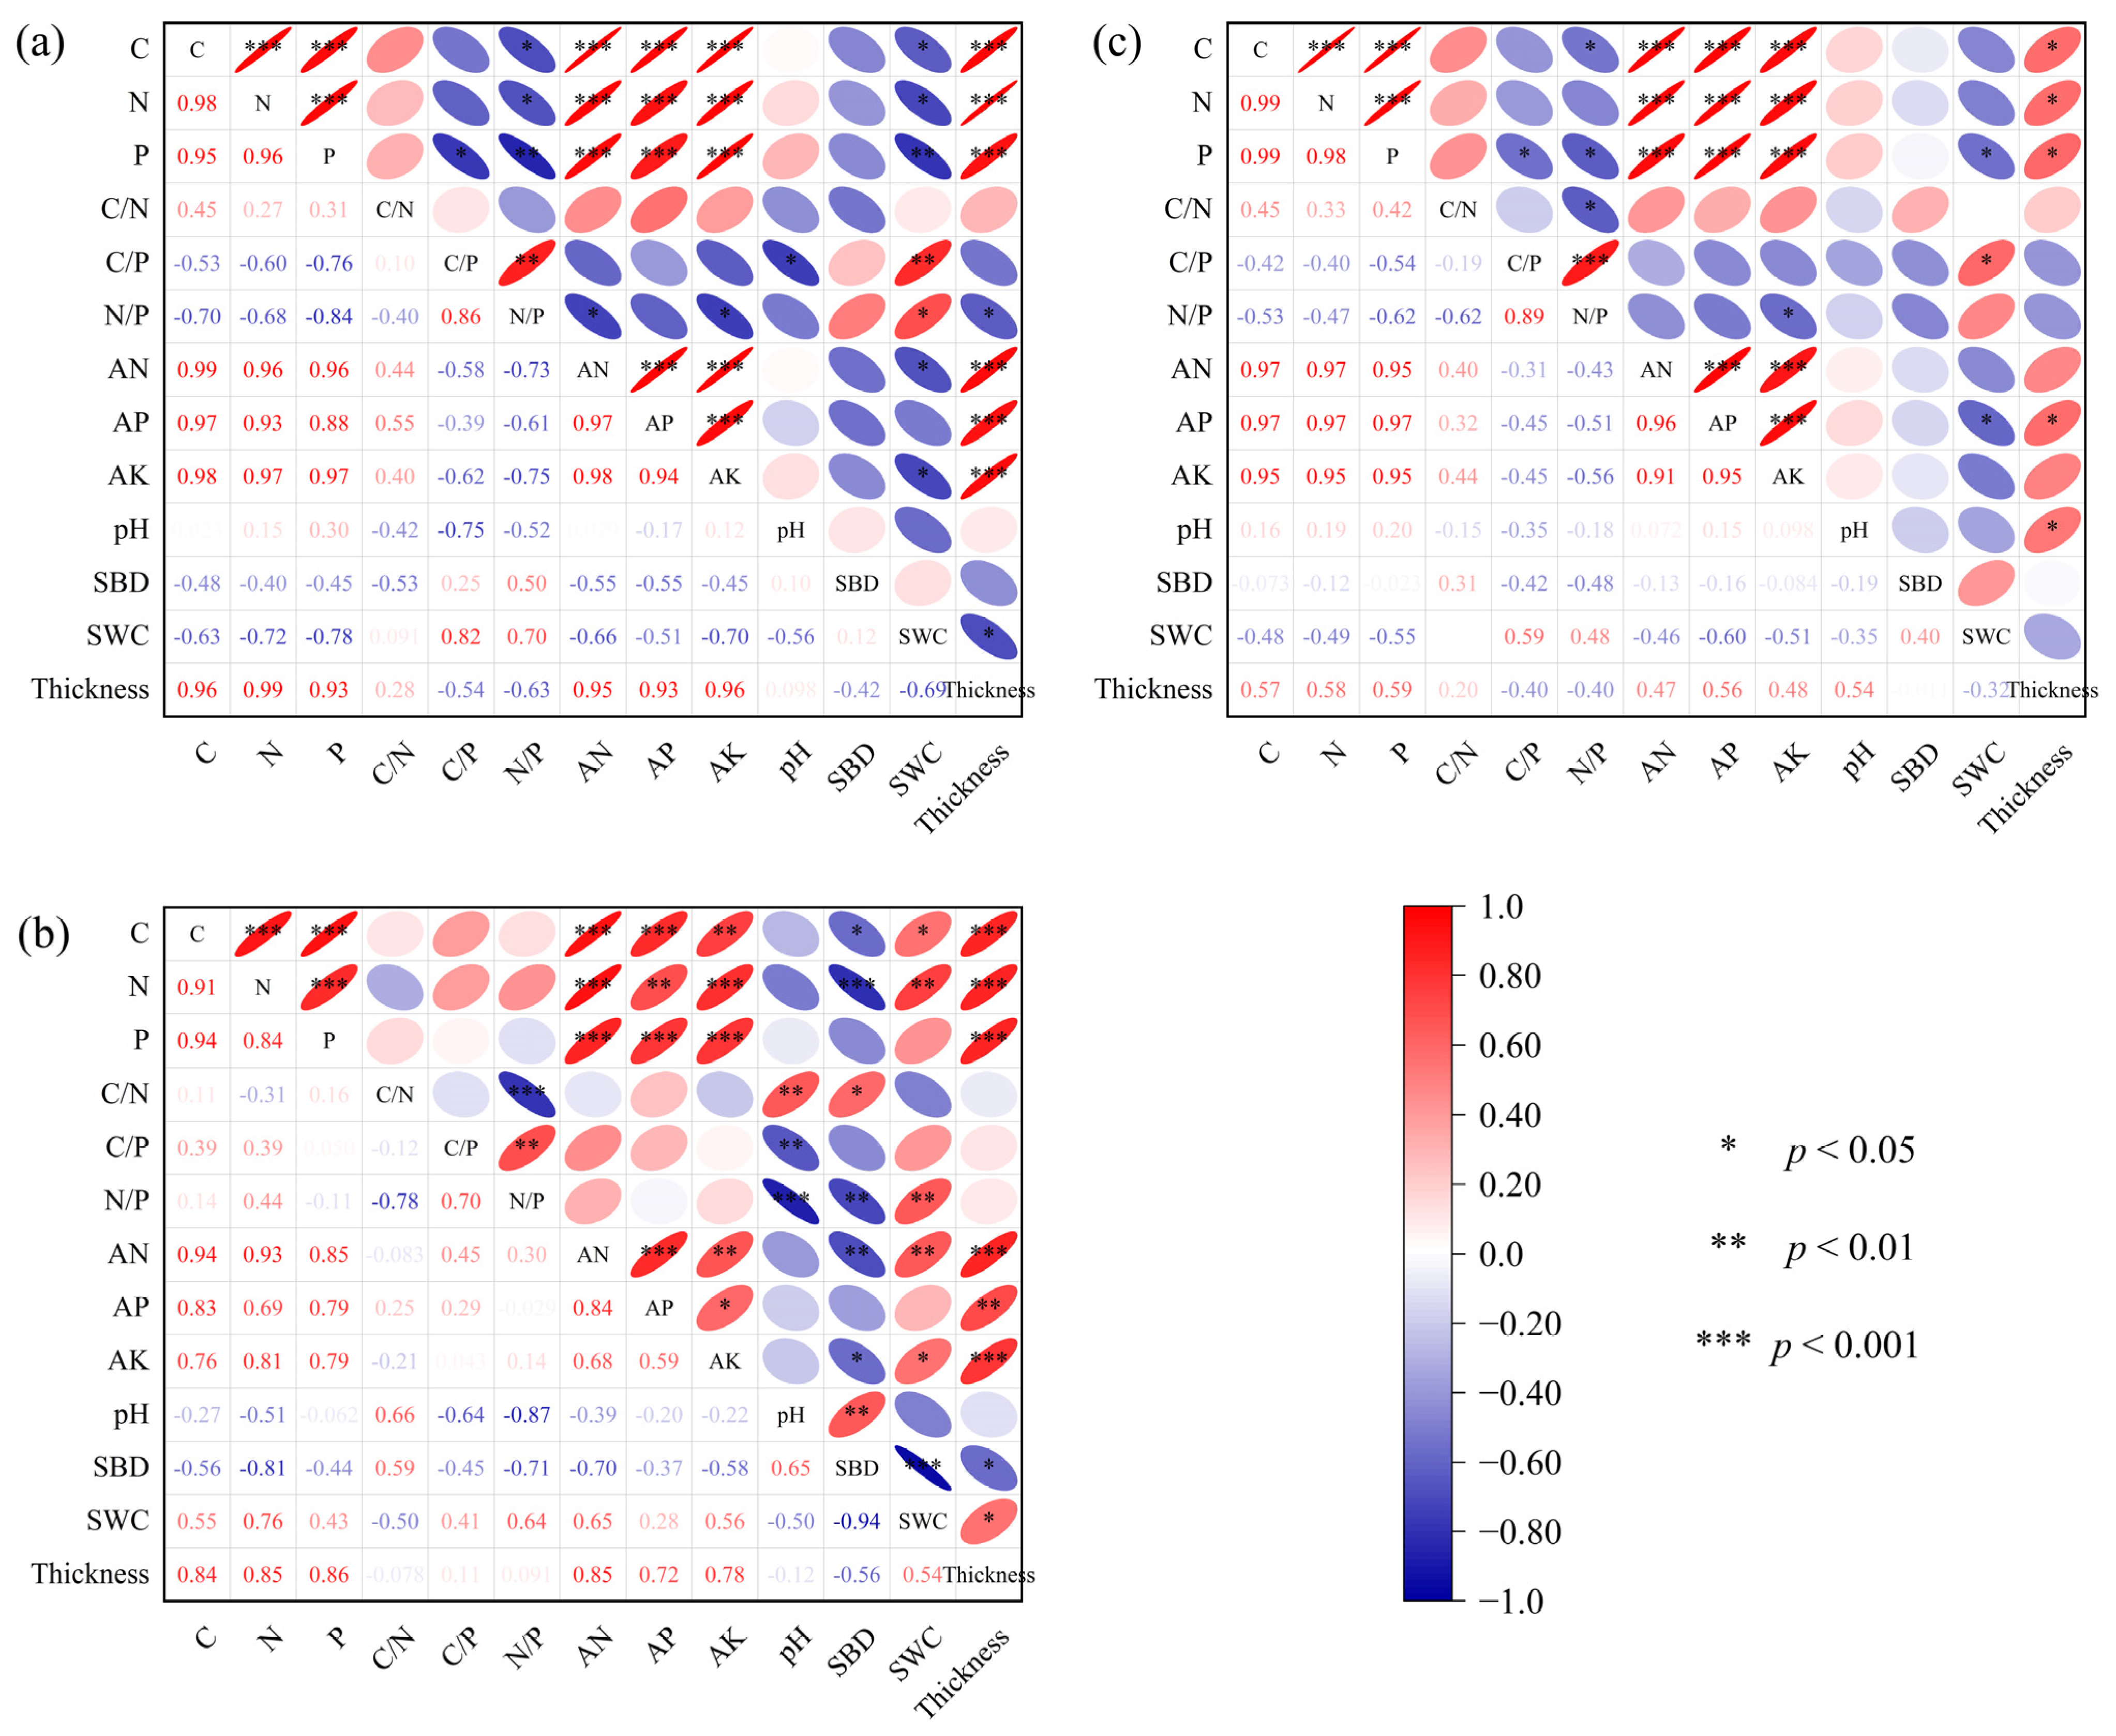
Under all restoration types, C, N, and P were significantly positively correlated with soil available nutrients (AN, AK, and AP) and thickness (p < 0.001; Figure 3a–c). Under OD-CM, soil C, N, and P were significantly negatively correlated with SWC, with correlation coefficients of −0.63 (p < 0.05), −0.72 (p < 0.05), and −0.78 (p < 0.01), respectively (Figure 3a). For soil stoichiometric ratios, C/P was significantly negatively correlated with pH (−0.75, p < 0.05) and positively correlated with SWC (0.82, p < 0.01). N/P was positively correlated with SWC (0.70, p < 0.05).
Under BP, both C and N in BP were significantly negatively correlated with SBD (−0.56, p < 0.05 and −0.81, p < 0.001, respectively) and positively correlated with SWC (0.55, p < 0.05 and 0.76, p < 0.01, respectively; Figure 3b). C/N was significantly positively correlated with pH and SBD (0.66, p < 0.01; 0.59, p < 0.05). C/P was significantly negatively correlated with pH (−0.64, p < 0.01). N/P was significantly negatively correlated with pH and SBD (−0.87, p < 0.001; −0.71, p < 0.01) and positively correlated with SWC (0.64, p < 0.01).
Under LP, P was significantly negatively correlated with SWC (−0.55, p < 0.05, Figure 3c). C/P was significantly positively correlated with SWC (0.59, p < 0.05).

3.3.3. Key Influencing Factors Identified by RDA

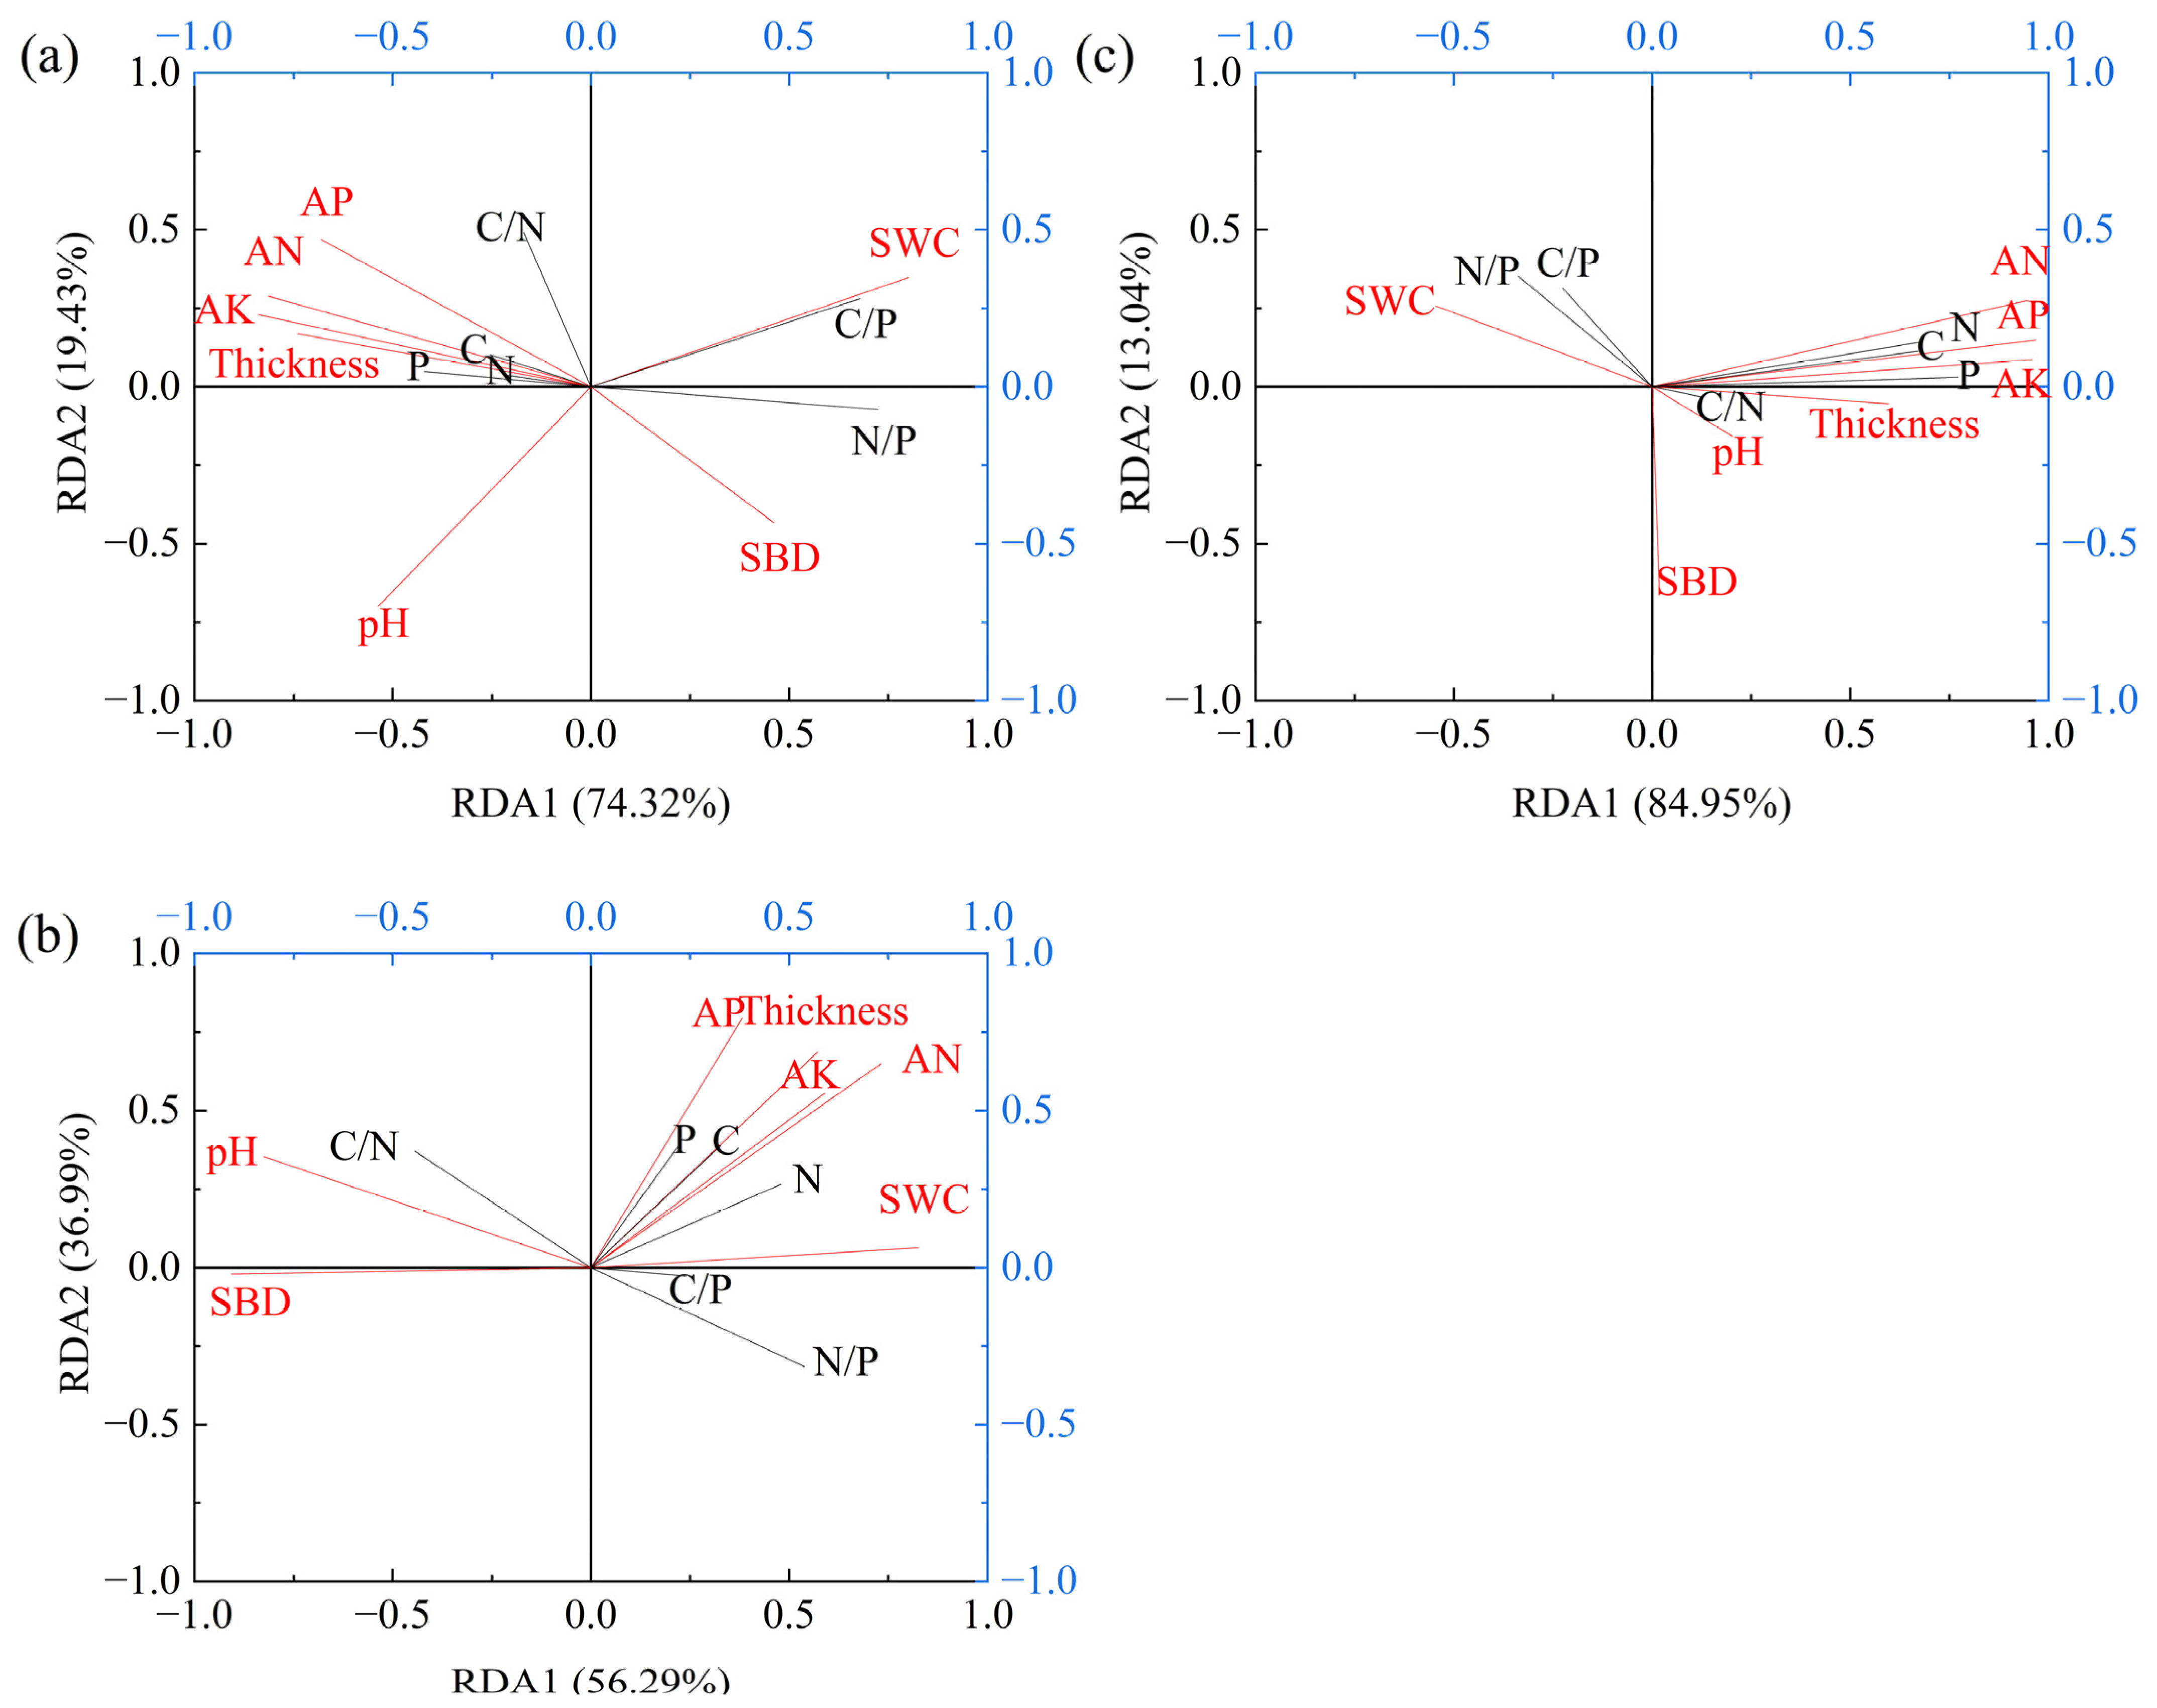
The results of the redundancy analysis of soil stoichiometry and environmental factors are shown in Figure 4. Soil C, N, and P contents and stoichiometric ratios served as response variables (black), while other soil properties and site conditions were explanatory variables (red). Key influencing factors varied among restoration types.
In the soil profile of OD-CM, the first two canonical axes collectively explained 93.75% of the variation, with AK, AN, and SWC as key factors (Figure 4a). Under BP, the soil profile, 93.28% of the variance was explained, primarily by SBD, SWC, and pH (Figure 4b). Under LP, the soil profile, the explained variance increased to 97.99%, dominated by AP, AK, and AN (Figure 4c).
Correlations between soil stoichiometry and environmental factors also varied across restoration types. Under all restoration types, soil C, N, and P contents and C/N in the profile were positively correlated with available nutrients (AN, AK, and AP) and thickness (Figure 4a–c). Under all restoration types, soil C, N, and P contents in the profile were negatively correlated with SBD (Figure 4a–c). However, correlations between stoichiometric metrics and environmental factors differed among restoration types. C, N, and P under OD-CM and LP were negatively correlated with SWC, whereas under BP, these relationships were positive. Stoichiometric ratios also showed type-specific patterns: under OD-CM, C/P and N/P were positively correlated with SWC and SBD but negatively correlated with pH; under BP, pH was positively correlated with C/N but negatively correlated with C/P and N/P; under LP, C/P and N/P were positively correlated with SWC but negatively correlated with pH and SBD, and N/P was negatively correlated with AK and AN.

4. Discussion

4.1. Differences in Soil Nutrient Content Under Three Restoration Types

Soil C, N, and P contents generally decreased with depth across the three near-natural restoration types (Figure 2a–c), showing a clear surface-enrichment pattern. This vertical pattern mainly reflects that organic inputs and nutrient recycling (litterfall, fine-root turnover, and rhizodeposition) are concentrated near the soil surface, where microbial decomposition and re-assimilation are most active [38,39,40,41,42,43,44,45]. Consequently, C and N—being largely associated with soil organic matter—decline more strongly with depth, whereas total P typically shows a weaker depth gradient because it is more strongly constrained by parent material and mineral associations and cycles more slowly [46].
The three restoration types studied were shrubland (OD-CM), broad-leaved forest (BP), and coniferous forest (LP). In the top layer (0–20 cm), soil C content ranked as follows: BP > LP > OD-CM (Figure 2a). The difference between the two arbor forests was not significant (p > 0.05). The litter amounts of BP and LP were higher than OD-CM, which may lead to the organic carbon content of the two arbor forests in the 0–20cm soil layer being significantly higher than OD-CM.
The top layer’s (0–20 cm) N content ranked as LP > BP > OD-CM (Figure 2b). The values for the two arbor forests were significantly higher than those of the shrubland (p < 0.05). This likely results from stronger biological N-fixing capacities in the arbor forests, fostered by warmer and wetter understory conditions and greater organic matter supply (litter).

4.2. Soil Stoichiometric Ratio and Nutrient Limitation Under Three Restoration Types

4.2.1. Vertical Variation of Soil Stoichiometric Ratio Under Different Restoration Types

The soil C/N of OD-CM, BP, and LP all increased with soil depth (from 25.71, 24.66, and 21.68 in the top layer to 29.45, 27.41, and 28.80 in the deep layer, respectively; Figure 2d). A primary reason may be the highest microbial abundance in the top layer. The organic matter of subsoil is mostly composed of organic molecules derived from the microbial community, while in the topsoil, you have a relatively higher amount of organic molecules derived from plants.
Soil C/P and N/P increased with soil depth in the shrubland (OD-CM) but decreased in the two arbor stands (BP and LP). This occurred because the percentage decrease in P content with depth (30.00%) was greater than the decreases in C (10.37%) and N (24.68%) in OD-CM (Figure 2a–c). This decreasing trend of P content with soil depth was most pronounced among the three restoration types. Specifically, OD-CM had the highest top-layer P content but the lowest deep-layer P content (Figure 2c). This may be due to the fact that Ostryopsis davidiana has a greater capacity for absorbing P, thereby enhancing P surface aggregation.
From the top layer to the deep layer, C/P decreased from 132.97 to 119.57 in BP and from 120.61 to 101.89 in LP (Figure 2e). Similarly, N/P decreased from 5.49 to 4.36 in BP and from 5.59 to 3.54 in LP (Figure 2f). This vertical variation pattern of C/P and N/P aligns with findings from a neighboring province [47]. It can be explained by the relatively slight decrease in P content with depth (BP: 10.87%; LP: 4.62%; Figure 2c) compared to the more substantial decreases in C (BP: 25.77%; LP: 13.21%) and N (BP: 27.43%; LP: 22.69%) contents (Figure 2a,b).

4.2.2. Soil Nutrient Limiting Factors Under Different Restoration Types

In our study area, the ratios C/N, C/P, and N/P in the top layer ranged from 21.68 to 25.71, 92.95 to 132.97, and 3.62 to 5.59, respectively (Figure 2d–f). These values differ from the national averages of Chinese top layers (14.40, 136.00, and 9.30, respectively) [48], indicating that N is the primary limiting nutrient element here. For the entire soil profile under the three restoration types, C/N, C/P, and N/P (23.36–27.63, 103.69–117.35, and 3.80–5.07, respectively) also deviate from the national profile averages (11.90, 61.00, and 5.20) [48], suggesting co-limitation by both N and P in this area.
BP and LP exhibited similar soil nutrient contents and stoichiometric ratios, implying comparable soil nutrient limitations. However, our results indicate stronger N limitation in OD-CM compared to the two arbor forests, evidenced by three key observations: First, OD-CM had the lowest N content among the three restoration types, being 28.77% and 34.52% lower than BP and LP, respectively (Figure 2b). Second, OD-CM had a higher C/N (28.55) ratio compared to the arbor forests (25.05 and 23.46 for BP and LP, respectively; Figure 2d). Third, OD-CM had the lowest N/P ratio (3.44) among the restoration types (4.83 and 5.00 for BP and LP, respectively; Figure 2f).

4.3. Influencing Factors of Soil Stoichiometry Under Different Restoration Types

The most important factors influencing soil stoichiometry across the three restoration types were available soil nutrients (AK, AN, and AP), pH, soil physical properties (SWC and SBD), and topographic factors (Slope, Alt) (Figure 4). These indices influence plant and microbial growth and physiological activities, thereby affecting nutrient cycling and soil stoichiometric characteristics [49,50]. Specifically, plant litter is a major nutrient source, and its chemical composition affects the ratio of nutrient inputs to the soil [22]. Microbes mediate litter decomposition and subsequent nutrient release [23]. Additionally, soil physical properties (SBD and SWC) and site conditions (Slope, Alt) influence soil weathering and leaching processes [5,51], further shaping soil stoichiometry.
The three land restoration types differed in key influencing factors. The RDA result indicated that the dominant factors for OD-CM were AK, AN, and SWC (Figure 4a). The potential reasons are as follows: (1) AK and AN: As readily available forms of essential elements, they directly affect plant growth and litter chemistry, consequently influencing soil stoichiometry. Both AK and AN were significantly negatively correlated with N/P (p < 0.05; Figure 3a and Figure 4a). This relationship may be mediated by plant biomass and litter. Soil organic N and organic P are both derived directly or indirectly from plant litter [26,52]. With an increase in plant biomass and litter, organic N and organic P increase. However, since organic N constitutes the majority of soil N and originates mainly from litter while organic P accounts for 30–65% of soil P [52], the proportional increase in soil N is greater than that of P, leading to a higher N/P ratio. Thus, biomass and litter are likely positively correlated with N/P. Concurrently, as plants absorb AK and AN, increased biomass and litter production deplete these available pools, resulting in the observed negative correlation between AK, AN, and N/P. (2) SWC: SWC was significantly positively correlated with C/P and N/P. The factors likely affect stoichiometry by influencing plant water availability and growth and litter input.
For BP, the dominant factors were pH, SBD, and SWC. Potential explanations include the following: (1) pH: Litter of Betula platyphylla is rich in exchangeable cations (e.g., Mg2+, Ca2+), which can increase soil pH [53]. Therefore, litter yield may be the underlying factor influencing both pH and soil stoichiometry. (2) SBD and SWC: Both RDA and correlation analysis showed that SBD was negatively correlated with C, N, and N/P and positively correlated with C/N, while SWC showed the opposite pattern (p < 0.05; Figure 3b). This is likely because SWC decreased with increasing SBD (the former was negatively correlated with the latter two, Figure 3), and SWC influenced plant growth and nutrient cycling.
For LP, the dominant factors were AP, AN, and AK (Figure 4c), highlighting the importance of available nutrients in its chemical cycling.
The influencing factors thus varied among restoration types. First, soil available nutrients were dominant for OD-CM and LP but not for BP. This may be because BP had a greater soil thickness (89 cm) (Table 1), providing BP plants with a more ample nutrient supply and thus reducing the relative influence of available nutrients on soil chemical cycling. Second, SWC was a dominant factor for the shrubland (OD-CM) and broad-leaved forest (BP) but not for the coniferous forest (LP), possibly due to the relatively low water consumption of coniferous species, minimizing water limitation on its chemical cycle.

4.4. Differences in Soil Stoichiometry Between Near-Naturally Restored and Artificial Forest Lands

This section compares the soil stoichiometric characteristics of the three near-naturally restored lands with two nearby artificial forest lands (8–25 km away from our study sites) and discusses the implications. Shuozhou City is a key area for the Three-North Shelterbelt Program. In the 1970s, extensive lands were reforested with Populus simonii (PS), but growth was generally limited by soil nutrients or water availability, resulting in stunted trees. Another widely used afforestation species on the Loess Plateau is Robinia pseudoacacia (RP), valued for its fast growth, N-fixation, and drought tolerance [54,55]. While RP planting enhanced vegetation coverage on the Loess Plateau [56], it also led to issues like soil nutrient depletion, biodiversity loss, and soil water over-consumption [54,57]. Therefore, we utilized soil nutrient data from nearby PS and RP forest lands obtained from existing studies [58] to calculate their stoichiometric ratios for comparison with the three near-naturally restored lands.
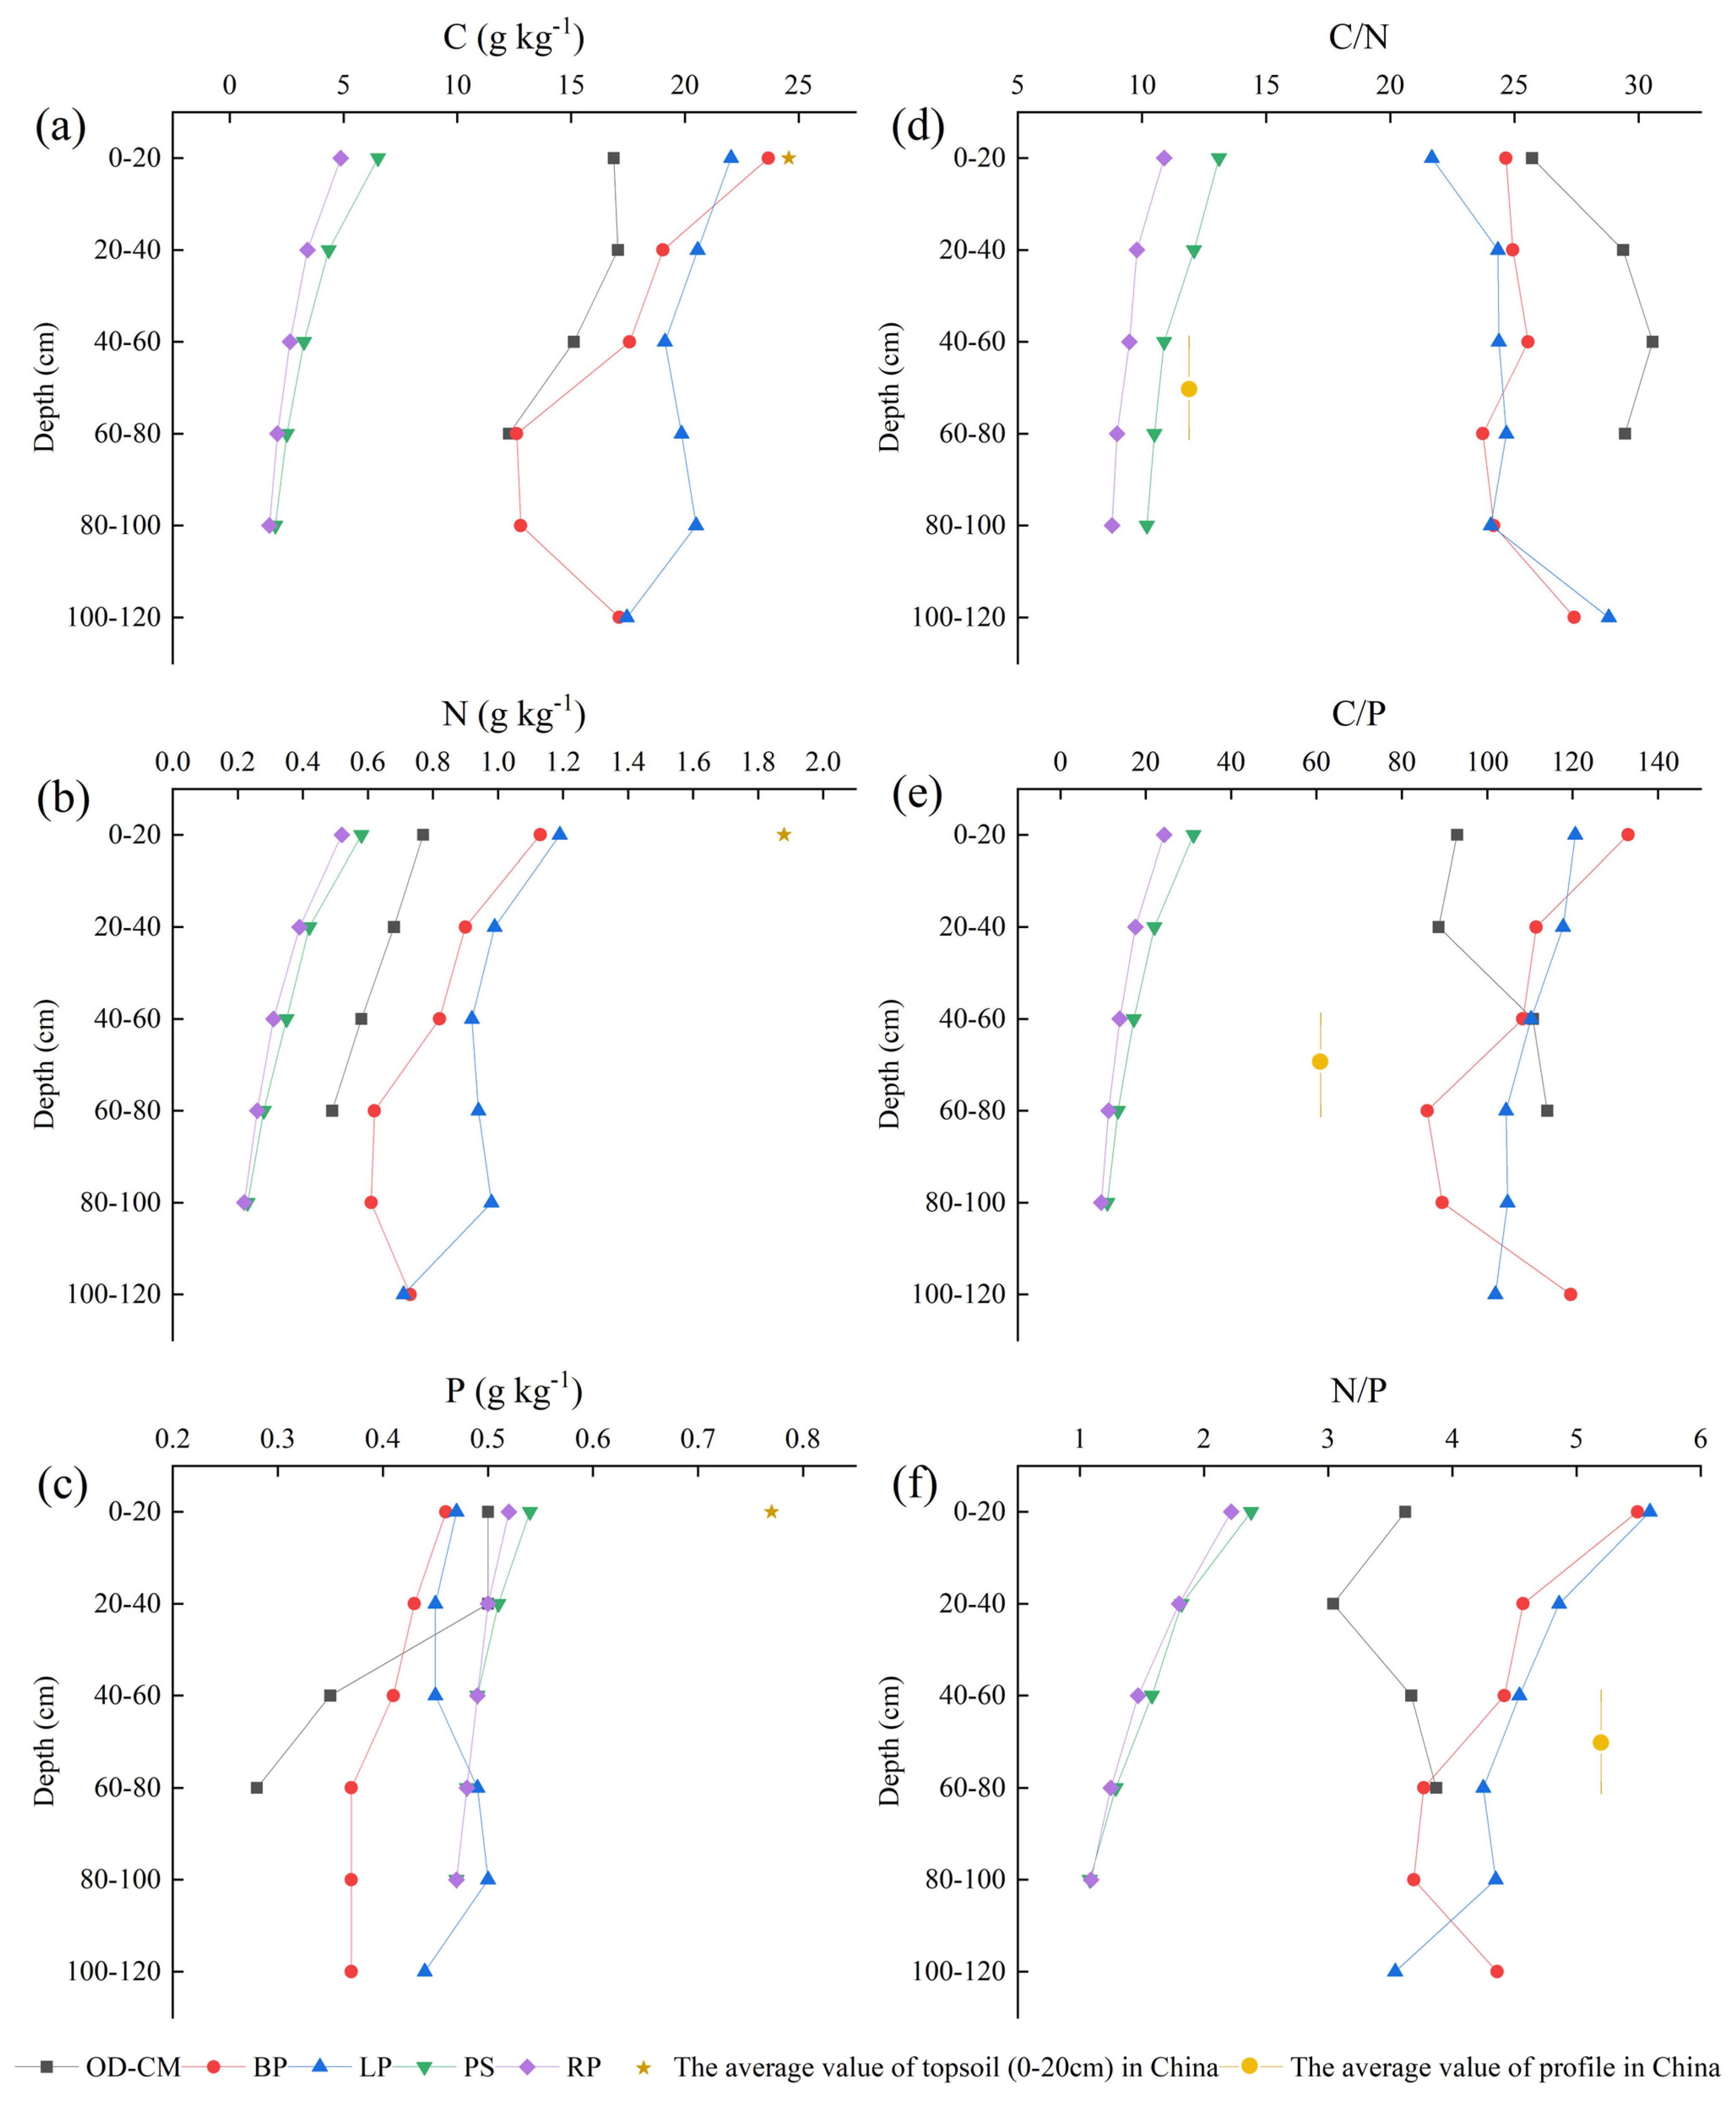
Figure 5 clearly shows that the soil nutrient levels in this area are generally lower than China’s average level, both for the top layer and soil profiles. Despite this, the three near-natural restoration stands generally exhibited higher soil nutrient levels than the two plantations (Figure 5a–c). Specifically, the soil C content of the near-natural stands (12.27–23.67 g kg−1) was 3–6 times that of PS (2.01–6.52 g kg−1) and 4–7 times that of RP (1.75–4.88 g kg−1) (Figure 5a), demonstrating a superior soil carbon sink capacity in the near-natural stands. Additionally, the soil C/N of the three near-natural restoration stands (21.68–30.56) was substantially higher than that of PS (10.2–13.1) and RP (8.80–10.90), indicating more stable organic matter that is prone to accumulation in the near-naturally restored stands [29,59].
In addition to the advantage in soil carbon sequestration, the near-naturally restored lands had higher soil N content and higher N and P use efficiencies than the plantations. (1) Higher Soil N Content: The Loess Plateau is generally N- and P-limited [5]. Consequently, top-layer N and P contents of all five restoration types in the study area (0.52–1.19 g kg−1 and 0.46–0.52 g kg−1, respectively) were lower than China’s averages (1.88 and 0.77 g kg−1, respectively) (Figure 5b,c). However, the top-layer N content of the near-natural stands (0.77–1.19 g kg−1) was markedly higher than that of PS (0.58 g kg−1) and RP (0.55 g kg−1). (2) Higher N and P Use Efficiency: The near-natural communities had much higher soil C/N (21.68–30.56) and C/P (85.92–132.97) compared to PS (C/N: 10.20–13.10; C/P: 11.00–31.20) and RP (C/N: 8.80–10.90; C/P: 9.60–24.30) and even the national soil profile average (C/N: 11.90; C/P: 61.00) (Figure 5d,e), indicating more efficient N and P utilization. Moreover, the soil N/P of the near-natural communities (3.04–5.59) was higher than that of PS (1.08–1.82) and RP (1.09–2.22) (Figure 5f). Given the relatively similar total P contents across communities, this suggests that near-natural restoration communities possess a stronger capacity for N-fixation and alleviation of N limitation [59].
In summary, compared to the artificial forest lands (RP and PS), near-naturally restored lands exhibit higher soil carbon sink capacity, higher soil nitrogen content, and greater N and P use efficiency. This indicates that near-natural restoration is a superior land management strategy for enhancing land ecosystem functions, including carbon sequestration, soil fertility maintenance, and nutrient cycling [56,58,60]. These findings advocate that near-natural land restoration should be vigorously promoted on the Loess Plateau, and existing plantations should be transitioned toward near-natural ecosystems [61].

4.5. Implications for Land Restoration and Sustainable Land Management

Compared to conventional artificial forest lands in the same region, near-naturally restored lands demonstrated 3.47–5.64 times higher soil C content and 1.51–2.51 times higher N content (Figure 2), indicating stronger soil carbon sequestration and nitrogen fixation capacity. Moreover, near-natural communities exhibited higher C/N (21.68–30.56) and C/P (85.92–132.97) compared to plantations (C/N: 8.8–13.1; C/P: 9.16–31.2), C/N, and C/P ratios (Figure 2), underscoring their superior nitrogen and phosphorus use efficiency. These findings advocate that near-natural restoration should be vigorously promoted on the Loess Plateau [2], and existing plantations should be transitioned toward near-natural ecosystems [61].
The two near-natural forest lands exhibited 1.23–1.26 times higher soil C and 1.40–1.51 times higher soil N contents compared to the near-natural shrubland, indicating enhanced carbon sequestration and nitrogen fixation capacity. Additionally, the forest lands showed lower C/N (BP: 25.05; LP: 23.46) and higher N/P (BP: 4.83; LP: 5.00) than the shrubland (C/N: 28.55; N/P: 3.44), suggesting reduced nitrogen limitation relative to shrubland. These results highlight the advantages of near-natural forest lands with respect to soil carbon sequestration and nitrogen fixation capacity and suggest promoting community succession from the shrub-grass stage to the arbor stage.
To sum up, our study suggests that applying near-natural restoration on the Loess Plateau enhances land ecosystem functions such as soil carbon sequestration and nitrogen fixation capacity, as well as nutrient use efficiency. And stimulating community succession from the shrub stage to arbor communities further increases soil carbon sequestration and nitrogen fixation capacity, as well as mitigating nitrogen limitation on the Loess Plateau.

5. Conclusions

This study systematically investigated the vertical variation and influencing factors of soil C, N, and P stoichiometric characteristics under three typical near-natural restored lands in the loess hilly region, with comparisons made with respect to conventional artificial forest lands. The main conclusions are as follows:
(1) The near-natural forest lands (Betula platyphylla forest and Larix principis-rupprechtii forest) had 1.23–1.26 times higher C content and 1.40–1.51 times higher N content than the near-natural shrubland (Ostryopsis davidiana and Cotoneaster multiflorus mixture community), suggesting that promoting community succession from the shrub-grass stage to the arbor stage is crucial for enhancing land carbon sequestration and nitrogen fixation capacity.
(2) The forest lands exhibited lower C/N (23.46–25.05) and higher N/P (4.83–5.00) compared with the shrubland (C/N: 28.55; N/P: 3.44), indicating lower nitrogen limitation on the forest lands.
(3) The key factors influencing stoichiometric characteristics varied across restoration types, implying that vegetation community composition regulates nutrient cycling through nutrient uptake and litter input.
(4) Relative to conventional artificial forest lands in the same area, the near-naturally restored lands exhibited 3.47–5.64 times higher C and 1.51–2.51 times higher N content. Moreover, the near-naturally restored lands had significantly higher C/N and C/P. These results demonstrate that near-natural restoration is a superior land management strategy for enhancing land sustainability and land ecosystem functions on the Loess Plateau, including carbon sequestration, nitrogen fixation, and nutrient utilization and cycling.

Supplementary Materials

The following supporting information can be downloaded at: https://www.mdpi.com/article/10.3390/nitrogen7010025/s1, Table S1: References in Figure A1.

Author Contributions

Y.G.: Conceptualization, data curation, formal analysis, investigation, methodology, validation, visualization, and writing—original draft; X.F.: conceptualization, data curation, funding acquisition, methodology, project administration, resources, supervision, validation, writing—original draft, and writing—review and editing; T.H.: investigation, methodology, and writing—review and editing; J.S.: data curation, formal analysis, investigation, and visualization; Y.F.: investigation and visualization; J.X.: investigation and visualization; Y.X.: writing—review and editing; C.Z.: funding acquisition, project administration, resources, supervision, and writing—review and editing; C.L.: resources and writing—review and editing; Z.B.: supervision and writing—review and editing; X.X.: investigation. All authors have read and agreed to the published version of the manuscript.

Funding

This research was funded by the National Natural Science Foundation of China (No. 42201298), the Scientific and Technological Innovation Foundation of Shanxi Agricultural University (Ph.D. Research Startup) (No. 2021BQ96 and No. 2022BQ10), and the Shanxi Province Science Foundation for Youths (Grant No. 20210302124245).

Institutional Review Board Statement

Not applicable.

Data Availability Statement

The data presented in this study are available on request from the corresponding author due to legal.

Conflicts of Interest

The authors declare no conflicts of interest.

Appendix A

Table A1. Indication of soil stoichiometric ratio.
IndicationRanges
(by Mass)
SignificanceReference
C/NAccumulation vs. decomposition rate of organic matter12–16Well decomposition of organic matter.[12]
>25Net organic matter accumulation.
Leaching risk for soil nitrate<25High risk for soil nitrate leaching.[62]
25–30Moderate risk for soil nitrate leaching.
>30Low risk for soil nitrate leaching.
C/PPlant phosphorus availability<200P surplus for microbial growth, and net mobilization of orthophosphate
into the soil solution.
[16]
>300Net immobilization of P into microbial biomass.
N/PIndication of N or P limitation (By analogy with foliar N/P)<10N limitation.[12]
>20P limitation.
Figure A1. Global distribution of soil stoichiometric studies under different ecosystem types. The studies used to generate Figure A1 were searched on Google Scholar, and the keywords were soil stoichiometry and ecological restoration.
Nitrogen 07 00025 g0a1

References

  1. Ministry of Natural Resources of the People’s Republic of China. China National Natural Resources Bulletin 2024; Ministry of Natural Resources of the People’s Republic of China: Beijing, China, 2024. (In Chinese)
  2. Zhu, J.; Song, L. A Review of Ecological Mechanisms for Management Practices of Protective Forests. J. For. Res. 2021, 32, 435–448. [Google Scholar] [CrossRef]
  3. Yu, T.; Liu, P.; Zhang, Q.; Ren, Y.; Yao, J. Detecting Forest Degradation in the Three-North Forest Shelterbelt in China from Multi-Scale Satellite Images. Remote Sens. 2021, 13, 1131. [Google Scholar] [CrossRef]
  4. Ji, Y.; Zhou, G.; Li, Z.; Wang, S.; Zhou, H.; Song, X. Triggers of Widespread Dieback and Mortality of Poplar (Populus spp.) Plantations across Northern China. J. Arid. Environ. 2020, 174, 104076. [Google Scholar] [CrossRef]
  5. Chen, Y.; Li, Y.; Duan, Y.; Wang, L.; Wang, X.; Yao, C.; Chen, Y.; Cao, W.; Niu, Y. Patterns and Driving Factors of Soil Ecological Stoichiometry in Typical Ecologically Fragile Areas of China. Catena 2022, 219, 106628. [Google Scholar] [CrossRef]
  6. Zhang, J.; Wang, G. Revegetation Type Affected Soil C, N, P Stocks and Stoichiometry in a Reclaimed Mine Area in Shanxi Province, China. Ecol. Eng. 2023, 197, 107120. [Google Scholar] [CrossRef]
  7. Su, B.; Gao, C.; Zhang, H.; Mouazen, A.M.; Shao, S.; Zhang, Y.; Jiao, H. Stoichiometry of Carbon, Nitrogen, and Phosphorus in Soil: Impacts of Soil Development and Land Use across the Catchment Scale. Catena 2025, 252, 108862. [Google Scholar] [CrossRef]
  8. Ma, Y.; Zhang, C.; Yang, H.; Xu, Y.; Chen, Y.; Ning, J. The Characteristics of Soil C, N and P and Stoichiometric Ratios as Affected by Land-Use in a Karst Area, Southwest China. Land 2023, 12, 1126. [Google Scholar] [CrossRef]
  9. Wang, G.; Xiao, H.; Xin, Z.; Luo, F.; Jin, Y.; Liu, M.; Li, J. Changes in Plant-Soil-Microbe C-N-P Contents and Stoichiometry during Poplar Shelterbelt Degradation. Catena 2024, 243, 108227. [Google Scholar] [CrossRef]
  10. Idoko, J.E.; Chen, H.; Xue, D. Stoichiometric Characteristics and Factors Influencing Soil Carbon, Nitrogen, and Phosphorus in Various Types of Peatlands: A Meta-Analysis. Catena 2025, 249, 108563. [Google Scholar] [CrossRef]
  11. Pei, Y.; Gong, S.; Zhang, X.; Zhang, Z.; Zhang, H.; Zha, T. What Is the Effect of Long-Term Revegetation on Soil Stoichiometry? Case Study Based on In Situ Long-Term Monitoring on the Loess Plateau, China. Land. Degrad. Dev. 2025, 36, 4732–4743. [Google Scholar] [CrossRef]
  12. Bui, E.N.; Henderson, B.L. C:N:P Stoichiometry in Australian Soils with Respect to Vegetation and Environmental Factors. Plant Soil. 2013, 373, 553–568. [Google Scholar] [CrossRef]
  13. Gundersen, P.; Sevel, L.; Christiansen, J.R.; Vesterdal, L.; Hansen, K.; Bastrup-Birk, A. Do Indicators of Nitrogen Retention and Leaching Differ between Coniferous and Broadleaved Forests in Denmark? For. Ecol. Manag. 2009, 258, 1137–1146. [Google Scholar] [CrossRef]
  14. Peng, Y.; Duan, Y.; Huo, W.; Zhang, Z.; Huang, D.; Xu, M.; Wang, X.; Yang, X.; Wang, B.; Kuzyakov, Y.; et al. C:P Stoichiometric Imbalance between Soil and Microorganisms Drives Microbial Phosphorus Turnover in the Rhizosphere. Biol. Fertil. Soils 2022, 58, 421–433. [Google Scholar] [CrossRef]
  15. Wang, W.; Sardans, J.; Zeng, C.; Zhong, C.; Li, Y.; Peñuelas, J. Responses of Soil Nutrient Concentrations and Stoichiometry to Different Human Land Uses in a Subtropical Tidal Wetland. Geoderma 2014, 232–234, 459–470. [Google Scholar] [CrossRef]
  16. Paul, E.A. Soil Microbiology, Ecology, and Biochemistry in Perspective. In Soil Microbiology, Ecology and Biochemistry, 3rd ed.; Elsevier: Amsterdam, The Netherlands, 2006; pp. 3–24. ISBN 0125468075. [Google Scholar]
  17. Zhang, P.; Liu, G.; Yu, Y. Ecological Stoichiometry of Soil Carbon, Nitrogen and Phosphorus in Reclaimed Farmland in Coal Mining Subsidence Area. J. Soil. Sci. Plant Nutr. 2023, 23, 2498–2511. [Google Scholar] [CrossRef]
  18. Peñuelas, J.; Sardans, J.; Rivas-ubach, A.; Janssens, I.A. The Human-Induced Imbalance between C, N and P in Earth’s Life System. Glob. Change Biol. 2012, 18, 3–6. [Google Scholar] [CrossRef]
  19. Zhang, J.; Yan, X.; Su, F.; Li, Z.; Wang, Y.; Wei, Y.; Ji, Y.; Yang, Y.; Zhou, X.; Guo, H.; et al. Long-Term N and P Additions Alter the Scaling of Plant Nitrogen to Phosphorus in a Tibetan Alpine Meadow. Sci. Total Environ. 2018, 625, 440–448. [Google Scholar] [CrossRef] [PubMed]
  20. Yao, L.; Adame, M.F.; Chen, C. Resource Stoichiometry, Vegetation Type and Enzymatic Activity Control Wetlands Soil Organic Carbon in the Herbert River Catchment, North-East Queensland. J. Environ. Manag. 2021, 296, 113183. [Google Scholar] [CrossRef]
  21. Silva, D.F.; Araujo, A.S.F.; Lima, A.Y.V.; Mota, J.C.A.; Nascimento, Í.V.; Queiroz, A.S.; Medeiros, E.V.; Costa, D.P.; Melo, V.M.M.; Cardoso, E.J.B.N.; et al. Enzymatic Stoichiometry in Degraded Soils after Two Decades of Restoration in a Brazilian Semiarid Region. Catena 2024, 236, 107768. [Google Scholar] [CrossRef]
  22. Yu, W.; Wang, C.; Cornelissen, J.H.C.; Ye, X.; Huang, Z.; Wang, D.; Liu, G. Litter Position and Stoichiometry Regulate Plant Litter Decomposition and Nitrogen Release in Terrestrial Ecosystems. Catena 2025, 256, 109093. [Google Scholar] [CrossRef]
  23. Čapek, P.; Choma, M.; Tahovská, K.; Kaňa, J.; Kopáček, J.; Šantrůčková, H. Coupling the Resource Stoichiometry and Microbial Biomass Turnover to Predict Nutrient Mineralization and Immobilization in Soil. Geoderma 2021, 385, 114884. [Google Scholar] [CrossRef]
  24. Chen, L.; Fang, K.; Wei, B.; Qin, S.; Feng, X.; Hu, T.; Ji, C.; Yang, Y. Soil Carbon Persistence Governed by Plant Input and Mineral Protection at Regional and Global Scales. Ecol. Lett. 2021, 24, 1018–1028. [Google Scholar] [CrossRef] [PubMed]
  25. Liang, C.; Amelung, W.; Lehmann, J.; Kästner, M. Quantitative Assessment of Microbial Necromass Contribution to Soil Organic Matter. Glob. Change Biol. 2019, 25, 3578–3590. [Google Scholar] [CrossRef]
  26. Daly, A.B.; Jilling, A.; Bowles, T.M.; Buchkowski, R.W.; Frey, S.D.; Kallenbach, C.M.; Keiluweit, M.; Mooshammer, M.; Schimel, J.P.; Grandy, A.S. A Holistic Framework Integrating Plant-Microbe-Mineral Regulation of Soil Bioavailable Nitrogen. Biogeochemistry 2021, 154, 211–229. [Google Scholar] [CrossRef]
  27. Lin, Y.; Fang, L.; Zhou, W.; Qiao, Z.; Chang, Y.; Yu, X.; Li, Y.; Ren, P.; Xiao, J. Evaluating the Long-Term Effects of near-Natural Restoration on Post-Fire Forest Dynamics in a Wildland-Urban Interface Landscape. Ecol. Indic. 2024, 160. [Google Scholar] [CrossRef]
  28. Vu Ho, K.; Kröel-Dulay, G.; Tölgyesi, C.; Bátori, Z.; Tanács, E.; Kertész, M.; Török, P.; Erdős, L. Non-Native Tree Plantations Are Weak Substitutes for near-Natural Forests Regarding Plant Diversity and Ecological Value. For. Ecol. Manag. 2023, 531, 120789. [Google Scholar] [CrossRef]
  29. Ren, Y.; Lin, F.; Jiang, C.; Tang, J.; Fan, Z.; Feng, D.; Zeng, X.; Jin, Y.; Liu, C.; Olatunji, O.A. Understory Vegetation Management Regulates Soil Carbon and Nitrogen Storage in Rubber Plantations. Nutr. Cycl. Agroecosyst. 2023, 127, 209–224. [Google Scholar] [CrossRef]
  30. Albornoz, F.E.; Prober, S.M.; Bissett, A.; Tibbett, M.; Standish, R.J. Arbuscular Mycorrhizal Communities Respond to Nutrient Enrichment and Plant Invasion in Phosphorus-Limited Eucalypt Woodlands. J. Ecol. 2024, 112, 1842–1855. [Google Scholar] [CrossRef]
  31. Brundu, G.; Richardson, D.M. Planted Forests and Invasive Alien Trees in Europe: A Code for Managing Existing and Future Plantings to Mitigate the Risk of Negative Impacts from Invasions. NeoBiota 2016, 30, 5–47. [Google Scholar] [CrossRef]
  32. Hua, F.; Bruijnzeel, L.A.; Meli, P.; Martin, P.A.; Zhang, J.; Nakagawa, S.; Miao, X.; Wang, W.; McEvoy, C.; Peña-Arancibia, J.L.; et al. The Biodiversity and Ecosystem Service Contributions and Trade-Offs of Forest Restoration Approaches. Science 2022, 376, 839–844. [Google Scholar] [CrossRef]
  33. Peng, J.; Li, B.; Dong, J.; Liu, Y.; Lv, D.; Du, Y.; Luo, M.; Wu, J. Basic Logic of Territorial Ecological Restoration. China Land Sci. 2020, 34, 18–26. [Google Scholar] [CrossRef]
  34. IUSS Working Group WRB. World Reference Base for Soil Resources 2014, Update 2015. In International Soil Classification System for Naming Soils and Creating Legends for Soil Maps; World Soil Resources Reports No. 106; FAO: Rome, Italy, 2015. [Google Scholar]
  35. Nelson, D.W.; Sommers, L.E. Total Carbon, Organic Carbon, and Organic Matter; Soil Science Society of America: Madison, WI, USA, 1996. [Google Scholar]
  36. Misra, R. (Ed.) Ecology Workbook; Scientific Publishers: Jodhpur, India, 1968. [Google Scholar]
  37. Helmke, P.A.; Sparks, D.L. Lithium, Sodium, Potassium, Rubidium, and Cesium; Soil Science Society of America: Madison, WI, USA, 1996. [Google Scholar]
  38. Lu, J.; Feng, S.; Wang, S.; Zhang, B.; Ning, Z.; Wang, R.; Chen, X.; Yu, L.; Zhao, H.; Lan, D.; et al. Patterns and Driving Mechanism of Soil Organic Carbon, Nitrogen, and Phosphorus Stoichiometry across Northern China’s Desert-Grassland Transition Zone. Catena 2023, 220, 106695. [Google Scholar] [CrossRef]
  39. Tang, X.; Hu, J.; Lu, Y.; Qiu, J.; Dong, Y.; Li, B. Soil C, N, P Stocks and Stoichiometry as Related to Land Use Types and Erosion Conditions in Lateritic Red Soil Region, South China. Catena 2022, 210, 105888. [Google Scholar] [CrossRef]
  40. Bian, Q.; Zhao, L.; Cheng, K.; Jiang, Y.; Li, D.; Xie, Z.; Sun, B.; Wang, X. Divergent Accumulation of Microbe- and Plant-Derived Carbon in Different Soil Organic Matter Fractions in Paddy Soils under Long-Term Organic Amendments. Agric. Ecosyst. Environ. 2024, 366, 108934. [Google Scholar] [CrossRef]
  41. Barreto, P.A.B.; Gama-Rodrigues, E.F.; Gama-Rodrigues, A.C.; Fontes, A.G.; Polidoro, J.C.; Moço, M.K.S.; Machado, R.C.R.; Baligar, V.C. Distribution of Oxidizable Organic C Fractions in Soils under Cacao Agroforestry Systems in Southern Bahia, Brazil. Agrofor. Syst. 2011, 81, 213–220. [Google Scholar] [CrossRef]
  42. Zhang, H.; Li, Y.; Xu, Y.; John, R. The Recovery of Soil N-Cycling and P-Cycling Following Reforestation in a Degraded Tropical Limestone Mine. J. Clean. Prod. 2024, 448, 141580. [Google Scholar] [CrossRef]
  43. Groß, C.; Hossen, S.; Dittrich, S.; Knorr, K.H.; Borken, W.; Noll, M. Biological Nitrogen Fixation, Diversity and Community Structure of Diazotrophs in Two Mosses in 25 Temperate Forests. Environ. Microbiol. 2024, 26, e16555. [Google Scholar] [CrossRef] [PubMed]
  44. Li, X.; Zhang, C.; Zhang, B.; Wu, D.; Zhu, D.; Zhang, W.; Ye, Q.; Yan, J.; Fu, J.; Fang, C.; et al. Nitrogen Deposition and Increased Precipitation Interact to Affect Fine Root Production and Biomass in a Temperate Forest: Implications for Carbon Cycling. Sci. Total Environ. 2021, 765, 144497. [Google Scholar] [CrossRef]
  45. Li, D.; Zhang, X.; Dungait, J.A.J.; Wen, X.; Quine, T.A.; Wang, Q. Changes in the Biological N2-Fixation Rates and Diazotrophic Community as Vegetation Recovers on Abandoned Farmland in a Karst Region of China. Appl. Soil Ecol. 2021, 158, 103808. [Google Scholar] [CrossRef]
  46. Jiang, W.; Gong, L.; Yang, L.; He, S.; Liu, X. Dynamics in C, N, and P Stoichiometry and Microbial Biomass Following Soil Depth and Vegetation Types in Low Mountain and Hill Region of China. Sci. Rep. 2021, 11, 19631. [Google Scholar] [CrossRef]
  47. Wu, X.; Zhang, H.; Wang, Z.; Tian, W.; Liu, Z. Patterns of Soil Stoichiometry Driven by Mixed Tree Species Proportions in Boreal Forest. Sustainability 2024, 16, 8646. [Google Scholar] [CrossRef]
  48. Tian, H.; Chen, G.; Zhang, C.; Melillo, J.M.; Hall, C.A.S. Pattern and Variation of C:N:P Ratios in China’s Soils: A Synthesis of Observational Data. Biogeochemistry 2010, 98, 139–151. [Google Scholar] [CrossRef]
  49. Lasota, J.; Błońska, E. C:N:P Stoichiometry as an Indicator of Histosol Drainage in Lowland and Mountain Forest Ecosystems. For. Ecosyst. 2021, 8, 39. [Google Scholar] [CrossRef]
  50. Zhang, P.; He, M.; Wang, J.; Huang, L.; Yang, H.; Song, G.; Zhao, J.; Li, X. Desertification Reduces Organic Carbon Content and Nutrient Availability in Dryland Soils: Evidence from a Survey in the Amu Darya River Basin. Land. Degrad. Dev. 2025, 36, 1181–1194. [Google Scholar] [CrossRef]
  51. García-Gamero, V.; Vanwalleghem, T.; Peña, A.; Román-Sánchez, A.; Finke, P.A. Modelling the Effect of Catena Position and Hydrology on Soil Chemical Weathering. Soil 2022, 8, 319–335. [Google Scholar] [CrossRef]
  52. Shen, J.; Yuan, L.; Zhang, J.; Li, H.; Bai, Z.; Chen, X.; Zhang, W.; Zhang, F. Phosphorus Dynamics: From Soil to Plant. Plant Physiol. 2011, 156, 997–1005. [Google Scholar] [CrossRef]
  53. Ge, Z.; Zhang, X.; Liu, C.; Li, M.; Wang, R.; Zhang, Y.; Zhang, Z. Microbial Determinants of Soil Quality in Mixed Larch and Birch Forests: Network Structure and Keystone Taxa Abundances. Front. Plant Sci. 2025, 16, 1491038. [Google Scholar] [CrossRef]
  54. Wu, W.; Chen, G.; Meng, T.; Li, C.; Feng, H.; Si, B.; Siddique, K.H.M. Effect of Different Vegetation Restoration on Soil Properties in the Semi-Arid Loess Plateau of China. Catena 2023, 220, 106630. [Google Scholar] [CrossRef]
  55. Wang, N.; Bi, H.; Peng, R.; Zhao, D.; Liu, Z. Sustainable Forest Development in the Face of Global Warming: Optimizing Robinia pseudoacacia L. Stands to Alleviate Soil Moisture Depletion. J. Clean. Prod. 2024, 470, 143341. [Google Scholar] [CrossRef]
  56. Wang, J.; Zhao, W.; Wang, G.; Yang, S.; Pereira, P. Effects of Long-Term Afforestation and Natural Grassland Recovery on Soil Properties and Quality in Loess Plateau (China). Sci. Total Environ. 2021, 770, 144833. [Google Scholar] [CrossRef] [PubMed]
  57. Guo, Q.; Wen, Z.; Zheng, C.; Li, W.; Fan, Y.; Zhu, D. Effects of Robinia pseudoacacia on the Undergrowth of Herbaceous Plants and Soil Properties in the Loess Plateau of China. J. Plant Ecol. 2021, 14, 896–910. [Google Scholar] [CrossRef]
  58. Liu, X.; Bai, Z.; Zhou, W.; Cao, Y.; Zhang, G. Changes in Soil Properties in the Soil Profile after Mining and Reclamation in an Opencast Coal Mine on the Loess Plateau, China. Ecol. Eng. 2017, 98, 228–239. [Google Scholar] [CrossRef]
  59. Qian, J.; Ji, C.; Yang, J.; Zhao, H.; Wang, Y.; Fu, L.; Liu, Q. The Advantage of Afforestation Using Native Tree Species to Enhance Soil Quality in Degraded Forest Ecosystems. Sci. Rep. 2024, 14, 20022. [Google Scholar] [CrossRef] [PubMed]
  60. Qiu, L.; Zhang, X.; Cheng, J.; Yin, X. Effects of Black Locust (Robinia pseudoacacia) on Soil Properties in the Loessial Gully Region of the Loess Plateau, China. Plant Soil. 2010, 332, 207–217. [Google Scholar] [CrossRef]
  61. Wang, Y.; Shangguan, Z. Formation Mechanisms and Remediation Techniques for Low-Efficiency Artificial Shelter Forests on the Chinese Loess Plateau. J. Arid. Land. 2022, 14, 837–848. [Google Scholar] [CrossRef]
  62. Gundersen, P.; Callesen, I.; de Vries, W. Nitrate Leaching in Forest Ecosystems Is Related to Forest Floor C/N Ratios. In Nitrogen, the Confer-N-s; Elsevier: Amsterdam, The Netherlands, 1998; pp. 403–407. [Google Scholar]
Figure 1. Study area. (a) Geographical location of the study area; (b,c) are sampling sites of the three restoration types; (df) are close shots of three restoration types.
Nitrogen 07 00025 g001
Figure 2. Vertical variation of soil stoichiometry under different restoration types. (ac) are vertical variations of soil C, N, and P, respectively; (df) are vertical variations of soil C/N, C/P, and N/P, respectively. C: Carbon; N: nitrogen; P: phosphorus. Note: Different capital letters indicate significant differences between restoration types at the same depth (p < 0.05). And different lowercase letters indicate that there are significant differences between different soil depths under the same restoration types (p < 0.05).
Nitrogen 07 00025 g002
Figure 3. Correlation relationships between soil stoichiometry and environmental factors in the soil profile. (ac) are correlation coefficients of OD-CM, BP, and LP in the soil profile, respectively. C: Carbon; N: nitrogen; P: phosphorus; AN: available nitrogen; AP: available phosphorus; AK: available potassium; pH: soil pH; SBD: soil bulk density; SWC: soil water content; thickness: soil thickness.
Nitrogen 07 00025 g003
Figure 4. Redundancy analysis of soil stoichiometry and environmental factors in soil profile. (ac) are the RDA results in the soil profile under OD-CM, BP, and LP, respectively. C: Carbon; N: nitrogen; P: phosphorus; AN: available nitrogen; AP: available phosphorus; AK: available potassium; pH: soil pH; SBD: soil bulk density; SWC: soil water content; thickness: soil thickness.
Nitrogen 07 00025 g004
Figure 5. Comparison of soil stoichiometry between three near-natural restoration types (OD-CM, BP, and LP) and tree plantations (PS and RP). (ac) show the C, N, and P distribution profiles of the respective soils; (df) show the distribution profiles of the C/N, C/P, and N/P ratios of the respective soils. C: Carbon; N: nitrogen; P: phosphorus. Note: Data of PS and RP were from [58], and the mean values of China were from [48].
Nitrogen 07 00025 g005
Table 1. Quadrat information.
QuadratAlt (m)Slope (°)Slope Direction (°)Slope ShapeThickness (cm)
OD-CM1162318North 15constant slope29
OD-CM2162525Northeast 32constant slope63
OD-CM3162931Northeast 40constant slope60
BP119179Northeast 66concave slope71
BP218635North 4constant slope107
BP3183622North 17constant slope88
LP1186926Northwest 325concave slope53
LP2187523Northwest 331concave slope47
LP3184823Northwest 341concave slope68
Table 2. ANOVA results of soil stoichiometry affected by restoration types (R), depth (D), and their interactions.
CNPC/NC/PN/P
FR11.05614.3883.81910.6799.12821.139
D97.96390.11291.4873.0231.4674.680
R × D5.3996.5624.7540.6614.8972.553
PR<0.001 ***<0.001 ***0.026 *<0.001 ***<0.001 ***<0.001 ***
D<0.001 ***<0.001 ***<0.001 ***0.0860.2300.034 *
R × D0.007 **0.002 **0.011 *0.5190.010 *0.085
Partial η2R0.2320.2830.0950.2260.2000.367
D0.5730.5520.5560.0400.0200.060
R × D0.1290.1520.1150.0180.1180.065
Note: * represents p < 0.05; ** represents p < 0.01; *** represents p < 0.001.
Disclaimer/Publisher’s Note: The statements, opinions and data contained in all publications are solely those of the individual author(s) and contributor(s) and not of MDPI and/or the editor(s). MDPI and/or the editor(s) disclaim responsibility for any injury to people or property resulting from any ideas, methods, instructions or products referred to in the content.