Article

Greater Application of Nitrogen to Soil and Short-Term Fumigation with Elevated Carbon Dioxide Alters the Rhizospheric Microbial Community of xTriticocereale (Triticale): A Study of a Projected Climate Change Scenario

by
Kritika Adesh Gadpayle
1,2,†,
Namita Das Saha
3,*,†,
Ranjan Bhattacharyya
3,* and
Madan Pal
4
1
School of Environment and Sustainable Development, Central University of Gujarat, Gandhinagar 382030, Gujarat, India
2
Center for Study of Science, Technology and Policy, Bangaluru 560094, Karnataka, India
3
Centre for Environment Science and Climate Resilient Agriculture (CESCRA), ICAR-Indian Agricultural Research Institute, New Delhi 110012, Delhi, India
4
Division of Plant Physiology, ICAR-Indian Agricultural Research Institute, New Delhi 110012, Delhi, India
*
Authors to whom correspondence should be addressed.
These authors contributed equally to this work and both are to be considered as the first author.
Nitrogen 2025, 6(3), 67; https://doi.org/10.3390/nitrogen6030067
Submission received: 19 January 2024 / Revised: 11 March 2025 / Accepted: 25 March 2025 / Published: 14 August 2025
(This article belongs to the Special Issue Nitrogen Cycling and Bacterial Community)

Abstract

An attempt was made to understand the interactive consequences of subjecting a rhizospheric microbial community of xTriticocereale (Triticale) to higher CO2 levels and soil nitrogen addition in the short term in a tropical agro-ecosystem. Open-top chambers (OTCs) were used to grow the test crops for a single season under ambient CO2 (AC) and elevated CO2 (EC) along with two variable N dosages: recommended (N0: 0.053 g N/kg of soil) and high (N2: 0.107 g of N/kg of soil) levels. Variations in the composition of microbial communities and abundances were investigated using phospholipid fatty acid analysis (PLFA). A significantly (p < 0.001) increased microbial biomass content (MB) was observed under EC compared to AC, while the addition of N had a minor effect. A decreased fungi/bacteria (F/B) ratio (~38%) was observed with high N application in the CO2 enrichment treatment. Bacteria were more abundant, while fungal abundance decreased under N2 and EC. Gram (+ve) bacteria used these conditions to thrive under N2 and EC, while Gram (−ve) bacteria declined. No significant effects on actinomycetes were noticed in any of the treatments. However, eukaryotes acquired more benefits and flourished in response to EC. Varied responses were noted for the Shannon diversity index (H’) under EC. Overall, (i) bacteria (Gram-positive) and eukaryotes dominated under EC and high N addition, while fungi decreased, and (ii) EC and high levels of N addition did not affect actinomycetes. Short-term exposure under the given conditions was found to alter the rhizospheric microbial community. However, multiple season studies are needed to elucidate whether these short-term responses are transient or continuous.

1. Introduction

Cumulative net CO2 emissions from 1850 to 2019 were 2400 ± 240 GtCO2. More than half (58%) of these emissions occurred between 1850 and 1989 [1400 ± 195 GtCO2], and about 42% of emissions occurred between 1990 and 2019 [1000 ± 90 GtCO2]. Global net anthropogenic GHG emissions were estimated at 59 ± 6.6 GtCO2-eq in 2019, which is about 12% (6.5 GtCO2-eq) higher than in 2010 and 54% (21 GtCO2-eq) higher than the levels in 1990 [1]. The climate is clearly changing, with 40% increases in carbon dioxide (CO2) concentrations reported; compared to concentrations of 280 ppm during the pre-industrial era in 1850, this increased up to 422 ppm by December 2023 [2]. It is challenging to predict the responses of the biosphere against future CO2 levels, as there are several gaps regarding our knowledge of this subject. Although sufficient work has been performed on aboveground responses, detailed information about soil belowground in terms of microbiome composition, function, and soil C and N bio-geochemical processes is still sparse [3].
Many studies have validated the fact that EC has a stimulating effect on a plant’s growth and photosynthesis [4]. As the CO2 concentration in soil is much higher than in the atmosphere, the direct consequences of EC on soil-dwelling microbes are trivial compared to the indirect effects attenuated by plants [5]. There are two different views regarding the indirect effect of EC on soil microbial communities. Some researchers [6] claim that EC can effectuate soil carbon loss, which is considered positive feedback, while others [7] maintain that it can sequester C in soil, which is considered negative feedback.
The experimental evidence proves that EC conditions alter the chemical properties of litter, which may be the reason behind the decelerated rate of carbon and nitrogen cycling [8,9]. It is also the cause behind the slow rate of decomposition of organic matter [10] or another process, i.e., the immobilization of nutrients by microbes. In opposition to this, Hungate et al. (1997) reported on the enhanced rates of C and N transformations under EC that provide evidence for a +ve feedback reaction in the C and N dynamics in soil and ultimately lead to enhanced plant growth under EC [11].
Nitrogen, which is a key player in regulating many biological and chemical responses, causes both direct and indirect repercussions on the microbial community. Globally, terrestrial ecosystems have been experiencing unprecedented reactive nitrogen (N) depositions for many decades, which is expected to further increase by ~2.5 times in the present century [12]. Additionally, agricultural practices add large amounts of N into the soil with the intention of achieving more production. Any alterations in N availability in soil regulate the quantity and quality of carbon inputs, which are ultimately associated with an alteration in microbial physiology and compositional aspects [13]. Broadly, these indirect drivers can affect microbial activities. Furthermore, the progressive N limitation (PNL) effect under EC can be alleviated by adding N to the soil [14].
Limited information exists on the bilateral consequences of climate change drivers and other components of the environment on soil microbiomes, especially in sub-tropical agro-ecosystems. Also, our present knowledge is limited to how N undergoes rhizodeposition through plant roots to the soil under EC and its ensuing metabolism by soil-dwelling microbes.
Plant/crop type is another dimension that determines microbial community structures. Many scientific reports are available that explain that plants encourage some specific communities in their rhizospheric zones [15]. “xTriticocereale (Triticale)” is the first successful crossover between wheat (Triticum aestivum L.) and rye (Secale cereal L.), resulting in the birth of a hybrid called xTriticocereale (Triticale). It was developed at the end of the 19th century, and the goal behind this was to gather the positive points of wheat (with the highest yield potential amongst all cereals and good nutritional value) and rye (with strong resistance) to make them expressive in a single plant. As a food crop, xTriticocereale (Triticale) has already been considered a hardy and fit crop, and it is expected to play a significant role in the food of impoverished populations. Thus, xTriticocereale (Triticale) was chosen as the perfect candidate to carry out this study, since it has advantages in both listed crops.
In the present investigation, we assessed the consequences of the short-term subjection of experimental EC and additional N inputs to hypothesized changes that may occur at the compositional level of existing microbial communities of the rhizosphere of xTriticocereale (Triticale). Our hypothesis behind this experiment was as follows: (i) EC alone and in interaction with additional N change the composition of microbial communities in the rhizosphere of the test crop. We also attempted to test, during short-term exposure to both EC and high N, which factor is most dominant in governing microbial compositions.

2. Materials and Methods

2.1. Experimental Site

A pot experiment was conducted growing xTriticocereale (Triticale) as the test crop inside open-top chambers (OTCs) for the experimental elevation of CO2 levels. The crop was grown around mid-November, and the experiment was conducted at the research farm of the Indian Agricultural Research Institute, New Delhi (Latitude: 28°35′ N; Longitude: 77°12′ E; and Altitude: 228.16 m above mean sea level). The climate of the experimental site is semi-arid and sub-tropical. The annual average rainfall is 710 mm, and the mean daily maximum and minimum air temperatures during the wheat growing season (mid-November to end of March) vary between 10 and 29 °C and 2–12 °C. The soil is sandy loam in texture and belongs to the Typic Haplustept soil subgroup of the upper Indo-Gangetic Plains. The sand, silt, and clay contents were 68.8%, 19.0%, and 12.2%, respectively. The initial physico-chemical properties of the soils that were used to fill the pots are presented in Table 1.

2.2. Open-Top Chamber Experiment Details

The OTCs were fabricated using an aluminum frame and lined with a PVC plastic sheet of 1.2 mm thickness, which transmits 90% of sunlight. It is permeable to all three ranges of UV light. The dimension of each OTC was as follows: a diameter of 3 m and a height of 2.5 m. The upper part of each OTC has a truncated and open cone of 0.5 m, set at a height of 2.5 m to alleviate any possible dilution of CO2 via an air current, and the top was kept open to maintain a near-natural microenvironment inside the chamber. The schematic sketch of OTC is presented in Figure 1. The solenoid valve and PV tubing surrounding the OTCs were fabricated to release pure CO2 gas (99.7% (v/v) CO2) from a commercial-grade cylinder fitted with a regulator (DURA; make: ESAB, India). In two OTCs, a level of 580 ± 20 µmol mol−1 CO2 (between 09:00 h and 17:00 h) was maintained for elevated CO2 treatment (EC). As OTC is also expected to vary in micro-environmental parameters a bit, we used two other chambers as chamber controls, but without any external supply of CO2 (this was considered an ambient treatment and the average level of CO2 was recorded at 384 ± 13 µmol mol−1 during the experiment), and two OTCs with CO2 elevation. Inside each OTC, pot replication was 25. At a one-hour interval, the CO2 levels were monitored using sensors fitted inside the OTCs.

2.3. Crop Management and Treatments

xTriticocereale (Triticale) was grown in pots inside OTCs, and each pot was filled with 5 kg of soil. Twenty-five pots were placed inside each OTC, and every treatment was allocated three replicates. The normal recommended basal dose of mineral fertilizers was mixed in the soil prior to sowing. For N, Urea was applied, and two levels of N treatment along with two different CO2 treatments were administered (Table 2). Three split doses for N application were followed, including 50% basal, 25% at the crown root initiation (CRI) stage, and 25% at the reproductive stage. Higher N doses were applied for the latter two split doses during the crown root initiation (CRI) and flowering stage.

2.4. Soil Sampling

Rhizospheric soil was sampled at the anthesis stage (85 days after sowing) from all treatments in three replicates. Root-entangled soil particles were brushed and collected separately for different treatments and replications. Furthermore, the soil samples were sieved through a 2 mm mesh sieve to ensure they were root- and plant-debris-free. A set of subsamples was stored at −20 °C until further PLFA was performed.

2.5. Soil Microbial Composition/Structural Analysis UsingPhospholipid Fatty Acid (PLFA) Composition and Content

The PLFA of rhizospheric soil samples was carried out by extracting phospholipids from processed soil samples and subsequent hydrolysis. The fatty acids were then analyzed using GC-MS following the protocol given by Buyer and Sesser (2012) [16]. The major steps, given in brief, are as follows: i. drying the sample and extracting the lipid phase using a Bligh–Dyer extractant; ii. Elution of phospholipids using solvents and further drying in a centrifugal evaporator; iii. Transesterification of phospholipids and dissolving into hexane; iv. Analysis through the Agilent 6890 gas chromatograph (GC); and v. Identification of fatty acid methyl esters (FAMEs) using the MIDI PLFAD1 calibration mix and naming table. Individual PLFA values were expressed as nmoles g−1 soil. vi. Nomenclature of PLFAs was performed following the classification given by Zelles (1999) [17]. The bacterial-specific PLFAs were i15:0, a15:0, i16:0, 16:1ω7c, 16:1ω9c, 10Me16:0, i17:0, a17:0, cy17:0, 17:0, 18:1ω7c, and cy19:0a [18,19]. For saprophytic fungi biomarkers, 18:1ω9c and 18:2ω6 were used [20]. The amount of arbuscular mycorrhizal (AM) fungi was measured through the abundance of the 16:1ω5c fatty acid biomarker [21]. Total microbial biomass (MB) was derived by calculating the cumulative sum of all fatty acids detected in each sample.

2.6. Shannon–Weiner Diversity Index (H’)

The H’ index is a mathematical tool for measuring species diversity in an ecosystem for a given community. H’ was calculated following the method of Kaur et al. 2005 [22].

2.7. Statistical Analysis

The influence of elevated CO2 and microbial attributes was determined using analysis of variance (ANOVA) and a Completely Randomized Design (CRD) with two factorial analyses. Two levels of atmospheric CO2 (ambient and elevated) and two levels of N (normally recommended and higher doses) were considered fixed effects for this model. All data were analyzed through Genstat 12th Edition for one-way ANOVA, and significance was accepted at p ≤ 0.05.

3. Results

3.1. Microbial Biomass Content (MBC) During CO2 Enrichment and Differential Doses of Nitrogen Application Experiment of xTriticocereale (Triticale)

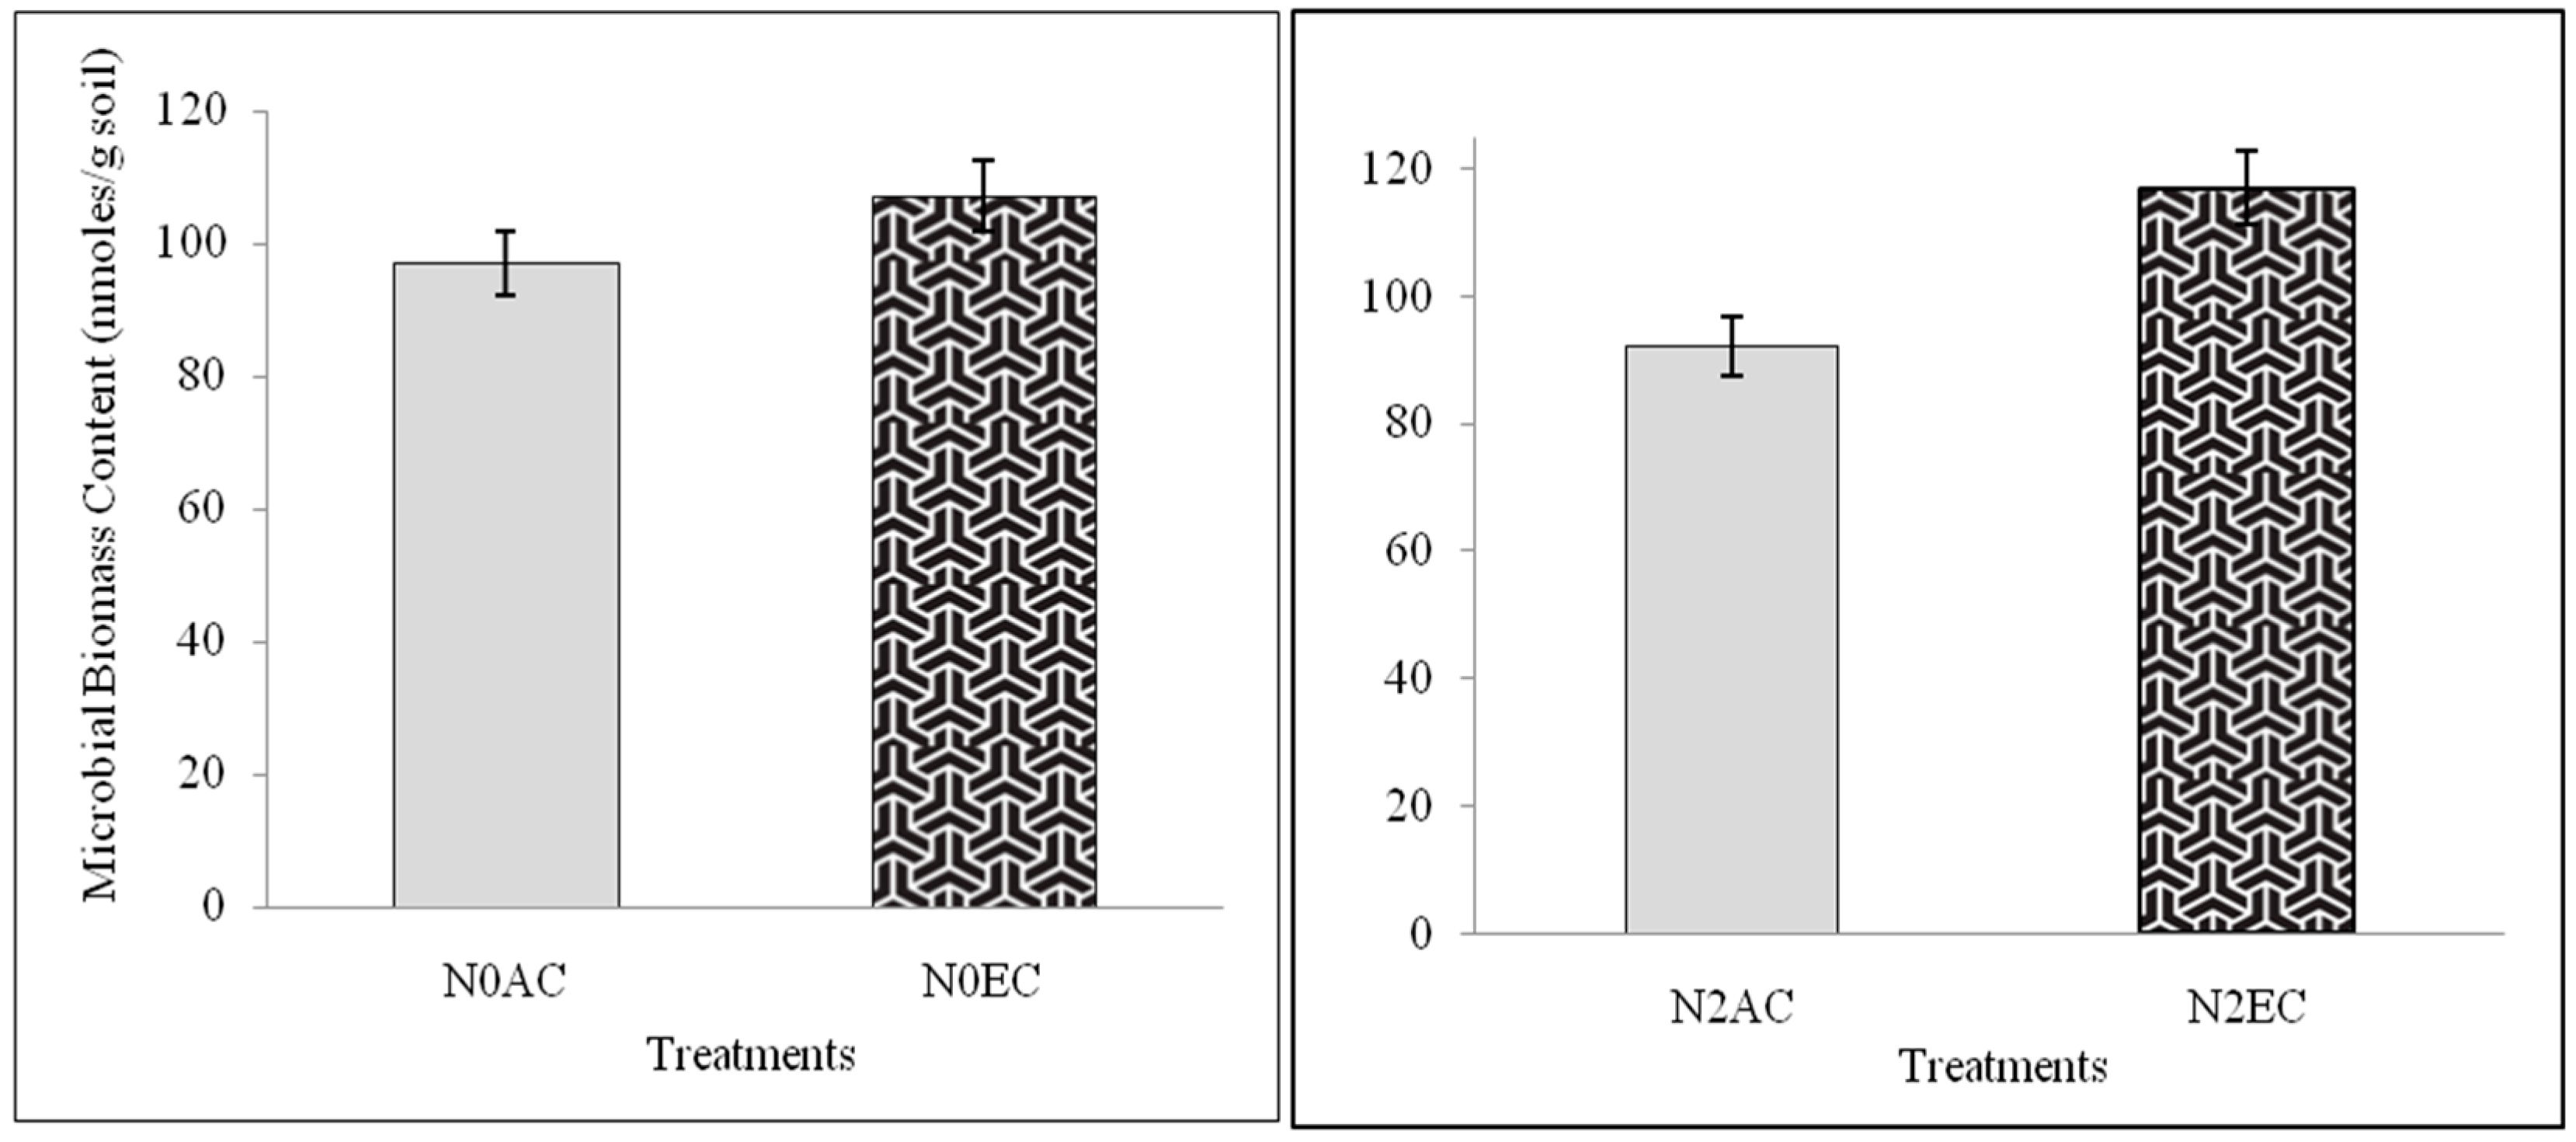
Elevated CO2 (EC) levels significantly (p < 0.001) increased the microbial biomass content under both N treatments. At N0, an increase of ~5.9% was recorded, while for N2, an increase of ~28.3% was observed under EC compared to AC. Among all the treatments, the highest biomass content of 112.9 nmoles·g−1 soil was observed under N2 at EC, and the lowest content was found under N0 at an AC of 96 nmoles·g−1 soil (Table 3; Figure 2).

3.2. Phospholipid Fatty Acid (PLFA) Profiles Affected by CO2 Enrichment and Differential Doses of Nitrogen Application in xTriticocereale (Triticale)

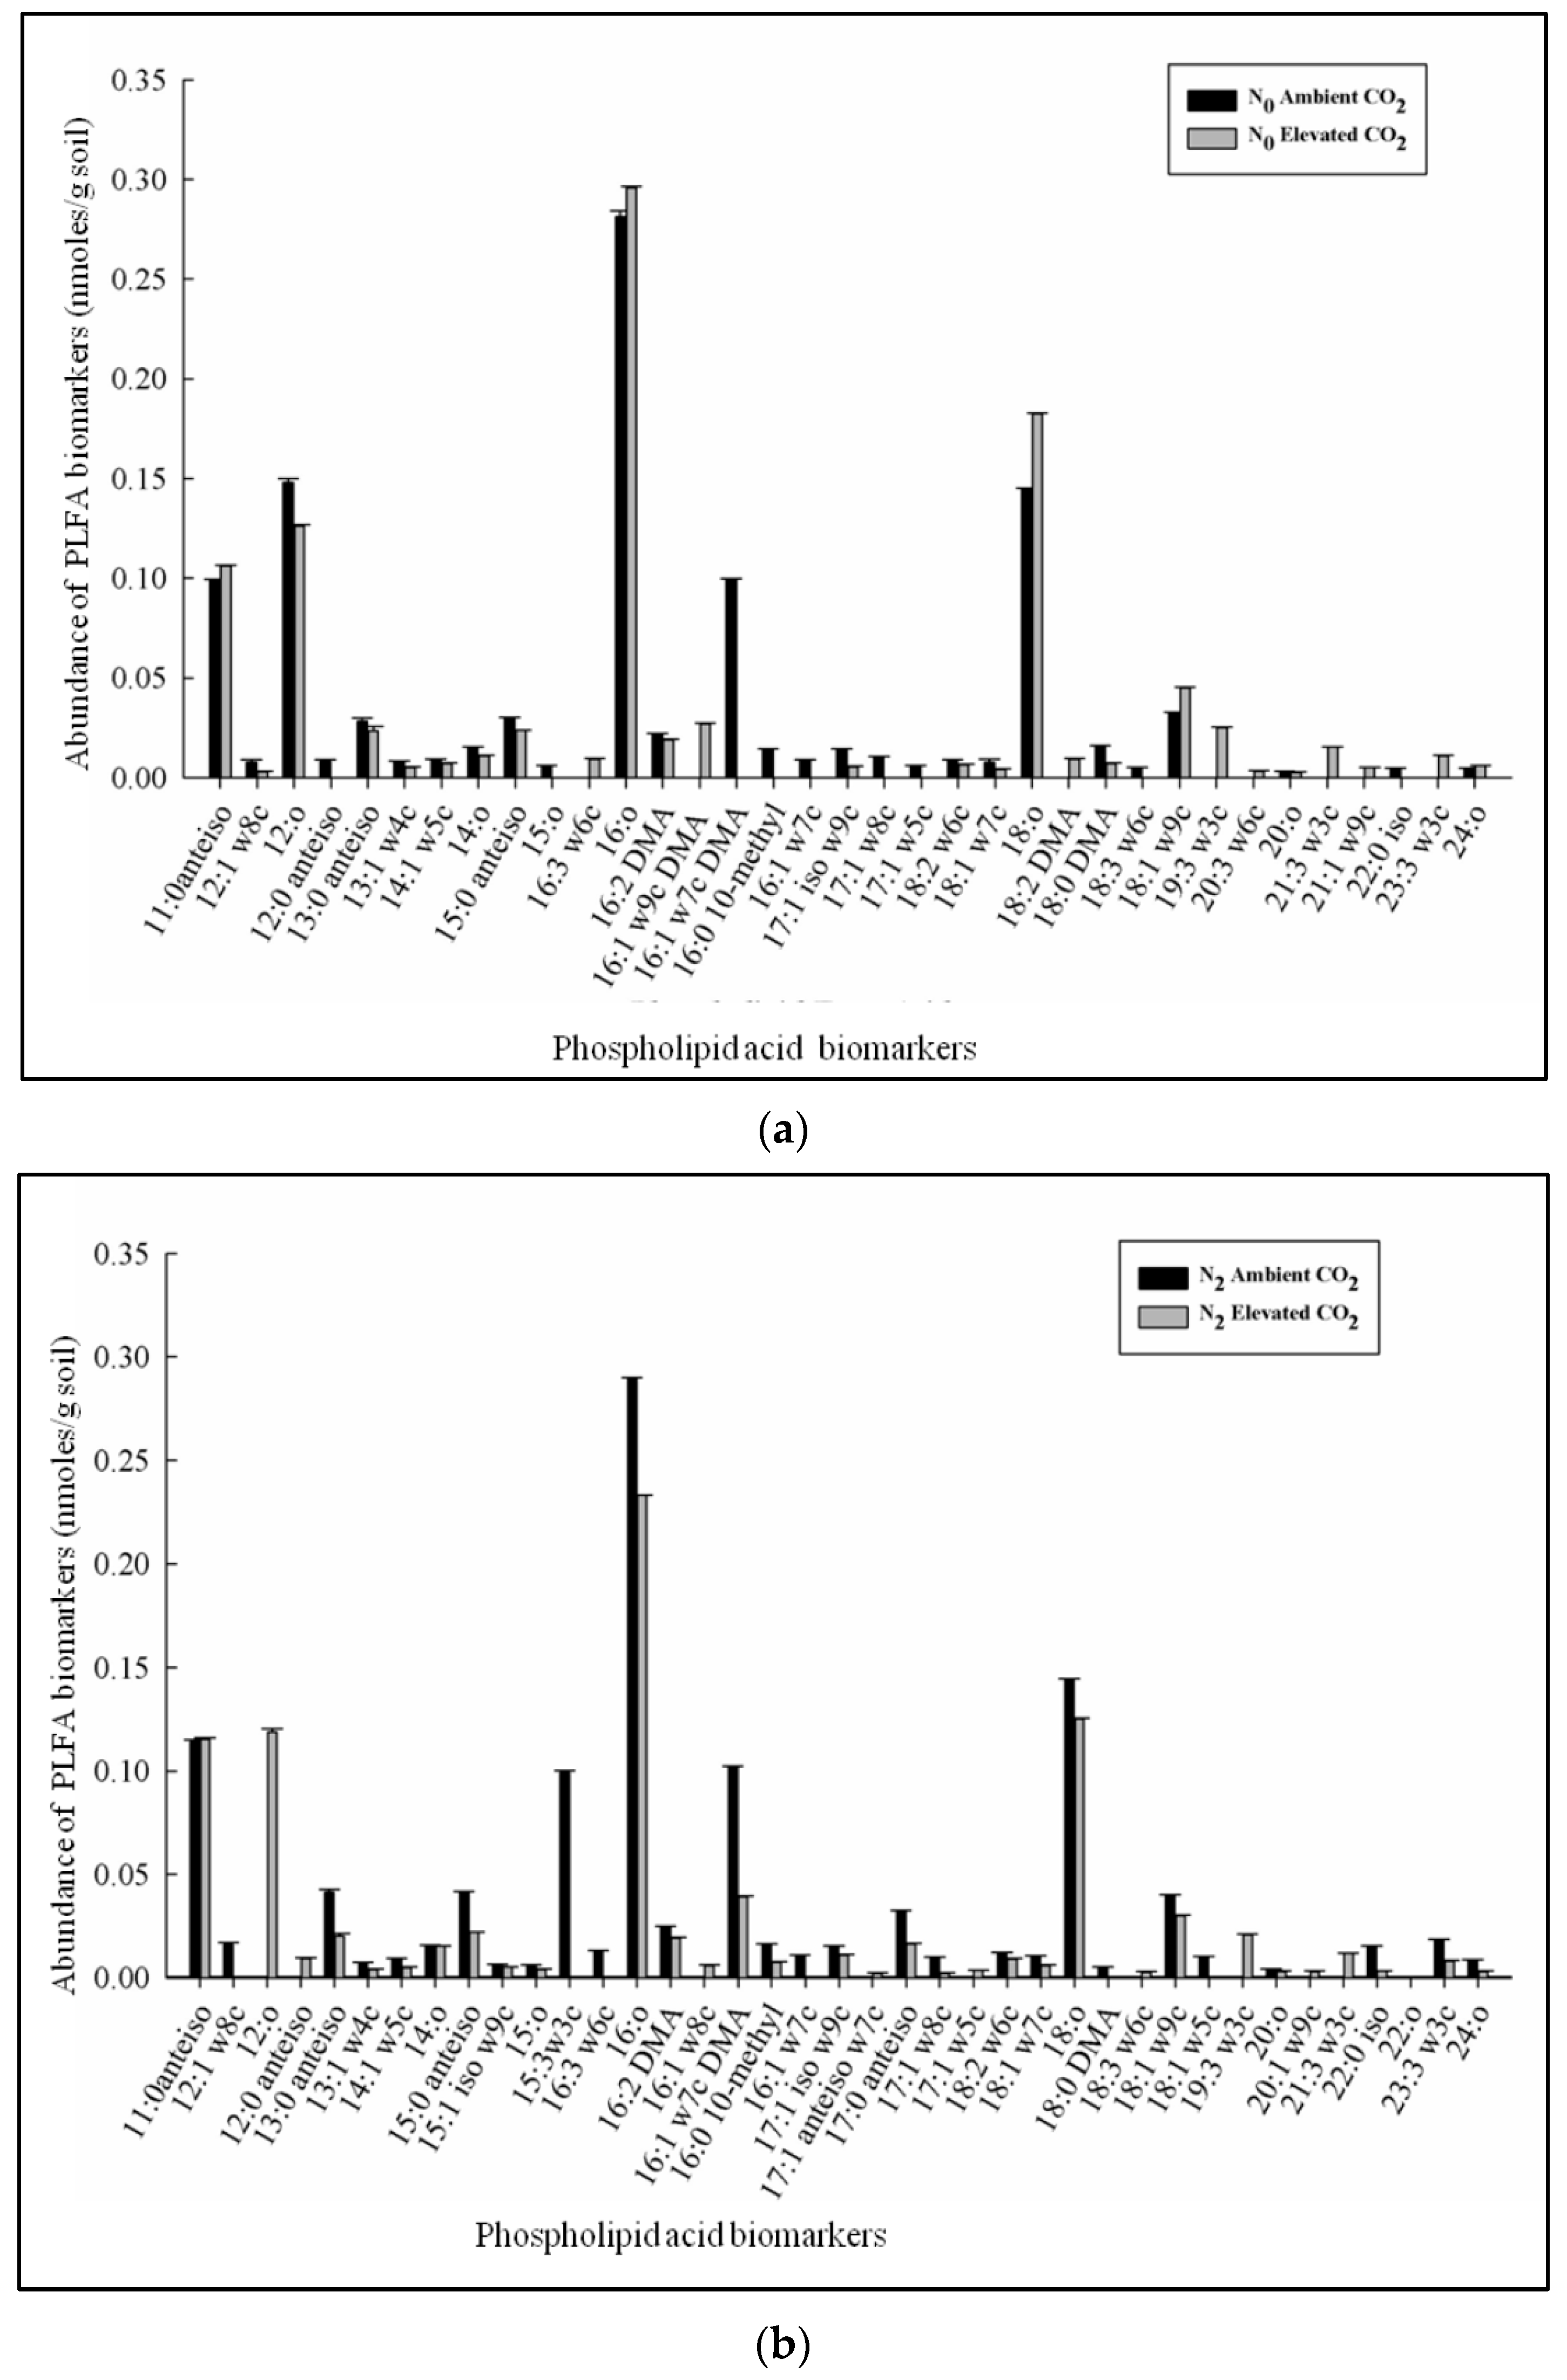
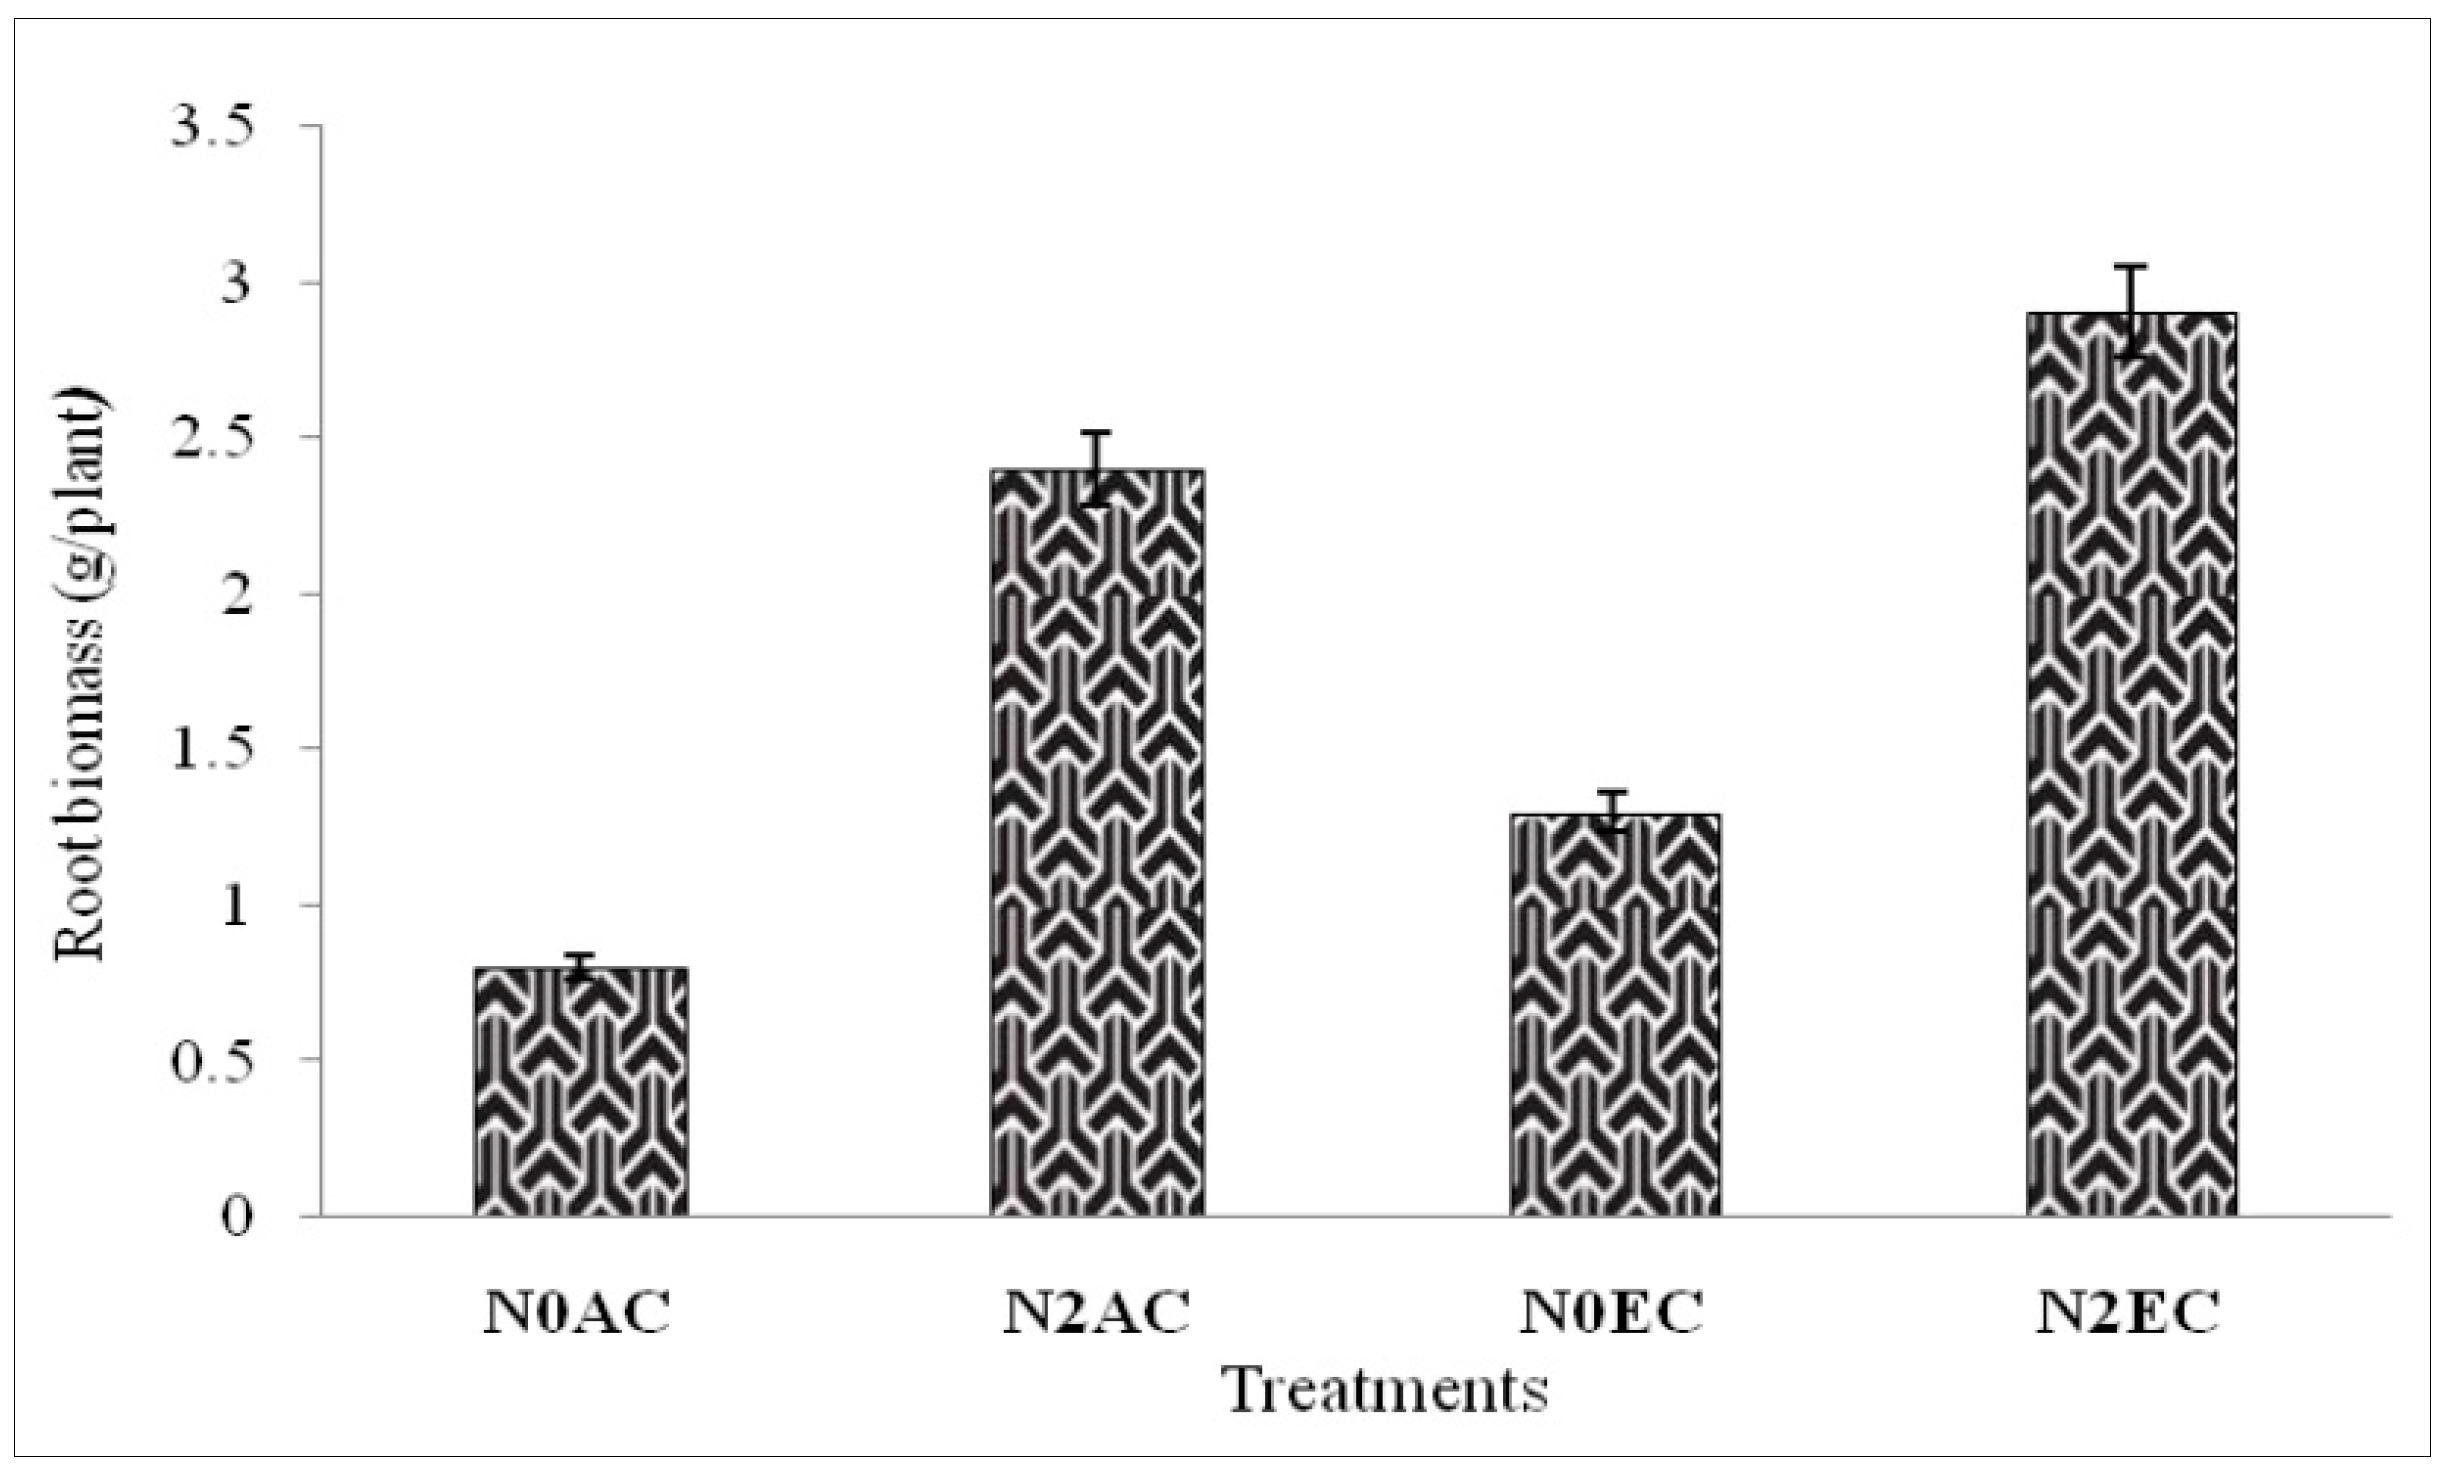
The PLFA content varied under N0 at both AC and EC. A total of 35 PLFAs were detected, and the concentration of seven PLFAs (out of 35 PLFAs) increased significantly (p < 0.001) under EC; no significant effect was observed under AC (Figure 3a). Soil with higher nitrogen (N2) depicted an increase in the total number of PLFAs at both AC and EC compared to N0 (Figure 3b). Root biomass also followed a similar pattern of responses. Maximum root biomass was observed under N2EC, and the minimum root biomass was found in N0AC (Figure 4). At higher doses of nitrogen (N2), concentrations of ten PLFAs and 6 PLFAs significantly increased in EC and AC, respectively. At the N0 level, contents of the bacterial PLFA i16:0 increased under EC, but the contents of fungal PLFA 18:2ω6c and 18:1ω7c decreased. The biomarker for anaerobe 16:1ω9c DMA increased at EC with the N0 level. PLFA contents of biomarkers for Gram-positive bacteria were higher than those of Gram-negative PLFA biomarkers at EC. The N2 level indicated the presence of a biomarker for methanobacteria 16:1ω8c at EC; bacterial PLFA at 17:0 anteiso; and the Gram-negative bacterial PLFA biomarker 18:1ω5c at AC. However, these were not detectable under N0 treatment. Anaerobes and fungal biomarkers were present, but their concentration dropped at EC compared to AC under N2.

3.3. Fungal/Bacterial Ratio Affected by CO2 Enrichment and Nitrogen Application in xTriticocereale (Triticale)

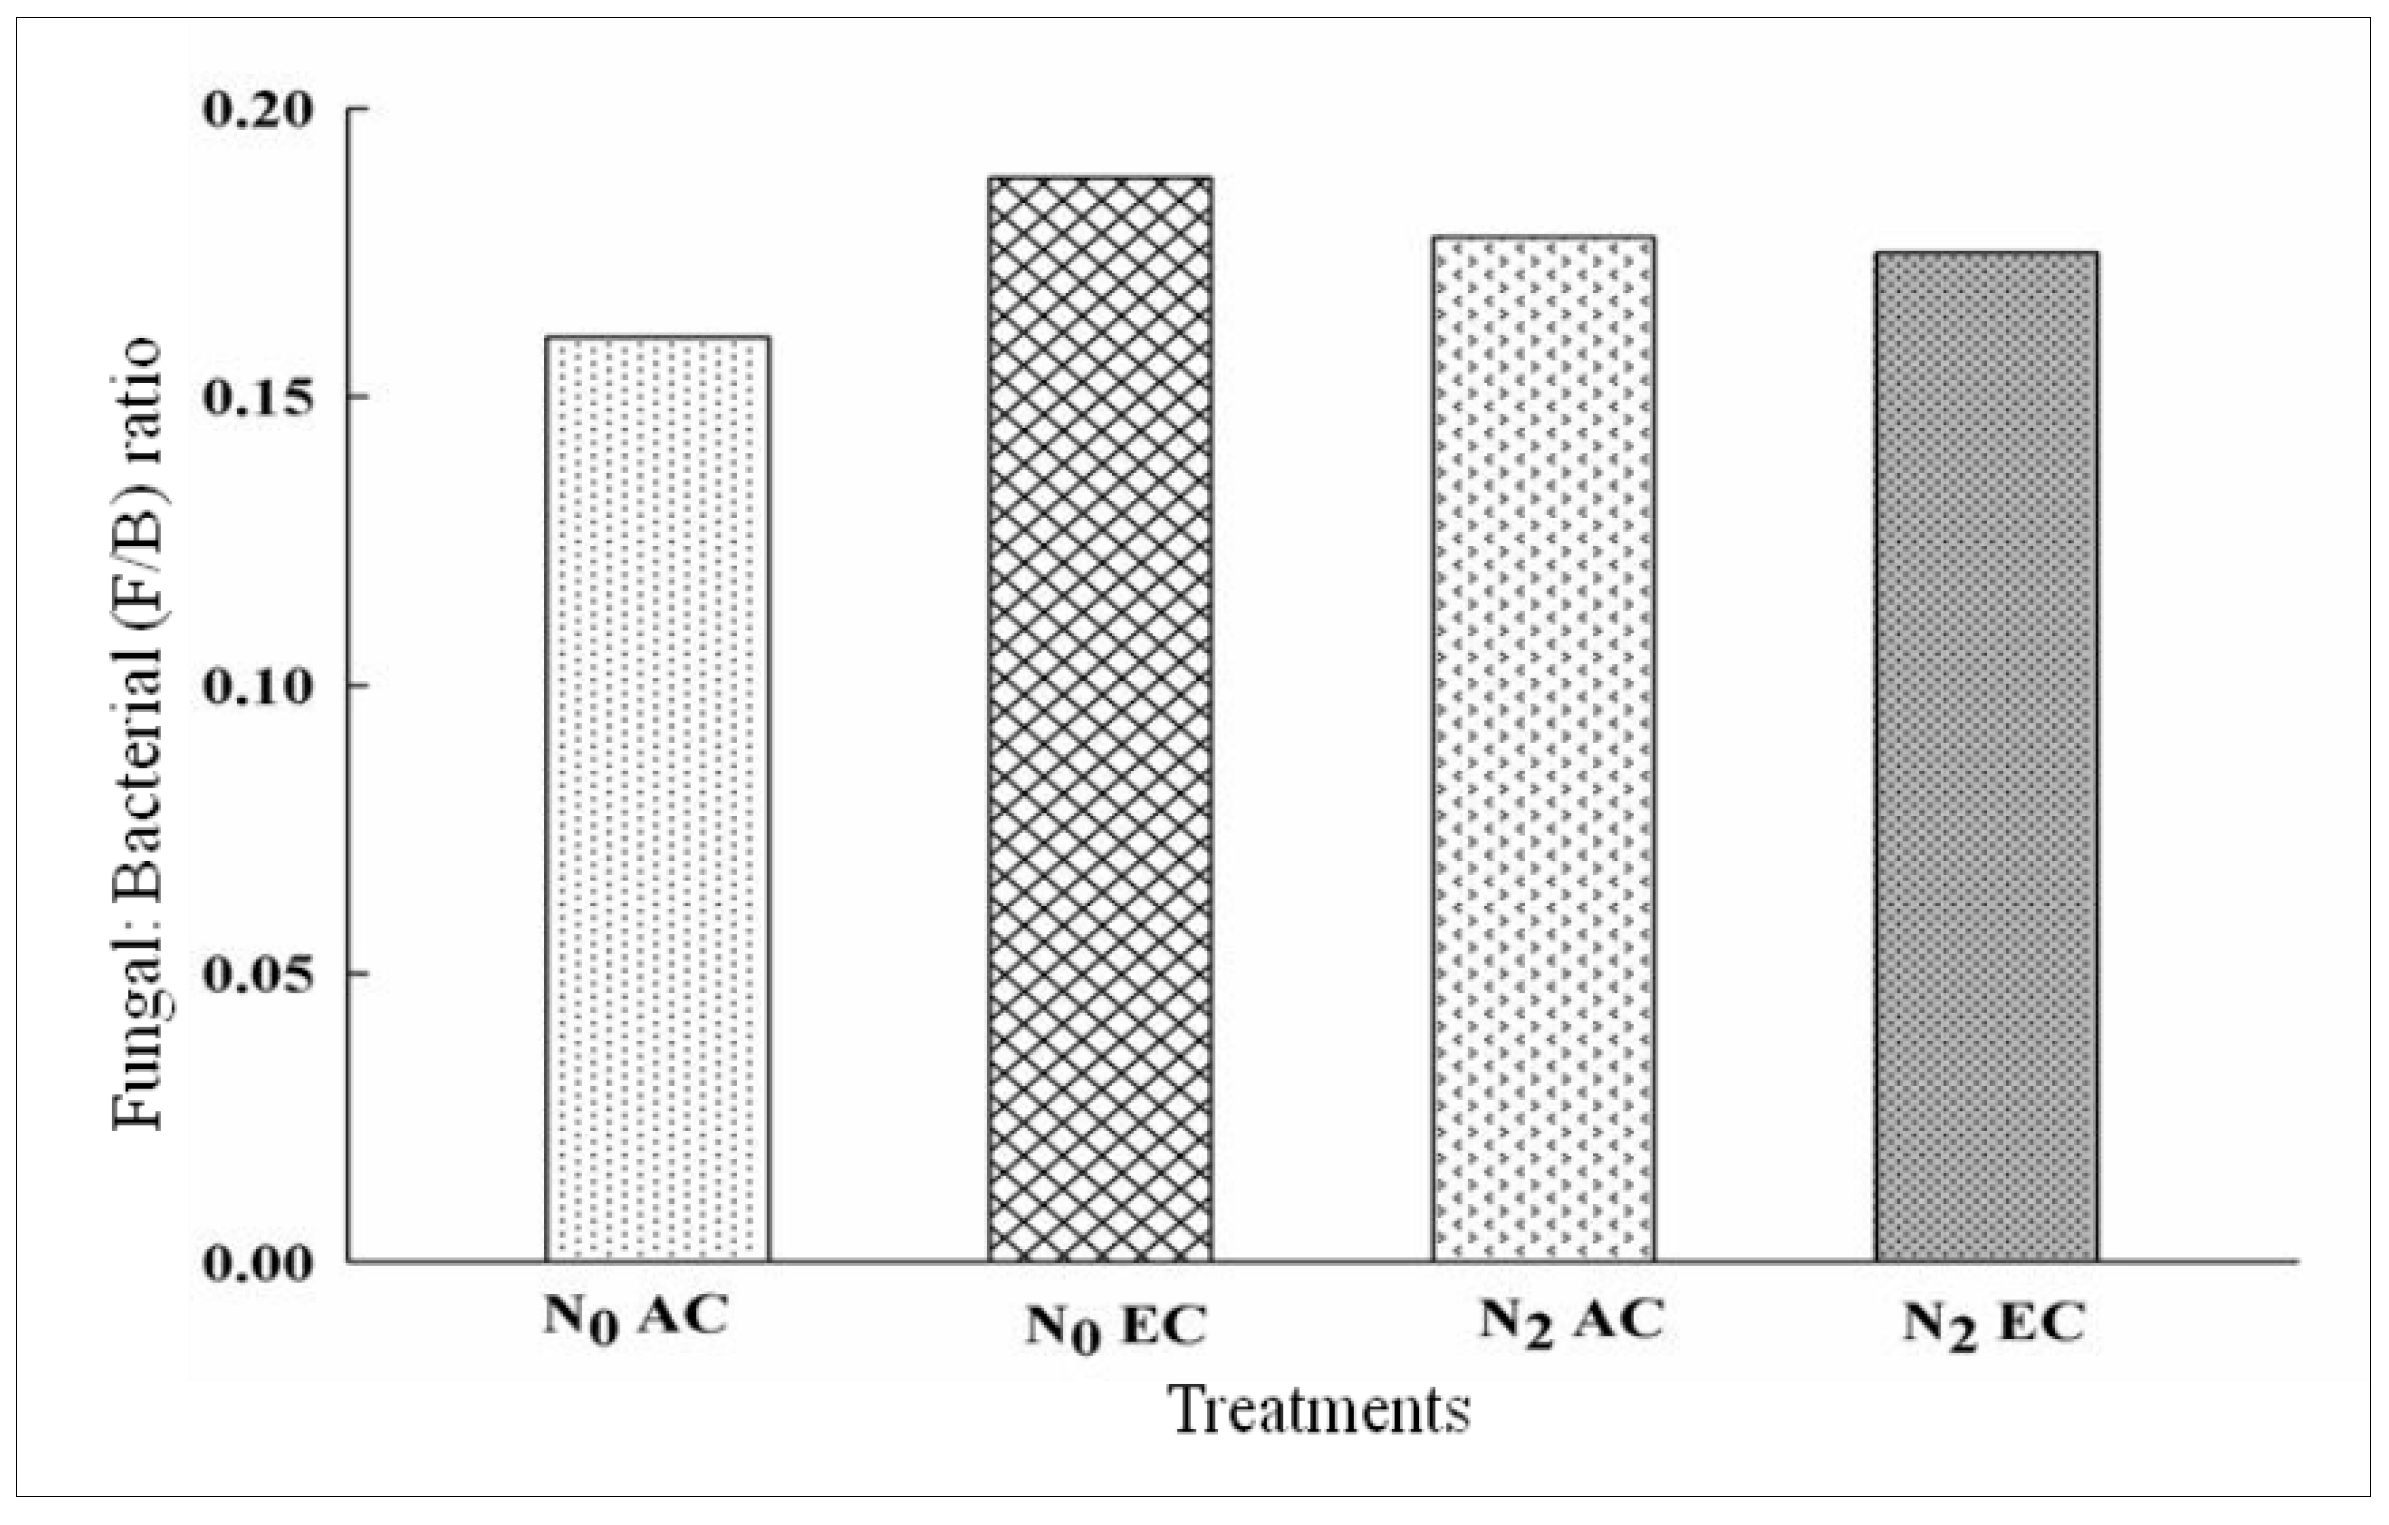
The fungal-to-bacterial ratio showed opposite trends under EC at N0 and N2 levels. Fungal abundance decreased in N2EC. The PLFA biomarkers specific to fungal community (18:1ω9c and 18:2ω6) showed a declining trend under EC; their abundance decreased underN0EC treatment by ~14%, while at N2EC, their abundance decreased further by ~38%. At N0AC, the ratio was 0.16, while it increased to 0.19 at N0EC (p < 0.05). On the other hand, forN2, the double dose of nitrogen application had no effect on this ratio (Table 3, Figure 5).

3.4. Responses in Gram Positive and Gram Negative Bacterial Distribution in CO2 Enrichment and Differential Doses of Nitrogen Application in xTriticocereale (Triticale)

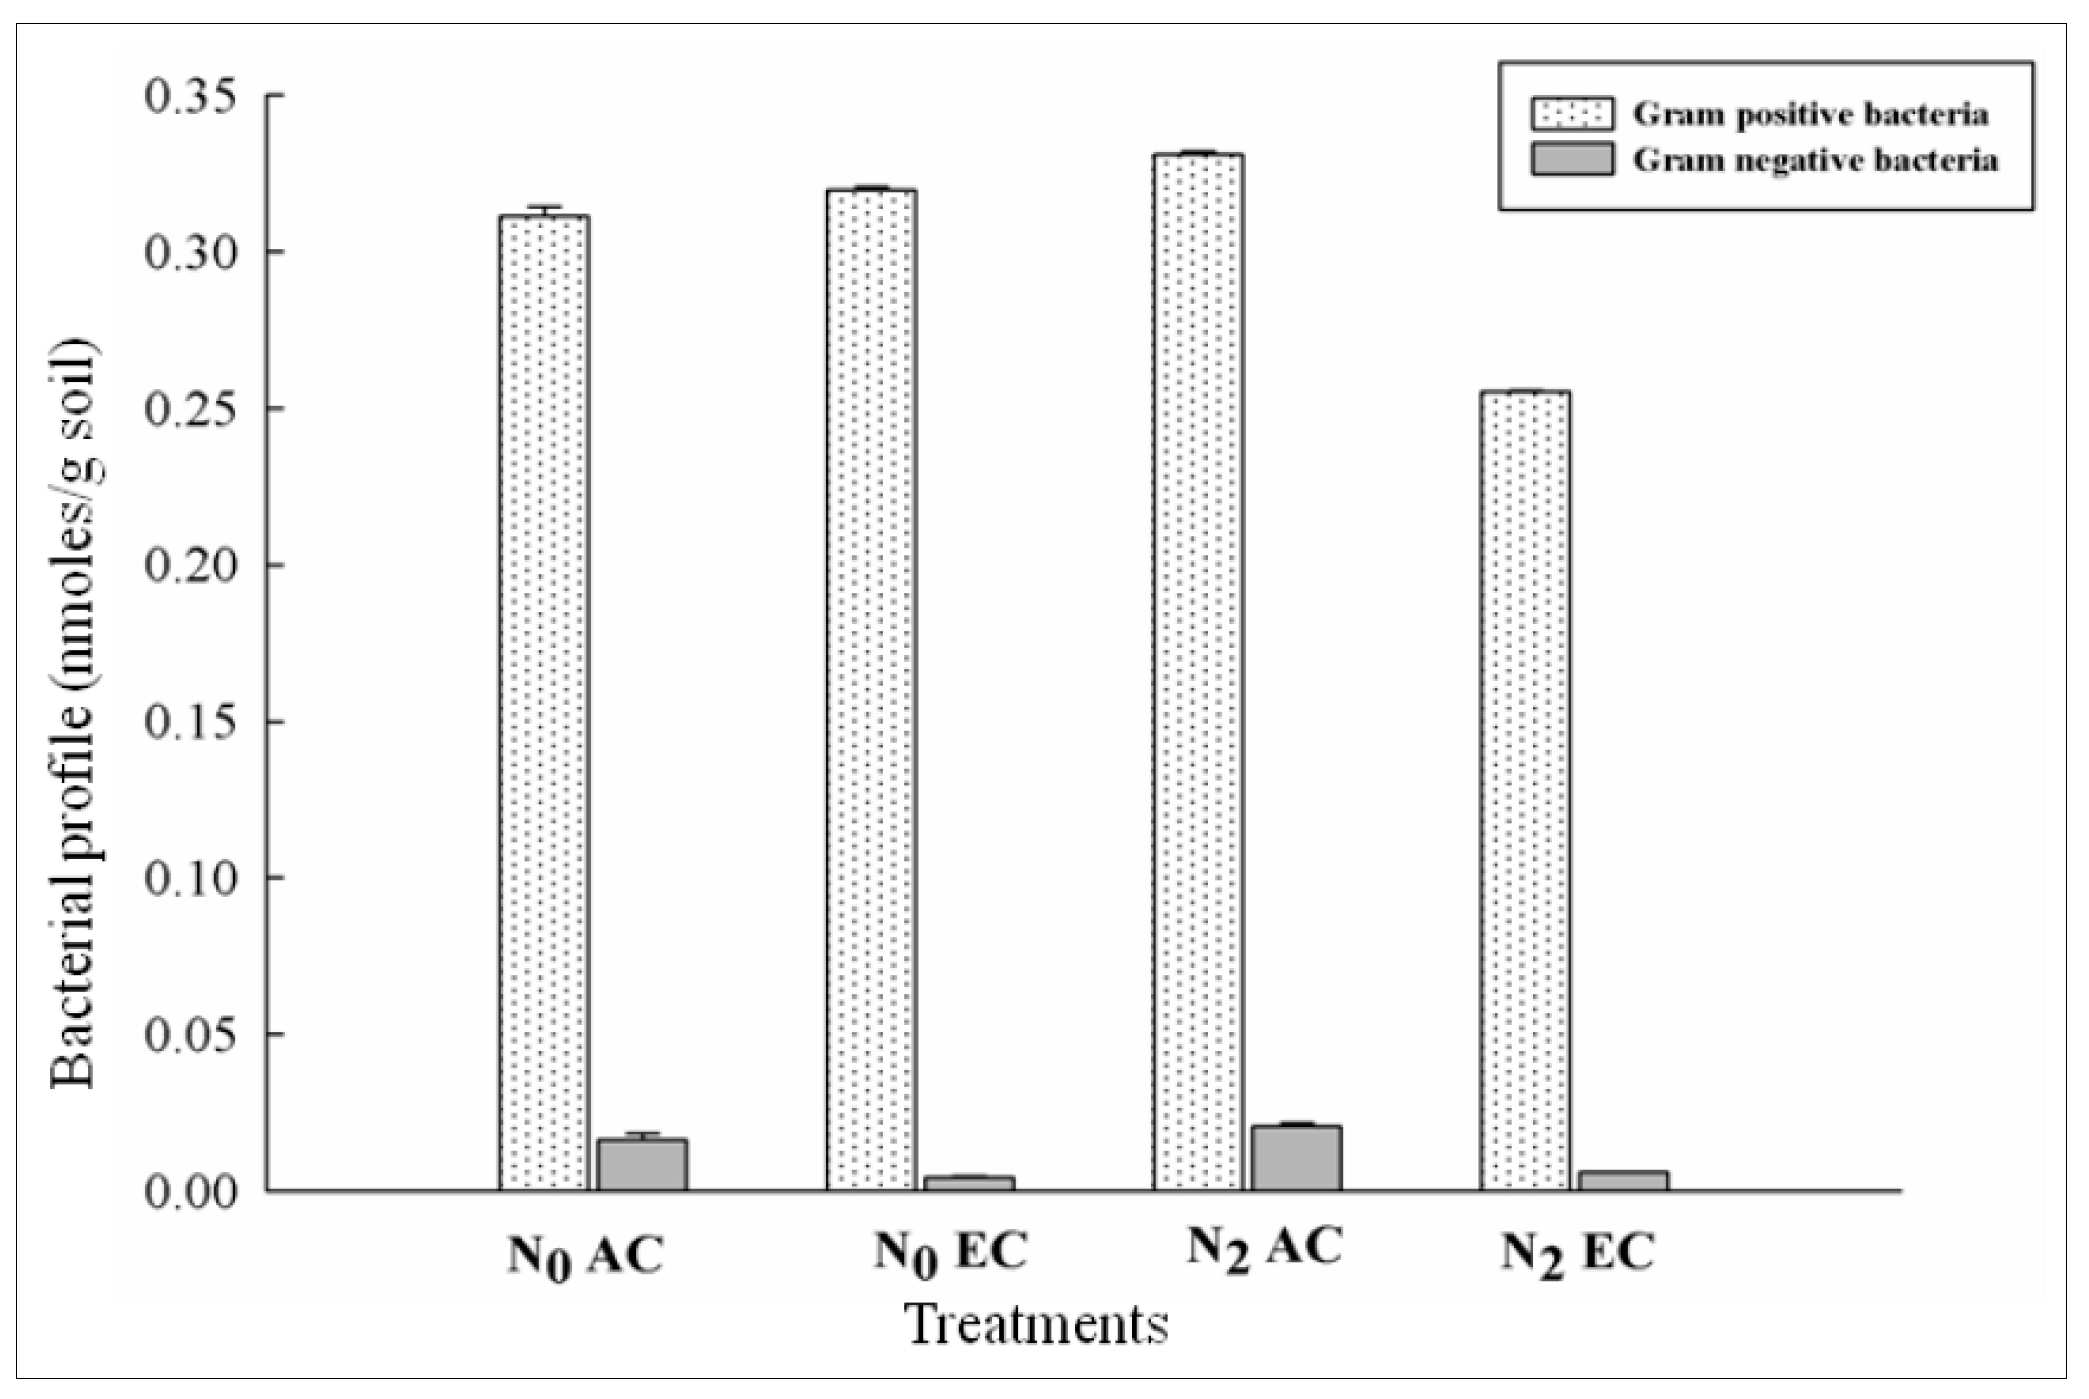
Bacterial distributions in terms of Gram (−ve) and Gram (+ve) bacteria were studied using PLFA biomarkers (Figure 6). Gram negative biomarkers (16:1ω7c and 18:1ω7c) and Gram-positive biomarkers (15:0 anteiso; 16:0 and 17:0 anteiso) varied in the peak area. The peak area of Gram negative bacteria decreased with the addition of N, but that of Gram positive bacteria increased with N application. In rhizospheric soil samples of N0, no significant change in the population of Gram (+ve) bacteria could be observed under both AC and EC. However, the population of Gram (−ve) bacteria significantly (p < 0.001) decreased at N0EC compared to N0AC. At the N2 level, similar patterns of response were observed in terms of suppression of Gram-negative bacteria under EC conditions compared to AC. Overall, in both N levels (N0 and N2), elevated CO2 was found to have negative impacts on the Gram-negative bacterial population.

3.5. Shannon–Weiner Diversity Index (H’) as Influenced by CO2 Enrichment and Differential Doses of Nitrogen in xTriticocereale (Triticale)

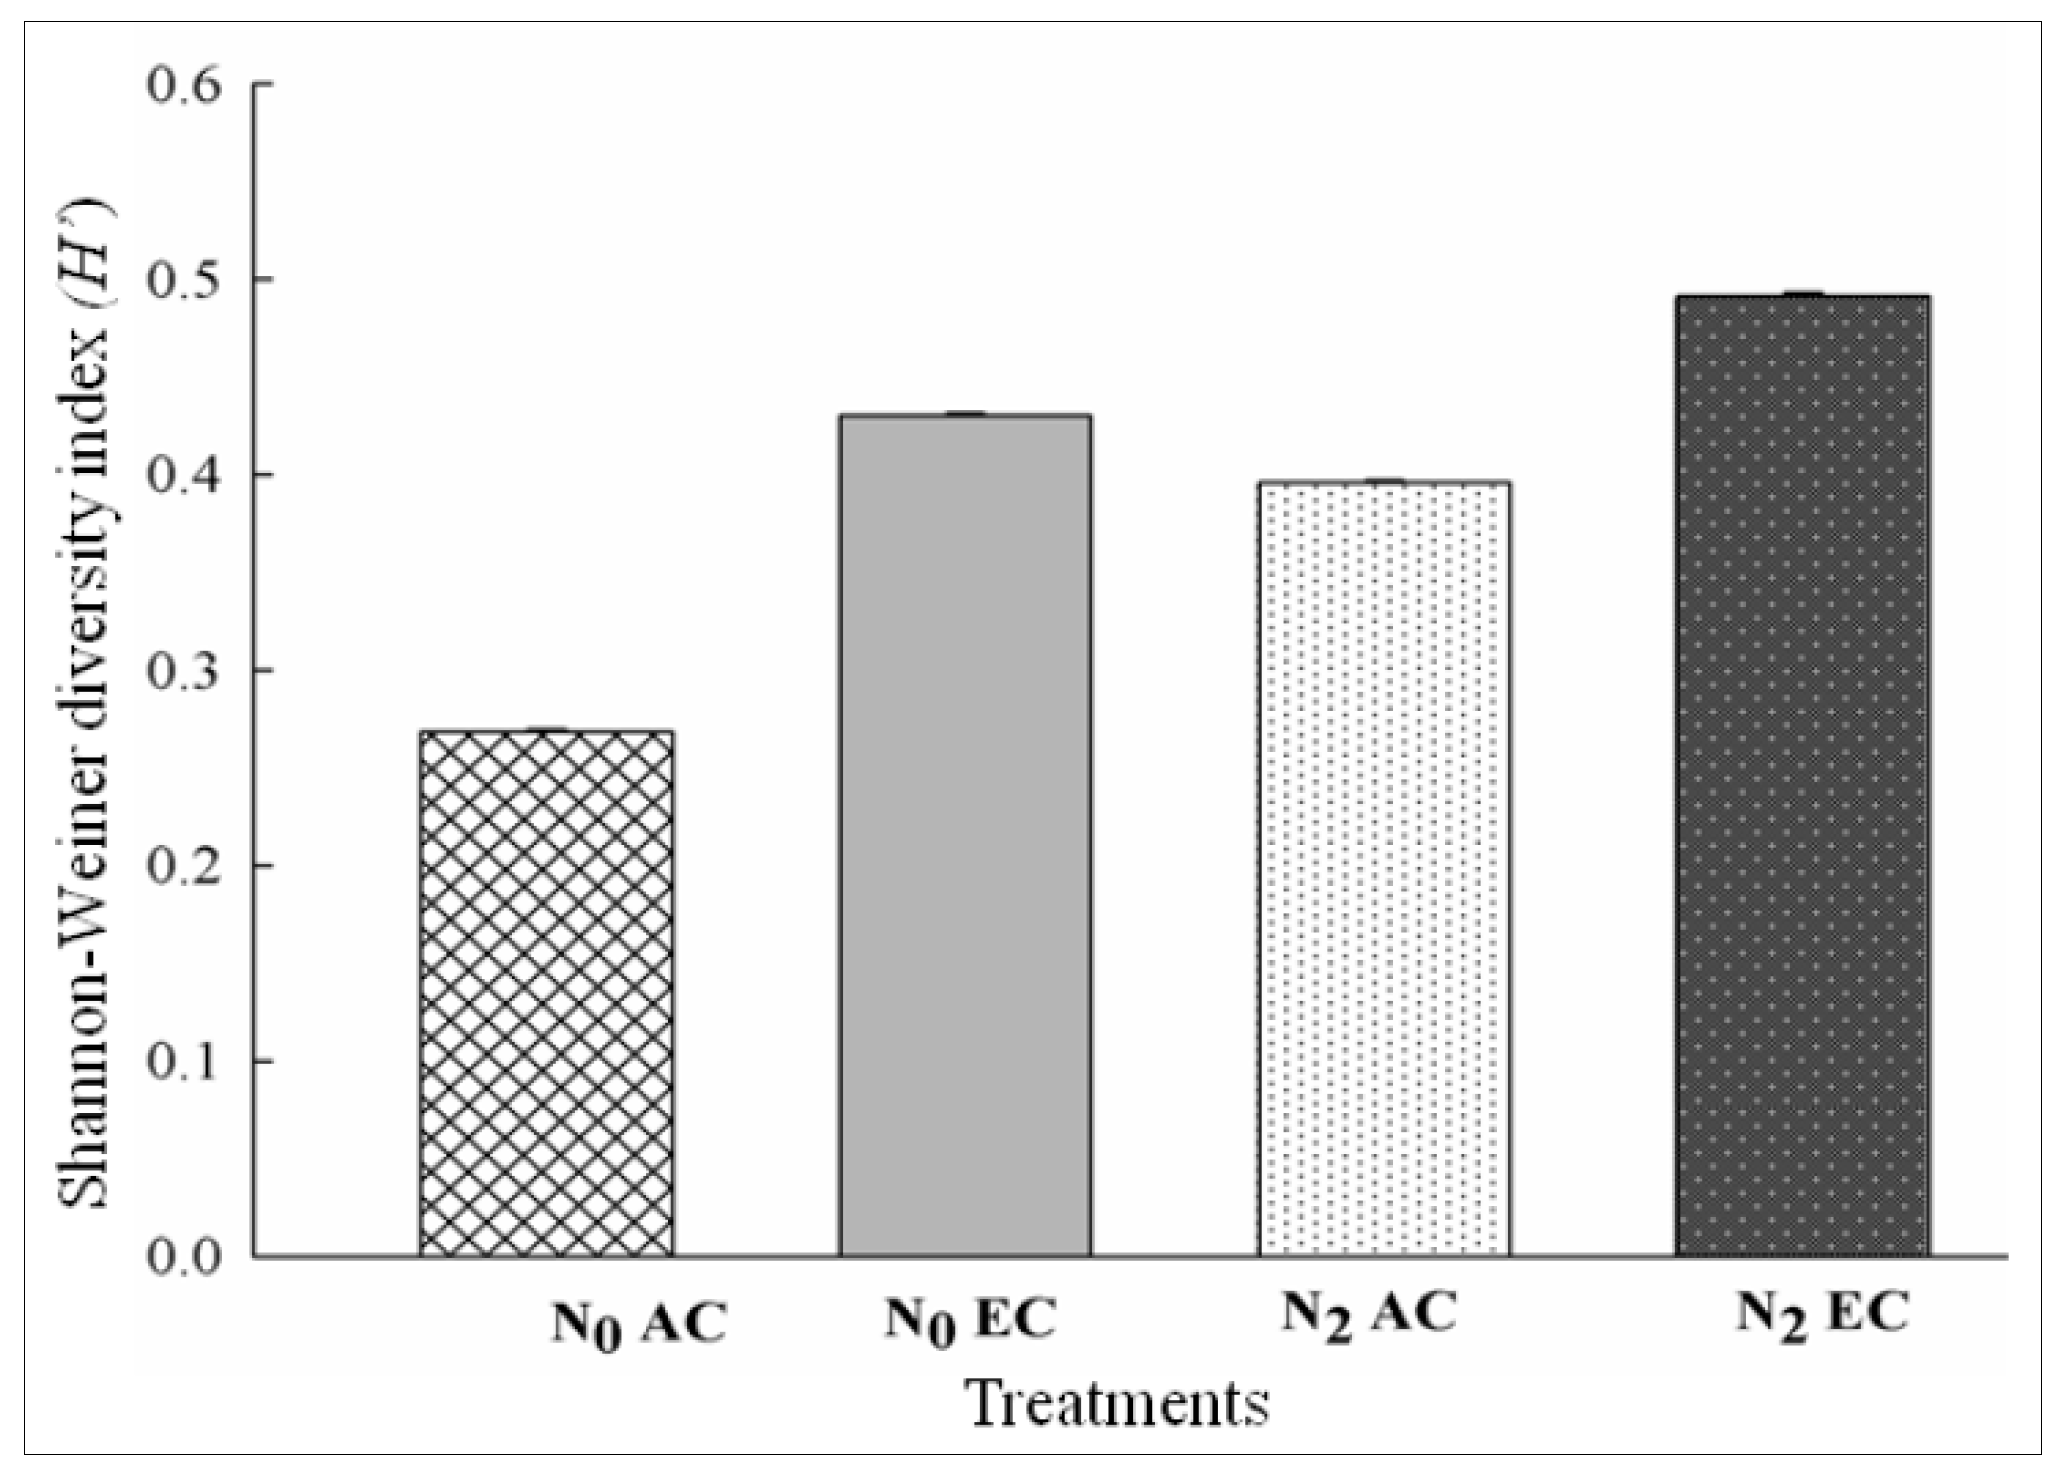
The recommended nitrogen (N0) dose under AC was recorded with minimum diversity, while the diversity was higher in rhizospheric samples under EC from both N doses. The soil of AC with double N doses showed moderate diversity (Figure 7). For the H’ diversity index, which is derived from all PLFA biomarkers responses, maximum diversity was noticed under N2EC, while the minimum diversity was recorded under N0AC (Figure 7).

3.6. Principal Component Analysis (PCA) of PLFA Responses Using xTriticocereale (Triticale) Soil Microbial Community as Influenced by Ambient and Elevated Levels of CO2 and Varying Nitrogen Levels

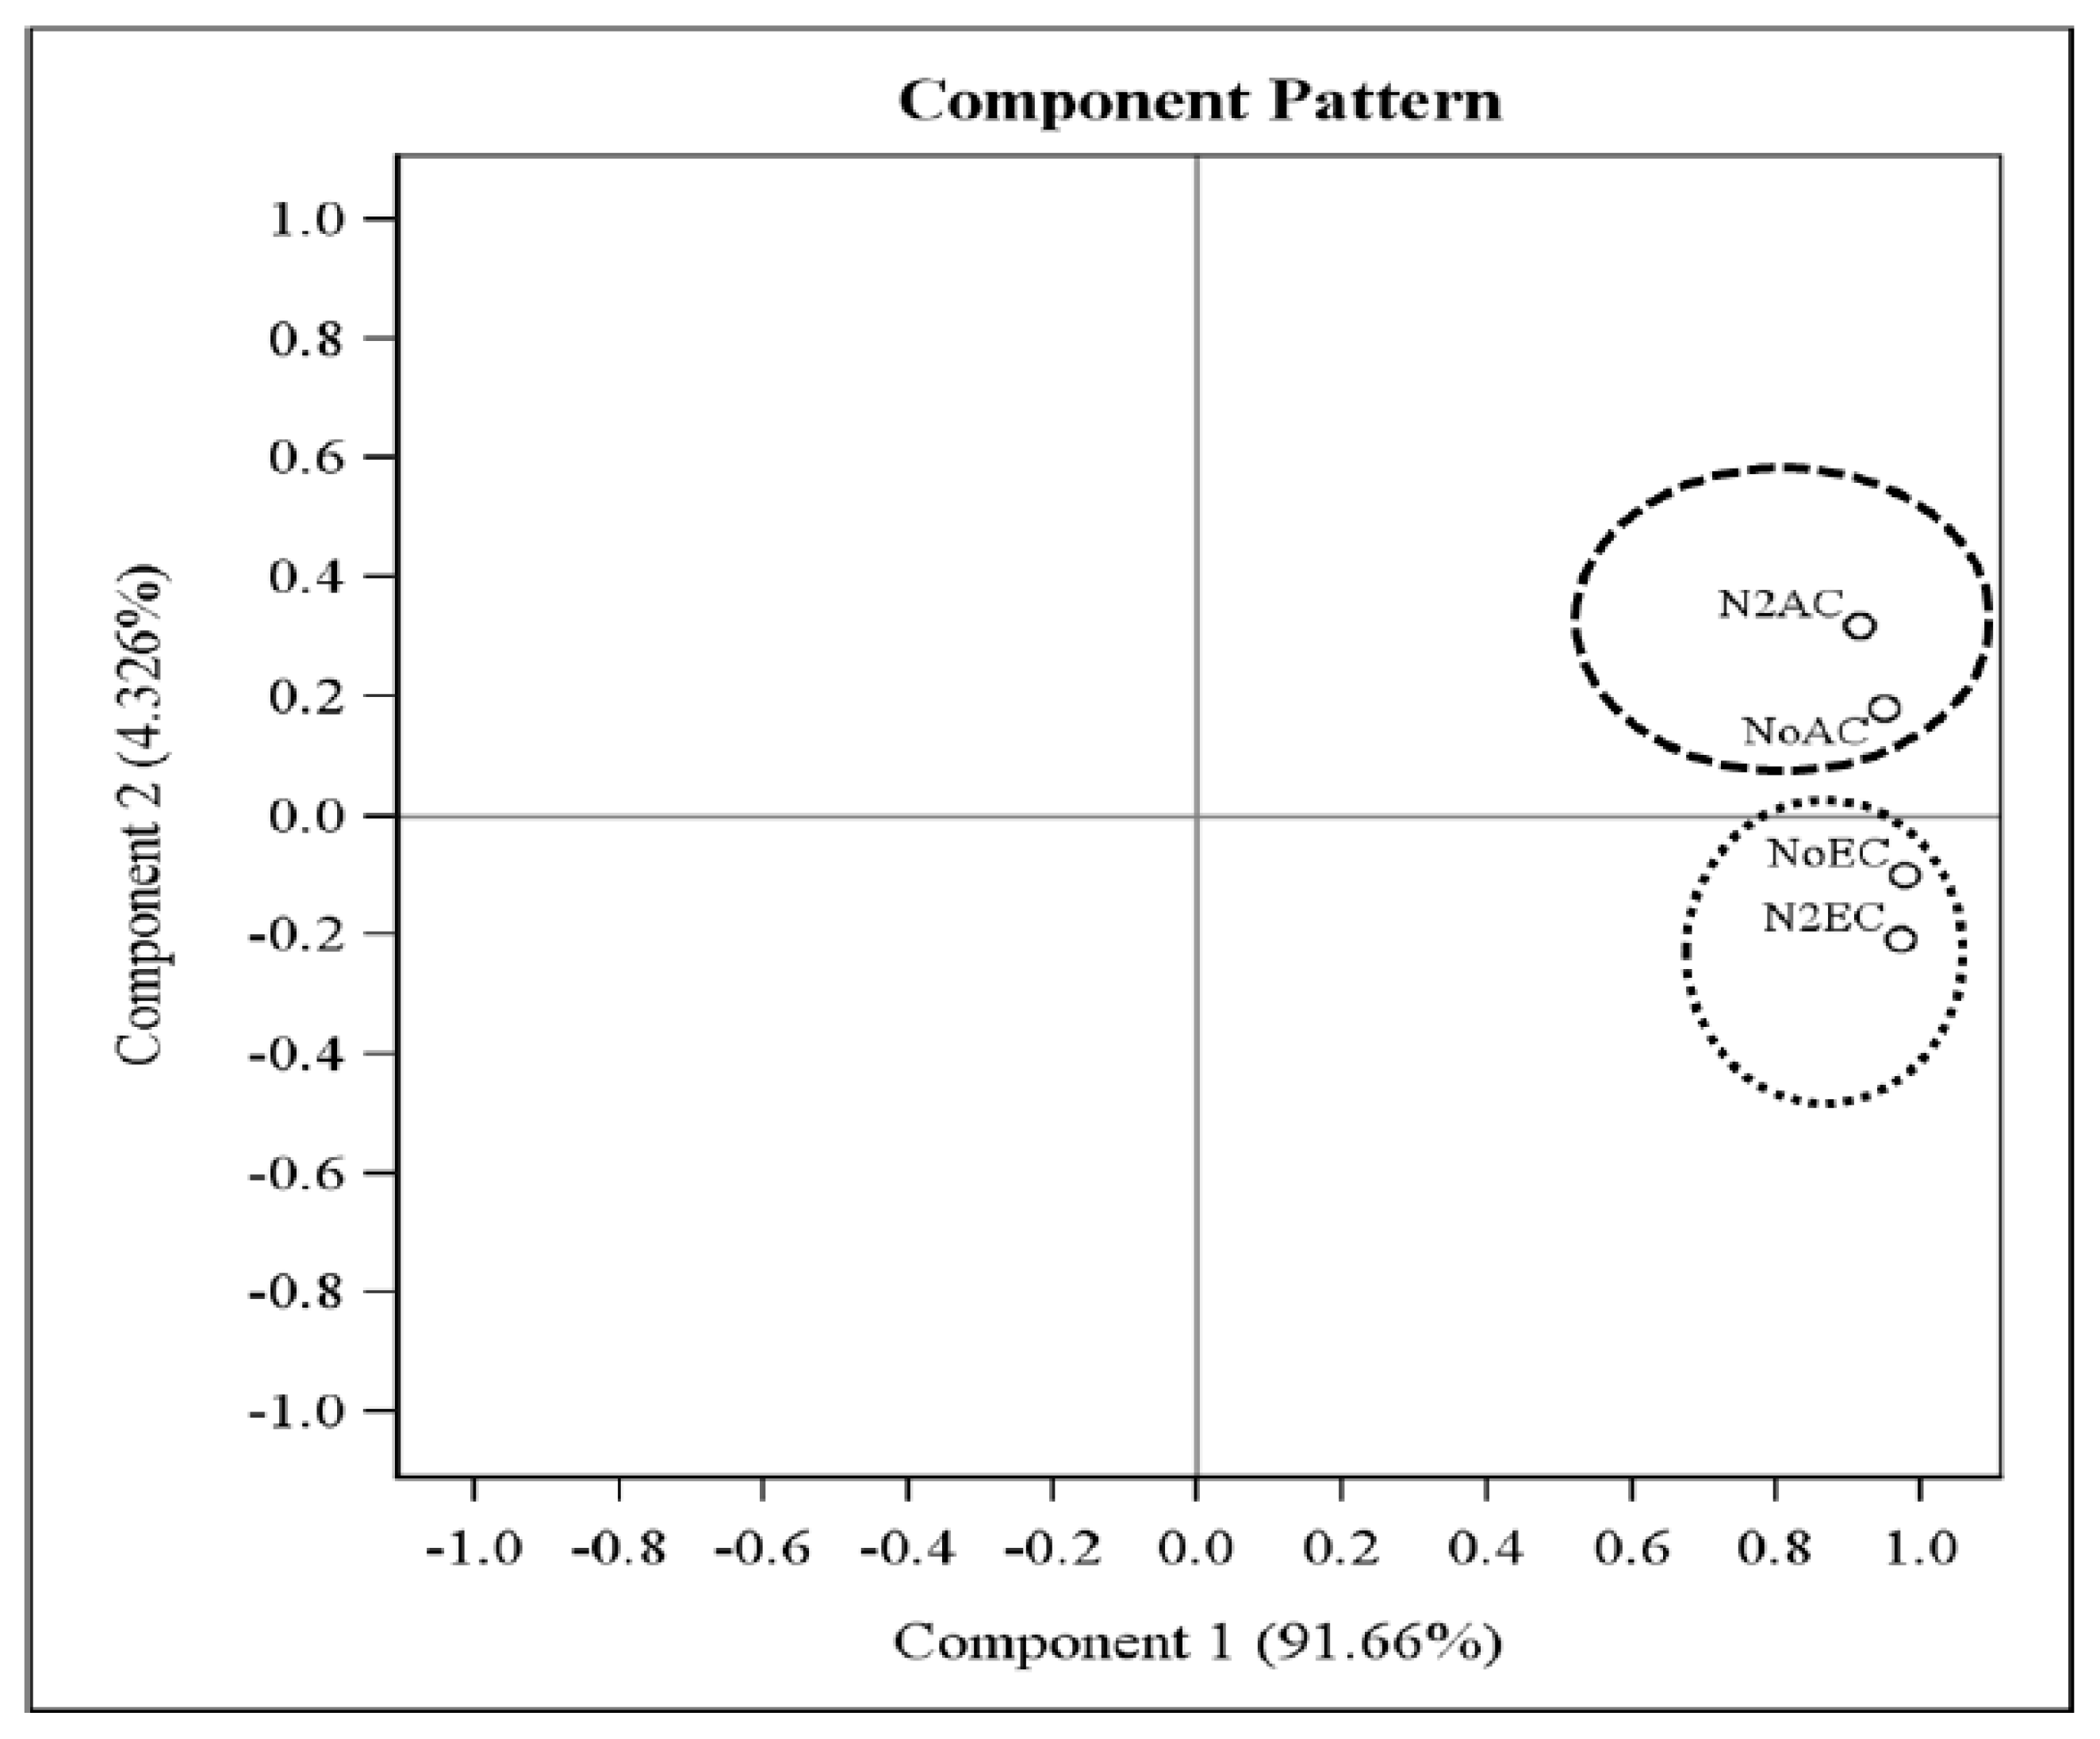
All the responses of PLFA were further analyzed through Principal component analysis. Principal component analysis (PCA) expressed substantial and significant compositional variations in soil microbial communities among all four treatments. The first principal component (PC1) explained about 91.66% of the total variation (Figure 8). Also, all four treatments were segregated into two different quadrants, wherein the carbon dioxide effects were more visible than the different doses of nitrogen applications. The treatments N0AC and N2AC appear in one quadrant and the other two treatments of elevated CO2 appear in a separate quadrant. Although the effects of CO2 exposure may be indirect, significant and differentiable variations were explained in terms of rhizospheric microbial compositions.

4. Discussion

Using xTriticocereale (Triticale) as the test crop in the present experiment, we investigated the dynamics of phospholipid fatty acids in rhizospheric soil by examining the soil microbial structure’s composition and content during a 50% anthesis period. Living cells comprise fatty acids, which have hydrophobic tails at one end; another OH-group is linked with the hydrophilic head of a phosphate group. Therefore, these lipids become asymmetric in nature and possess both hydrophobic and hydrophilic regions. Different types of microbes contain different types of fatty acids in their membrane and, thus, their abundance can be studied through PLFA biomarkers (specific to different microorganisms), which allows information to be gained about the abundances of different groups of microbes in soil. Our finding that there is a higher microbial content under EC and a non-significant effect exerted by N is in agreement with studies performed by Hungate et al. (1996) [23]. Also, Zak et al. (1993) [24] reported significantly higher microbial biomass, plant C assimilation, fine root turn over and higher rates of net N mineralization under elevated atmospheric CO2. Another report by Van Ginkel et al. (2000) [25] depicted a42% increase in the microbial biomass under EC in Lolium perenne. An increase in microbial biomass responses may be attributed to the resultant priming effect by EC. Thus, an altered microbial community may alter these functions as well. As microbes are the crucial players in bio-geochemical cycling, EC can change soil functions and, thus, in future climate change conditions, soil may become a carbon-emitting source either in the form of CO2 or CH4 and act as a form of carbon sinks through sequestration [26].
Many studies have reported mixed responses, with few expressing significant changes and some non-significant changes in PLFA contents under elevated CO2 and higher doses of nitrogen. A report by Drisnner et al. (2007) [27] expressed that the total PLFA content increased by ~25% in the EC compared to the content (~57.38 nmol/g soil) at AC. Our findings are also in accordance with this report. The priming effect exerted by the plants under EC may be the reason behind the boost in microbial growth under EC compared to AC. However, contrary to these reports, no significant alteration in the total PLFA contents was reported by Feng et al. (2010) [28] under high N and EC conditions in Duke Forest sites. Analysis of fungal-to-bacterial ratios in our study revealed that the bacterial community dominated in the microbial group compared to the fungal community, and fungal abundance decreased with additional nitrogen fertilization. This might have occurred because the higher N dose potentially mitigated the investment made by plants in finer roots and associated with mycorrhizal fungi, because, at higher doses of N, the uptake of nutrients becomes less critical [29]. Feng et al. (2010), in the Duke Forest FACE experiment, reported decreased F/B ratios in soil [28]. This was in accordance with our findings, which confirm that fungi are negatively affected by N fertilization in comparison to bacteria. Another experiment by Billings and Ziegler (2008) at the Duke FACE site reported reduced fungal PLFA abundance [30]. They observed that fungal PLFA was 2.8 times more abundant in non-fertilized soil than in fertilized soil. These findings can be explained by reduced C-allocation to finer roots for fungal colonization.
Recently, fresh plant materials have been preferred over Gram negative bacteria as the food source, while old soil organic matter (SOM) has been preferred over Gram positive bacteria. Therefore, we expected more Gram negative populations under EC owing to them having more exudates from the roots under this condition; however, the result was the opposite. Instead, the population of Gram negative bacteria was seen to decline with a concurrent increase in Gram-positive bacterial abundance under EC, irrespective of N addition. The soil’s physico-chemical parameters might have ruled out this, rather than the types of C sources used. The present study revealed no effect on the actinomycetes population. Ringelberg et al. (1997) also reported similar findings, identifying only a subtle and non-significant alteration in Gram negative bacteria and actinomycetes under EC [31]. This could be ascribed to their slower growth in comparison to bacteria and fungi. Our findings are in accordance with Drigo et al. (2010) [32]. Fatty acid biomarkers, which are specific to anaerobes and Gram-negative bacteria, decreased under EC along with N application. Conversely, eukaryotes increased under the same conditions. The results from the PLFA performed by Montealegre et al. (2002) indicated that the abundance of eukaryotes in the rhizosphere increased under EC, whereas the abundance of prokaryotes was not affected [33]. They all reported that slow growers are the least affected under EC. In the present study, microbial diversity was mainly affected by CO2 levels, but N addition also played a role in altering this diversity. Although the effects of CO2 exposure may be indirect, significant and differentiable variations in terms of rhizospheric microbial compositions were explained. However, long-term studies are needed to identify clear findings regarding the interaction between these two factors and their impact on the diversity in rhizospheric samples and clarify whether these effects/alterations are transient or continuous.

5. Conclusions

The results from this study depict how changing CO2 levels in combination with high levels of nitrogen affect the soil microbial community. Microbial traits, such as biomass content and diversity index, were more significantly influenced by elevated CO2. Rhizospheric microbial community analysis using a fungal/bacterial ratio (F/B) showed that the bacterial community dominated in soil under EC and higher N applications. Elevated CO2 and higher N levels may have minimal effects on the population dynamics of actinomycetes owing to their slow growth compared to bacteria and fungi. The present investigation found a non-significant impact on rhizospheric soil microbial diversity in response to short-term N addition in a tropical agro-ecosystem. However, elevated CO2 levels even during short-term exposure significantly affected the soil rhizospheric microbial community structure in terms of both diversity and abundance. The interaction of these drivers can lead to positive feedback in soil with increased biomass and soil respiration and decreased fungal population. As alterations in microbial community composition occur at a very slow rate or on the micro-scale, long-term studies are required to determine whether the observed changes will continue over time and become more pronounced or not. In the future, long-term studies are required to uncover clear findings regarding the interaction of these two factors on the microbial community structure in rhizospheric samples. Long-term interaction studies could clarify whether these effects/alterations are transient or continuous. Finally, it can be inferred that elevated CO2 has a pronounced effect on soil microbial communities, apart from the population of actinomycetes.

Author Contributions

Methodology, K.A.G. and N.D.S.; Validation, K.A.G.; Formal analysis, K.A.G., N.D.S. and R.B.; Investigation, K.A.G.; Resources, M.P.; Data curation, K.A.G.; Writing—original draft, K.A.G.; Writing—review & editing, N.D.S., R.B. and M.P.; Visualization, N.D.S., R.B. and M.P.; Supervision, N.D.S., R.B. and M.P.; Project administration, M.P. All authors have read and agreed to the published version of the manuscript.

Funding

This research was funded by University Grant Commission, India. UGC Fellowship to KAG for pursuing PhD and conducting the research experiment.

Data Availability Statement

All the data related to PLFA profiles will be provided if requested by any reader or end user.

Acknowledgments

The first author duly acknowledges the funding grant received in the form of a fellowship from the University Grants Commission, India. The author also acknowledges facilities received from the Divisions of Plant Physiology and CESCRA, ICAR-Indian Agricultural Research Institute, New Delhi. The suggestions and guidance given by Divya Shah are also sincerely acknowledged.

Conflicts of Interest

The authors declare no conflict of interest.

References

  1. IPCC. AR6 Synthesis Report: Climate Change; IPCC: Geneva, Switzerland, 2023. [Google Scholar]
  2. Nasa.gov2025 Carbon Dioxide Vital Signs—Climate Change: Vital Signs of the Planet. Available online: https://www.nasa.gov (accessed on 24 March 2025).
  3. Gruber, N.; Galloway, J.N. An earth-system perspective of the global nitrogen cycle. Nature 2008, 451, 293–296. [Google Scholar] [CrossRef] [PubMed]
  4. Thilakarathne, C.L.; Tausz-Posch, S.; Cane, K.; Norton, R.M.; Tausz, M.; Seneweera, S. Intra specific variation in growth and yield response to elevated CO2 in wheat depends on the differences of leaf mass per unit area. Funct. Plant Biol. 2013, 40, 185–194. [Google Scholar] [CrossRef] [PubMed]
  5. Drigo, B.; Kowalchuk, G.A.; VanVeen, J.A. Climate change goes under ground: Effects of elevated atmospheric CO2 on microbial community structure and activities in the rhizosphere. Biol. Fertil. Soils 2008, 44, 667–679. [Google Scholar] [CrossRef]
  6. Singh, B.K.; Bardgett, R.D.; Smith, P.; Reay, D.S. Microorganisms and climate change: Terrestrial feedbacks and mitigation options. Nat. Rev. Microbiol. 2010, 8, 779–790. [Google Scholar] [CrossRef]
  7. Heimann, M.; Reichstein, M. Terrestrial ecosystem carbon dynamics and climate feed backs. Nature 2008, 451, 289–292. [Google Scholar] [CrossRef]
  8. Ridgeway, J.R.; Morrissey, E.M.; Brzostek, E.R. Plant litter traits control microbial decomposition and drive soil carbon stabilization. Soil Biol. Biochem. 2022, 175, 108857. [Google Scholar] [CrossRef]
  9. Cheng, X.; Xing, W.; Liu, J. Litter chemical traits, microbial and soil stoichiometry regulate organic carbon accrual of particulate and mineral-associated organic matter. Biol. Fertil. Soils 2023, 59, 777–790. [Google Scholar] [CrossRef]
  10. Cotrufo, M.F.; Ineson, P.; Rowland, A.P. Decomposition of tree leaf litters grown under elevated CO2: Effect of litter quality. Plant Soil. 1994, 163, 121–130. [Google Scholar] [CrossRef]
  11. Hungate, B.A.; Holland, E.A.; Jackson, R.B.; Chapin, F.S.; Mooney, H.A.; Field, C.B. The fate of carbon in grasslands under carbon dioxide enrichment. Nature 1997, 388, 576–579. [Google Scholar] [CrossRef]
  12. Reay, D.S.; Dentener, F.; Smith, P.; Grace, J.R.; Feely, A. Global nitrogen deposition and carbon sinks. Nat. Geosci. 2008, 1, 430–437. [Google Scholar] [CrossRef]
  13. Ramirez, K.S.; Craine, J.M.; Fierer, N. Consistent effects of nitrogen amendments on soil microbial communities and processes across biomes. Glob. Change Biol. 2012, 18, 1918–1927. [Google Scholar] [CrossRef]
  14. Finzi, A.C.; DeLucia, E.H.; Hamilton, J.G.; Richter, D.D.; Schlesinger, W.H. The nitrogen budget of a pine forest under free air CO2 enrichment. Oecologia 2002, 132, 567–578. [Google Scholar] [CrossRef]
  15. Wang, Y.F.; Gu, J.D. Higher diversity of ammonia/ammonium-oxidizing prokaryotes in constructed freshwater wetland than natural coastal marine wetland. Appl. Environ. Microbiol. 2013, 97, 7015–7033. [Google Scholar] [CrossRef]
  16. Buyer, J.S.; Sasser, M. High throughput phospholipid fatty acid analysis of soils. Appl. Soil Ecol. 2012, 61, 127–130. [Google Scholar] [CrossRef]
  17. Zelles, L. Fatty acid patterns of phospholipids and lipopolysaccharides in the characterisation of microbial communities in soil: A review. Biol. Fertil. Soils 1999, 29, 111–129. [Google Scholar] [CrossRef]
  18. Frostegård, Å.; Tunlid, A.; Bååth, E. Phospholipid fatty acid composition, biomass, and activity of microbial communities from two soil types experimentally exposed to different heavy metals. Appl. Environ. Microbiol. 1993, 59, 3605–3617. [Google Scholar] [CrossRef] [PubMed]
  19. Grayston, S.J.; Griffith, G.S.; Mawdsley, J.L.; Campbell, C.D.; Bardgett, R.D. Accounting for variability in soil microbial communities of temperate upland grassland ecosystems. Soil Biol. Biochem. 2001, 33, 533–551. [Google Scholar] [CrossRef]
  20. Bardgett, R.D.; Hobbs, P.J.; Frostegård, Å. Changes in soil fungal: Bacterial biomass ratios following reductions in the intensity of management of upland grassland. Biol. Fertil. Soils 1996, 22, 261–264. [Google Scholar] [CrossRef]
  21. Olsson, P.A.; Larsson, L.; Bago, B.; Wallander, H.; VanAarle, I.M. Ergosterol and fatty acids for biomass estimation of mycorrhizal fungi. New Phytol. 2003, 159, 7–10. [Google Scholar] [CrossRef]
  22. Kaur, A.; Chaudhary, A.; Kaur, A.; Choudhary, R.; Kaushik, R. Phospholipid fatty acid—A bioindicator of environment monitoring and assessment in soil ecosystem. Curr. Sci. 2005, 89, 1103. [Google Scholar]
  23. Hungate, B.A.; Canadell, J.; Chapin, F.S. Plant species mediate changes in soil microbial N in response to elevated CO2. Ecology 1996, 77, 2505–2515. [Google Scholar] [CrossRef]
  24. Zak, D.R.; Pregitzer, K.S.; Curtis, P.S.; Teeri, J.A.; Fogel, R.; Randlett, D.L. Elevated atmospheric CO2 and feedback between carbon and nitrogen cycles. Plant Soil 1993, 151, 105–117. [Google Scholar] [CrossRef]
  25. Ginkel Van, J.H.; Gorissen, A.; Polci, D. Elevated atmospheric carbon dioxide concentration: Effects of increased carbon input in a Lolium perennes oil on microorganisms and decomposition. Soil Biol. Biochem. 2000, 32, 449–456. [Google Scholar] [CrossRef]
  26. Carney, K.M.; Hungate, B.A.; Drake, B.G.; Megonigal, J.P. Altered soil microbial community at elevated CO2 leads to loss of soil carbon. Proc. Natl. Acad. Sci. USA 2007, 104, 4990–4995. [Google Scholar] [CrossRef]
  27. Drissner, D.; Blum, H.; Tscherko, D.; Kandeler, E. Nine years of enriched CO2 changes the function and structural diversity of soil microorganisms in a grassland. Eur. J. Soil Sci. 2007, 58, 260–269. [Google Scholar] [CrossRef]
  28. Feng, X.; Simpson, A.J.; Schlesinger, W.H.; Simpson, M.J. Altered microbial community structure and organic matter composition under elevated CO2 and N fertilization in the duke forest. Glob. Change Biol. 2010, 16, 2104–2116. [Google Scholar] [CrossRef]
  29. Treseder, K.K. A meta-analysis of mycorrhizal responses to nitrogen, phosphorus, and atmospheric CO2 in field studies. New Phytol. 2004, 164, 347–355. [Google Scholar] [CrossRef]
  30. Billings, S.A.; Ziegler, S.E. Altered patterns of soil carbon substrate usage and heterotrophic respiration in a pine forest with elevated CO2 and N fertilization. Glob. Change Biol. 2008, 14, 1025–1036. [Google Scholar] [CrossRef]
  31. Ringelberg, D.B.; Stair, J.O.; Almeida, J.; Norby, R.J.; O’Neill, E.G.; White, D.C. Consequences of rising atmospheric carbon dioxide levels for the below ground microbiota associated with white oak. J. Environ. Qual. 1997, 26, 495–503. [Google Scholar] [CrossRef]
  32. Drigo, B.; Pijl, A.S.; Duyts, H.; Kielak, A.M.; Gamper, H.A.; Houtekamer, M.J.; Boschker, H.T.; Bodelier, P.L.; Whiteley, A.S.; vanVeen, J.A.; et al. Shifting carbon flow from roots in to associated microbial communities in response to elevated atmospheric CO2. Proc. Natl. Acad. Sci. USA 2010, 107, 10938–10942. [Google Scholar] [CrossRef]
  33. Montealegre, C.M.; VanKessel, C.; Russelle, M.P.; Sadowsky, M.J. Changes in microbial activity and composition in a pasture ecosystem exposed to elevated atmospheric carbon dioxide. Plant Soil 2002, 243, 197–207. [Google Scholar] [CrossRef]
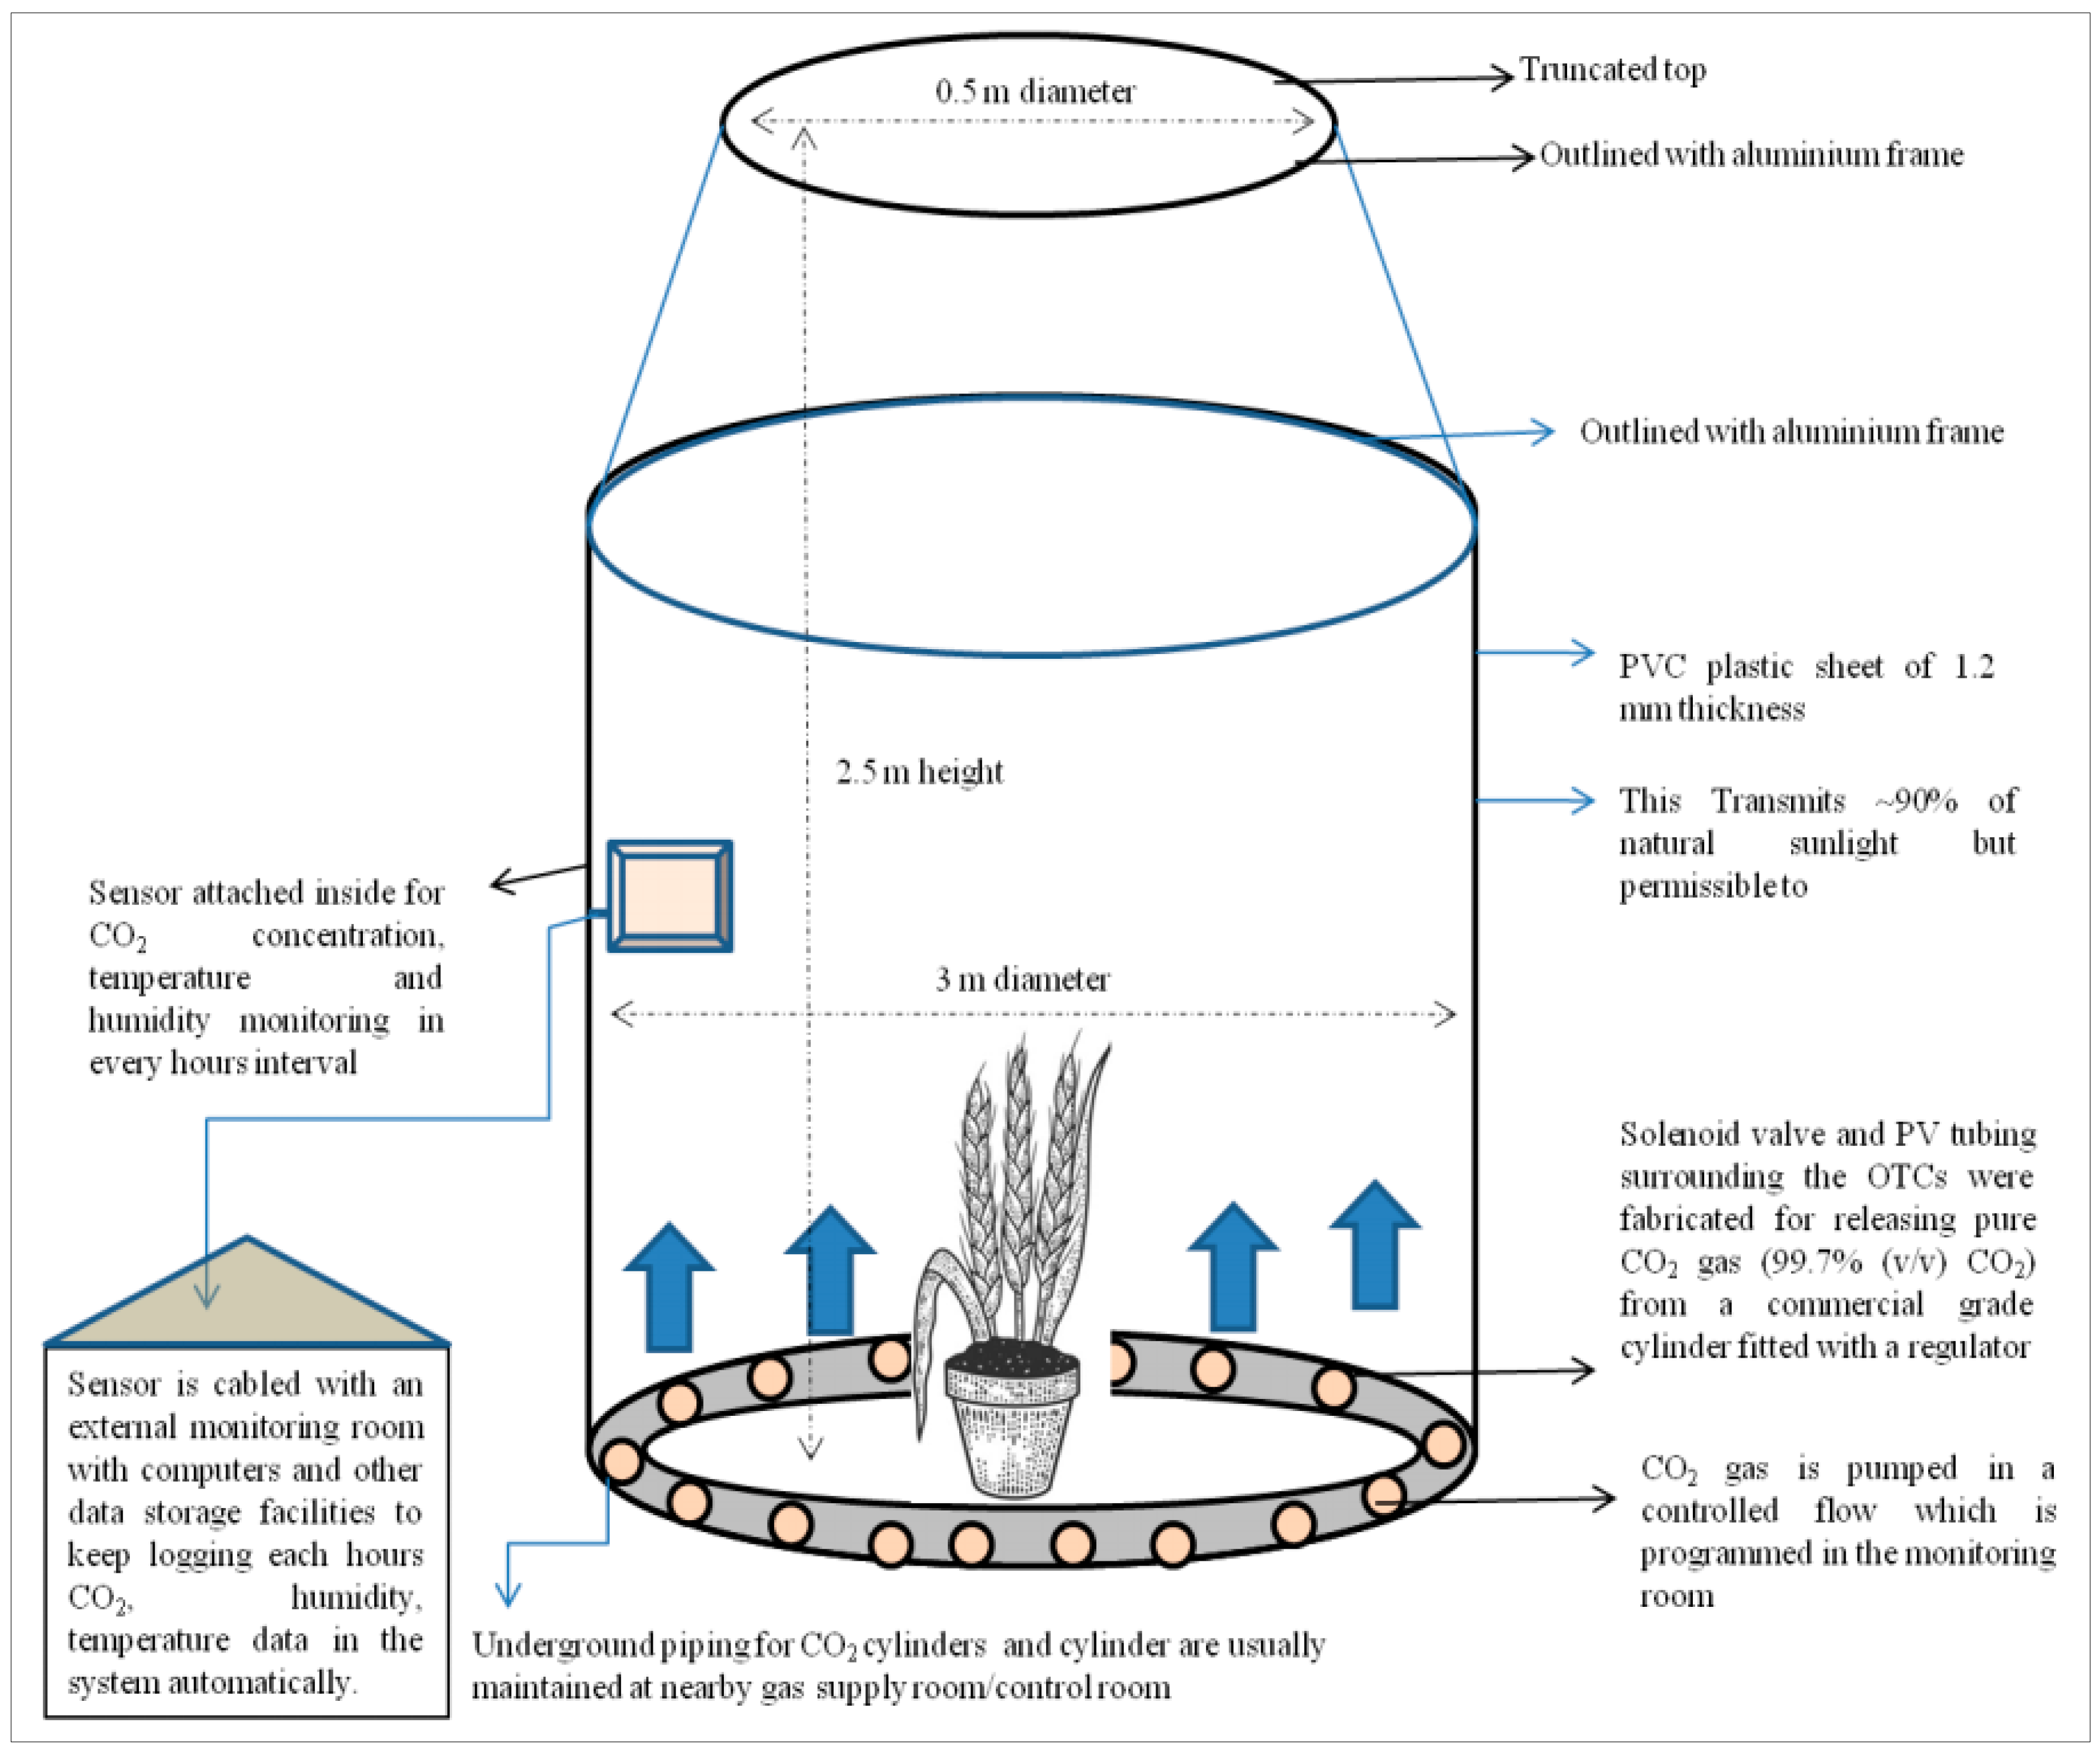
Figure 1. Schematic diagram of open-top chambers used in present study.
Nitrogen 06 00067 g001
Figure 2. Total microbial biomass content in rhizosphere of xTriticocereale (Triticale) at ambient and elevated CO2 and varying nitrogen levels. (Where, N0: normal recommended nitrogen; N2: Twice the normal amount of recommended nitrogen; AC: ambient CO2; EC: elevated CO2).
Nitrogen 06 00067 g002
Figure 3. (a). Phospholipid fatty acid profile of soil samples in rhizosphere of xTriticocereale (Triticale) at ambient and elevated CO2 and normal recommended nitrogen levels. (b). (Where, N0: normal recommended nitrogen; AC: ambient CO2; EC: elevated CO2, N2: twice the normal recommended nitrogen amount).
Nitrogen 06 00067 g003
Figure 4. Root biomass of xTriticocereale (Triticale) influenced by ambient CO2, elevated CO2, and varying nitrogen levels. (Where, N0: normal recommended nitrogen; N2: twice the normal recommended nitrogen amount; AC: ambient CO2; EC: elevated CO2).
Nitrogen 06 00067 g004
Figure 5. Fungal to bacterial ratio in rhizosphere of xTriticocereale (Triticale) at ambient CO2, elevated CO2, and varied nitrogen levels. (Where, N0: normal recommended nitrogen; N2: twice the normal recommended nitrogen amount; AC: ambient CO2; EC: elevated CO2).
Nitrogen 06 00067 g005
Figure 6. Bacterial profile in rhizosphere of xTriticocereale (Triticale) at ambient CO2; elevated CO2 and varying nitrogen levels. (Where, N0: normal recommended nitrogen; N2: twice the normal recommended nitrogen amount; AC: ambient CO2; EC: elevated CO2).
Nitrogen 06 00067 g006
Figure 7. Shannon–Weiner diversity index (H’) of rhizospheric samples of xTriticocereale (Triticale) at ambient and elevated levels of CO2 and varying nitrogen levels. (Where, N0: normal recommended nitrogen; N2: twice the normal recommended nitrogen amount; AC: ambient CO2; EC: elevated CO2).
Nitrogen 06 00067 g007
Figure 8. Principal component analysis (PCA) of PLFA responses using xTriticocereale (Triticale) soil microbial community influenced by ambient CO2, elevated CO2 and varying nitrogen levels. (Where, N0: normal recommended nitrogen; N2: twice the normal recommended nitrogen amount; AC: ambient CO2; EC: elevated CO2).
Nitrogen 06 00067 g008
Table 1. General physico-chemical properties of the experimental soil.
Soil PropertiesValues/Inferences
pH (soil/water1/2.5)7.9
Electrical conductivity (EC) (dSm−1)0.64
Textual classSandy loam
Soil typeTypic Haplustept
Bulk density (Mg m−3)1.61
Water-holding capacity (%)32.6
Available N (g kg−1)0.30
Available P (kg ha−1)11.7
Available K (kg ha−1)225
Oxidizable soil organic carbon (g kg−1)3.7
Table 2. Carbon dioxide (CO2) levels and nitrogen (N) dosage maintained during the experiment.
Nitrogen (N) DosesCarbon Dioxide Notation Used
N0 (Normal recommended dose of N: 0.0533 g N/kg of soil)Ambient CO2 (384 ± 13 ppm)N0AC
N2 Twice of N0,
(0.107 g N/kg soil)
Ambient CO2 (384 ± 13 ppm)N2AC
N0 (Normal recommended dose of N: 0.0533 g N/kg of soil)Elevated CO2 (580 ± 20 ppm)N0EC
N2 Twice of N0,
(0.107 g N/kg soil)
Elevated CO2 (580 ± 20 ppm)N2EC
Table 3. Microbial traits in the rhizosphere of xTriticocereale (Triticale) grown in pots at ambient CO2, elevatedCO2, and varying nitrogen levels.
TreatmentsMicrobial Biomass Content
(nmoles/g of Dry Soil)
Gram-Positive
Bacteria
(nmoles/g of Dry Soil)
Gram
-Negative
Bacteria
(nmoles/g of Dry Soil)
F:B RatioStraight-Chain
Fatty Acids
(nmoles/g of Dry Soil)
Branched
Fatty Acids
(nmoles/g of Dry Soil)
MUFA
(nmoles/g of Dry Soil)
PUFA
(nmoles/g of Dry Soil)
DMA
(nmoles/g of Dry Soil)
18:1 ω9c
(nmoles/g of Dry Soil)
18:2 ω6,9c
(nmoles/g of Dry Soil)
10-Methyl
(nmoles/g of Dry Soil)
Shannon–Weiner Diversity Index (H’)
N0AC960.30.020.160.610.160.170.0050.0430.0370.010.0150.27
N2AC880.30.020.180.490.240.180.130.0320.0440.0130.0170.4
N0EC1010.30.0040.190.630.130.050.080.0380.0510.0070.0000.43
N2EC1120.260.0060.170.510.180.030.050.0210.0340.010.0080.49
LSD at 5%0.0172 ***0.00190 ***0.00190 ***0.0188 **0.0014 ***0.0013 ***0.0014 ***0.00135 ***0.00135 ***0.00136 ***0.001 ***0.0014 ***0.0085 ***
* p < 0.05, ** p < 0.01, and *** p < 0.001. ns—not significant. N0: optimum nitrogen; N2: twice the amount of optimum nitrogen; AC: ambient CO2; EC: elevated CO2. MUFA = Mono Unsaturated Fatty Acid: biomarker for aerobic prokaryotes and Gram-negative bacterial community; PUFA = Poly Unsaturated Fatty Acid: biomarker for eukaryotes; DMA = dimethyl acetal: biomarker for anaerobes; 18:1ω9c: fungal biomarker; 18:2ω6,9c:fungal biomarker; 10-methyl: biomarker for actinomycetes.
Disclaimer/Publisher’s Note: The statements, opinions and data contained in all publications are solely those of the individual author(s) and contributor(s) and not of MDPI and/or the editor(s). MDPI and/or the editor(s) disclaim responsibility for any injury to people or property resulting from any ideas, methods, instructions or products referred to in the content.