Article

Three Years After Soybean-Cover-Crop Rotation in Conventional and No-Till Practices: What Are the Consequences on Soil Nitrous Oxide Emissions?

by
Nokwanda O. Dlamini
1,*,
Lindsay Banda
1,
Laura M. Cardenas
2,
Aranzazu Louro-Lopez
2 and
Jerry C. Dlamini
3
1
Department of Soil, Crop and Climate Sciences, University of the Free State, Bloemfontein 9300, South Africa
2
Net Zero and Resilient Farming, Rothamsted Research, North Wyke, Okehampton, Devon EX20 2SB, UK
3
Unit for Environmental Sciences and Management, North-West University, Potchefstroom 2520, South Africa
*
Author to whom correspondence should be addressed.
Nitrogen 2025, 6(2), 45; https://doi.org/10.3390/nitrogen6020045
Submission received: 2 May 2025 / Revised: 26 May 2025 / Accepted: 4 June 2025 / Published: 11 June 2025

Abstract

Nitrous oxide is a potent greenhouse gas due to its long atmospheric lifespan (121 years) that results in a high global warming potential (GWP). Research has shown that no-tillage may be implemented as a mitigation strategy to reduce N2O emissions. The objective of the was to evaluate how conventional tillage (CT) and no-tillage (NT) can potential influence N2O emissions in soybean rotation in a semi-arid region of the central Free State of South Africa. The effect of conventional and no-till tillage practices on N2O emissions under soybean rotation was evaluated in the 3rd year of a 5-year rotation system, in a semi-arid region of the Free State of South Africa, from December 2022 to December 2023. The experimental area was divided into three blocks and there were two plots in each block: in total there were six plots. The treatments were planted in a soybean rotation system under no-tillage and conventional tillage. The monthly averages of N2O emissions were significantly different from each other during the soybean growing season; the highest emissions were recorded in August/September 2023 from both the NT and CT treatments after harvest. During this time, there were crop residues in the soil that increased soil carbon. There was a positive correlation between N2O emissions and soil carbon content (p = 0.21) and between N2O emissions and soil organic matter (p = 0.43). Emissions were significantly higher in CT (LSD = 0.3) than in NT. The lowest N2O emissions were recorded in December 2023 (LSD = 0.05) and were significantly reduced in the no-till plots compared to those of the conventional tillage plots. Furthermore, the lowest cumulative N2O emissions of 0.26 ± 0.22 kg N2O-N ha−1 were recorded during NT in the winter season and were significantly different from CT (LSD = 0.19). The results from our study indicate that the no-till practices in soybean rotation can decrease N2O emissions.

Graphical Abstract

1. Introduction

The production of nitrous oxide (N2O) from agricultural soils is a significant environmental concern due to its role as a potent greenhouse gas (GHG) in the 21st century [1] and its contribution to the depletion of the ozone layer [2]. Crop production accounts for approximately 50% of N2O emissions from agriculture [1]. The production of N2O from agricultural soils is mainly modulated through two microbial processes: denitrification and nitrification [3].
Nitrification plays an critical role in the nitrogen (N) cycle, influencing soil fertility and impacting environmental quality [4]. Nitrification is increased at 50–60% WFPS levels [5,6]. The process increases at temperatures between 20 °C and 30 °C and, below 10 °C and above 35 °C, it slows significantly [7,8]. Denitrification plays an important role in the N cycle, affecting soil fertility and contributing to environmental issues, such as GHG emissions, mainly of N2O [1,9,10,11]. High water-filled pore spaces (WFPS) (>60%), are conducive to denitrification [12] and temperatures between 25 °C and 30 °C [3,13,14,15]. High levels of nitrate (NO3−) [16,17], NH4+ and carbon in the soil improve the denitrification rate [16,18,19]. Denitrification occurs under anaerobic soil conditions, whereas nitrification occurs under aerobic conditions [6]. Soils with an alkaline pH (7–8) are the most efficient in denitrification, and a pH of 6 to 7.5 favors nitrification [20,21,22].
Incorporating legumes such as soybeans into crop rotation systems is a production technique offering numerous benefits to soil health, crop productivity, and environmental sustainability [23,24]. It has also been reported to reduce N2O emissions in soils by improving nitrogen uptake, thus reducing excess nitrogen [25,26]. Crop rotation, including legume incorporation, can significantly influence N2O emissions from agricultural soils through reduced total synthetic N requirements [27,28]. Since legumes fix atmospheric N into the soil, increasing soil N and thus enriching the soil, this can also potentially increase N2O emissions if not properly managed [29,30,31].
Crop rotations that incorporate cover crops and legumes improve soil organic matter, enhancing soil health and structure [32,33]. Improved soil structure helps improve water infiltration and drainage, reducing anaerobic conditions that favor denitrification and N2O production and subsequent emissions [34,35,36,37]. Rotating crops promote a diverse microbial community in the soil, which can improve nutrient cycling and reduce the likelihood of conditions that favor N2O production [37,38,39]. A healthy and diverse microbial ecosystem can process nitrogen more effectively, reducing the accumulation of nitrates that lead to N2O emissions [40,41,42]. Different crops leave different types, qualities, and amounts of residues. Managing these residues properly (e.g., timely incorporation) can influence microbial activity and nitrogen mineralization, affecting N2O emissions [43,44,45,46].
Previous studies associated no-till soybean production with reduced N2O emissions compared to conventional cropping in multiple-location systems. No-tillage also reduces the cost incurred regarding fuel for cultivation. It improves soil health and structure, as minimal soil disturbance increases soil organic matter and biological activity. This promotes water infiltration. Soil moisture is conserved, since crop residues are left on the soil surface, particularly in rainfed and drought prone areas. In the long-term, yield stability is achieved, since no-till enhances soil resilience, thus improving crop performance under drought stress, which leads to more consistent yield over time. For instance, ref. [47] found that no-till treatments reduced cumulative N2O emissions in soybean rotation by 20% to 35.7% compared to conventional tillage, varying with the type of fertilizer type used in South Korea. Similarly, ref. [48] conducted a study in Brazil and found that no-till reduced N2O emissions in a soybean–wheat rotation system. In the previous context, the objective of this investigation was to evaluate how conventional tillage and no-tillage can potentially influence N2O emissions in soybean rotation in a semi-arid region of the central Free State of South Africa.

2. Materials and Methods

2.1. Site Description

This research was carried out during the soybean cropping season of October 2022 to December 2023 at the Kenilworth Research Station, located in Bloemfontein, Free State, South Africa, latitude 29.13184 south, longitude 26.24107 east, altitude 1395 m. This is a semi-arid region of South Africa. Bloemfontein receives most of its rainfall in summer (January and February), with an average rainfall of 469 mm per year. Summers are warm; winters are short, cold, and dry. The driest weather is in July and the wettest is in February. The mean maximum temperatures are 19 and 27 °C and the mean minimum temperatures are 1 and 12 °C for winter and summer, respectively. In 2020 to 2023 the Kenilworth Research Station had an average temperature of 17.1 C, humidity of 47% and precipitation of 33.34 mm. The soil used in this experiment had a pH of 6.57, and an organic matter content of 1.75%, calcium, magnesium, and potassium of 6.91, 1.22 and 1.04 cmol kg−1, respectively, in the 0.30 cm deep zone in 2020.

2.2. Experimental Design

The experimental design incorporated a randomized complete block design (RCBD). Each block (3 blocks in total) was 192 m (width) × 55 m (length) (10 560 m2), and each plot was 8 m (width) × 55 m (length) (440 m2). There were three blocks, with two soybean plots in each block, one plot representing each treatment in each block; in total there were six plots. The plant density for soybean was 270,000 plants per ha. Inter-row spacing was 0.75 m and intra-row spacing was 0.04 m.

2.3. Treatments

The treatments were planted in soybean rotation systems under no-till (NT) and conventional tillage (CT) [49]. In CT plots, the soil was ploughed with a moldboard prior to planting and, for the NT plot, no ploughing took place, and the crop residues were left on the soil surface. The measurements during the experiment were based on the 3rd year of a 5-year rotation experiment. The crops grown before 2023 were soybean, followed by radish, which was grown as cover crop. The planting of soybean was carried out on 10 December 2022 and the base fertilizer NPK 1:1:1 (30) was applied at a rate of 200 kg ha−1 at planting. A selective herbicide (Sonalan) was applied to control weeds on 4 February and hand weeding was also carried out. The crop was harvested on 26 June 2023 and yields were calculated as mass of total dry seed weight/unit area, and total biomass/unit area. The total dry seed weight and biomass were then converted to t/ha. The sum of the total dry seed weight and biomass made up the total crop dry weight. Thus, the treatments are as follows:
  • Conventional Tillage: Soybean-Cover crop-Soybean (CT: SB-CC-SB) In these plots, there was crop rotation; soybean was followed by cover crop, then soybean again under conventional tillage; each crop was grown for 12 months, and the soil was cleared before the next crop was planted. The plant density was 270,000 plants per ha.
  • No-tillage: Soybean–Cover crop–Soybean (NT: SB-CC-SB). In these plots, crop rotation took place; soybean was followed by cover crop, then soybean again under no-tillage; each crop was grown for 12 months and the soil was cleared before the next crop was planted. The plant density was 270,000 plants per ha.

2.4. Gas Sampling and Flux Measurements

The gas sampling procedure was conducted for a continuous 12-month period between December 2022 and December 2023 [50], making up to 30 measurements. Gas sampling was carried out weekly from December to February, and thereafter twice a month as the crop matured and once a month in the off-season. Gas sampling was performed between 10:00 a.m. and 12:00 p.m. Four polyvinyl chloride (PVC) static white chambers (40 cm length × 40 cm width × 25 cm height) were permanently installed (1 m apart) in each plot to a depth of 5-cm using a steel base before sampling and points were permanently marked using a global positioning system (GPS), so that they could be moved into the same spot after agronomic management practice, i.e., weeding. The static chambers were permanently installed for the duration of the trial; they were only uninstalled at the end of the season. During each gas sampling event, ambient samples (T0 air from the atmosphere) were taken away from the plots, buildings or cars; five at the beginning and five at the end of each sampling day, using 60 mL of gastight polypropylene syringes. During sampling, four random boxes were chosen for linearity check at 20-min intervals (five different times, T0, T20, T40, and T60) to confirm linear gas accumulation with closure time. The remainder of the boxes were terminally sampled at 40 min of closure (T40) by drawing air using 60 mL of gastight polypropylene syringes and storing the air in 40 mL vials. Gas samples were then analysed in the laboratory using a gas chromatograph [51] model 107 [52], and the daily fluxes were calculated using the equation below:
F = ρ V A C t C 0 t ( 273.15 T )
where F is the flux of N2O (g N2O-N ha−1d−1); ρ is the gas (1.26 g cm−3 N2O-N) under STP (273K and 101,325 Pa); V and A are the volume (0.125 m3) and area (0.25 m2) of C60 and Co (μm3 m−3) are the N2O concentrations 60 min after chamber closure (T60) and the ambient sample (T0), respectively; t is the time of chamber closure in hours (T60); and T is the air temperature, (K) at the time of sampling. Nitrous oxide fluxes were transformed into daily fluxes (kg N2O ha−1 day−1) for the calculation of cumulative N2O emissions. The cumulative emissions were determined as the total amount N2O released over the growing season. Nitrous oxide fluxes for non-sampling dates were interpolated between two sampling dates, and cumulative emissions calculated using the trapezoidal method [53,54].

2.5. Soil Sampling and Analysis

Soil samples were collected (0–10 cm) from each plot in each block at the beginning of the trial in 2020, to determine the soil status before the beginning of the study (baseline values). These soil samples were used to determine pH, texture, bulk density (BD), organic matter (OM), total phosphorus (P), potassium (K), sodium (Na), magnesium (Mg) and calcium (Ca). Soil pH was determined via the water method, using the procedure of the Agri Laboratory Association of Southern Africa Handbook [55]. Soil OM was determined using the loss-on-ignition method, where samples were oven dried in a furnace overnight [55] and the % OM was calculated using the following equation:
%   OM = W 0 + W 1 W 0 + W 2 ( W 2 + W 1 W 0 ) 100
where OM is organic matter; W0 is the weight of the crucible (g); W1 is the dry soil (g); and W2 is the dry soil after ignition (g).
Mineral N was determined by the potassium chloride extraction method [56], where 40 g of fresh soil sample were weighed and 80 mL of 2M KCL (1:2 soil/extractant ratio) were added for mineral N extraction and analysed colorimetrically [56]. Total N and total organic carbon (TOC) contents of soil were determined using the LECO method [57] and total P and cation exchange capacity using the Bray 1 method [57]. During each gas sampling event, soil samples were collected (0–10 cm) adjacent to each of the 24 chambers to determine gravimetric moisture. To measure the gravimetric water content, the soil samples were oven dried at 105 °C for 24 h or until a constant weight was obtained. The %WFPS was calculated using the gravimetric moisture content method, as described by [55]. This was calculated using the following equation:
% W F P S = S W C 1 B D / P D 100
where WFPS are water filled pores (%); SWC is the volumetric water content (%); BD is the bulk density (g cm−3); and PD is the particle density (2.65 g cm−3).
For soil porosity
S o i l   P o r o s i t y = 1 B D P D
where PD is the particle density of the soil, assumed to be 2.65 g cm−3. Volumetric water content was calculated by multiplying the bulk density (BD) and the gravimetric water content. Soil BD was determined at the beginning of the experiment by collecting an undisturbed soil sample by inserting metal rings into the soil with a hammer and determining the weight of the collected soil samples before and after oven drying at 105 °C for 48 h [58,59]. The bulk density was determined by the following equation:
B D = M V
where BD is the bulk density; M is the mass of the soil (g); and V is the volume of the soil (cm3).
The soil temperature was also measured on each gas sampling event using alcohol thermometers placed vertically in the soil at approximately 10 cm depth. Minimum and maximum temperature and precipitation were measured daily at the weather station located on the farm.

2.6. N Loss

The N loss (cumulative N2O) for each treatment was calculated using the following equation:
N   L O S S = E _ N 2 O   f e r t i l i z e d R _ N × 100
[58]
Here, E_N2O fertilized represents the measured emissions after application of fertilizer, and R_N is the N fertilizer rate (kg N ha−1).

2.7. Estimated Emissions per Product

The estimated emissions per product for each treatment were calculated using the following equation:
E s t i m a t e d   E m i s s i o n s   P r o d u c t = C u m u l a t i v e   E m i s s i o n s T o t a l   Y i e l d

2.8. Data Analysis Trials

Linear models were used to find the differences in N2O influenced by the no-till and conventional tillage system. If the interactions were significant at p < 0.05, the Tukey multiple comparison test was used to test differences between treatments. If the interaction was not significant, the analysis was rerun without the interaction term. Response data were transformed before analysis when required to meet the assumptions of the model. Data were sorted in Microsoft Excel; mean separation was performed using the GLM procedure in Statistical Analysis Software (9.0) (SAS). Correlation coefficients were obtained using Microsoft Excel.

3. Results

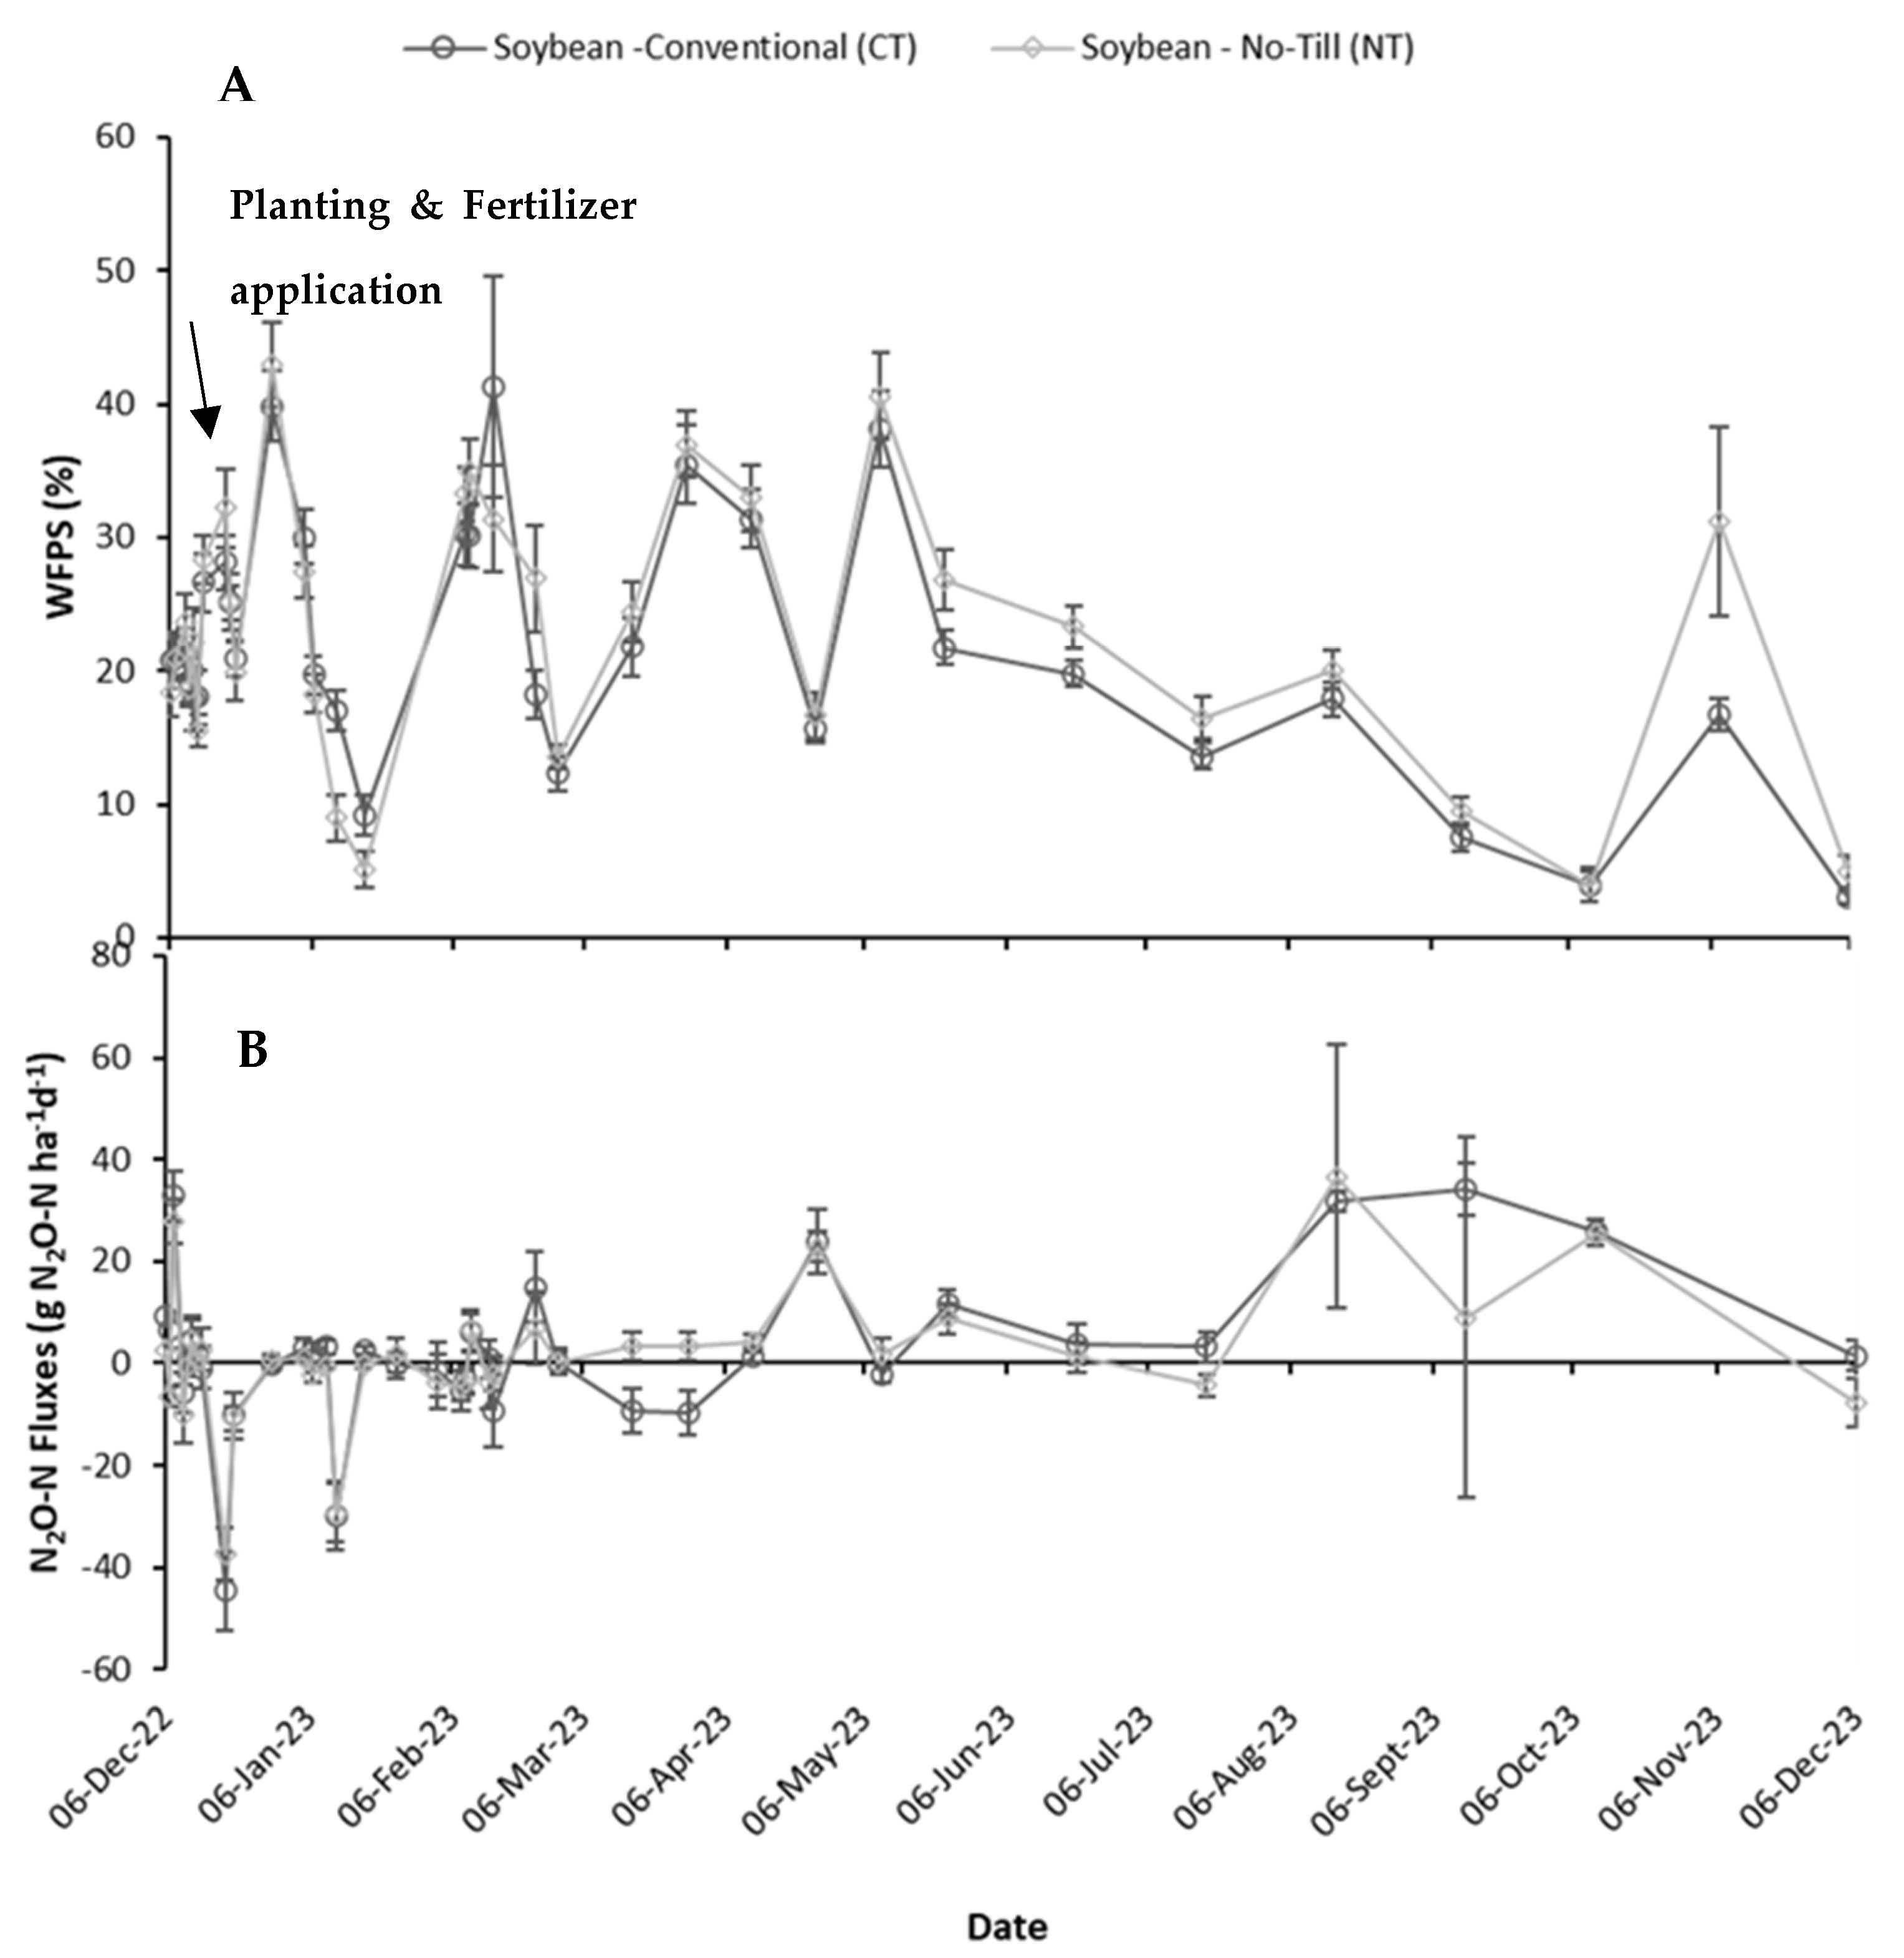
3.1. Meteorological Data

3.1.1. Rainfall Patterns and Atmospheric Temperature During the Experimental Period

The total rainfall for the entire experimental period (October 2022 to December 2023) was 753.22 mm and the highest rainfall event of 177.3 mm was recorded in November 2022; the second highest rainfall events of 105.7 and 99.3 mm was received in March and February 2023, respectively (Figure 1). The highest air temperature was 31.7 °C recorded in January 2023, and the second highest temperature was 30.5 and 29.1 °C recorded in November and March 2023, respectively. The highest soil temperature was 24.7 °C recorded in December 2023, followed by 24.2 °C recorded in March 2023.

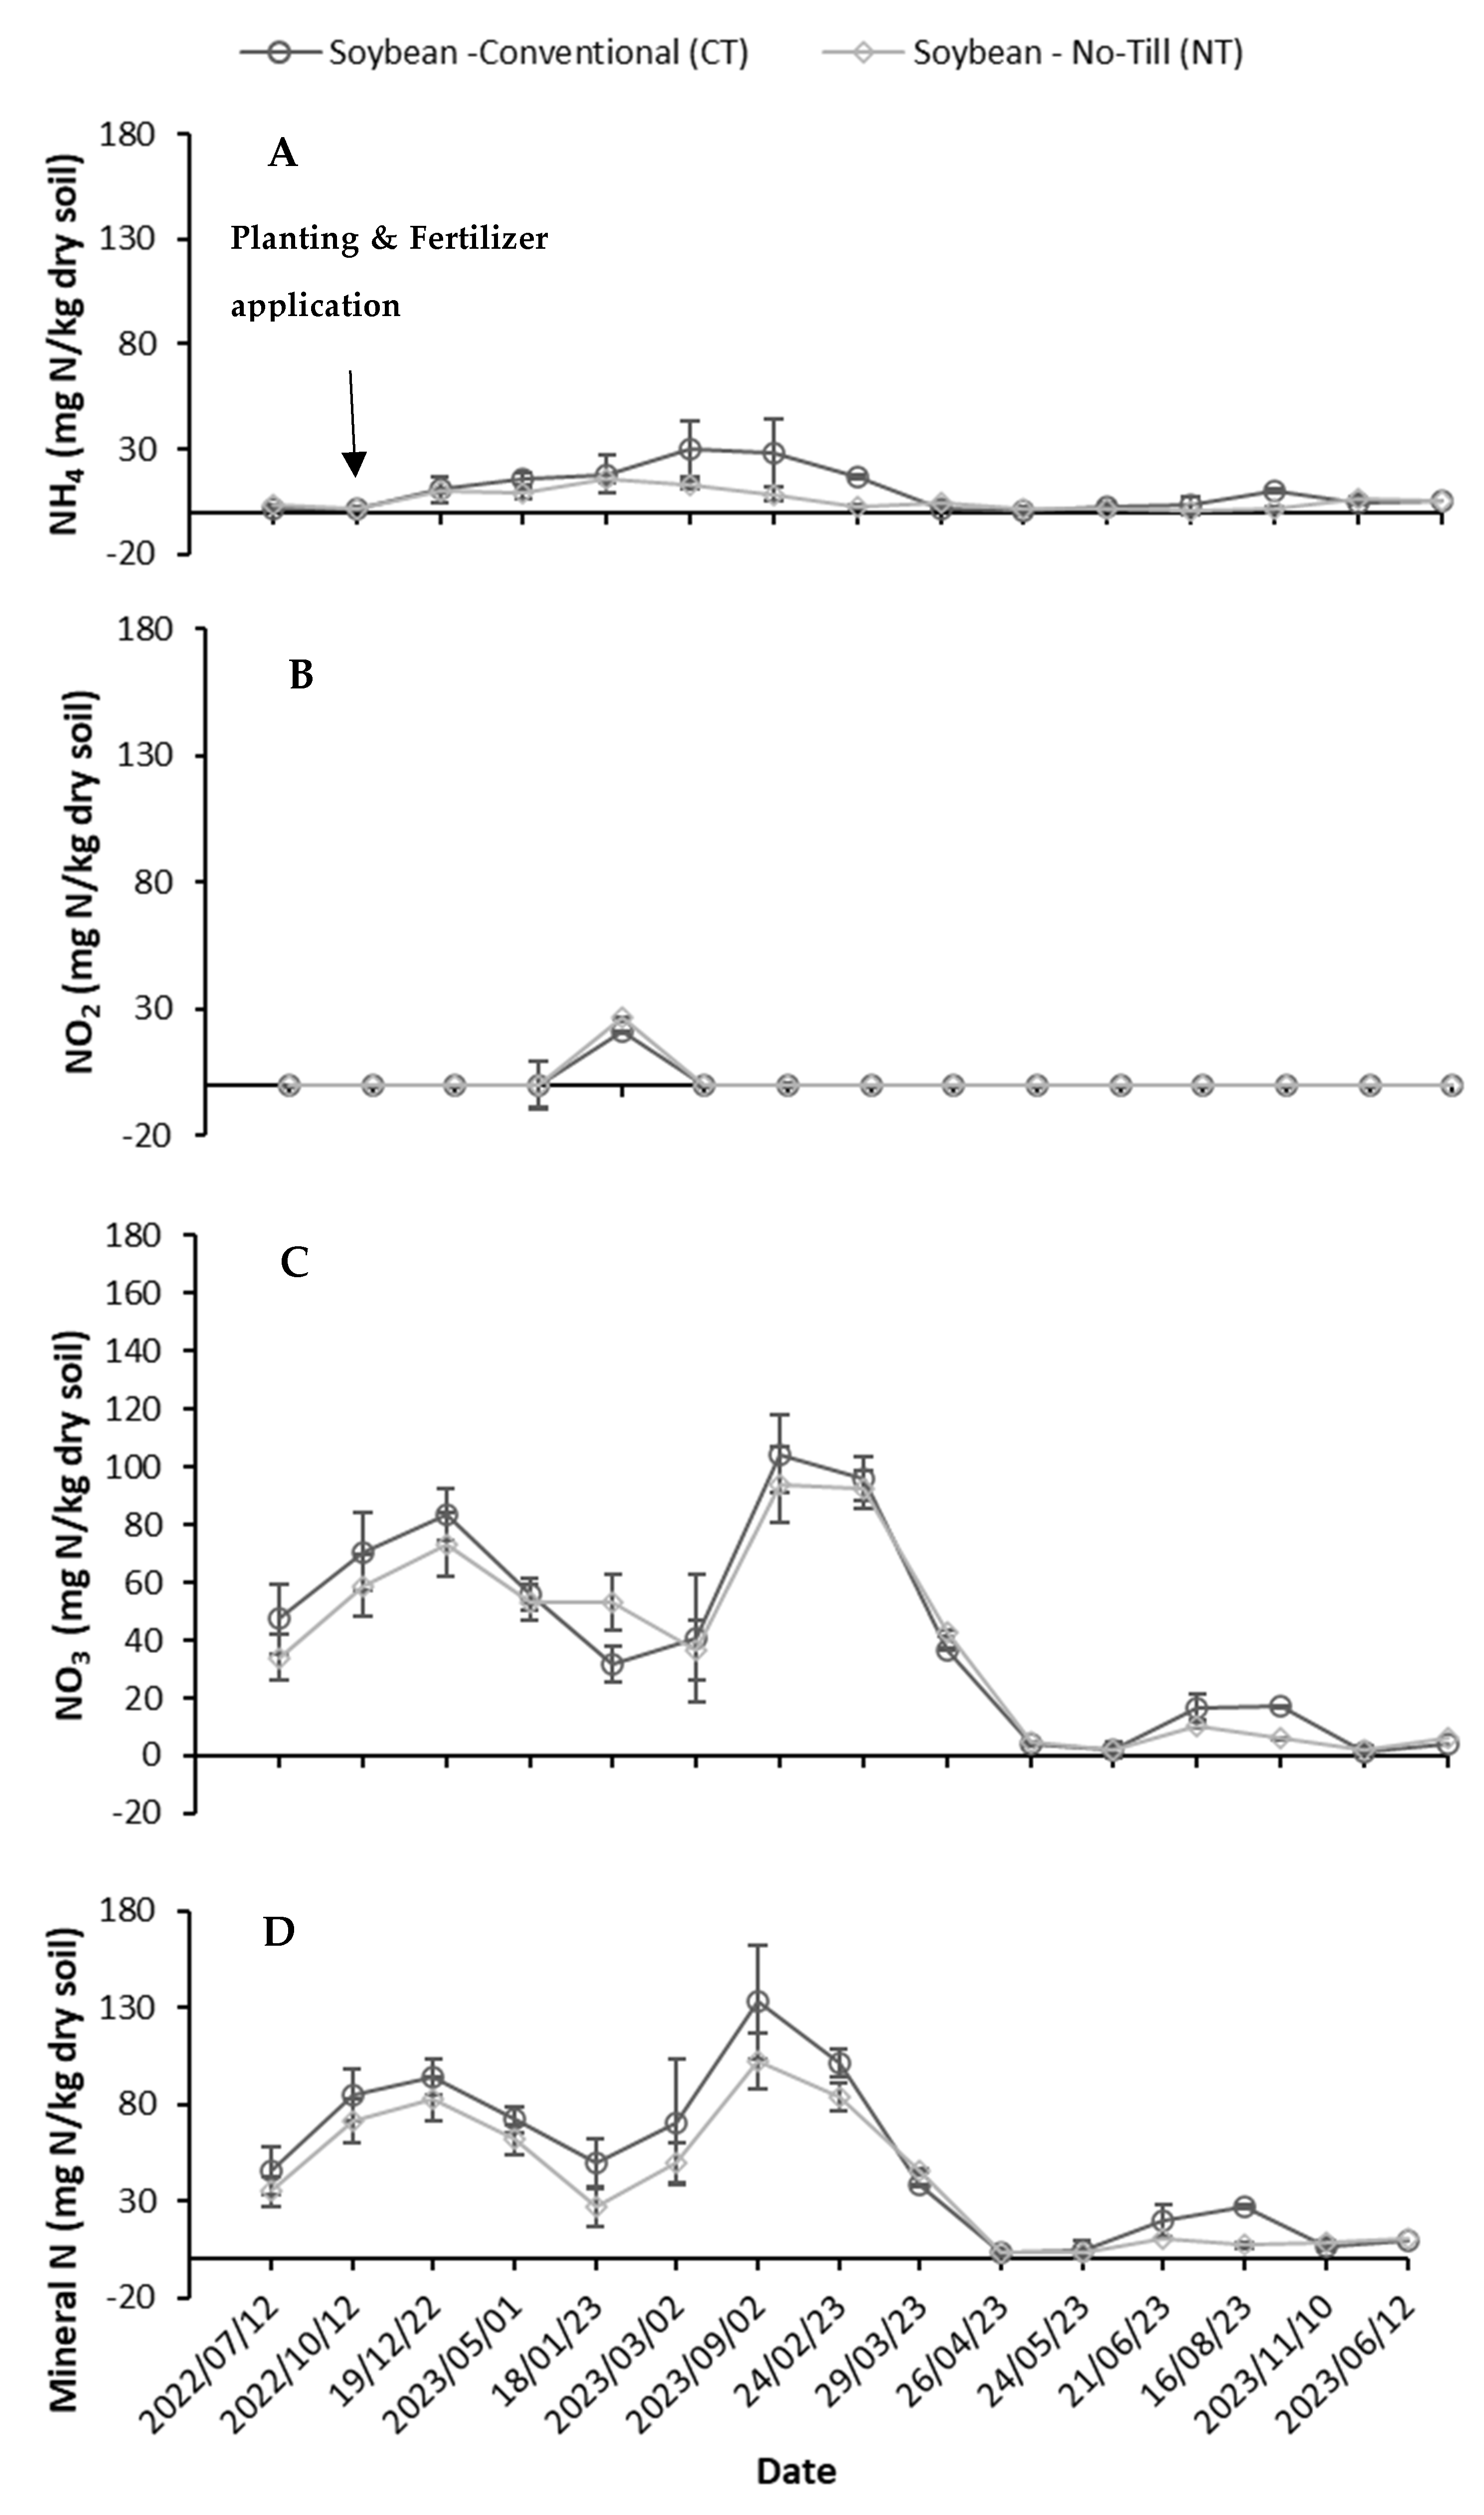
3.1.2. Soil Variables

General Soil Characteristics Before and After the Experiment
Different soil parameters were recorded at the beginning and end of the trial in December 2023 (Table 1). Sand% ranged from 88 ± 4.67 and 93.67 ± 4.25%, with the highest of 93.67 ± 4.25% in NT at the beginning of the trial, which is significantly different from CT (LSD = 1.95). The highest silt percentage of 6.92 ± 2.88 was recorded in CT after the trial, which was significant (LSD = 1.64) from NT. The highest clay % of 5.17 ± 1.59 was recorded in NT after the test; however, it was not significantly (LSD = 1.35) different from CT. The soil pH ranged from 5.91 ± 0.39 and 6.3 ± 0.5, with the highest pH of 6.3 ± 0.5 in NT before the trial, which was not significantly (LSD = 0.29) different from CT. Soil bulk density ranged from 1.4 ± 0.17 and 1.52 ± 0.12, with the highest bulk density (1.52 ± 0.12) recorded in NT before the trial, which was significantly (LSD = 0.09) different from CT. The total C ranged from 1.44 ± 0.26 and 2.07 ± 0.77 g C kg−1 of dry soil. The highest total C of 2.07 ± 0.77 was in CT after the trial, which was, however, not significant (LSD = 0.4) for NT. The total N ranged from 27.23 ± 31.62 and 342.59 ± 84.37 mg N kg−1 dry soil, with the highest total N of 342,59 ± 84.37 mg N kg−1 dry soil in CT before the trial, which was not significantly (LSD = 49.45) different from NT. Organic matter % (OM) ranged from 3.04 ± 1.29 and 13.88 ± 4.06%. the highest %OM (13.88 ± 4.06) was recorded CT before the trial, and there was no significant difference between the treatments. The %WFPS ranged from 3.05 ± 1.88 and 22.91 ± 4.74, and the highest %WFPS of 22.91 ± 4.74% was in NT before the trial, which was, however, not significant (LSD = 2.91) in CT. Soil porosity ranged from 43 ± 4.4 and 46 ± 6.5%, with the highest 46% in CT, which was not significant (LSD = 3.3) from NT. Soil NH4+ ranged from 1.24 ± 2.19 and 5.21 ± 3.46 mg N kg−1 dry soil. The highest NH4 of 5.21 ± 3.46 was in NT after the trial, which was, however, not significant (LSD = 2.32) from CT. Soil NO3 ranged from 4.41 ± 2.65 and 47.3 ± 60.06 mg N kg−1 dry soil. The highest NO3 of 47.3 ± 60.06 mg N kg−1 dry soil was recorded in CT, which was not significantly (LSD = 19.54) different from NT. NO2 ranged from 0.015 ± 0.012 and 0.038 ± 0.057 mg N kg−1 dry soil, with the highest of 0.038 ± 0.057 mg N kg−1 dry soil recorded in NT, which was not significantly (LSD = 0.19) different from CT. The soil C/N ratio ranged from 4.77 ± 1.17 and 104.89 ± 73.93, with the highest C/N ratio of 104.89 ± 73.93 recorded in NT after the trial, which was significantly (LSD = 32.66) different from CT. Hydraulic conductivity ranged from 0.16−2 ± 0.37−2 and 0.33−2 ± 0.39−3 cm/s, with the highest of 0.33−2 ± 0.39−3 cm/s recorded in NT, which was, however, not significantly (LSD = 0.18−2) different from CT.
Soil Measurements
The average WFPS for the trial was 22.2%. The %WFPS ranged from 3 to 43%; the highest of 43 ± 4.73 was recorded in December 2022 in NT and the lowest of 3.05 ± 1.88 was recorded in CT in December 2023 (Figure 2), which was not significantly (LSD = 2.91) different from CT. Soil NH4 ranged from 1.24 ± 2.19 to 5.21 ± 3.46 mg N kg−1 dry soil in (Figure 3). The highest NH4+ was 5.21 ± 3.46 in NT, which was however, not significant (LSD = 2.32) in CT. The NO3−-N of the soil ranged from 1.59 to 104.56 in 2023 (Figure 3). The highest NO3-N was 104.56 recorded in CT, which was significantly (LSD = 2.39) different from NT. NO2-N ranged from 0.015 ± 0.012 to 0.038 ± 0.057 mg N kg−1 dry soil; the highest NO2−-N was 0.038 ± 0.057 mg N kg−1 dry soil recorded in NT, which was not significantly different (LSD = 0.19) from CT (Table 1).

3.1.3. Nitrous Oxide Emissions

The N2O fluxes ranged from −44.6 to 36.6 g of N2O-N ha−1 d−1. The lowest flux was recorded on 19 December 2022 (Figure 2). There was a peak in February after the application of top-dressing fertilizers on 3 February 2023, and after an increase in %WFPS. The highest peak was observed in August–September from both treatments after harvest, the fluxes were significantly (LSD = 0.3) higher from CT to NT in the plots sampled. Fluxes decreased thereafter; fluxes decreased in NT compared to CT. Low N2O emissions were at the same time with low %WFPS in December 2023 (Figure 2).

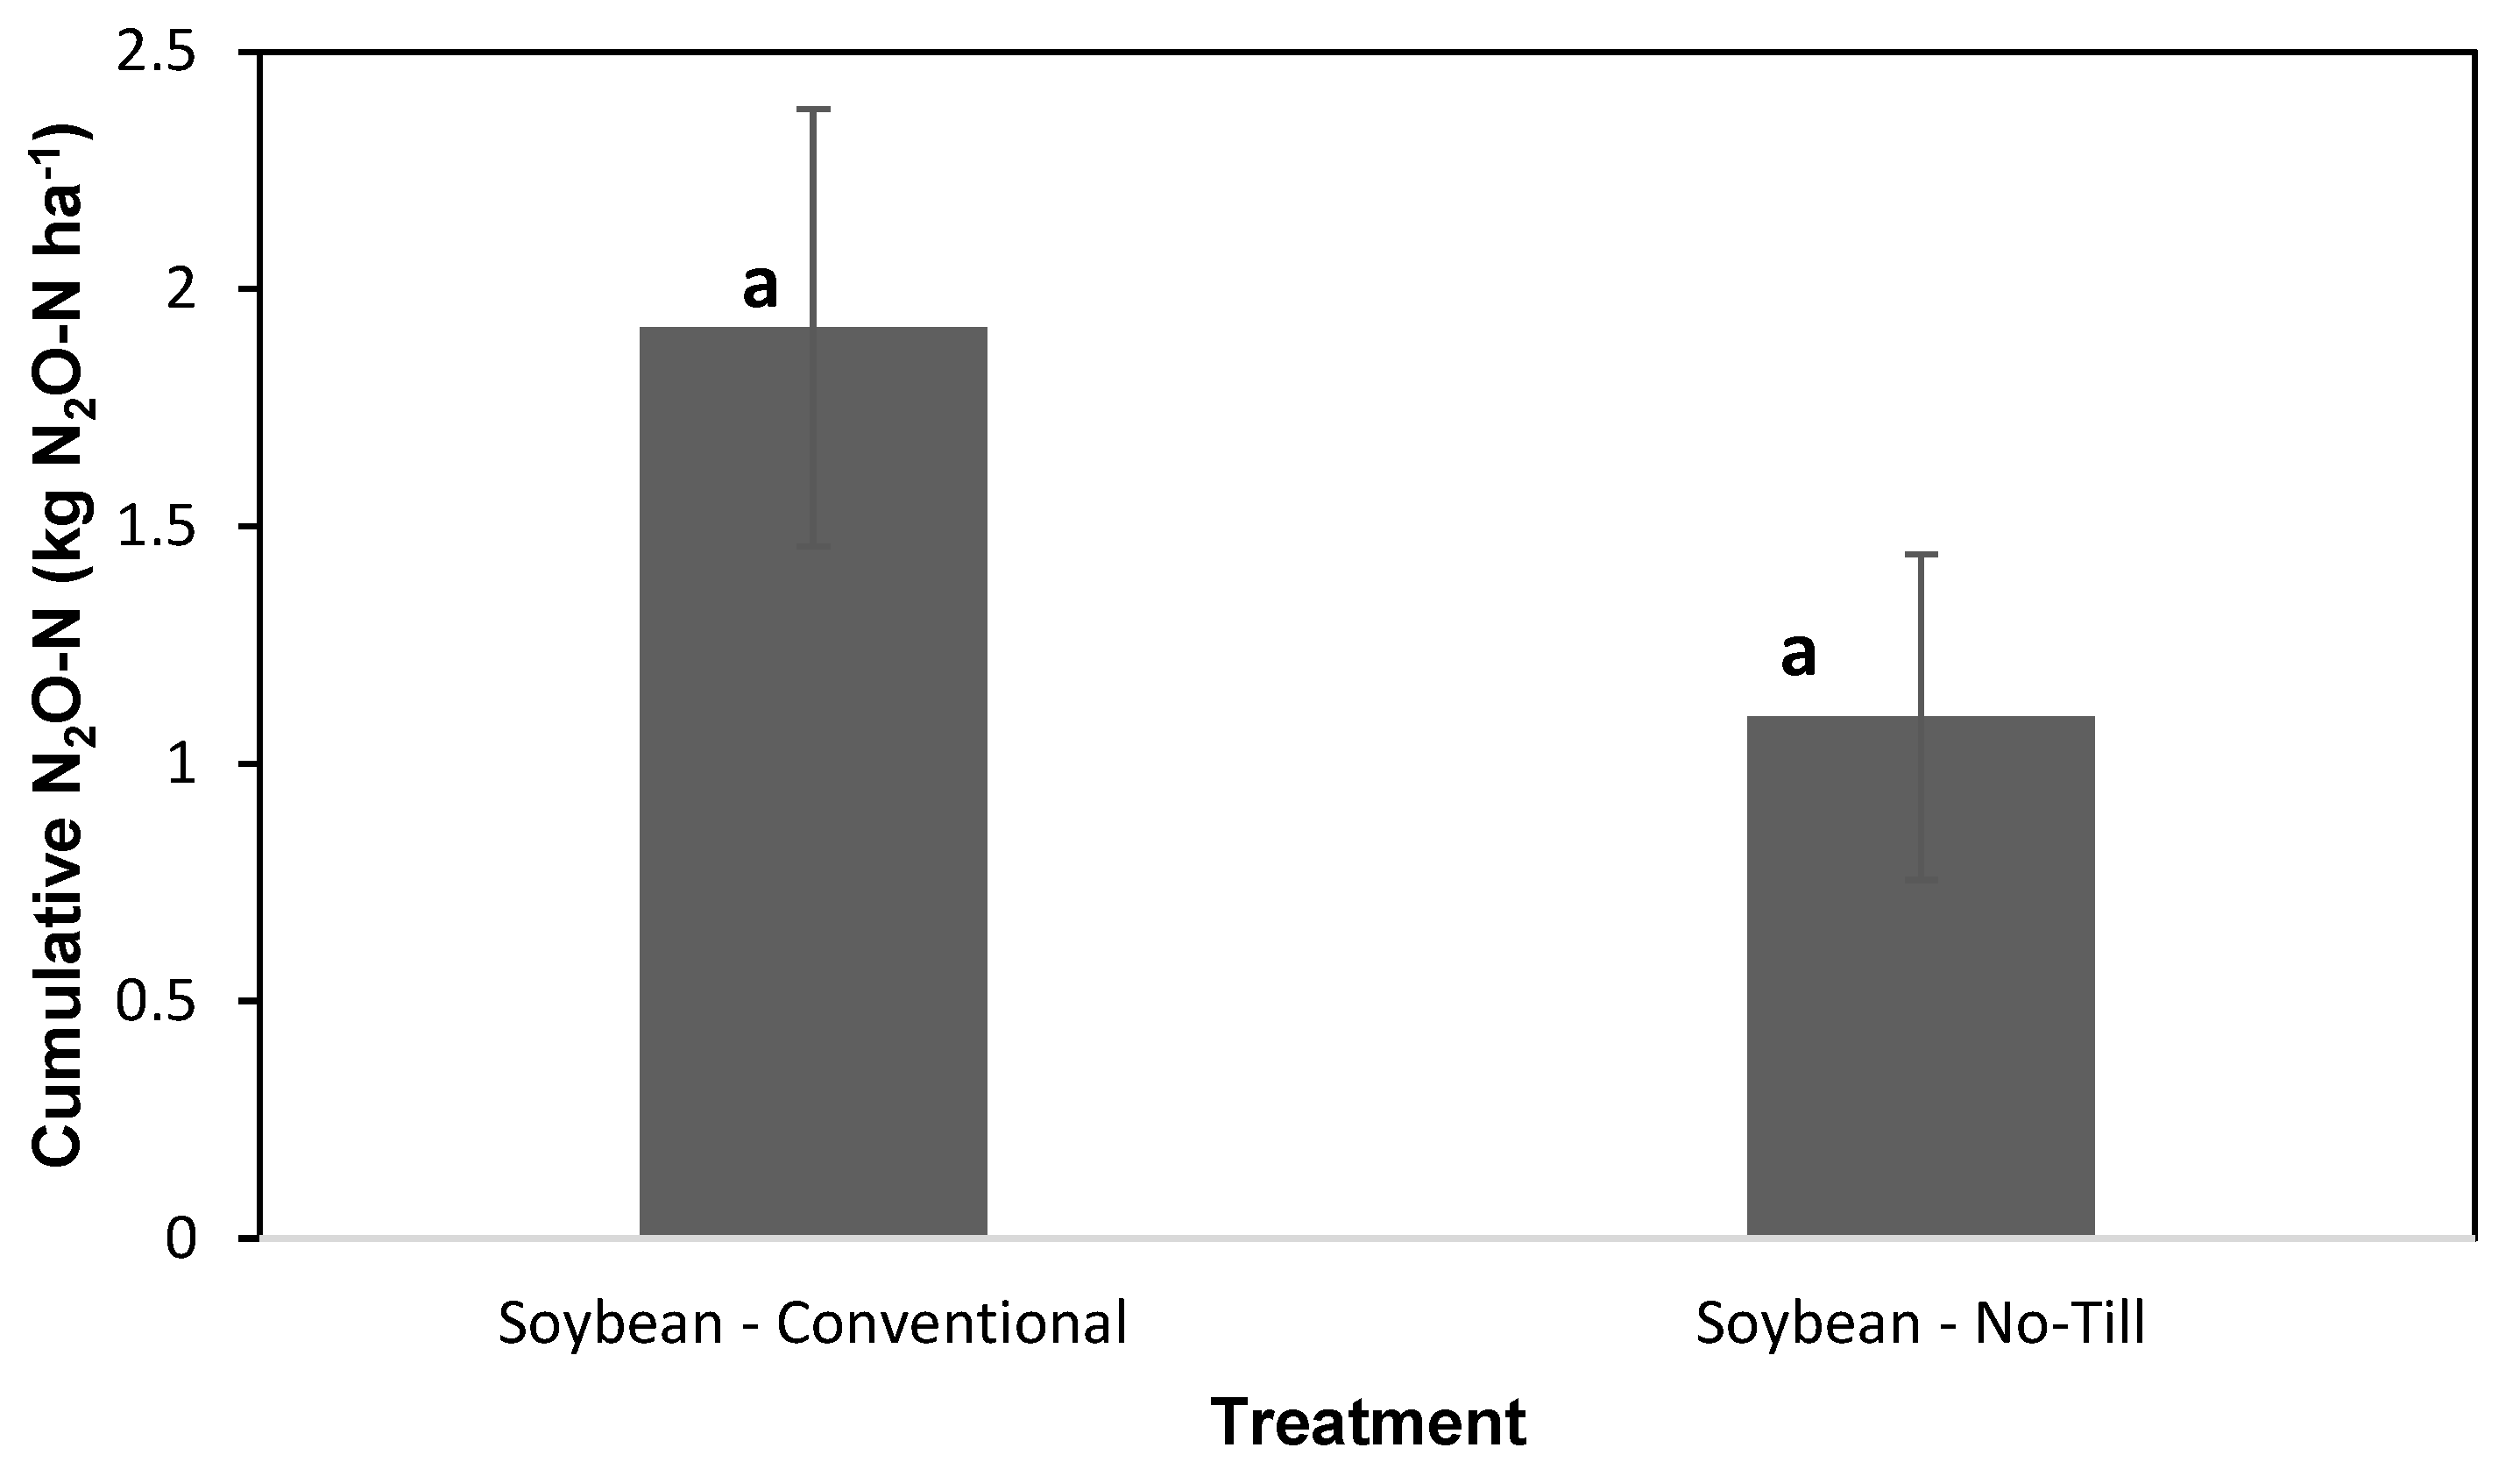
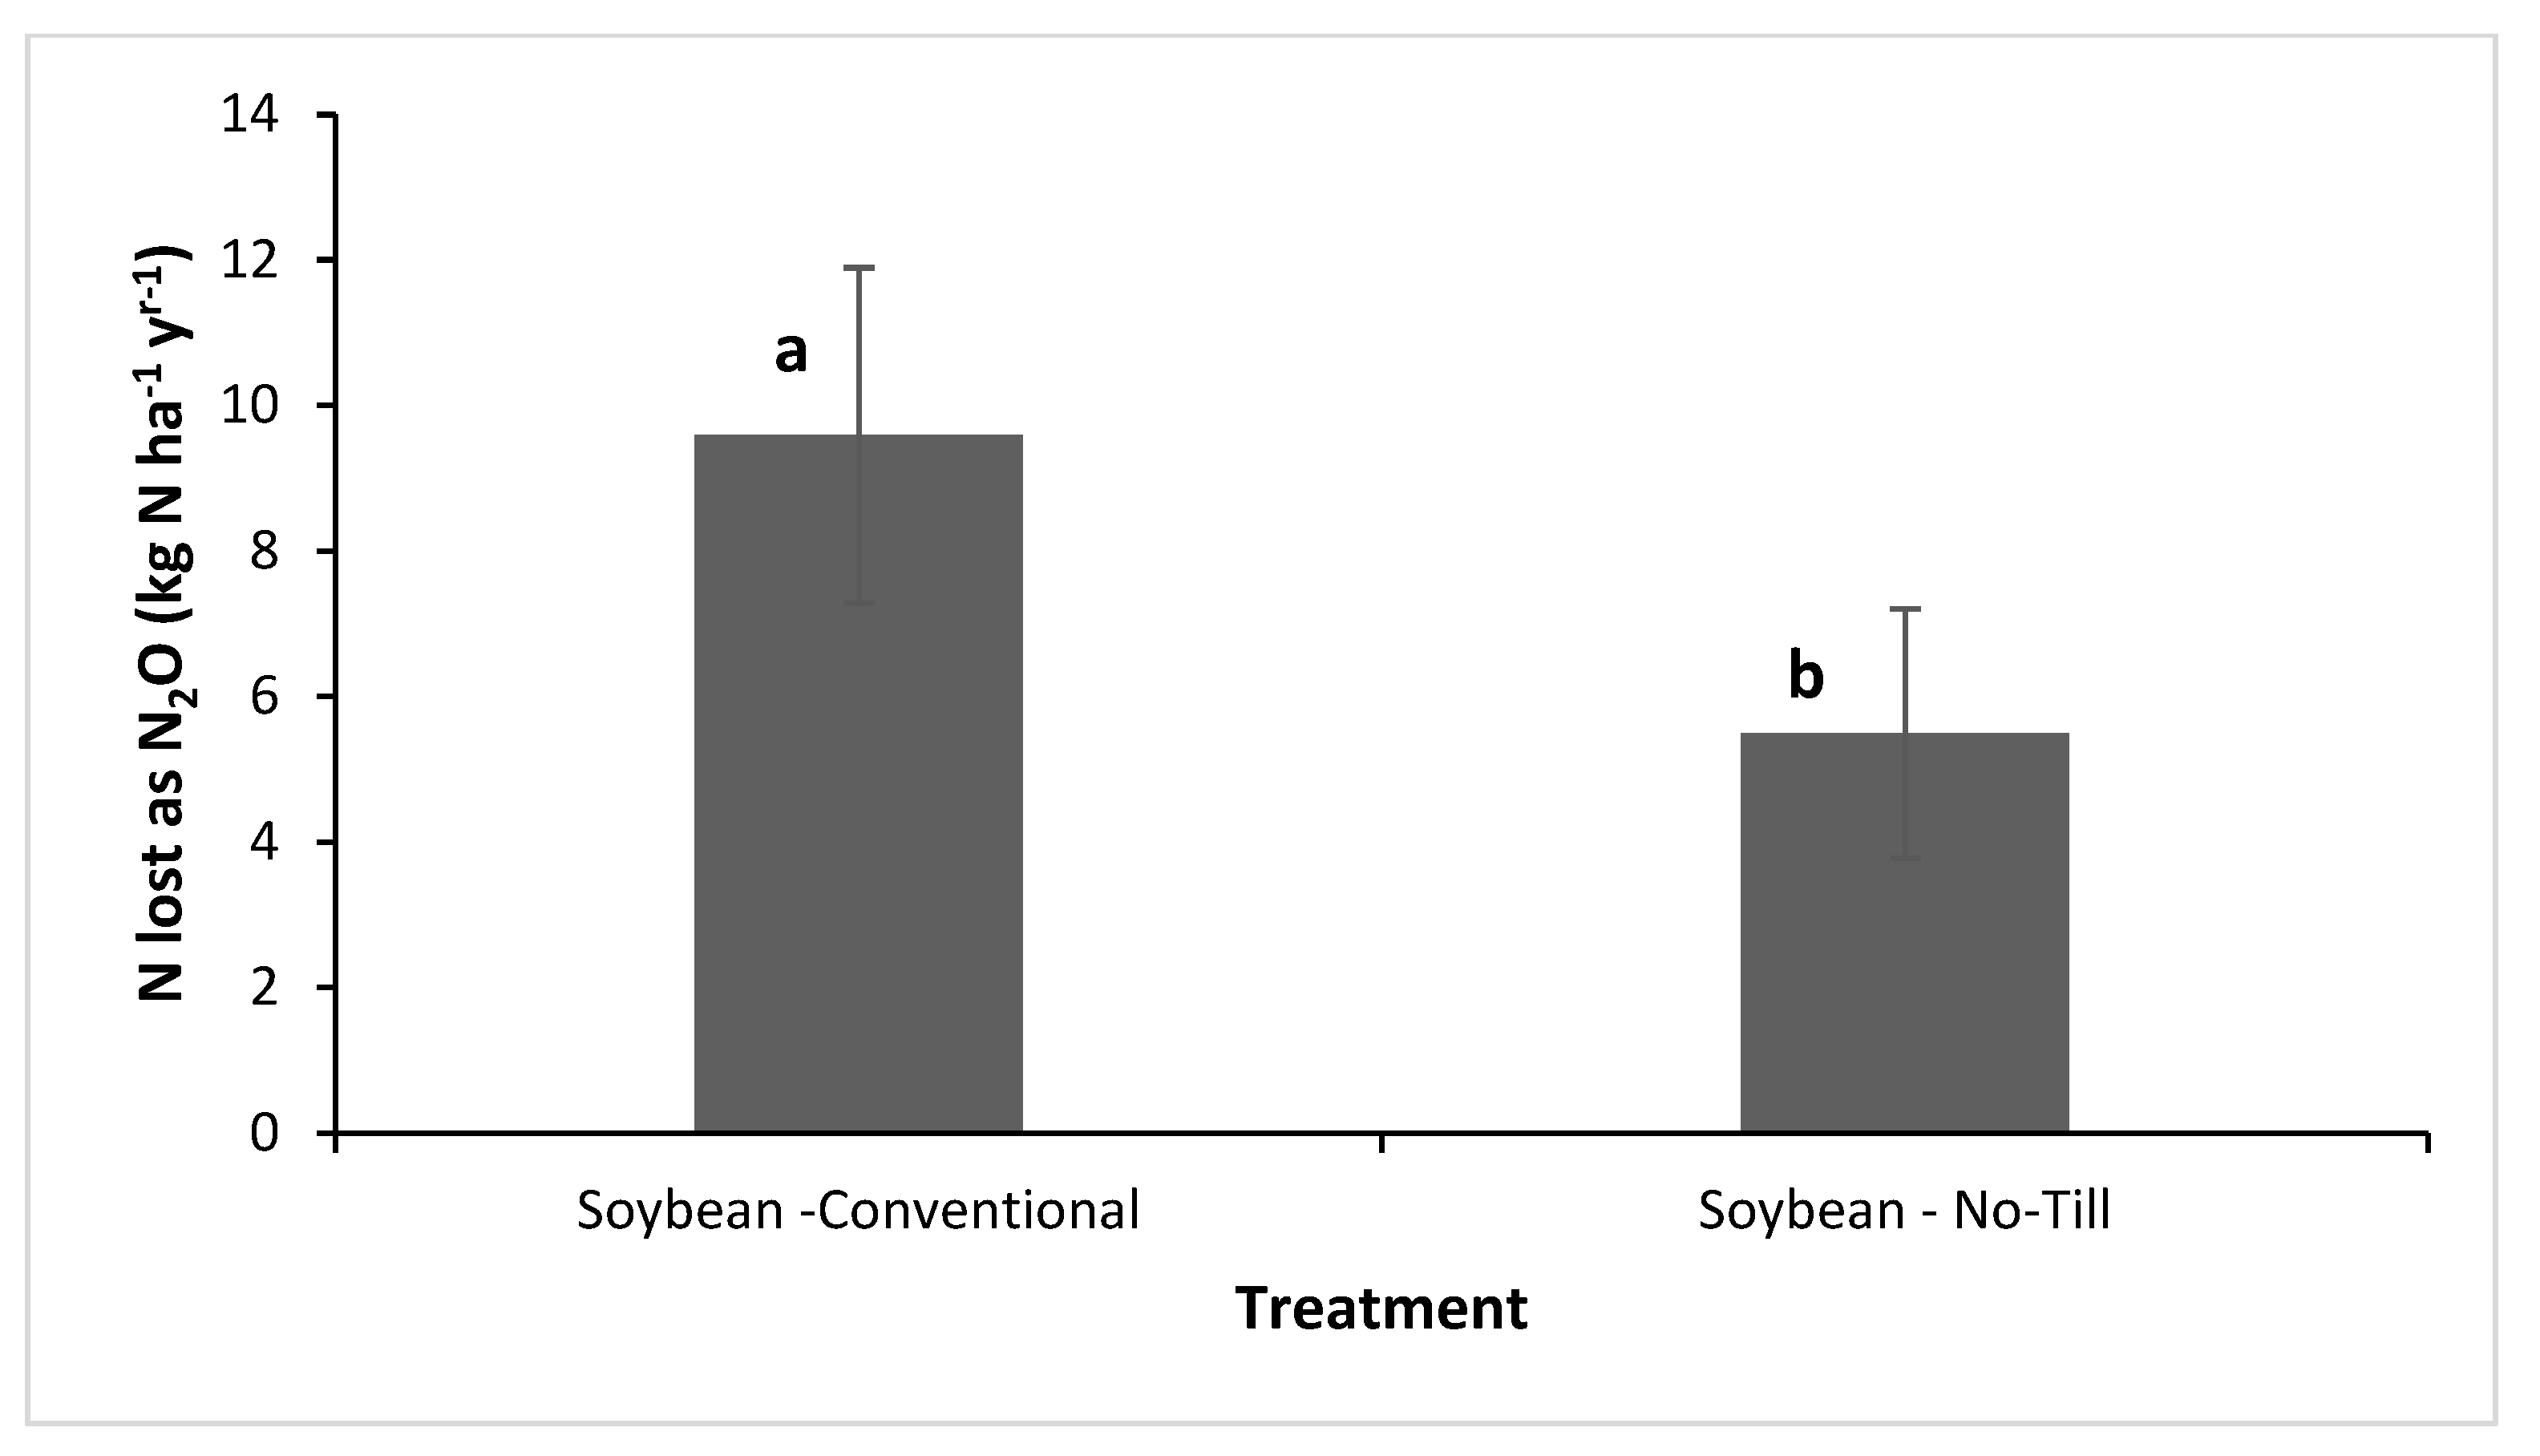
3.1.4. Cumulative N2O Emissions and N Lost as N2O

The highest cumulative emissions (1.9 kg of N2O-N ha−1) were recorded in CT plots (Figure 4). The highest cumulative N2O emissions for the different seasons show that CT has the highest N2O emissions in spring 0.99 ± 4.45 kg N2O-N ha−1, which was, however, not significantly (LSD = 0.29) different from NT (Figure 5). The lowest N2O-N emissions were recorded during the winter season (−0.26 ± 0.22 kg of N2O-N ha−1) in NT, which was significantly different (LSD = 0.19) from CT (Figure 5). The N lost as N2O ranged from 0 to 9.6% (Figure 6). The highest N lost as N2O of 9.68% was recorded in CT; there was a significant difference between CT and NT (LSD = 1.6).

3.1.5. NT and CT Practices on Yields
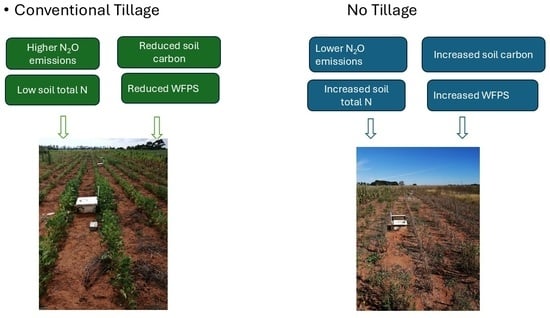
The total yield was higher in CT compared to NT in the rotation of the soybeans. The highest total dry seed yield was 0.93 t/ha recorded in CT (Figure 7). The highest total crop dry weight and total biomass were recorded in CT. These were 2.13 and 1.21 t/ha, respectively. There was a significant difference between NT and CT (LSD = 0.23). The estimated emissions per product were higher in NT (1.67 kgNha−1 dry matter) and lower in CT (0.95 kgNha−1 dry matter) (Table 2) for the duration of the trial.

4. Discussion

4.1. The Role of Soil Variables in Daily N2O Fluxes

The highest N2O fluxes in this trial were recorded in December 2022–March 2023 (Figure 2). These high fluxes were recorded at the same time with planting and fertilizer application and episodes of precipitation om December 2022 and February 2023. These peaks followed rainfall events occurring in February-March. During this period of the year the soil temperature was high (24.2 °C) (Figure 1). The cause of this peak may have been the high soil temperature and moisture content significantly influencing N2O production by increasing microbial activity, enhancing enzyme activity and accelerating organic matter decomposition [12,44]. This is in line with other studies such as [59] who found that %WFPS and temperature are the main drivers of N2O fluxes; also [60,61,62] who reported that N2O fluxes increased exponentially with soil temperature and, who reported that N2O fluxes increase by five to nine times with each 10 °C temperature increase and microbial nitrification and denitrification increase three-fold with a 10 °C increase. During denitrification, N03− is reduced to NO to N2O. The high temperature (25–35 °C) encourages microbial enzyme activity. This accelerates denitrification (anaerobic) and nitrification (aerobic).
The high temperature and %WFPS may have stimulated high microbial activity, which in turn increased denitrification when the soil became saturated and oxygen levels decreased [63,64]. High N2O fluxes also responded to the application of inorganic fertilizers in the soil and the amount of crop residues from crop rotation present in the soil, as this may have contributed soluble C to denitrifiers when mineralized [25,65,66,67].
Ref. [68] found that N2O emissions were high at 65% WFPS and in water-saturated soils, where N2O is mainly formed by denitrification of nitrate. The highest %WFPS in our study was approximately 44%, indicating that N2O emissions in our study may have mainly been the result of nitrification, but we did not quantify this in the current study. This is in agreement with [69,70], who reported that most of the N2O emissions are from nitrification when the WFPS is below 60%, while an increased conversion from N2O to N2 occurs at increased soil water content.
The large peak in N2O fluxes immediately after N fertilizer application in December 2022 was the result of that N application (Figure 2), similar to findings by [71], who reported a 75% increase in mean N2O in soybean after N fertilizer application. There was a positive correlation (p = 0.05) between N2O emissions and N in the soil (Figure 8). These results are in line with previous authors [72,73,74], who found that N application increases N availability in the soil and promotes N2O emissions compared to unfertilized soil. Refs. [75,76,77] found that high N-NH4+ in the soil leads to greater nitrification. Refs. [78,79] highlighted that a high number of N2O emissions may have been because the NO2− formed during the nitrification process can be used as electron receptor if O2 is limited, and denitrification can occur after nitrification, when soil conditions are conducive.

4.2. NT and CT Practices on Cumulative N2O Emissions and N Lost as N2O

Cumulative N2O emissions were higher in CT compared to NT, and there was a peak during planting (Figure 4). NT reduced emissions, in agreement with the results of [64], who found that soybean rotation had lower N2O emissions compared to plots with monoculture soybean under NT and CT. The lower rate of N2O emissions from soybean crops supported the conclusion of [80], who found that N is released from root exudates during the growing season, and decomposition of previous crop residues influence N2O emissions much more than the biological N fixation process. In August immediately after harvesting, the emissions were higher in NT compared to CT, in line with an increase in % WFPS, bulk density and high C in the soil from crop residues. High WFPS in NT is due to residues covering the soil surface, thus reducing water evaporation from the soil. Since the NT soils hold more water, this led to heavier and more compacted soils, contributing to higher bulk density in NT. There was a positive correlation (p = 0.21) between N2O emissions and soil C (Figure 8). These results agree with [81,82,83], who found that increased soil moisture (WFPS) in no-till treatments increased the amount of denitrifying activity and, subsequently, N2O production. In September, N2O emissions were higher in CT compared to NT; this was after harvest, when the soil had been disturbed as the plants were pulled from the soil and some residues were incorporated into the soil. This increased the organic matter in the soil, leading to a higher emission of N2O. There was a strong correlation (p = 0.43) between N2O emission and soil organic matter (Figure 8). These results are in line with [6,84,85], who found that incorporating crop residues into the soil increased N2O emissions, mainly in CT. The decrease in N2O emissions with NT treatment could also be due to the fact that soybean roots have the potential to denitrify the last step of the denitrification process (N2O to N2) [86], and this also has the potential to reduce N2O derived from nodules, fertilizer N, and soil organic matter [87].
Refs. [88,89] reported reduced N2O emissions in NT compared to CT. This is possibly due to sequential nitrification and denitrification by nitrifiers, such as Nitrosomonas sp. and Nitrobacter sp., and denitrifiers in optimal soil temperature and moisture conditions. In our trial, in CT most of the emissions occurred in spring, followed by autumn; this is when the temperature gradually increased (Figure 5). In NT, the highest emissions occurred in autumn, when the average soil temperature was 22 °C (Figure 1). This is in line with Signor [11], who found that N2O production during nitrification increases when the soil temperature is between 5 and 40 °C. Peigne et al., 2007 [90] reported that N availability was lower in NT than in CT, which is consistent with our study (Table 1). Refs. [91,92] found that the lower availability of N in NT was due to a low N mineralisation rate in NT and immobilisation accompanied by slow soil organic matter decomposition [93].
The loss of N as N2O was the highest in CT, rather than in NT (Figure 6). These results are in line with [94] who found that most of the simulated loss of nitrogen are from drains flow and net mineralisation, leaching. Ref. [95] found that N loss to drain flow was highest mainly due to high precipitation events during or after fertilizer application.

4.3. NT and CT Practices on Yields

The total dry crop yields under CT were found to be higher in CT than in NT. Total dry crop yield in CT was 61% higher than in NT (Figure 6). The higher yields in CT may be related to the high N, C, porosity and organic matter recorded in CT, as these soil properties improve nutrients available for plant uptake, thus increasing yields (Table 1). Crop residues are mixed with soil under CT, thus reducing soil porosity and bulk density. CT mix crop residues into the soil this leads to high organic matter, C and N temporarily, especially in the topsoil. It also creates a uniform mixture of organic and mineral soil layers. This blending effect can lead to high average organic matter content. Aeration from the tillage accelerates microbial decomposition. Initially, this can release nutrients (including nitrate and mineral N) and increase microbial biomass, temporarily raising measurable N and increase yields. The NT plots had a higher % of sand, high bulk density, and lower total C and N. These results are in line with [96], who found that soybean yields were lower on sandy soils compared to loamy soils. Ref. [97] also found low yields in soybeans under NT rather than in CT, due to the soil having lower water holding capacity, N insufficiency due to soil leaching, and the reduced root length under NT. Ref. [51] found significantly low yields in the dry season. The possibility of low yield in NT is possibly due to the fact that soybean NT did not respond to the extra soil moisture available at the lower depth because plant root depth may be delayed under NT [98]. The emissions per product was higher in NT (1.67 kg N ha−1 dry matter) compared to CT (0.95 kg N ha−1 dry matter), as presented in Table 2. These results were almost similar to those of [99], who found emissions per product of 1 kg N ha−1 dry matter, both under CT and NT.

5. Conclusions

This study provided comprehensive and quantitative results of NT and CT effects on N2O emissions in a semi-arid region. In general, NT reduced N2O emissions in soybean rotation. The reduction in NT treatment was more prominent during the dry season. No-tillage is worth practicing. These findings agree with those in the published literature. The total dry matter yield was lower under NT; however, the dry matter yield may be improved with long term duration of NT.

Author Contributions

N.O.D. was involved in conceptualizing, methodology, formal analysis, data curation, writing—original draft, writing—review and editing. L.B. was involved in planning and supervising the work. L.M.C. was involved in planning and supervising the work. She commented on the manuscript. A.L.-L. was involved in processing the gas data, she also commented on the manuscript. J.C.D. was involved in planning and supervising the work. He contributed to the design and implementation of the research, to the analysis of the results and to the writing of the manuscript. All authors have read and agreed to the published version of the manuscript.

Funding

This research was funded by the UK Biotechnology and Biological Sciences Research Council, Grant BB/X002993/1, and the New Zealand Government to support the objectives of the Global Research Alliance on Agricultural Greenhouse Gases. It was also funded by the European Joint Programme for EJP Soil The effect of conservation agriculture interventions on greenhouse gas emissions, grant number EJP SOIL/108/CropGas/2022. Rothamsted Research’s contribution to this study was funded by the UK Research and Innovation Research Council, and the Biotechnology and Biological Sciences Research Council (UKRI-BBSRC) under the award BB/X002993/1 (2022–2024). National Research Foundation (Grant number: PMDS22051711843) also contributed to the success of this research.

Data Availability Statement

Data are contained within the article.

Acknowledgments

Special thanks to Gert Ceronio for allowing us to carry out the project in the Grain SA experiment. The authors thank Boitumelo Molise for assistance with fieldwork and gas sampling and Boingotlo Tshabang for assistance with laboratory analysis.

Conflicts of Interest

The authors declare no conflict of interest.

References

  1. Ramzan, S.; Rasool, T.; Bhat, R.A.; Ahmad, P.; Ashraf, I.; Rashid, N.; ul Shafiq, M.; Mir, I.A. Agricultural soils a trigger to nitrous oxide: A persuasive greenhouse gas and its management. Environ. Monit. Assess. 2020, 192, 436. [Google Scholar] [CrossRef]
  2. Montzka, S.A.; Dlugokencky, E.J.; Butler, J.H. Non-CO2 greenhouse gases and climate change. Nature 2011, 476, 43–50. [Google Scholar] [CrossRef]
  3. Butterbach-Bahl, K.; Dannenmann, M. Denitrification and associated soil N2O emissions due to agricultural activities in a changing climate. Curr. Opin. Environ. Sustain. 2011, 3, 389–395. [Google Scholar] [CrossRef]
  4. Sajjad, M.; Hussain, K.; Wajid, S.A.; Saqib, Z.A. The Impact of Split Nitrogen Fertilizer Applications on the Productivity and Nitrogen Use Efficiency of Rice. Nitrogen 2024, 6, 1. [Google Scholar] [CrossRef]
  5. Ciarlo, E.A.; Llorente, M.M.; Conti, M.E.; Giardina, E.B. Soybean residue effect on carbon fractions and gaseous nitrogen losses at contrasting moisture contents. Commun. Soil Sci. Plant Anal. 2009, 40, 2756–2772. [Google Scholar] [CrossRef]
  6. Aulakh, M.; Walters, D.; Doran, J.; Francis, D.; Mosier, A. Crop residue type and placement effects on denitrification and mineralization. Soil Sci. Soc. Am. J. 1991, 55, 1020–1025. [Google Scholar] [CrossRef]
  7. Lai, T.V.; Farquharson, R.; Denton, M.D. High soil temperatures alter the rates of nitrification, denitrification and associated N2O emissions. J. Soils Sediments 2019, 19, 2176–2189. [Google Scholar] [CrossRef]
  8. Russell, C.; Fillery, I.; Bootsma, N.; McInnes, K. Effect of temperature and nitrogen source on nitrification in a sandy soil. Commun. Soil Sci. Plant Anal. 2002, 33, 1975–1989. [Google Scholar] [CrossRef]
  9. Hayatsu, M.; Tago, K.; Saito, M. Various players in the nitrogen cycle: Diversity and functions of the microorganisms involved in nitrification and denitrification. Soil Sci. Plant Nutr. 2008, 54, 33–45. [Google Scholar] [CrossRef]
  10. Van Groenigen, J.; Huygens, D.; Boeckx, P.; Kuyper, T.W.; Lubbers, I.; Rütting, T.; Groffman, P. The soil N cycle: New insights and key challenges. Soil 2015, 1, 235–256. [Google Scholar] [CrossRef]
  11. Signor, D.; Cerri, C.E.P. Nitrous oxide emissions in agricultural soils: A review. Pesqui. Agropecuária Trop. 2013, 43, 322–338. [Google Scholar] [CrossRef]
  12. Bizimana, F.; Dong, W.; Timilsina, A.; Raseduzzaman, M.; Li, X.; Zhang, Y.; Hu, C. Effects of Straw Amendment in Combination with Synthetic N Fertilizer Addition on N2O, N2, and Their Stoichiometric Ratios in Three Different Agro-Ecosystems. Agronomy 2024, 14, 887. [Google Scholar] [CrossRef]
  13. Powlson, D.; Saffigna, P.; Kragt-Cottaar, M. Denitrification at sub-optimal temperatures in soils from different climatic zones. Soil Biol. Biochem. 1988, 20, 719–723. [Google Scholar] [CrossRef]
  14. Canion, A.; Kostka, J.E.; Gihring, T.; Huettel, M.; Van Beusekom, J.; Gao, H.; Lavik, G.; Kuypers, M.M. Temperature response of denitrification and anammox reveals the adaptation of microbial communities to in situ temperatures in permeable marine sediments that span 50 in latitude. Biogeosciences 2014, 11, 309–320. [Google Scholar] [CrossRef]
  15. Adouani, N.; Limousy, L.; Lendormi, T.; Sire, O. N2O and NO emissions during wastewater denitrification step: Influence of temperature on the biological process. Comptes Rendus. Chim. 2015, 18, 15–22. [Google Scholar] [CrossRef]
  16. Lazcano, C.; Zhu-Barker, X.; Decock, C. Effects of organic fertilizers on the soil microorganisms responsible for N2O emissions: A review. Microorganisms 2021, 9, 983. [Google Scholar] [CrossRef]
  17. Wrage-Mönnig, N.; Horn, M.A.; Well, R.; Müller, C.; Velthof, G.; Oenema, O. The role of nitrifier denitrification in the production of nitrous oxide revisited. Soil Biol. Biochem. 2018, 123, A3–A16. [Google Scholar] [CrossRef]
  18. Senbayram, M.; Chen, R.; Budai, A.; Bakken, L.; Dittert, K. N2O emission and the N2O/(N2O+N2) product ratio of denitrification as controlled by available carbon substrates and nitrate concentrations. Agric. Ecosyst. Environ. 2012, 147, 4–12. [Google Scholar] [CrossRef]
  19. Thangarajan, R.; Bolan, N.S.; Tian, G.; Naidu, R.; Kunhikrishnan, A. Role of organic amendment application on greenhouse gas emission from soil. Sci. Total Environ. 2013, 465, 72–96. [Google Scholar] [CrossRef]
  20. Broadbent, F.; Clark, F. Denitrification. Soil Nitrogen 1965, 10, 344–359. [Google Scholar]
  21. Šimek, M.; Jíšová, L.; Hopkins, D.W. What is the so-called optimum pH for denitrification in soil? Soil Biol. Biochem. 2002, 34, 1227–1234. [Google Scholar] [CrossRef]
  22. Coyne, M.S. Denitrification in soil. Soil Nitrogen Uses Environ. Impacts 2018, 1, 95–139. [Google Scholar]
  23. Sumner, D.R. Crop rotation and plant productivity. In Handbook of Agricultural Productivity; CRC Press: Boca Raton, FL, USA, 2018; pp. 273–314. [Google Scholar]
  24. Ghosh, P.K.; Hazra, K.K.; Venkatesh, M.S.; Praharaj, C.S.; Kumar, N.; Nath, C.P.; Singh, U.; Singh, S.S. Grain legume inclusion in cereal–cereal rotation increased base crop productivity in the long run. Exp. Agric. 2020, 56, 142–158. [Google Scholar] [CrossRef]
  25. Drury, C.; Yang, X.; Reynolds, W.; McLaughlin, N. Nitrous oxide and carbon dioxide emissions from monoculture and rotational cropping of corn, soybean and winter wheat. Can. J. Soil Sci. 2008, 88, 163–174. [Google Scholar] [CrossRef]
  26. Jeuffroy, M.; Baranger, E.; Carrouée, B.; De Chezelles, E.; Gosme, M.; Hénault, C.; Schneider, A.; Cellier, P. Nitrous oxide emissions from crop rotations including wheat, oilseed rape and dry peas. Biogeosciences 2013, 10, 1787–1797. [Google Scholar] [CrossRef]
  27. Gomes, J.; Bayer, C.; de Souza Costa, F.; de Cássia Piccolo, M.; Zanatta, J.A.; Vieira, F.C.B.; Six, J. Soil nitrous oxide emissions in long-term cover crops-based rotations under subtropical climate. Soil Tillage Res. 2009, 106, 36–44. [Google Scholar] [CrossRef]
  28. Li, T.; Li, Y.; Shi, Z.; Wang, S.; Wang, Z.; Liu, Y.; Wen, X.; Mo, F.; Han, J.; Liao, Y. Crop development has more influence on shaping rhizobacteria of wheat than tillage practice and crop rotation pattern in an arid agroecosystem. Appl. Soil Ecol. 2021, 165, 104016. [Google Scholar] [CrossRef]
  29. Kakraliya, S.; Singh, U.; Bohra, A.; Choudhary, K.; Kumar, S.; Meena, R.S.; Jat, M. Nitrogen and legumes: A meta-analysis. In Legumes for Soil Health and Sustainable Management; Springer: Delhi, India, 2018; pp. 277–314. [Google Scholar]
  30. Fagodiya, R.K.; Sharma, G.; Verma, K.; Rai, A.K.; Prajapat, K.; Singh, R.; Chandra, P.; Sheoran, P.; Yadav, R.K.; Biswas, A. Computation of soil quality index after fifteen years of long-term tillage and residue management experiment (LT&RE) under rice wheat system. Agric. Syst. 2024, 219, 104039. [Google Scholar]
  31. Zhang, B.; Wang, G.; Liu, X. Research on corn and soybean rotation: A review of ecological benefits and economic potential. Resour. Data J. 2024, 3, 208–222. [Google Scholar]
  32. Fageria, N.K.; Baligar, V.C.; Bailey, B.A. Role of cover crops in improving soil and row crop productivity. Commun. Soil Sci. Plant Anal. 2005, 36, 2733–2757. [Google Scholar] [CrossRef]
  33. Singh, G.; Bhattacharyya, R.; Das, T.; Sharma, A.; Ghosh, A.; Das, S.; Jha, P. Crop rotation and residue management effects on soil enzyme activities, glomalin and aggregate stability under zero tillage in the Indo-Gangetic Plains. Soil Tillage Res. 2018, 184, 291–300. [Google Scholar] [CrossRef]
  34. Drury, C.; Yang, X.; Reynolds, W.; Tan, C. Influence of crop rotation and aggregate size on carbon dioxide production and denitrification. Soil Tillage Res. 2004, 79, 87–100. [Google Scholar] [CrossRef]
  35. Halvorson, A.D.; Del Grosso, S.J.; Reule, C.A. Nitrogen, tillage, and crop rotation effects on nitrous oxide emissions from irrigated cropping systems. J. Environ. Qual. 2008, 37, 1337–1344. [Google Scholar] [CrossRef] [PubMed]
  36. Zhu, Y.; Li, Z.; Zhao, D.; Zhang, B.; Zhu, B.; Yao, Z.; Kiese, R.; Butterbach-Bahl, K.; Zhou, M. Effects of Conservation Agriculture on Soil N2O Emissions and Crop Yield in Global Cereal Cropping Systems. Glob. Change Biol. 2025, 31, e70048. [Google Scholar] [CrossRef] [PubMed]
  37. Tariq, A.; Menheere, N.; Gao, Y.; Brown, S.; Van Eerd, L.L.; Lauzon, J.D.; Bruun, S.; Wagner-Riddle, C. Increased N2O emissions by cover crops in a diverse crop rotation can be mediated with dual nitrification and urease inhibitors. Agric. Ecosyst. Environ. 2024, 374, 109178. [Google Scholar] [CrossRef]
  38. Kumar, T.; Kundu, M.S.; Jha, R.K. Impact of crop rotation and tillage operations on mitigating greenhouse gas emissions and evaluation of sustainability index in rice-wheat-green gram cropping system of north Bihar. J. Environ. Manag. 2024, 366, 121689. [Google Scholar] [CrossRef] [PubMed]
  39. Wu, G.; Yang, S.; Luan, C.-s.; Wu, Q.; Lin, L.-l.; Li, X.-x.; Che, Z.; Zhou, D.-b.; Dong, Z.-r.; Song, H. Partial organic substitution for synthetic fertilizer improves soil fertility and crop yields while mitigating N2O emissions in wheat-maize rotation system. Eur. J. Agron. 2024, 154, 127077. [Google Scholar] [CrossRef]
  40. Braker, G.; Matthies, D.; Hannig, M.; Brandt, F.B.; Brenzinger, K.; Gröngröft, A. Impact of land use management and soil properties on denitrifier communities of namibian savannas. Microb. Ecol. 2015, 70, 981–992. [Google Scholar] [CrossRef]
  41. Desloover, J.; Vlaeminck, S.E.; Clauwaert, P.; Verstraete, W.; Boon, N. Strategies to mitigate N2O emissions from biological nitrogen removal systems. Curr. Opin. Biotechnol. 2012, 23, 474–482. [Google Scholar] [CrossRef]
  42. Hu, H.-W.; Chen, D.; He, J.-Z. Microbial regulation of terrestrial nitrous oxide formation: Understanding the biological pathways for prediction of emission rates. FEMS Microbiol. Rev. 2015, 39, 729–749. [Google Scholar] [CrossRef]
  43. Snyder, C.S.; Bruulsema, T.W.; Jensen, T.L.; Fixen, P.E. Review of greenhouse gas emissions from crop production systems and fertilizer management effects. Agric. Ecosyst. Environ. 2009, 133, 247–266. [Google Scholar] [CrossRef]
  44. Hassan, M.U.; Aamer, M.; Mahmood, A.; Awan, M.I.; Barbanti, L.; Seleiman, M.F.; Bakhsh, G.; Alkharabsheh, H.M.; Babur, E.; Shao, J. Management strategies to mitigate N2O emissions in agriculture. Life 2022, 12, 439. [Google Scholar] [CrossRef] [PubMed]
  45. Haas, E.; Carozzi, M.; Massad, R.S.; Butterbach-Bahl, K.; Scheer, C. Long term impact of residue management on soil organic carbon stocks and nitrous oxide emissions from European croplands. Sci. Total Environ. 2022, 836, 154932. [Google Scholar] [CrossRef]
  46. Otchere, O. The Impact of Cover Cropping on Soil Nitrogen Availability, Crop Nitrogen Use, and Nitrous Oxide Emissions in a Prairie Potato—Grain Crop Rotation. Doctoral Dissertation, University of Saskatchewan, Saskatoon, SK, Canada, 2022. [Google Scholar]
  47. Yoo, J.; Woo, S.-H.; Park, K.-D.; Chung, K.-Y. Effect of no-tillage and conventional tillage practices on the nitrous oxide (N2O) emissions in an upland soil: Soil N2O emission as affected by the fertilizer applications. Appl. Biol. Chem. 2016, 59, 787–797. [Google Scholar] [CrossRef]
  48. Monteiro, R.C.; Franchini, J.C.; Jantalia, C.P.; Urquiaga, S.; Alves, B.J.R.; Boddey, R.M. Soil nitrous oxide emissions from a soybean-wheat succession under different tillage systems in Southern Brazil. Rev. Bras. De Ciência Do Solo 2023, 47, e0220135. [Google Scholar] [CrossRef]
  49. Smith, K.; Thomson, P.; Clayton, H.; McTaggart, I.; Conen, F. Effects of temperature, water content and nitrogen fertilisation on emissions of nitrous oxide by soils. Atmos. Environ. 1998, 32, 3301–3309. [Google Scholar] [CrossRef]
  50. Chadwick, D.; Cardenas, L.; Misselbrook, T.; Smith, K.; Rees, R.; Watson, C.; McGeough, K.; Williams, J.; Cloy, J.; Thorman, R. Optimizing chamber methods for measuring nitrous oxide emissions from plot-based agricultural experiments. Eur. J. Soil Sci. 2014, 65, 295–307. [Google Scholar] [CrossRef]
  51. West, T.; Griffith, D.; Steinhardt, G.; Kladivko, E.; Parsons, S. Effect of tillage and rotation on agronomic performance of corn and soybean: Twenty-year study on dark silty clay loam soil. J. Prod. Agric. 1996, 9, 241–248. [Google Scholar] [CrossRef]
  52. Connor, B.F.; Rose, D.L.; Noriega, M.C.; Murtaugh, L.K.; Abney, S.R. Methods of Analysis by the US Geological Survey National Water Quality Laboratory-Determination of 86 Volatile Organic Compounds in Water by Gas Chromatography/Mass Spectrometry, Including Detections Less Than Reporting Limits; US Geological Survey: Denver, CO, USA, 1998.
  53. Cardenas, L.; Thorman, R.; Ashlee, N.; Butler, M.; Chadwick, D.; Chambers, B.; Cuttle, S.; Donovan, N.; Kingston, H.; Lane, S. Quantifying annual N2O emission fluxes from grazed grassland under a range of inorganic fertiliser nitrogen inputs. Agric. Ecosyst. Environ. 2010, 136, 218–226. [Google Scholar] [CrossRef]
  54. Louro, A.; Sawamoto, T.; Chadwick, D.; Pezzolla, D.; Bol, R.; Báez, D.; Cardenas, L. Effect of slurry and ammonium nitrate application on greenhouse gas fluxes of a grassland soil under atypical South West England weather conditions. Agric. Ecosyst. Environ. 2013, 181, 1–11. [Google Scholar] [CrossRef]
  55. McLean, E. Soil pH and lime requirement. Methods Soil Anal. Part 2 Chem. Microbiol. Prop. 1983, 9, 199–224. [Google Scholar]
  56. Wheatley, R.; MacDonald, R.; Smith, A.M. Extraction of nitrogen from soils. Biol. Fertil. Soils 1989, 8, 189–190. [Google Scholar] [CrossRef]
  57. Sims, J.T. Soil test phosphorus: Bray and Kurtz P-1. In Methods of Phosphorus Analysis for Soils, Sediments, Residuals, and Waters; Researchgatenet: Newark, NJ, USA, 2000; Volume 13. [Google Scholar]
  58. Dickey, G.; Allen, R.; Wright, J.; Murray, N.; Stone, J.; Hunsaker, D. Soil bulk density sampling for neutron gauge calibration. Irrig. Drain. Syst. 1993, 1103–1111. [Google Scholar]
  59. Amirinejad, A.A.; Kamble, K.; Aggarwal, P.; Chakraborty, D.; Pradhan, S.; Mittal, R.B. Assessment and mapping of spatial variation of soil physical health in a farm. Geoderma 2011, 160, 292–303. [Google Scholar] [CrossRef]
  60. Gasche, R.; Papen, H. A 3-year continuous record of nitrogen trace gas fluxes from untreated and limed soil of a N-saturated spruce and beech forest ecosystem in Germany: 2. NO and NO2 fluxes. J. Geophys. Res. Atmos. 1999, 104, 18505–18520. [Google Scholar] [CrossRef]
  61. Roelle, P.A.; Aneja, V.P.; Gay, B.; Geron, C.; Pierce, T. Biogenic nitric oxide emissions from cropland soils. Atmos. Environ. 2001, 35, 115–124. [Google Scholar] [CrossRef]
  62. Schindlbacher, A.; Zechmeister-Boltenstern, S.; Butterbach-Bahl, K. Effects of soil moisture and temperature on NO, NO2, and N2O emissions from European forest soils. J. Geophys. Res. Atmos. 2004, 109. [Google Scholar] [CrossRef]
  63. Luo, J.; Tillman, R.; Ball, P. Grazing effects on denitrification in a soil under pasture during two contrasting seasons. Soil Biol. Biochem. 1999, 31, 903–912. [Google Scholar] [CrossRef]
  64. Drury, C.; Reynolds, W.; Tan, C.; Welacky, T.; Calder, W.; McLaughlin, N. Emissions of nitrous oxide and carbon dioxide: Influence of tillage type and nitrogen placement depth. Soil Sci. Soc. Am. J. 2006, 70, 570–581. [Google Scholar] [CrossRef]
  65. Johansen, A.; Carter, M.S.; Jensen, E.S.; Hauggard-Nielsen, H.; Ambus, P. Effects of digestate from anaerobically digested cattle slurry and plant materials on soil microbial community and emission of CO2 and N2O. Appl. Soil Ecol. 2013, 63, 36–44. [Google Scholar] [CrossRef]
  66. Coppens, F.; Garnier, P.; De Gryze, S.; Merckx, R.; Recous, S. Soil moisture, carbon and nitrogen dynamics following incorporation and surface application of labelled crop residues in soil columns. Eur. J. Soil Sci. 2006, 57, 894–905. [Google Scholar] [CrossRef]
  67. Chen, Z.; Ge, S.; Zhang, Z.; Du, Y.; Yao, B.; Xie, H.; Liu, P.; Zhang, Y.; Wang, W.; Zhou, H. Soil moisture but not warming dominates nitrous oxide emissions during freeze–thaw cycles in a Qinghai–Tibetan plateau alpine meadow with discontinuous permafrost. Front. Ecol. Evol. 2021, 9, 676027. [Google Scholar] [CrossRef]
  68. Russow, R.; Sich, I.; Neue, H.-U. The formation of the trace gases NO and N2O in soils by the coupled processes of nitrification and denitrification: Results of kinetic 15N tracer investigations. Chemosphere-Glob. Change Sci. 2000, 2, 359–366. [Google Scholar] [CrossRef]
  69. Wu, D.; Dong, W.; Oenema, O.; Wang, Y.; Trebs, I.; Hu, C. N2O consumption by low-nitrogen soil and its regulation by water and oxygen. Soil Biol. Biochem. 2013, 60, 165–172. [Google Scholar] [CrossRef]
  70. Bateman, E.; Baggs, E. Contributions of nitrification and denitrification to N2O emissions from soils at different water-filled pore space. Biol. Fertil. Soils 2005, 41, 379–388. [Google Scholar] [CrossRef]
  71. Iqbal, J.; Mitchell, D.C.; Barker, D.W.; Miguez, F.; Sawyer, J.E.; Pantoja, J.; Castellano, M.J. Does nitrogen fertilizer application rate to corn affect nitrous oxide emissions from the rotated soybean crop? J. Environ. Qual. 2015, 44, 711–719. [Google Scholar] [CrossRef] [PubMed]
  72. Wang, X.; Lu, P.; Yang, P.; Ren, S. Effects of fertilizer and biochar applications on the relationship among soil moisture, temperature, and N2O emissions in farmland. PeerJ 2021, 9, e11674. [Google Scholar] [CrossRef]
  73. Del Prado, A.; Merino, P.; Estavillo, J.; Pinto, M.; González-Murua, C. N2O and NO emissions from different N sources and under a range of soil water contents. Nutr. Cycl. Agroecosyst. 2006, 74, 229–243. [Google Scholar] [CrossRef]
  74. Li, Y.; Barton, L.; Chen, D. Simulating response of N2O emissions to fertiliser N application and climatic variability from a rain-fed and wheat-cropped soil in Western Australia. J. Sci. Food Agric. 2012, 92, 1130–1143. [Google Scholar] [CrossRef]
  75. Carmo, J.B.d.; Neill, C.; Garcia-Montiel, D.C.; de Cássia Piccolo, M.; Cerri, C.C.; Steudler, P.A.; de Andrade, C.A.; Passianoto, C.C.; Feigl, B.J.; Melillo, J.M. Nitrogen dynamics during till and no-till pasture restoration sequences in Rondônia, Brazil. Nutr. Cycl. Agroecosyst. 2005, 71, 213–225. [Google Scholar] [CrossRef]
  76. Ruser, R.; Flessa, H.; Russow, R.; Schmidt, G.; Buegger, F.; Munch, J. Emission of N2O, N2 and CO2 from soil fertilized with nitrate: Effect of compaction, soil moisture and rewetting. Soil Biol. Biochem. 2006, 38, 263–274. [Google Scholar] [CrossRef]
  77. Zanatta, J.A.; Bayer, C.; Vieira, F.C.; Gomes, J.; Tomazi, M. Nitrous oxide and methane fluxes in South Brazilian Gleysol as affected by nitrogen fertilizers. Rev. Bras. De Ciência Do Solo 2010, 34, 1653–1665. [Google Scholar] [CrossRef]
  78. Mosier, A.R. Exchange of gaseous nitrogen compounds between agricultural systems and the atmosphere. Plant Soil 2001, 228, 17–27. [Google Scholar] [CrossRef]
  79. Khalil, K.; Mary, B.; Renault, P. Nitrous oxide production by nitrification and denitrification in soil aggregates as affected by O2 concentration. Soil Biol. Biochem. 2004, 36, 687–699. [Google Scholar] [CrossRef]
  80. Rochette, P.; Janzen, H.H. Towards a revised coefficient for estimating N2O emissions from legumes. Nutr. Cycl. Agroecosyst. 2005, 73, 171–179. [Google Scholar] [CrossRef]
  81. Escobar, L.F.; Amado, T.J.C.; Bayer, C.; Chavez, L.F.; Zanatta, J.A.; Fiorin, J.E. Postharvest nitrous oxide emissions from a subtropical oxisol as influenced by summer crop residues and their management. Rev. Bras. De Ciência Do Solo 2010, 34, 507–516. [Google Scholar] [CrossRef]
  82. Rochette, P. No-till only increases N2O emissions in poorly-aerated soils. Soil Tillage Res. 2008, 101, 97–100. [Google Scholar] [CrossRef]
  83. Zschornack, T.; Bayer, C.; Zanatta, J.A.; Vieira, F.C.B.; Anghinoni, I. Mitigation of methane and nitrous oxide emissions from flood-irrigated rice by no incorporation of winter crop residues into the soil. Rev. Bras. De Ciência Do Solo 2011, 35, 623–634. [Google Scholar] [CrossRef]
  84. Almaraz, J.J.; Zhou, X.; Mabood, F.; Madramootoo, C.; Rochette, P.; Ma, B.-L.; Smith, D.L. Greenhouse gas fluxes associated with soybean production under two tillage systems in southwestern Quebec. Soil Tillage Res. 2009, 104, 134–139. [Google Scholar] [CrossRef]
  85. Nouchi, I.; Yonemura, S. CO2, CH4 and N2O fluxes from soybean and barley double-cropping in relation to tillage in Japan. Phyton 2005, 45, 327–338. [Google Scholar]
  86. Asakawa, S. Denitrifying ability of indigenous strains of Bradyrhizobium japonicum isolated from fields under paddy-upland rotation. Biol. Fertil. Soils 1993, 15, 196–200. [Google Scholar] [CrossRef]
  87. Inaba, S.; Ikenishi, F.; Itakura, M.; Kikuchi, M.; Eda, S.; Chiba, N.; Katsuyama, C.; Suwa, Y.; Mitsui, H.; Minamisawa, K. N2O emission from degraded soybean nodules depends on denitrification by Bradyrhizobium japonicum and other microbes in the rhizosphere. Microbes Environ. 2012, 27, 470–476. [Google Scholar] [CrossRef] [PubMed]
  88. Kim, S.U.; Lee, H.H.; Moon, S.M.; Han, H.R.; Hong, C.O. Nitrous oxide emissions and maize yield as influenced by nitrogen fertilization and tillage operations in upland soil. Appl. Biol. Chem. 2021, 64, 1–12. [Google Scholar] [CrossRef]
  89. Omonode, R.A.; Halvorson, A.D.; Gagnon, B.; Vyn, T.J. Achieving lower nitrogen balance and higher nitrogen recovery efficiency reduces nitrous oxide emissions in North America’s maize cropping systems. Front. Plant Sci. 2017, 8, 1080. [Google Scholar] [CrossRef] [PubMed]
  90. Peigné, J.; Ball, B.; Roger-Estrade, J.; David, C. Is conservation tillage suitable for organic farming? A review. Soil Use Manag. 2007, 23, 129–144. [Google Scholar] [CrossRef]
  91. Franzluebbers, A.; Hons, F.; Zuberer, D. Tillage and crop effects on seasonal soil carbon and nitrogen dynamics. Soil Sci. Soc. Am. J. 1995, 59, 1618–1624. [Google Scholar] [CrossRef]
  92. Malhi, S.S.; Lemke, R.; Wang, Z.; Chhabra, B.S. Tillage, nitrogen and crop residue effects on crop yield, nutrient uptake, soil quality, and greenhouse gas emissions. Soil Tillage Res. 2006, 90, 171–183. [Google Scholar] [CrossRef]
  93. Pekrun, C.; Messelhäuser, M.H.; Finck, M.; Hartung, K.; Möller, K.; Gerhards, R. Yield, soil Nitrogen content and weed control in six years of conservation agriculture on-farm field trials in Southwest Germany. Soil Tillage Res. 2023, 227, 105615. [Google Scholar] [CrossRef]
  94. Kaspar, T.; Jaynes, D.; Parkin, T.; Moorman, T.; Singer, J. Effectiveness of oat and rye cover crops in reducing nitrate losses in drainage water. Agric. Water Manag. 2012, 110, 25–33. [Google Scholar] [CrossRef]
  95. Gillette, K.; Malone, R.; Kaspar, T.; Ma, L.; Parkin, T.; Jaynes, D.; Fang, Q.; Hatfield, J.; Feyereisen, G.; Kersebaum, K. N loss to drain flow and N2O emissions from a corn-soybean rotation with winter rye. Sci. Total Environ. 2018, 618, 982–997. [Google Scholar] [CrossRef]
  96. Toliver, D.K.; Larson, J.A.; Roberts, R.K.; English, B.C.; De La Torre Ugarte, D.G.; West, T.O. Effects of no-till on yields as influenced by crop and environmental factors. Agron. J. 2012, 104, 530–541. [Google Scholar] [CrossRef]
  97. Evanylo, G. No-Till Corn Response to Nitrogen Rate and Timing in the Middle Atlantic Coastal Plain. J. Prod. Agric. 1991, 4, 180–185. [Google Scholar] [CrossRef]
  98. Yin, X.; Al-Kaisi, M.M. Periodic response of soybean yields and economic returns to long-term no-tillage. Agron. J. 2004, 96, 723–733. [Google Scholar] [CrossRef]
  99. Parkin, T.B.; Kaspar, T.C. Nitrous oxide emissions from corn–soybean systems in the Midwest. J. Environ. Qual. 2006, 35, 1496–1506. [Google Scholar] [CrossRef]
Figure 1. Monthly rainfall, soil temperature, minimum and maximum temperatures for the experiment.
Nitrogen 06 00045 g001
Figure 2. Dynamics of N2O and % WFPS in the different treatments during the experimental period.
Nitrogen 06 00045 g002
Figure 3. Mineral N dynamics in no-till and conventional tillage in soybean during the experimental period.
Nitrogen 06 00045 g003
Figure 4. Cumulative N2O in the different treatments during the experimental period. Means separated by different lower-case letters (a, b, c) in each column are significantly different at p ≤ 0.05.
Nitrogen 06 00045 g004
Figure 5. Cumulative N2O in the different treatments during the different seasons of the experimental period. Means separated by different lower-case letters (a, b, c) are significantly different at p ≤ 0.05.
Nitrogen 06 00045 g005
Figure 6. N lost as N2O in the different treatments during the experimental period. Means separated by different lower-case letters (a, b, c) are significantly different at p ≤ 0.05.
Nitrogen 06 00045 g006
Figure 7. Dry grain, biomass and total crop yield in the different treatments during the experimental period. Means separated by different lower-case letters (a, b, c) are significantly different at p ≤ 0.05.
Nitrogen 06 00045 g007
Figure 8. Correlations Matrix between cumulative N2O and soil variables.
Nitrogen 06 00045 g008
Table 1. Summary of soil parameters (mean ± standard error) in soybean grown under conventional tillage and no-tillage from the commencement of the trial in November 2022 and after the trial in December 2023.
ParameterSoybea-CTSoybean-NTLSD
Before 06/12/2022
Soil Texture
Sand (%)91.00 ± 4.67 b93.67 ± 4.25 a1.95
Silt (%)6.00 ± 4.82 a3.00 ± 3.36 b1.91
Clay (%)2.92 ± 2.07 c3.33 ± 1.97 b0.8
Soil pH6.05 ± 0.57 a6.30 ± 0.50 a0.29
Bulk density (g/cm3)1.44 ± 0.17 b1.52 ± 0.12 a0.09
Total C (g C/kg dry soil)1.65 ± 0.41 a1.44 ± 0.26 a0.22
Total N (mg N/kg dry soil)342.59 ± 84.37 a333.08 ± 69.78 a49.45
Organic matter (% w/w)13.88 ± 4.06 a11.96 ± 1.99 a1.78
WFPS (%)21.63 ± 4.48 a22.91 ± 4.74 a2.91
NH4+ (mg N/kg dry soil)1.24 ± 2.19 b3.05 ± 3.74 a1.58
NO3 (mg N/kg dry soil)47.3 ± 60.06 a33.87 ± 21.24 a19.54
NO2 (mg N/kg dry soil)0.018 ± 0.061 a0.038 ± 0.086 a0.052
C/N Ratio 4.77 ± 1.17 a4.86 ± 1.64 c1.38
After 06/12/2023
Soil Texture
Sand (%)88.00 ± 4.67 a89.00 ± 2.89 a0.24
Silt (%)6.92 ± 2.88 a5.83 ± 2.41 a1.64
Clay (%)5.08 ± 3.00 a5.17 ±1.59 a1.35
Soil pH6.06 ± 0.25 a5.91 ± 0.39 b0.16
Bulk density (g/cm3)1.40 ± 0.17 c1.50 ± 0.13 a0.087
Total C (g C/kg dry soil)2.07 ± 0.77 a1.97 ± 0.81 a0.4
Total N (mg N/kg dry soil)50.03 ± 49.61 a27.23 ± 31.62 a33.59
Organic matter (% w/w)3.12 ± 1.19 a3.04 ± 1.29 a0.69
WFPS (%)3.05 ± 1.88 a4.98 ± 4.21 a1.86
Soil porosity (%)0.46 ± 0.065 a0.43 ± 0.044 ab0.033
NH4+ (mg N/kg dry soil)5.05 ± 4.65 a5.21 ± 3.46 a2.32
NO3 (mg N/kg dry soil)4.41 ± 2.65 b6.01 ± 3.97 a2.39
NO2 (mg N/kg dry soil)0.015 ± 0.012 a0.038 ± 0.057 a0.19
Hydraulic conductivity (cm/s)0.16−2 ± 0.37−3 a0.33−2 ± 0.39−3 a0.18−2
C/N Ratio49.96 ± 31.3 a104.87 ± 73.93 b32.66
WFPS (Water Filled Pore Spaces). Means separated by different lower-case letters (a, b, c) in each column are significantly different at p ≤ 0.05.
Table 2. Estimated emissions per product in soybean grown under conventional tillage and no-tillage for the duration of the trial.
TreatmentN2O kg N ha−1Yield t ha−1Kg N ha−1 Dry Matter
Soybean-CT22.10.95
Soybean-NT10.61.67
Disclaimer/Publisher’s Note: The statements, opinions and data contained in all publications are solely those of the individual author(s) and contributor(s) and not of MDPI and/or the editor(s). MDPI and/or the editor(s) disclaim responsibility for any injury to people or property resulting from any ideas, methods, instructions or products referred to in the content.

