Article

Effects of Nitrogen Fertilizer Application on Growth, Vegetation Indices, and Ammonia Volatilization in Korean Radish (Raphanus sativus L.)

1
School of Applied Science in Natural Resources & Environment, Hankyong National University, Anseong 17579, Gyeonggi-do, Republic of Korea
2
Institute of Ecological Phytochemistry, Hankyong National University, Anseong 17579, Gyeonggi-do, Republic of Korea
*
Authors to whom correspondence should be addressed.
Nitrogen 2025, 6(2), 42; https://doi.org/10.3390/nitrogen6020042
Submission received: 14 April 2025 / Revised: 1 June 2025 / Accepted: 4 June 2025 / Published: 9 June 2025

Abstract

Nitrogen use efficiency (NUE) in plants is reduced when treated with excess nitrogen fertilizer. Our study aimed to investigate the impact of varied concentrations of urea on the growth responses, vegetation indices, and ammonia volatilization in radishes. The experiment was conducted across four concentrations of urea (nitrogen source): 0 N (0 kg urea ha−1), 0.5 N (117 kg urea ha−1), 1 N (234 kg urea ha−1), and 2 N (468 kg urea ha−1). Compost was applied as a basal fertilizer in all treatments. Aboveground and belowground biomass were evaluated to measure growth response. The dynamic chamber method was used to collect ammonia volatilized from the cultivation area, and the vegetation index analysis was conducted to assess the effects of nitrogen fertilizer treatment. Our study results suggest there are no significant differences in the yield of radishes between the recommended nitrogen fertilization level (1 N) and half the recommended level in the Republic of Korea (0.5 N). Ammonia volatilization was significantly the lowest in the 0.5 N nitrogen fertilizer treatment among all treatments. Except for a few specific indices, there were no significant differences observed in most analyzed vegetation indices. Based on the specific environmental and soil conditions examined in this study, our results indicate that nitrogen input in radish cultivation in the Republic of Korea could be reduced without significant yield penalties, offering potential benefits in terms of reduced production costs and environmental impact. Nevertheless, to establish optimized fertilizer recommendations, further studies across diverse environmental conditions and cultivation practices, including planting timing, are essential.

1. Introduction

Radish (Raphanus sativus L.), one of the oldest Brassicaceae field crops with origins in the Mediterranean region, is suited for cultivation in sandy soil with good drainage at an average monthly temperature of 10 °C to 15 °C [1,2]. It is preferred in various regions around the world because of its short growth period [3]. Radish represents a field crop that requires high fertilizer input with nitrogen (N), phosphorus (P), and potassium (K) as the three main elements essential for its cultivation. The requirement for N is significantly greater than that for P and K [4]. Nitrogen is the most crucial macronutrient for plants, acting as a key component in various plant cell constituents, including amino acids, proteins, and nucleic acids [5]. Among these, Rubisco (Ribulose-1,5-bisphosphate carboxylase/oxygenase) is particularly significant due to its high nitrogen demand and its critical role in determining photosynthetic capacity. However, compared to enzymes such as carbonic anhydrase, Rubisco exhibits relatively low catalytic efficiency, requiring a large quantity to sustain photosynthesis, leading to substantial nitrogen consumption [6]. Consequently, under nitrogen-deficient conditions, reduced nitrogen assimilation can result in decreased Rubisco content, potentially contributing to a decline in photosynthetic rate [7]. This, in turn, affects carbon assimilation and the subsequent photochemical processes in the thylakoid membranes [8]. Furthermore, plants grown under nitrogen-deficient conditions have been reported to show reduced concentrations of chlorophyll and carotenoids, stunted growth, and decreased yields [9,10,11]. Therefore, an optimum supply of nitrogen is essential to improve the efficiency of electron transport during photosynthesis and to increase crop yields [12].
In the past, the Korean government promoted the use of chemical fertilizers to enhance agricultural productivity. Hence, nitrogen (N) supply in Korean soils has reached extreme levels. As of 2018, the Republic of Korea was reported to have the highest nitrogen (226.7 kg/ha) and phosphorus balance (47 kg/ha) in the soil among the OECD (Organization for Economic Cooperation and Development) countries [13]. This highlights the urgent need for regulatory policies and sustainable management practices to mitigate the environmental impacts of excessive nutrient accumulation in agricultural soils [14]. Global nitrogen use efficiency (NUE) is defined as the nitrogen absorbed by crops from fertilizer divided by the total nitrogen supplied in the fertilizer [15]. As excessive nitrogen inputs accumulated in the soil, NUE declined to approximately 46% [16,17]. Consequently, nitrogen fertilizers that are not absorbed by plants either volatilize into the atmosphere as ammonia or leach into water systems in the form of nitrates [18,19]. This leads to environmental and ecological complications, such as groundwater contamination, eutrophication, and greenhouse gas emissions [20,21]. Urea fertilizers, a major factor affecting ammonia emissions, must be managed to improve crop NUE and reduce environmental impacts [22,23]. To minimize environmental dispersion and mitigate yield loss, it is necessary to determine the optimal nitrogen fertilizer level by analyzing the growth responses of radish under various nitrogen supply conditions.
Spectral vegetation indices are used to assess nitrogen status without compromising crop yields [24]. Leaf spectral reflectance data offer a non-destructive method to monitor nitrogen nutrition in crops within agricultural environments [25]. Therefore, it is recommended to use the vegetation index as a fast and non-destructive method to evaluate the growth capacity of crops [24]. Many studies have reported a correlation between crop yield and N nutrient status [26]. Since nitrogen nutrition influences both crop condition and canopy cover, and is correlated with chlorophyll, vegetation indices derived from spectral reflectance serve as effective indicators of crop nitrogen status [27]. Various spectral vegetation indices are developed on the basis of the spectral characteristics of chlorophyll in the visible and red edge bands that can be utilized as indicators of crop nitrogen levels [28]. Most research on spectral vegetation indices related to nitrogen has focused on detecting nitrogen deficiency stress and on predicting crop yields [29]. However, there is a lack of studies that estimate efficient fertilizer usage while maintaining yields by evaluating the growth responses of plants. Vegetation indices, derived from spectral reflectance analysis, may be employed to design fertilization systems that optimize nitrogen use in agriculture. Our study aimed to determine the optimal nitrogen application rate for radish cultivation by evaluating growth responses of radish under various nitrogen conditions, ammonia volatilization levels, and spectral vegetation indices.

2. Materials and Methods

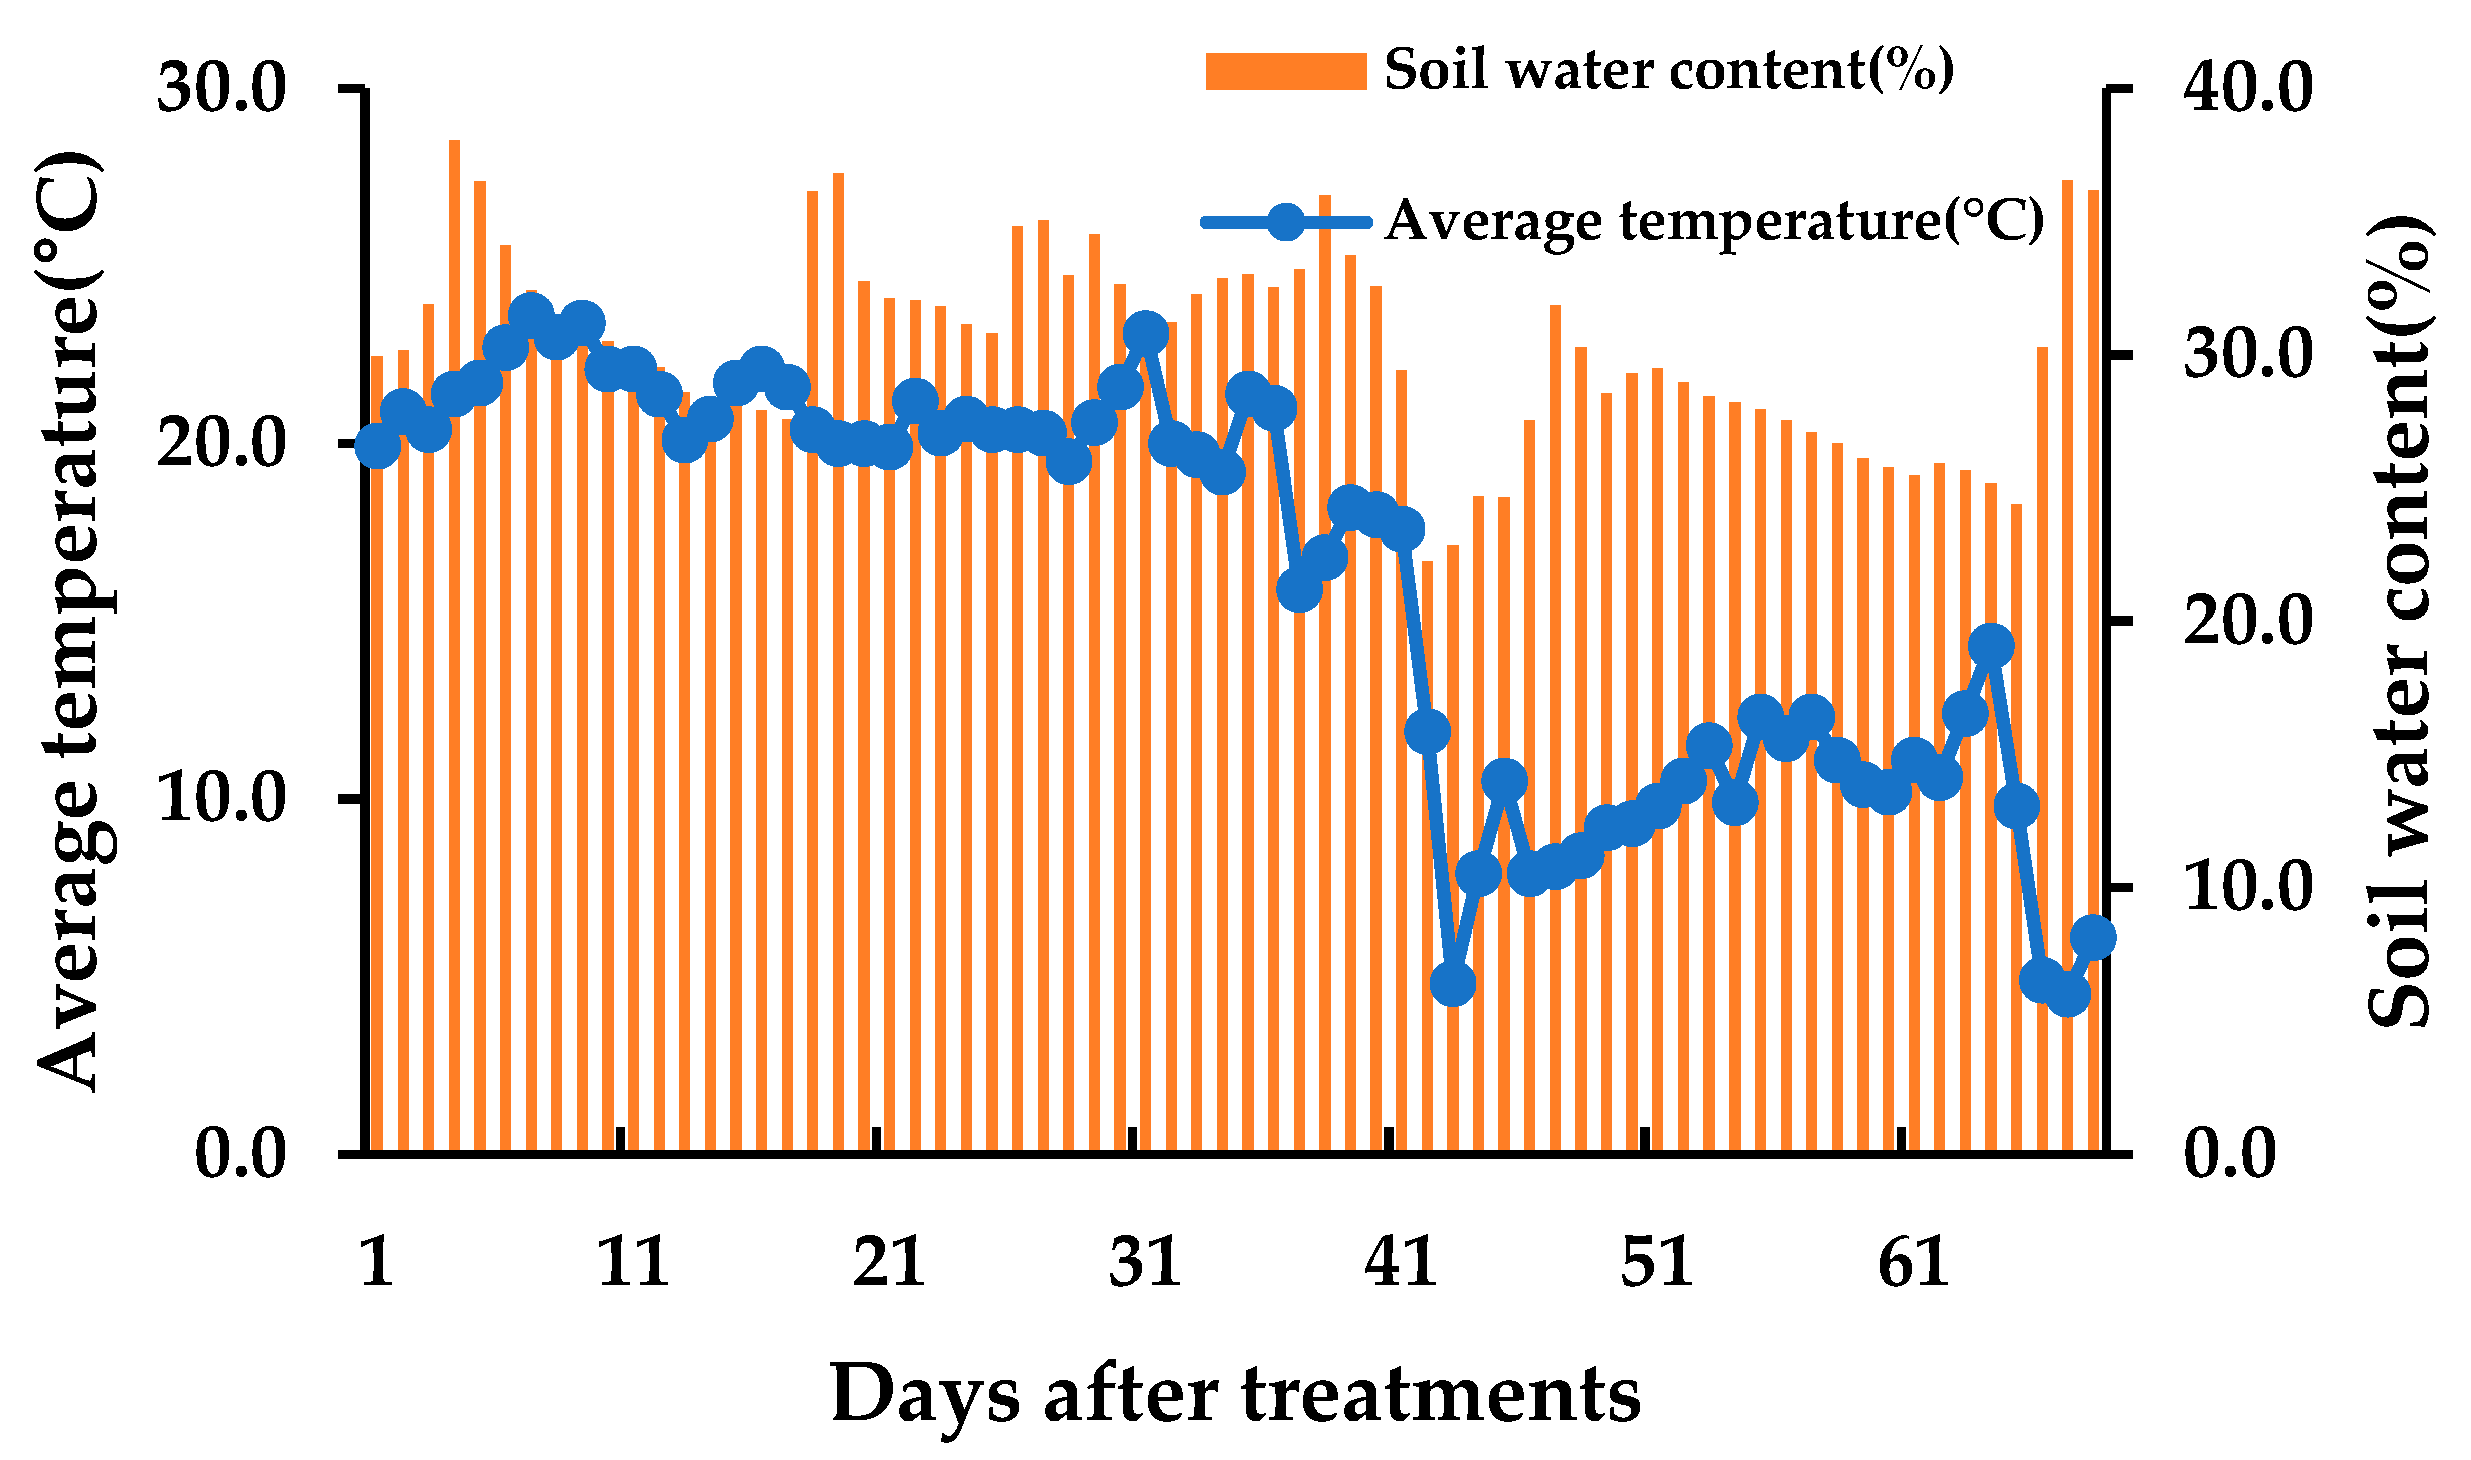
2.1. Field Experiment

We conducted a field experiment using ‘Tongil kimjang’, an autumn kimchi radish cultivar, in 2021 between the months of September and November (3 months). Experimental plots (1 m wide × 2 m long) were arranged in a completely random pattern in a field in Anseong-si, Gyeonggi-do (37°00′ N, 127°19′ E). The conditions during the growing period included an average temperature of 16.2 °C and an average soil moisture content of 30.5% (Figure 1). The soil used in the experiment was analyzed as loam, and its chemical properties are shown in Table 1. Prior to fertilizer application, composite soil samples were collected from the 0–15 cm depth across all plots. These samples were analyzed for pH, electrical conductivity (EC), organic matter content, available phosphorus, total nitrogen, and exchangeable cations (K+, Ca2+, Mg2+) using standard protocols provided by the Rural Development Administration (RDA) of the Republic of Korea. To assess the effect of N on radish growth, the plots were fertilized with four different concentrations of urea (N source) at 0 (0 N), 117 (0.5 N), 234 (1 N), and 468 (2 N) kg urea ha−1 (Table 2). Fertilization with each specific concentration of urea was performed in triplicate. The plots were also fertilized with the standard dose of compost, phosphate fertilizer, potash (KCl), lime, and borax. Urea, compost, phosphate fertilizer, potash, lime, and borax were applied as a basal fertilizer. In addition to the basal fertilizer, urea and potash were applied as supplemental fertilizers at a later stage. Radish seedlings were planted at a spacing of 25 cm × 30 cm. The plants were irrigated by natural rainfall and harvested on 12 November 2021 (70 days after sowing).

2.2. Measurements

2.2.1. Growth Measurements

Growth was measured by separating harvested radish into aboveground and belowground sections. Nine radish plants were randomly selected per treatment as representative samples. In the aboveground section, plant height and leaf width were measured using a measuring tape, and shoot biomass was recorded. For the belowground section, root length was measured with a measuring tape and root diameter with a Vernier caliper, followed by weighing the roots.

2.2.2. Analysis of Vegetation Indices

The reflectance spectrum of radish leaves was measured using a PolyPen RP 410 UVIS (Photon Systems Instruments, Drásov, Czech Republic) over a wavelength range of 380 to 790 nm. Measurements began 21 days after sowing, with the largest leaf of each plant selected for data collection every 7 days. For each leaf, five measurements were taken using the PolyPen spectrometer. The collected data were analyzed using Spectrapen software (version 1.1.0.12) to calculate the spectral reflectance indices listed in Table 3.

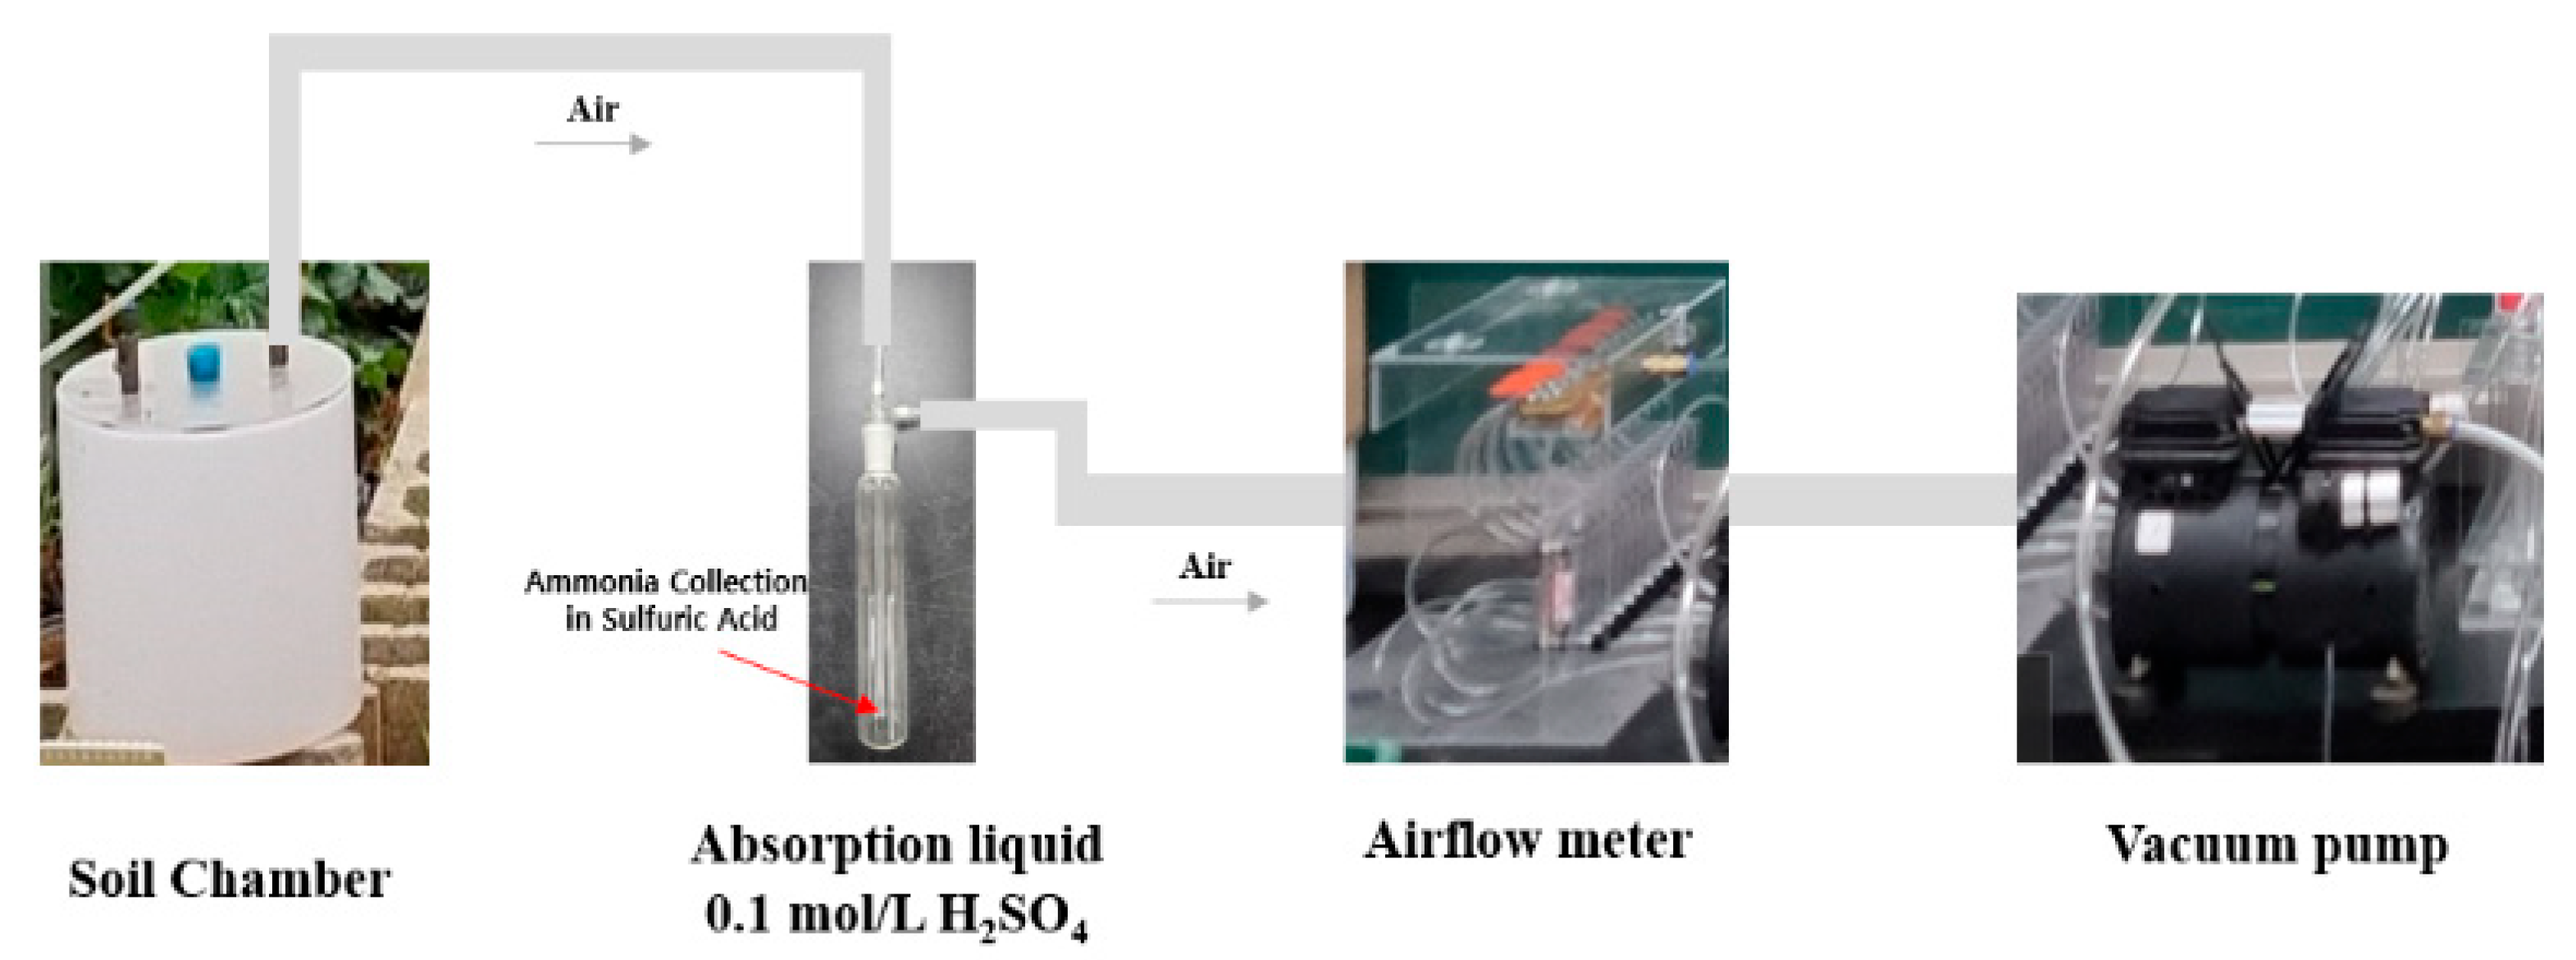
2.2.3. Measurement of Ammonia Volatilization

We employed the dynamic chamber method to collect ammonia (NH3) volatilized with urea treatments. The NH3 collection device features a soil flux chamber with an air inlet and an ammonia collection port at the top for air exchange (Figure 2). The Soxhlet extractor, containing 30 mL of 0.05 mol/L sulfuric acid, is sealed and equipped with both inlet and outlet tubes. The outlet tube is connected to an airflow meter, and the inlet tube is connected to the soil chamber. The airflow meter is also connected to a vacuum pump. The basic principle of the device to collect NH3 volatilization is to use the vacuum pump as the power source. In this device, the NH3 in the soil chamber is displaced by air, and the evaporated air enters the absorption jar along with the airflow that is pumped. This device ensures aeration and collects NH3 lost through the volatilization process. The NH3 gas was sampled for one hour per sampling period with an airflow of 2 L min−1. We continuously monitored ammonia volatilization for 5 days after basal fertilization, the first additional fertilizer (DAT 21), and the second additional fertilizer (DAT 35). After the continuous monitoring period, we conducted weekly measurements at 7-day intervals until 70 days post sowing. On days without monitoring, values were estimated using linear interpolation [49].
y = y 0 + y 1 y 0 y 1 y 0 x 1 x 0
We analyzed NH3 captured in 0.05 mol L−1 H2SO4 using the Nesslerization method with a UV-VIS spectrophotometer. Collected ammonia was converted to ammonium by reacting with 5 mL of sulfuric acid. To this solution, 200 µL of Nessler’s reagent was added, followed by vortexing for uniform mixing. The mixture was then allowed to stand at room temperature for 15 min for color development. Absorbance was measured at 425 nm, and the ammonia concentration was calculated using the following equation [19,23,50].
E R = Q C e C i W m T s t d P a / 10 6 V m T a P s t d × 10 3
ER: Emission rate (mg min−1). Q: Airflow rate into the chamber (L min−1). Ce: Gas concentration of air leaving the chamber (mg kg−1). Ci: Gas concentration of air entering the chamber (mg kg−1). Wm: Molecular weight of the gas (g mol−1). Vm: Molar volume at standard temperature (0 °C) and pressure (101.325 kPa), 22.4 µ mol−1. Tstd: Standard temperature, 273.15 K. Ta: Temperature of the sample air, K (273.15 + sample air °C). Pstd: Standard pressure, 101.325 kPa. Pa: Local barometric pressure, kPa.

2.3. Statistical Analysis

We analyzed data using R (v 4.2.1, R Core Team 2022) [51]. The data were first tested for normality using the Shapiro–Wilk test and for homogeneity of variances using Levene’s test. Data that violated the assumption of homogeneity of variances were analyzed using the Kruskal–Wallis test, while data meeting the assumption of homogeneity were analyzed using one-way analysis of variance (ANOVA). Statistically significant differences among treatments (p < 0.05) were determined using ANOVA or the Kruskal–Wallis test as appropriate. Duncan’s multiple range test (DMRT) was applied for post hoc comparisons following ANOVA, and Dunn’s multiple comparison test was used following the Kruskal–Wallis test. In principal component analysis (PCA), variable scales were standardized by scaling the data before performing PCA. The results were visualized using the ggplot2 package to illustrate the distribution of individual cases in a two-dimensional principal component space.

3. Results and Discussions

3.1. Analysis of Plant Growth with Different Concentrations of Urea Fertilizer

The growth analysis data were utilized as field data to demonstrate the effects of urea fertilizer (nitrogen source) treatment on radish growth. A comparison of the growth data between the treated and untreated groups reveal that nitrogen fertilization significantly influenced the growth of both aboveground and belowground sections of the radish. There was a significant reduction in the height, root length, and aboveground and belowground biomass of the radishes in the untreated group (Table 4). In contrast, no significant differences were observed in the treated groups for most growth parameters. However, leaf width significantly increased in the group receiving 468 kg urea ha−1 compared to the other treatments. Previous studies have reported that urea treatments above 250 kg ha−1 reduced radish growth [52]. However, in Korean radish varieties, 468 kg urea ha−1 did not negatively affect growth (Table 4). Although root weight in the 117 kg urea ha−1 group did not significantly differ from the other treatment groups, the standard error is high. It has been well established that optimum levels of fertilization contribute to consistent plant growth and development [53], suggesting that insufficient fertilization might be a possible cause of the high standard error (Supplementary Figure S1). To determine the optimal fertilizer rate, further research is required using more precise fertilization levels, conducted under diverse environmental conditions and with repeated trials.

3.2. Comparison of Vegetation Indices Among the Groups Treated with Different Concentrations of Urea

Vegetation indices analyzed in radishes treated with different concentrations of urea throughout the growth period effectively distinguished between the treated and the untreated groups [excluding simple ratio pigment index (SRPI), normalized phaeophytinization index (NPQI), normalized pigment chlorophyll index (NPCI), carotenoid reflectance indices (CRI1, and CRI2)] (Table 5). Significant differences were observed in modified chlorophyll absorption reflectance index MCARI (700, 670 nm), Zarco-Tejada & Miller index (ZMI) and Gitelson and Merzlyak Indices (GM1, and GM2) in the treated groups. The MCARI has low responsiveness to non-photosynthetic materials but is sensitive to changes in chlorophyll across a wide range of chlorophyll concentrations [32]. In general, the chlorophyll content of plants has a linear correlation with the nitrogen content of leaves [26]. The sensitivity of MCARI to reflectance at 550 and 700 nm, with chlorophyll absorption at 670 nm, effectively distinguished the radishes treated with different concentrations of urea [33,54]. The Zarco-Tejada & Miller index (ZMI) has been used effectively to differentiate between tea plant varieties that are resistant to cold damage and nitrogen deficiency [55]. The same study reported a positive correlation between reflectance at 705–760 nm, which is used in the ZMI calculation, and the nitrogen content of leaves. Similarly, it has been reported that the leaf reflectance of big bluestem (Andropogon gerardii), in response to leaf nitrogen (N) and chlorophyll (Chl) content, peaks in the narrow region of the reflectance spectrum between 710 and 720 nm [56]. In our study, ZMI effectively distinguished nitrogen levels in radishes. Vegetation indices, calculated using spectral wavelengths, can indicate differences in the reflectance of plants [57]. Therefore, this study suggests that vegetation indices can be used as a fast and non-destructive method to evaluate crop growth potential, with many studies reporting a correlation between crop yield and nitrogen nutrient status [26]. When data from the growth analysis results are interpreted alongside existing research, it appears that treatments equal to or exceeding 117 kg urea ha−1 (0.5 N) did not exhibit significant differences in yield or in most vegetation indices. This indicates that under the current Korean nitrogen application standards, nitrogen deficiency does not occur above half of the recommended concentration.

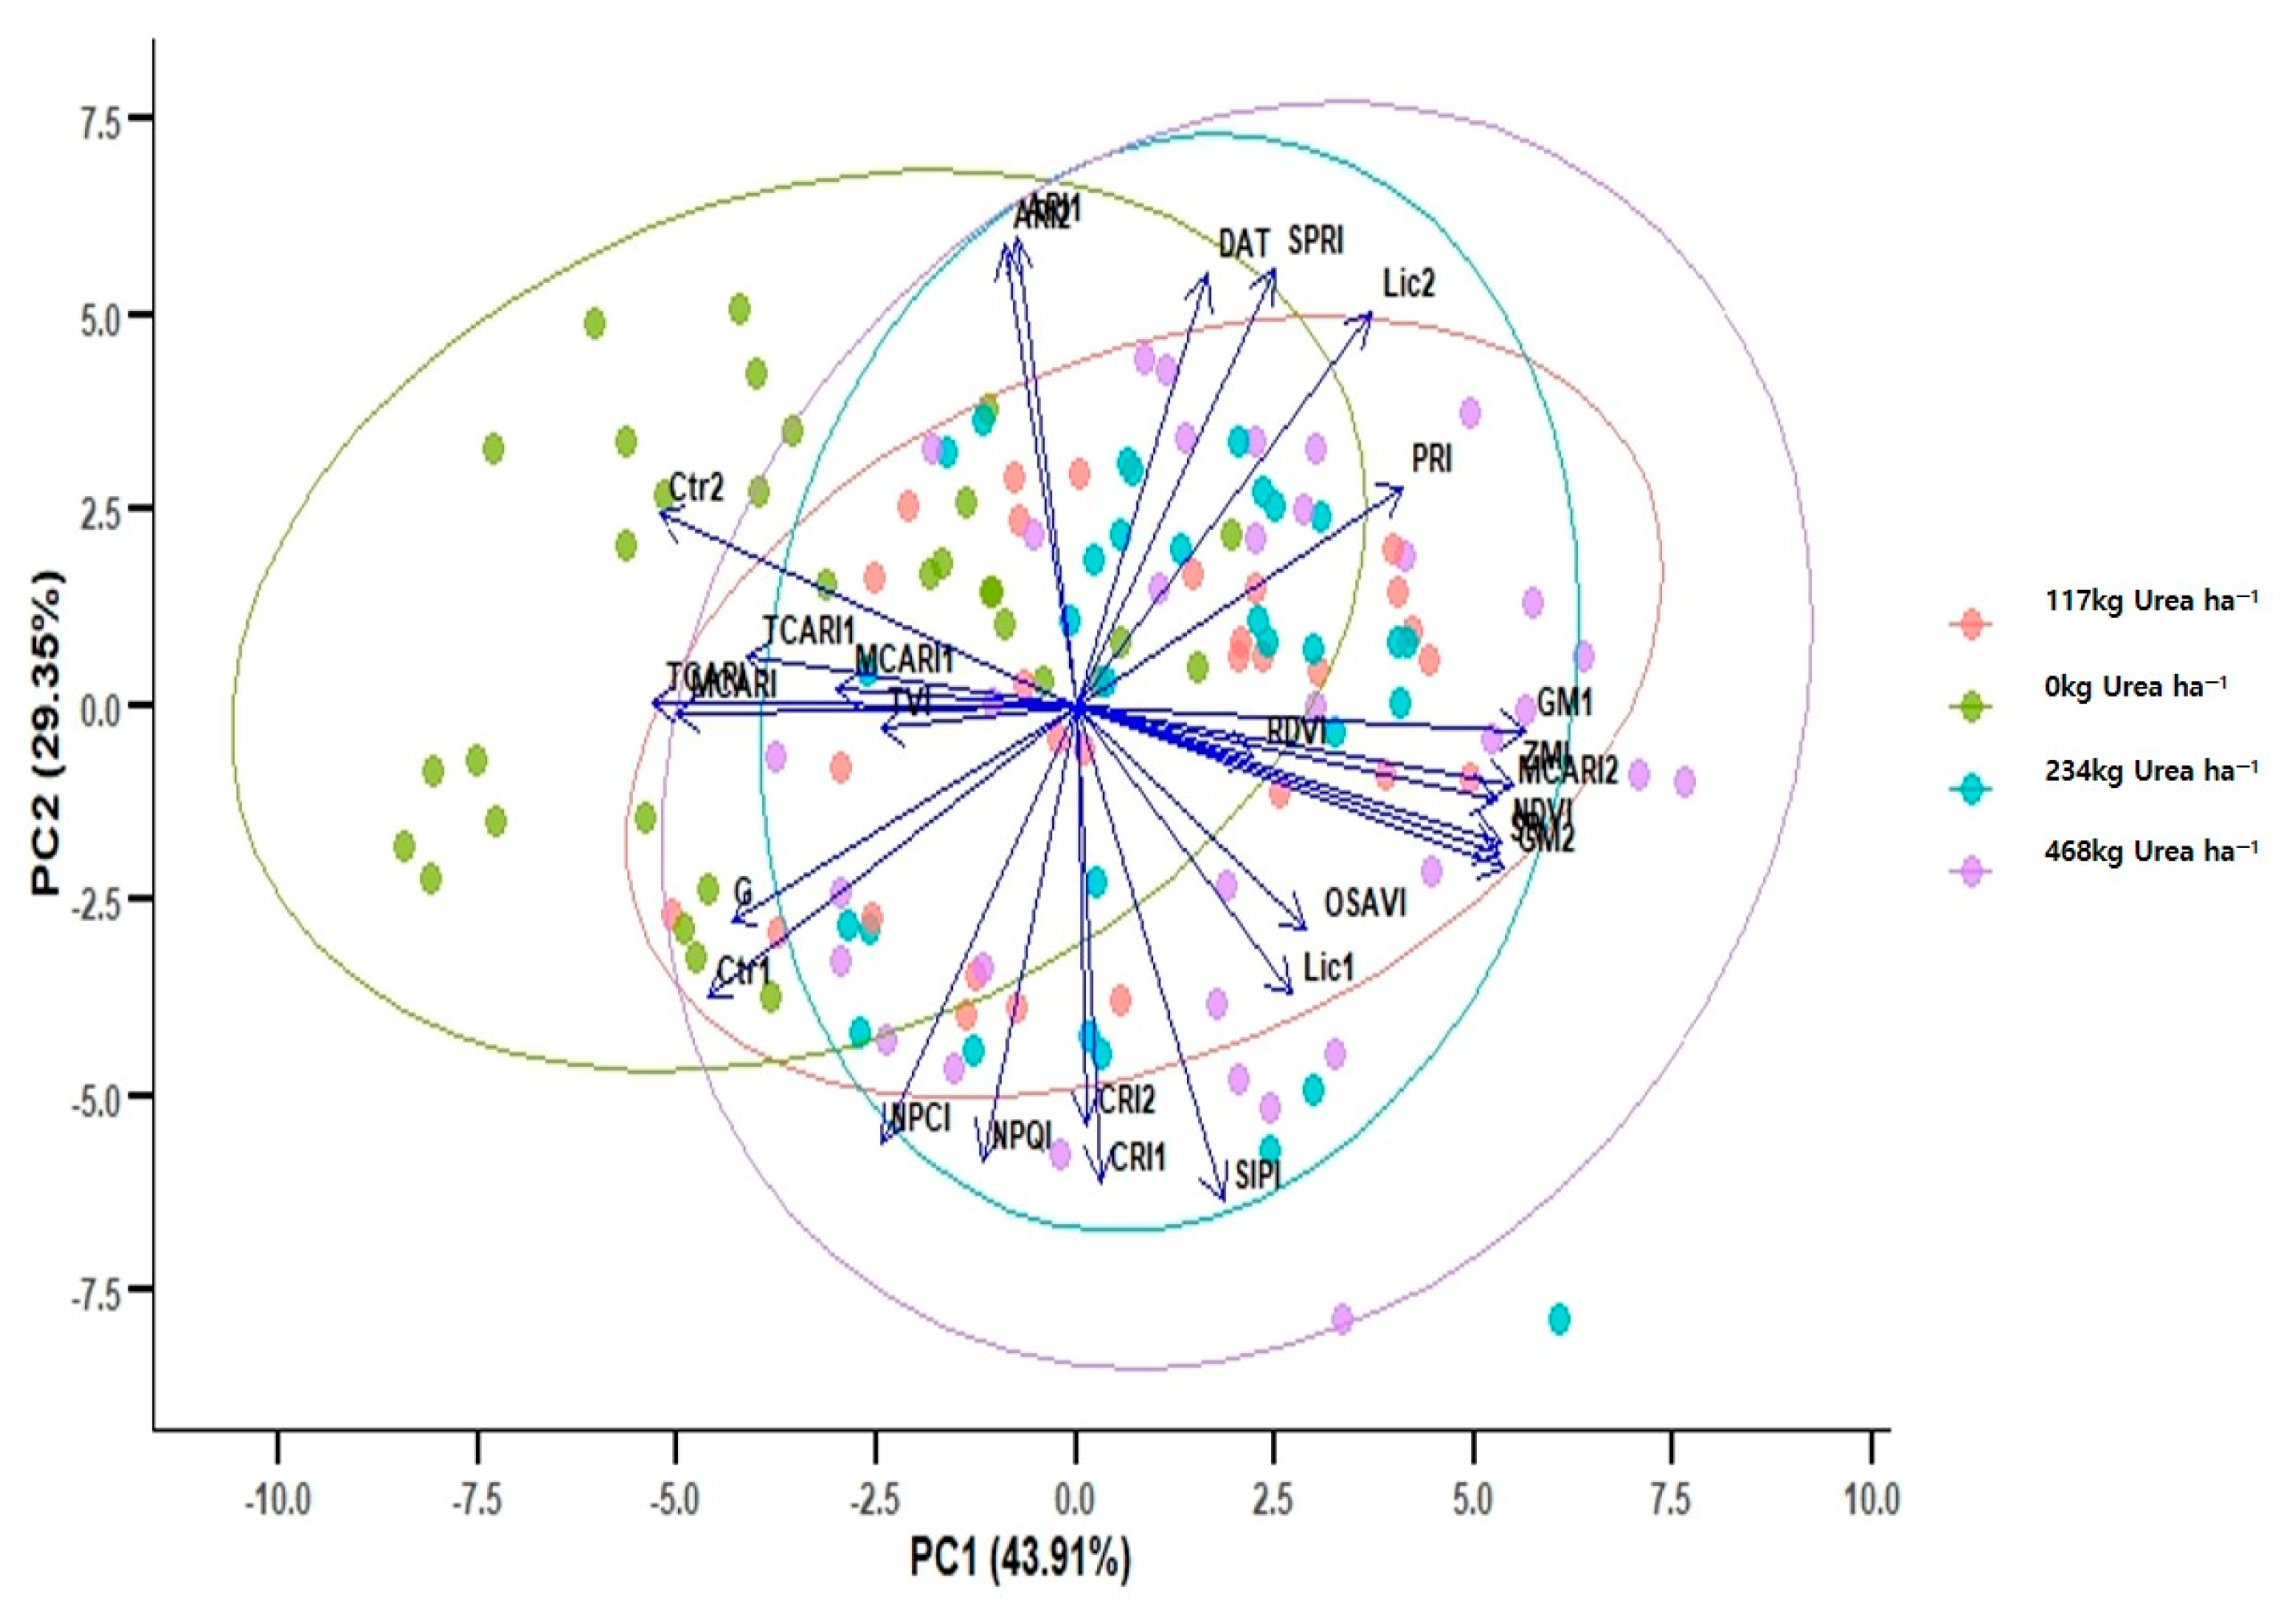
3.3. Comparison of PCA Among Treatments with Different Urea Concentrations

Nitrogen fertilizer treatment significantly influenced the growth and physiology of radish. These effects were observed in both the growth analysis and the vegetation index data across various concentrations of urea fertilizer (nitrogen source) treatment (Table 4 and Table 5). We performed a multivariate analysis to assess the sensitivity of the vegetation indices to nitrogen fertilizer treatment. These indices are considered valuable for distinguishing subtle variations in nitrogen levels. Notably, vegetation indices are derived from mathematical combinations of spectral reflectance, which can result in interdependencies. Mean values were normalized to standardize the parameters before analysis. As a result, the first two principal components accounted for 73.2% of the total variance (Figure 3). The untreated group was clustered on the left side of the plot, while the treatments of 117 and 234 kg urea ha−1 were positioned centrally. The 468 kg ha−1 treatment exhibited a significant deviation towards the right. While PC1 clearly explained the major variability and clustering among the nitrogen fertilizer treatment groups, PC2 did not provide a strong visual separation or meaningful interpretation in terms of vegetation index responses. As a result, the clustering ability of the treated groups based on PC2 scores was less effective compared to PC1. To better understand the magnitude and direction of each vegetation index parameter in relation to PC1, their contributions were analyzed. Vegetation indices that contributed more than 0.2 and decreased the PC1 value included the Carter index (Ctr2), the transformed chlorophyll absorption in reflectance index (TCARI), the MCARI (700, 670 nm), the Carter index (Ctr1), and the Greenness index (G) (Table 6). Conversely, indices such as the photochemical reflectance index (PRI), GM2, simple ratio index (SR), MCARI (750, 705 nm), NDVI, ZMI, and GM1 contributed to an increase in the PC1 value. Furthermore, MCARI (700, 670 nm), ZMI, GM1, and GM2 were among the indices that displayed significant differences across the treated groups with the previously conducted Duncan’s multiple range test (DMRT) (Table 5). It has been reported that vegetation indices, calculated on the basis of the red edge in the visible spectrum, are sensitive to plant chlorophyll concentration and nitrogen levels [30]. In our study, the MCARI and ZMI calculated on the basis of the red edge of the visible spectrum showed high contributions to PC1 value [58]. The photochemical reflectance index (PRI) is particularly sensitive to changes in carotenoids due to the de-epoxidation of xanthophyll pigments [59]. The high contribution of PRI to PC1 value in this experiment is believed to reflect changes in carotenoid content due to nitrogen nutrition [11]. Thus, the results of the multivariate analysis indicate that the untreated group was distinctly clustered to the left, effectively separating it from the treated groups. Meanwhile, the treated groups showed considerable overlap and lacked clear distinctions, suggesting that nitrogen deficiency may not be detectable at fertilizer concentrations of 117 kg ha−1 or higher. Nevertheless, verification through repeated trials is required to confirm these findings.

3.4. Comparison of Ammonia Gas Emissions as Byproduct of Treatment with Different Urea Concentrations

The daily ammonia (NH3) volatilization for each treatment during the 70-day radish cultivation period is shown in Figure 4, and the total volatilization over the cultivation period is presented in Table 7. As in previous studies, rapid ammonia volatilization exhibited a decreasing trend over time, following the application of urea in the urea-treated plots [23]. The 468 kg urea ha−1 treatment recorded the highest volatilization, with the peak occurring after the second additional fertilizer (Figure 4). In an experiment that examined ammonia volatilization at the different urea concentrations of 0, 100, 200, and 400 kg urea ha−1 treatments, the highest ammonia volatilization was observed in the 400 kg urea ha−1 treatment. The relationship between the concentration of urea and ammonia volatilization followed a linear equation. This confirms that ammonia emissions increase with an increase in the concentration of urea [23]. When comparing total ammonia volatilization during the cultivation period (Table 7), the 117 kg urea ha−1 treatment exhibited lower volatilization than the 0 kg urea ha−1 treatment. Several factors may explain this unexpected result. Because ammonia volatilization was not monitored daily and instead was estimated using linear interpolation, it is possible that the volatilization from the 117 kg urea ha−1 treatment was underestimated. Additionally, this study did not include measurements of soil inorganic nitrogen forms (NH4+ and NO3), which limits our ability to fully elucidate the mechanism behind increased ammonia emissions. Nevertheless, it is suspected that organic nitrogen derived from compost may have undergone mineralization to form ammonium (NH4+) during the early growth stages, and that in treatments with limited plant nitrogen uptake, this ammonium may have remained in the soil and contributed to volatilization. In particular, the 0 kg urea ha−1 treatment showed poor plant growth, which likely restricted nitrogen uptake (Supplementary Table S1), resulting in a higher amount of residual compost-derived nitrogen in the soil and increased ammonia volatilization. These findings suggest that excessively low nitrogen input may not only reduce yield but also lead to greater nitrogen loss due to inefficient nutrient utilization. Conversely, the 468 kg urea ha−1 treatment showed significantly higher ammonia volatilization and total soil nitrogen after harvest, without any corresponding yield advantage, indicating that this level of application constitutes excessive fertilization for radish cultivation. The increase in nitrogen use efficiency (NUE) through appropriate fertilizer application has been reported to not only help reduce greenhouse gas emissions and ammonia volatilization, but also improve economic benefits by increasing crop yields and reducing fertilizer usage [60,61].

4. Conclusions

This study investigated the effects of nitrogen fertilizer application on radish yield, related physiological indicators, and ammonia volatilization under field conditions in the Republic of Korea. The results showed that applying 117 kg urea ha−1, half of the conventional recommendation, did not compromise radish yield or induce visible nitrogen deficiency symptoms, suggesting that lower nitrogen input levels may be sufficient under similar agronomic conditions. The 117 kg urea ha−1 treatment resulted in yields comparable to the 234 kg urea ha−1 treatment and exhibited lower residual soil nitrogen and ammonia emissions, indicating a potential reduction in nitrogen loss to the environment. Additionally, principal component analysis using vegetation indices further supported the minimal physiological differences between treatments. These findings suggest that nitrogen input in radish cultivation in the Republic of Korea could be reduced without yield penalties, offering opportunities to lower production costs and mitigate environmental risks. However, due to the observed yield variability in the 117 kg treatment group, further research is required to refine nitrogen application rates and develop more site-specific and seasonally consistent fertilization strategies. Moreover, the reduced ammonia volatilization in the 117 kg treatment group in this study has limitations in fully elucidating the underlying mechanisms of nitrogen loss, as analysis of inorganic nitrogen forms (NH4+ and NO3) was not conducted. To better understand ammonia volatilization under reduced fertilizer conditions, future studies should include detailed assessments of soil inorganic nitrogen dynamics and nitrogen mineralization processes, as well as research into the nitrogen loss mechanisms caused by restricted plant growth.

Supplementary Materials

The following supporting information can be downloaded at https://www.mdpi.com/article/10.3390/nitrogen6020042/s1: Figure S1. Agronomic traits of radish plants grown in different urea concentrations and harvested 30 days after treatment; Table S1. Agronomic traits of radish plants grown in different urea concentrations 30 days after treatment.

Author Contributions

Conceptualization—S.Y. and T.K.; Methodology—T.E.; Validation—T.E., S.Y. and T.K.; Investigation—T.E.; Resources—T.E.; Writing—original draft preparation—T.E.; Writing—review and editing—T.E., S.Y. and T.K. All authors have read and agreed to the published version of the manuscript.

Funding

This study was conducted with the support of the “Research Program for Agricultural Science and Technology Development (Project No. PJ014206022019)”, National Institute of Agricultural Science, Rural Development Administration, Republic of Korea.

Data Availability Statement

The original contributions presented in this study are included in the article/Supplementary Material. Further inquiries can be directed to the corresponding author(s).

Conflicts of Interest

The funders had no role in the design of this study; the collection, analyses, or interpretation of the data; the writing of the manuscript; or in the decision to publish the results.

References

  1. Olivera Viciedo, D.; de Mello Prado, R.; Lizcano Toledo, R.; Nascimento dos Santos, L.C.; Peña Calzada, K.J.A.C. Response of radish seedlings (Raphanus sativus L.) to different concentrations of ammoniacal nitrogen in absence and presence of silicon. Agron. Colomb. 2017, 35, 198–204. [Google Scholar] [CrossRef]
  2. Bakhsh, K.; Ahmad, B.; Gill, Z.A.; Hassan, S. Estimating indicators of higher yield in radish cultivation. Int. J. Agric. Biol. 2006, 8, 783–787. [Google Scholar]
  3. Yousaf, M.; Bashir, S.; Raza, H.; Shah, A.N.; Iqbal, J.; Arif, M.; Bukhari, M.A.; Muhammad, S.; Hashim, S.; Alkahtani, J.; et al. Role of nitrogen and magnesium for growth, yield and nutritional quality of radish. Saudi J. Biol. Sci. 2021, 28, 3021–3030. [Google Scholar] [CrossRef]
  4. Srinivas, K.; Naik, L. Growth and yield of radish (Raphanus sativus L.) in relation to nitrogen and potash fertilization. Indian J. Hort. 1990, 47, 114–119. [Google Scholar]
  5. Taiz, L.; Zeiger, E.; Moller, I.M.; Murphy, A. Plant Physiology and Development; Sinauer Associates: Sunderland, CT, USA, 2015; 761p. [Google Scholar]
  6. Carmo-Silva, E.; Scales, J.C.; Madgwick, P.J.; Parry, M.A.J. Optimizing R ubisco and its regulation for greater resource use efficiency. Plant Cell Environ. 2015, 38, 1817–1832. [Google Scholar] [CrossRef]
  7. Gao, J.; Wang, F.; Sun, J.; Tian, Z.; Hu, H.; Jiang, S.; Luo, Q.; Xu, Y.; Jiang, D.; Cao, W.; et al. Enhanced Rubisco activation associated with maintenance of electron transport alleviates inhibition of photosynthesis under low nitrogen conditions in winter wheat seedlings. J. Exp. Bot. 2018, 69, 5477–5488. [Google Scholar] [CrossRef]
  8. Harbinson, J.; Genty, B.; Baker, N.R.J.P.R. The relationship between CO2 assimilation and electron transport in leaves. Photosynth. Res. 1990, 25, 213–224. [Google Scholar] [CrossRef] [PubMed]
  9. Marschner, H. Mineral nutrition of higher plants. J. Ecol. 1995, 76, 1250. [Google Scholar]
  10. Lefsrud, M.G.; Kopsell, D.A.; Kopsell, D.E. Nitrogen levels influence biomass, elemental accumulations, and pigment concentrations in spinach. J. Plant Nutr. 2007, 30, 171–185. [Google Scholar] [CrossRef]
  11. Kopsell, D.A.; Kopsell, D.E.; Curran-Celentano, J. Carotenoid pigments in kale are influenced by nitrogen concentration and form. Sci. Food Agric. 2007, 87, 900–907. [Google Scholar] [CrossRef]
  12. Lu, C.; Zhang, J.; Zhang, Q.; Li, L.; Kuang, T. Modification of photosystem II photochemistry in nitrogen deficient maize and wheat plants. J. Plant Physiol. 2001, 158, 1423–1430. [Google Scholar] [CrossRef]
  13. OECD.stat. Data and Metadata for OECD Countries and Selected Non-Member Economies. Organization for Economic Cooperation and Development. Available online: https://stats.oecd.org (accessed on 22 October 2024).
  14. Lee, J.-H.; Yoon, Y.-M. Comparison of nutrient balance and nutrient loading index for cultivated land nutrient management. Environ. Biol. Res. 2019, 37, 554–567. [Google Scholar] [CrossRef]
  15. Lim, J.Y.; Bhuiyan, M.S.I.; Lee, S.B.; Lee, J.G.; Kim, P.J. Agricultural nitrogen and phosphorus balances of Korea and Japan: Highest nutrient surplus among OECD member countries. Environ. Pollut. 2021, 286, 117353. [Google Scholar] [CrossRef] [PubMed]
  16. Houlton, B.Z.; Almaraz, M.; Aneja, V.; Austin, A.T.; Bai, E.; Cassman, K.G.; Compton, J.E.; Davidson, E.A.; Erisman, J.W.; Galloway, J.N.; et al. A world of cobenefits: Solving the global nitrogen challenge. Earth’s Futur. 2019, 7, 865–872. [Google Scholar] [CrossRef]
  17. Giordano, M.; Petropoulos, S.A.; Rouphael, Y. The fate of nitrogen from soil to plants: Influence of agricultural practices in modern agriculture. Agriculture 2021, 11, 944. [Google Scholar] [CrossRef]
  18. Yang, B.; Li, X.; Hua, Z.; Li, Z.; He, X.; Yan, R.; Li, Y.; Zhi, Z.; Tian, C.J.S.; Chemical, A.B. A low cost and high performance NH3 detection system for a harsh agricultural environment. Sens. Actuators B Chem. 2022, 361, 131675. [Google Scholar] [CrossRef]
  19. Ricardo, A.P. Evaluation and Application of a Dynamic Emissions Chamber for Quantifying Gaseous Emissions from Laying Hen Manure. Master’s Thesis, Iowa State University, Ames, IA, USA, 2011. [Google Scholar]
  20. Xiao, J.; Wang, Q.; Ge, X.; Zhu, L.; Li, X.; Yang, X.; Ouyang, H.; Wu, J. Defining the ecological efficiency of nitrogen use in the context of nitrogen cycling. Ecol. Indic. 2019, 107, 105493. [Google Scholar] [CrossRef]
  21. Kavanagh, I.; Fenton, O.; Healy, M.; Burchill, W.; Lanigan, G.; Krol, D. Mitigating ammonia and greenhouse gas emissions from stored cattle slurry using agricultural waste, commercially available products and a chemical acidifier. J. Clean. Prod. 2021, 294, 126251. [Google Scholar] [CrossRef]
  22. Klimczyk, M.; Siczek, A.; Schimmelpfennig, L. Improving the efficiency of urea-based fertilization leading to reduction in ammonia emission. Sci. Total. Environ. 2021, 771, 145483. [Google Scholar] [CrossRef]
  23. Adegoke, T.O.; Moon, T.-I.; Ku, H.-H. Ammonia emission from sandy loam soil amended with manure compost and urea. Appl. Biol. Chem. 2022, 65, 83. [Google Scholar] [CrossRef]
  24. Zhao, B.; Duan, A.; Ata-Ul-Karim, S.T.; Liu, Z.; Chen, Z.; Gong, Z.; Zhang, J.; Xiao, J.; Liu, Z.; Qin, A.J.; et al. Exploring new spectral bands and vegetation indices for estimating nitrogen nutrition index of summer maize. Eur. J. Agron. 2018, 93, 113–125. [Google Scholar] [CrossRef]
  25. Ali, M.; Al-Ani, A.; Eamus, D.; Tan, D.K. Leaf nitrogen determination using non-destructive techniques—A review. J. Plant Nutr. 2017, 40, 928–953. [Google Scholar] [CrossRef]
  26. Marti, J.; Bort, J.; Slafer, G.; Araus, J. Can wheat yield be assessed by early measurements of Normalized Difference Vegetation Index? Ann. Appl. Biol. 2007, 150, 253–257. [Google Scholar] [CrossRef]
  27. Chen, P. A comparison of two approaches for estimating the wheat nitrogen nutrition index using remote sensing. Remote. Sens. 2015, 7, 4527–4548. [Google Scholar] [CrossRef]
  28. Blackmer, T.M.; Schepers, J.S.; Varvel, G.E.; Walter-Shea, E.A. Nitrogen deficiency detection using reflected shortwave radiation from irrigated corn canopies. Agron. J. 1996, 88, 1–5. [Google Scholar] [CrossRef]
  29. Elmetwalli, A.H.; Tyler, A.N. Estimation of maize properties and differentiating moisture and nitrogen deficiency stress via ground–based remotely sensed data. Agric. Water Manag. 2020, 242, 106413. [Google Scholar] [CrossRef]
  30. Rouse, J.W., Jr.; Haas, R.H.; Deering, D.; Schell, J.; Harlan, J.C. Monitoring the Vernal Advancement and Retrogradation (Green Wave Effect) of Natural Vegetation; Texas A&M University: College Station, TX, USA, 1974. Available online: https://ntrs.nasa.gov/citations/19750020419 (accessed on 1 June 2025).
  31. Daughtry, C.S.; Walthall, C.; Kim, M.; De Colstoun, E.B.; McMurtrey, J.E., III. Estimating corn leaf chlorophyll concentration from leaf and canopy reflectance. Remote Sens. Environ. 2000, 74, 229–239. [Google Scholar] [CrossRef]
  32. Wu, C.; Niu, Z.; Tang, Q.; Huang, W. Estimating chlorophyll content from hyperspectral vegetation indices: Modeling and validation. Agric. For. Meteorol. 2008, 148, 1230–1241. [Google Scholar] [CrossRef]
  33. Haboudane, D.; Miller, J.R.; Tremblay, N.; Zarco-Tejada, P.J.; Dextraze, L. Integrated narrow-band vegetation indices for prediction of crop chlorophyll content for application to precision agriculture. Remote Sens. Environ. 2002, 81, 416–426. [Google Scholar] [CrossRef]
  34. Rondeaux, G.; Steven, M.; Baret, F. Optimization of soil-adjusted vegetation indices. Remote Sens. Environ. 1996, 55, 95–107. [Google Scholar] [CrossRef]
  35. Zarco-Tejada, P.J.; Berjón, A.; Lopez-Lozano, R.; Miller, J.R.; Martín, P.; Cachorro, V.; González, M.; De Frutos, A. Assessing vineyard condition with hyperspectral indices: Leaf and canopy reflectance simulation in a row-structured discontinuous canopy. Remote Sens. Environ. 2005, 99, 271–287. [Google Scholar] [CrossRef]
  36. Haboudane, D.; Miller, J.R.; Pattey, E.; Zarco-Tejada, P.J.; Strachan, I.B. Hyperspectral vegetation indices and novel algorithms for predicting green LAI of crop canopies: Modeling and validation in the context of precision agriculture. Remote Sens. Environ. 2004, 90, 337–352. [Google Scholar] [CrossRef]
  37. Zarco-Tejada, P.J.; Miller, J.R.; Mohammed, G.H.; Noland, T.L.; Sampson, P.H. Estimation of chlorophyll fluorescence under natural illumination from hyperspectral data. Int. J. Appl. Earth Obs. Geoinf. 2001, 3, 321–327. [Google Scholar] [CrossRef]
  38. Penuelas, J.; Baret, F.; Filella, I. Semi-empirical indices to assess carotenoids/chlorophyll a ratio from leaf spectral reflectance. Photosynthetica 1995, 31, 221–230. [Google Scholar]
  39. Pen Uelas, J.; Filella, I.; Lloret, P.; Mun Oz, F.; Vilajeliu, M. Reflectance assessment of mite effects on apple trees. Int. J. Remote. Sens. 1995, 16, 2727–2733. [Google Scholar] [CrossRef]
  40. Peñuelas, J.; Gamon, J.; Fredeen, A.; Merino, J.; Field, C. Reflectance indices associated with physiological changes in nitrogen-and water-limited sunflower leaves. Remote Sens. Environ. 1994, 48, 135–146. [Google Scholar] [CrossRef]
  41. Gamon, J.; Penuelas, J.; Field, C. A narrow-waveband spectral index that tracks diurnal changes in photosynthetic efficiency. Remote Sens. Environ. 1992, 41, 35–44. [Google Scholar] [CrossRef]
  42. Lichtenthaler, H.K.; Lang, M.; Sowinska, M.; Heisel, F.; Miehe, J. Detection of vegetation stress via a new high resolution fluorescence imaging system. J. Plant Physiol. 1996, 148, 599–612. [Google Scholar] [CrossRef]
  43. Carter, G.A. Ratios of leaf reflectances in narrow wavebands as indicators of plant stress. Int. J. Remote Sens. 1994, 15, 697–703. [Google Scholar] [CrossRef]
  44. Carter, G.A.; Cibula, W.G.; Miller, R.L. Narrow-band reflectance imagery compared with thermalimagery for early detection of plant stress. J. Plant Physiol. 1996, 148, 515–522. [Google Scholar] [CrossRef]
  45. Gitelson, A.A.; Merzlyak, M.N. Remote estimation of chlorophyll content in higher plant leaves. Int. J. Remote Sens. 1997, 18, 2691–2697. [Google Scholar] [CrossRef]
  46. Gitelson, A.A.; Merzlyak, M.N.; Chivkunova, O.B. Optical properties and nondestructive estimation of anthocyanin content in plant leaves. Photochem. Photobiol. 2001, 74, 38–45. [Google Scholar] [CrossRef] [PubMed]
  47. Gitelson, A.A.; Zur, Y.; Chivkunova, O.B.; Merzlyak, M.N. Assessing carotenoid content in plant leaves with reflectance spectroscopy. Photochem. Photobiol. 2002, 75, 272–281. [Google Scholar] [CrossRef] [PubMed]
  48. Roujean, J.-L.; Breon, F.-M. Estimating PAR absorbed by vegetation from bidirectional reflectance measurements. Remote Sens. Environ. 1995, 51, 375–384. [Google Scholar] [CrossRef]
  49. Dashdondov, K.; Jo, K.; Kim, M.-H. Linear interpolation and Machine Learning Methods for Gas Leakage Prediction Base on Multi-source Data Integration. J. Korea Converg. Soc. 2022, 13, 33–41. [Google Scholar] [CrossRef]
  50. Pacholski, A.; Cai, G.; Nieder, R.; Richter, J.; Fan, X.; Zhu, Z.; Roelcke, M. Calibration of a simple method for determining ammonia volatilization in the field–comparative measurements in Henan Province, China. Nutr. Cycl. Agroecosystems 2006, 74, 259–273. [Google Scholar] [CrossRef]
  51. R Core Team. R: A Language and Environment for Statistical Computing; R Foundation for Statistical Computing: Vienna, Austria, 2022. Available online: https://www.R-project.org/ (accessed on 21 November 2024).
  52. Jilani, M.S.; Burki, T.; Waseem, K. Effect of nitrogen on growth and yield of radish. J. Agric. Res. 2010, 48, 219–225. [Google Scholar] [CrossRef]
  53. Kirkby, E.A. Plant growth in relation to nitrogen supply. Ecol. Bull. 1981, 33, 249–267. [Google Scholar]
  54. Bojović, B.; Marković, A.J. Correlation between nitrogen and chlorophyll content in wheat (Triticum aestivum L.). Kragujev. J. Sci. 2009, 31, 69–74. [Google Scholar]
  55. Samarina, L.; Malyukova, L.; Koninskaya, N.; Malyarovskaya, V.; Ryndin, A.; Tong, W.; Xia, E.; Khlestkina, E.J.H. Efficient vegetation indices for phenotyping of abiotic stress tolerance in tea plant (Camellia sinensis (L.) Kuntze). Heliyon 2024, 10, e35522. [Google Scholar] [CrossRef]
  56. Kakani, V.; Reddy, K. Mineral deficiency stress: Reflectance properties, leaf photosynthesis and growth of nitrogen deficient big bluestem (Andropogon gerardii). J. Agron. Crop. Sci. 2010, 196, 379–390. [Google Scholar] [CrossRef]
  57. Myneni, R.B.; Hall, F.G.; Sellers, P.J.; Marshak, A.L. The interpretation of spectral vegetation indexes. IEEE Trans. Geosci. Remote Sens. 1995, 33, 481–486. [Google Scholar] [CrossRef]
  58. Rubio-Delgado, J.; Pérez, C.J.; Vega-Rodríguez, M.A. Predicting leaf nitrogen content in olive trees using hyperspectral data for precision agriculture. Precis. Agric. 2021, 22, 1–21. [Google Scholar] [CrossRef]
  59. Ihuoma, S.O.; Madramootoo, C.A. Narrow-band reflectance indices for mapping the combined effects of water and nitrogen stress in field grown tomato crops. Biosyst. Eng. 2020, 192, 133–143. [Google Scholar] [CrossRef]
  60. Ren, B.; Huang, Z.; Liu, P.; Zhao, B.; Zhang, J. Urea ammonium nitrate solution combined with urease and nitrification inhibitors jointly mitigate NH3 and N2O emissions and improves nitrogen efficiency of summer maize under fertigation. Field Crop. Res. 2023, 296, 108909. [Google Scholar] [CrossRef]
  61. Groenestein, C.; Hutchings, N.; Haenel, H.; Amon, B.; Menzi, H.; Mikkelsen, M.; Misselbrook, T.; Van Bruggen, C.; Kupper, T.; Webb, J. Comparison of ammonia emissions related to nitrogen use efficiency of livestock production in Europe. J. Clean. Prod. 2019, 211, 1162–1170. [Google Scholar] [CrossRef]
Figure 1. Changes in temperature and soil water content during the growth period of radish.
Nitrogen 06 00042 g001
Figure 2. Ammonia collection device with sulfuric acid trapping solution.
Nitrogen 06 00042 g002
Figure 3. Principal component analysis of the variability in vegetation indices of radish treated with different concentrations of urea fertilizer. The direction and length of the vectors represent the correlations among variables and their contribution to explaining principal components 1 and 2.
Nitrogen 06 00042 g003
Figure 4. Linear interpolation of ammonia emissions based on urea levels after compost application. (Ammonia volatilization was continuously monitored for five days after each fertilizer application. Beyond this period, measurements were taken at seven-day intervals, and linear interpolation was applied to estimate emissions during the unmeasured periods.)
Nitrogen 06 00042 g004
Table 1. Chemical properties of soil prior to fertilizer application.
Soil TexturepH
(1:5)
O.M 1
(g kg−1)
TK-N
(mg kg−1)
Av. SiO2
(mg kg−1)
K+Ca2+Mg2+
(cmolc kg−1)
Loam5.339.80839.3398.70.663.620.22
1 organic matter.
Table 2. Summary of the treatments in this study with four different concentrations of urea.
TotalCompost
(kg)
Basal
Application
(kg)
First
Additional
Fertilizer
DAT 21
(kg)
Second
Additional
Fertilizer
DAT 35
(kg)
0 kg urea ha−1 (0 N)1500000
117 kg urea ha−1 (0.5 N)15004237.537.5
234 kg urea ha−1 (1 N)1500847575
468 kg urea ha−1 (2 N)1500168150150
Table 3. List of vegetation indices calculated using PolyPen with corresponding equations.
Vegetation IndexEquation
Normalized difference vegetation index [30] NDVI = R N I R R R E D / R N I R + R R E D
Simple ratio index [30] SR = R N I R / R R E D
Modified chlorophyll absorption in reflectance index [31,32] MCARI = [ ( R 700 R 670 )     0.2   ×   ( R 700 R 550 ) ]   ×   ( R 700 / R 670 )
MCARI = [ ( R 750 R 705 )     0.2   ×   ( R 750 R 550 ) ]   ×   ( R 750 / R 705 )
Transformed chlorophyll absorption in reflectance index [33] TCARI = 3 × [ ( R 700 R 670 )     0.2   ×   ( R 700 R 550 ) ]   ×   ( R 700 / R 670 )
Optimized soil-adjusted vegetation index [34] OSAVI = ( 1 + 0.16 ) × ( R 700 R 670 ) ( R 700 / R 670 ) / ( R 790 R 670 + 0.16 )
Greenness index [35] G = R 554 / R 677
Triangular vegetation index [36] TVI = 0.5 × [ 120 × ( R 750 R 550 )     200 × ( R 670 R 550 )]
Zarco-Tejada & Miller index [37] ZMI = R 750 / R 710
Simple ratio pigment index [38] SRPI = R 430 / R 680
Normalized phaeophytinization index [39] NPQI = ( R 415 R 435 ) /   ( R 415 + R 435 )
Normalized pigment chlorophyll index [40] NPCI = ( R 680 R 430 ) /   ( R 680 + R 430 )
Photochemical reflectance index [41] PRI = ( R 531 R 570 ) / ( R 531 + R 570 )
Structure intensive pigment index [38] SIPI = ( R 790 R 450 ) / ( R 790 R 650 )
Lichtenthaler indices [42] Lic   1 = ( R 790 R 680 ) / ( R 790 + R 680 )
Lic   2 = R 440 / R 690
Carter indices [43,44] Ctr 1 = R 695 / R 420
Ctr 2 = R 695 / R 760
Gitelson and Merzlyak Indices [45] GM 1 = R 750 / R 550
GM 2 = R 750 / R 700
Anthocyanin reflectance indices [46] ARI 1 = 1 / R 550 1 / R 700
ARI 2 = R 790 × 1 / R 550 1 / R 700
Carotenoid reflectance indices [47] CRI 1 = 1 / R 510 1 / R 550
CRI 2 = 1 / R 510 1 / R 700
Renormalized difference vegetation index [48] RDVI = ( R 780 R 670 ) / ( ( R 780 + R 670 )0.5)
Table 4. Agronomic traits of radish plants grown in different urea concentrations and harvested 70 days after treatment.
Treatment
(kg urea ha−1)
Height *
(cm/plant)
Leaf
Width ***
(cm/plant)
Root
Length ***
(cm/plant)
Root
Diameter ***
(cm/plant)
Fresh Shoot Weight (g/plant) ***Fresh Root Weight (g/plant) ***
028.0 ± 1.0 b11.8 ± 0.6 c25.8 ± 1.3 b7.4 ± 0.5 b65.7 ± 14.1 b406.3 ± 74.5 b
11742.0 ± 1.5 a16.1 ± 0.6 b34.3 ± 1.2 a10.1 ± 0.4 a248.7 ± 60.1 a1338.1 ± 209.2 a
23444.0 ± 0.6 a16.6 ± 0.8 b33.0 ± 1.2 a10.3 ± 0.3 a250.6 ± 60.8 a1327.9 ± 60.8 a
46844.9 ± 1.5 a18.5 ± 0.1 a32.3 ± 2.0 a10.5 ± 0.3 a217.1 ± 20.5 a1246.4 ± 28.1 a
Note: Data represent mean ± standard error of measurements from nine plants. Kruskal–Wallis test was used for height, root length, fresh shoot weight, and fresh root weight due to violations of normality or homogeneity of variances. ANOVA was applied to leaf width and root diameter, which met both assumptions. Asterisks indicate statistically significant differences (* p < 0.05, *** p < 0.001). Different lowercase letters indicate significant differences among treatments as determined by Duncan’s multiple range test (DMRT) or Dunn’s test.
Table 5. Comparison of average vegetation indices of radish plants grown under different urea concentrations during the cultivation period.
Vegetation Index0 kg urea ha−1117 kg urea ha−1234 kg urea ha−1468 kg urea ha−1
NDVI ***0.680 ± 0.037 b0.731 ± 0.027 a0.733 ± 0.023 a0.739 ± 0.031 a
SR ***5.330 ± 0.737 b6.515 ± 0.757 a6.551 ± 0.660 a6.754 ± 0.894 a
MCARI (700, 670 nm) ***0.432 ± 0.099 a0.307 ± 0.075 b0.281 ± 0.074 bc0.256 ± 0.088 c
MCARI (750, 705 nm) ***0.669 ± 0.125 b0.881 ± 0.140 a0.915 ± 0.131 a0.973 ± 0.183 a
TCARI ***0.505 ± 0.083 a0.390 ± 0.062 b0.369 ± 0.062 b0.345 ± 0.078 b
OSAVI **0.751 ± 0.019 b0.768 ± 0.015 a0.765 ± 0.014 a0.766 ± 0.024 a
G ***3.112 ± 0.367 a2.787 ± 0.336 b2.692 ± 0.351 b2.625 ± 0.457 b
TVI **44.373 ± 1.811 a43.221 ± 1.883 a42.673 ± 2.088 b42.220 ± 3.254 b
ZMI ***1.783 ± 0.142 c2.026 ± 0.156 b2.076 ± 0.162 ab2.143 ± 0.202 a
SPRIns1.117 ± 0.0611.160 ± 0.0581.147 ± 0.0641.146 ± 0.060
NPQIns0.061 ± 0.0030.064 ± 0.0050.073 ± 0.0070.071 ± 0.006
NPCIns−0.047 ± 0.091−0.067 ± 0.088−0.061 ± 0.087−0.059 ± 0.095
PRI *−0.002 ± 0.025 b0.011 ± 0.024 a0.014 ± 0.022 a0.010 ± 0.024 a
SIPI **0.748 ± 0.019 b0.771 ± 0.019 a0.771 ± 0.027 a0.772 ± 0.032 a
Lic1 **0.778 ± 0.025 b0.794 ± 0.019 a0.792 ± 0.016 a0.793 ± 0.022 a
Lic2 **0.845 ± 0.163 b0.936 ± 0.160 a0.935 ± 0.158 a0.956 ± 0.179 a
Ctr1 ***1.642 ± 0.310 a1.395 ± 0.245 b1.359 ± 0.233 b1.340 ± 0.291 b
Ctr2 ***0.232 ± 0.028 a0.191 ± 0.019 b0.187 ± 0.018 b0.180 ± 0.022 b
GM1 ***2.646 ± 0.331 c3.197 ± 0.352 b3.267 ± 0.308 ab3.408 ± 0.453 a
GM2 ***2.988 ± 0.338 c3.596 ± 0.350 b3.693 ± 0.386 ab3.861 ± 0.464 a
ARI1 *−0.486 ± 0.154 a−0.564 ± 0.181 a−0.613 ± 0.282 a−0.651 ± 0.232 b
ARI2 *−0.341 ± 0.103 a−0.398 ± 0.126 a−0.426 ± 0.177 a−0.454 ± 0.157 b
CRI1 ns4.516 ± 0.6334.954 ± 0.6834.869 ± 1.0204.952 ± 1.227
CRI2 ns4.030 ± 0.5564.390 ± 0.6504.256 ± 0.8084.301 ± 1.100
RDVI *0.694 ± 0.021 b0.704 ± 0.018 a0.707 ± 0.017 a0.703 ± 0.032 a
Note: Data represent the mean ± standard deviation of measurements from five plants. ANOVA was conducted for SR, ZMI, Lic1, GM1, GM2, and MCARI (700, 670 nm), as these indices satisfied the assumptions of normality and homogeneity of variances. All other vegetation indices were analyzed using the Kruskal–Wallis test due to violations of these assumptions. Asterisks indicate statistically significant differences (* p < 0.05, ** p < 0.01, *** p < 0.001). Different lowercase letters denote significant differences among treatments, as determined by Duncan’s multiple range test (DMRT) or Dunn’s test.
Table 6. The relative contribution of 26 different vegetation indices to the formation of principal component 1 (PC1) in radishes at various urea application treatments.
PositiveNegative
Vegetation IndexRelative ContributionVegetation IndexRelative Contribution
GM10.287Ctr2−0.269
ZMI0.279TCARI−0.266
NDVI0.276MCARI(670)−0.252
SR0.274Ctr1−0.243
MCARI(705)0.274G−0.219
GM20.273NPCI−0.135
PRI0.218TVI−0.101
Lic20.197NPQI−0.067
OSAVI0.162ARI2−0.044
Lic10.144ARI1−0.032
SPRI0.138CRI2−0.002
RDVI0.138--
DAT0.092--
SIPI0.092--
CRI10.006--
Table 7. Total soil nitrogen and total NH3 emissions during radish cultivation with urea treatments.
Kg urea ha−1Pre-Experiment Total Soil Nitrogen
(mg kg−1)
Post-Harvest Total Soil Nitrogen ***
(mg kg−1)
Kg NH3 ha−1 Season−1 **
0839.3515.8 ± 8.53 c16.57 b
117461.4 ± 26.4 c13.61 c
234784.8 ± 46.6 b18.27 a
468971.9 ± 24.3 a26.41 a
Note: Data represent mean ± standard error from three soil samples. The Kruskal–Wallis test was used for Kg NH3 ha−1 season−1 due to violations of normality and homogeneity of variances. ANOVA was applied to post-harvest total soil nitrogen, as it met both assumptions. Asterisks indicate statistically significant differences (** p < 0.01, *** p < 0.001). Different lowercase letters indicate significant differences among treatments as determined by Duncan’s multiple range test (DMRT) or Dunn’s test.
Disclaimer/Publisher’s Note: The statements, opinions and data contained in all publications are solely those of the individual author(s) and contributor(s) and not of MDPI and/or the editor(s). MDPI and/or the editor(s) disclaim responsibility for any injury to people or property resulting from any ideas, methods, instructions or products referred to in the content.

