Abstract
A meta-regression was conducted on studies published from 2018 to 2023 to explore the effects of nutrient intakes from alfalfa (ALF) and corn silage (CS) on milk yield (MY), energy-corrected milk yield (ECM), N efficiency (NEFF), milk urea nitrogen (MUN), and manure nitrogen excretion (NMANURE) in Holstein lactating cows. The analysis included 193 studies with 698 individual treatment means. Multiple models were developed for each response variable using a backward stepwise approach and cross-evaluated against the database. Nutrient intake from both CS and ALF influenced MY and ECM, with ALF generally having a positive effect. The NEFF was also affected by nutrient intakes from both forages. Generally, greater protein intake reduced NEFF, whereas greater MY was associated with improved NEFF. An increase in the rumen-degradable protein intake (RDPI), especially from ALF, increased MUN. However, no significant effect of protein intake from CS on MUN was observed. Additionally, an increase in crude protein intake and RDPI, regardless of source (CS or ALF), led to an increase in g/d of NMANURE. Our results indicate that nutrient intakes from ALF and CS have different effects on production, excretion, and nitrogen efficiency, supporting their use in targeted nutrient and waste management strategies.
1. Introduction
Alfalfa (ALF), provided as hay or haylage, and corn silage (CS) are the two most common forage sources in the diets of dairy cows in the Western United States. These forages are good sources of neutral detergent fiber (NDF) but they differ markedly in protein, starch, and mineral content [1,2]. On average, mid-maturity ALF hay contains 20.7% (±2.37) crude protein (CP), 1.5% (±0.85) starch, and 41.1% (±4.84) NDF, while typical CS contains 7.7% (±0.94) CP, 32.9% (±6.42) starch, and 40.9% (±4.75) NDF [1]. The nutritional differences (nutrient content, digestibility, and inclusion rate in the diet) can influence dry matter intake (DMI) and nutrient supply, and thus lactation performance and efficiencies [3,4]. Because CS is more energy-dense than alfalfa, it supplies readily fermentable carbohydrates that can increase DMI and milk yield (MY); however, its higher starch level can predispose cows to rumen acidosis [5,6,7]. Conversely, the protein and NDF content in alfalfa influence rumen fill, ammonia recycling, microbial protein synthesis, and nitrogen efficiency (NEFF) [8,9,10].
Over the past 15–20 years, a shift has occurred in the ratio of CS to ALF in the diets of lactating dairy cows in the United States. Corn silage inclusion in the diets of lactating dairy cows has increased, while ALF use has decreased [11]. This trend parallels an about 40% decrease in U.S. alfalfa acreage and approximately 70% increase in corn silage production in the last 5 decades [12]. This shift has been driven primarily by agronomic and economic factors, such as lower nitrogen-fertilizer costs, easier harvest and storage of corn silage, and favorable farm–gate prices, rather than by differences in nutritive value alone [13,14].
Studies investigating the effects of altering dietary CS and ALF inclusion rates have reported inconsistent results regarding DMI, milk components, and manure nitrogen excretion (NMANURE). For instance, Weiss et al. [13] and Wattiaux and Karg [14] disagreed on crude protein intake (CPI) effects on MY, energy-corrected milk yield (ECM), and NMANURE. Given the changes in dietary forage inclusion rates, there is a need to quantify the impacts of CS and ALF on production, N excretion, and efficiencies, as no comprehensive review of these effects has been performed to date.
To address this gap, we conducted a meta-regression [15,16] to evaluate how varying nutrient intakes from ALF and CS affect MY, ECM, milk urea nitrogen (MUN), NMANURE, and NEFF in lactating Holstein cows. By synthesizing nutrient intake and response data across a broad range of CS and ALF inclusion levels, this analysis aims to improve our understanding of how shifts in forage inclusion influence milk production and N excretion, thereby providing insights into optimizing forage strategies for enhanced productivity and environmental sustainability.
2. Materials and Methods
2.1. Data Collection
Data used for the meta-regression were collected from studies published from 2018 to 2023. Publications were retrieved from index databases, such as PubMed, Web of Science, SCIELO, and Scopus. The 2018–2023 timeframe was chosen to reflect both the most current genetic potential of the Holstein cows and the varieties of corn and alfalfa currently used worldwide, ensuring the relevance of the results.
An initial search yielded 1569 studies using the search terms “milk urea nitrogen”, “MUN”, and “cow”. Publications categorized as reviews, meta-analyses, abstracts, or other non-primary research types were excluded (Figure 1). After downloading the studies, further selection criteria were applied: (1) studies must include information on milk production and components (milk fat, milk protein) and MUN; (2) must provide dietary ingredients; (3) must include ALF as either hay or haylage and/or CS in the diet; (4) must involve lactating Holstein dairy cows; (5) exclude diets with grazed pasture; and (6) must include data on dry matter intake (DMI). Studies that failed to meet these criteria were excluded.
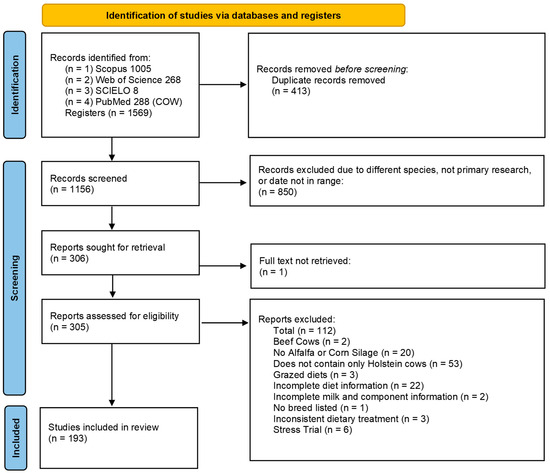
Figure 1.
PRISMA flowchart showing the process of identifying and screening eligible studies for inclusion into the primary database. Date range used: 2018–2023. Keywords used: milk urea nitrogen + cow, MUN + cow.
A summary of the study selection process is shown in a PRISMA flow chart (Figure 1) [17]. If a study included multiple treatments, only those meeting the criteria were retained. Studies involving heat stress or challenges to DMI were also excluded to avoid confounding factors that could bias the analysis. Ultimately, 193 studies comprising 698 treatment means were included in the final database. The descriptive statistics of the database are shown in Table 1.

Table 1.
Descriptive statistics of the database production and intake variables.
2.2. Calculations
For studies lacking reported values for energy-corrected milk (ECM), milk fat (MFAT)% or kg/d, or milk crude protein (MPROTEIN)% or kg/d, the variables were calculated. If both percent and yield were missing, the study was discarded. Missing MFAT and MPROTEIN variables, whether in kg or percentage, were calculated. Missing MFAT and MPROTEIN production (in kg) were calculated by multiplying the MY by the respective percentage divided by 100. The MFAT and MPROTEIN percentages were calculated by dividing the yield in kg by MY. The ECM values, when not reported, were calculated using an equation proposed by Sjaunja et al. [18] and evaluated by Hall [19]:
ECM (kg/d) = 0.25 × MY (kg) + 12.2 × MFAT (kg) + 7.7 × MPROTEIN (kg)
Milk true protein (MTP) values were converted to MPROTEIN when the latter was not reported. The MPROTEIN was calculated by adding 0.19% to MTP [20,21,22,23,24], representing the mean non-protein nitrogen (NPN) content in milk. The equation is as follows:
MPROTEIN (%) = MTP (%) + 0.19%
The DMI of CS and ALF was calculated by multiplying their inclusion rates in the diet (on a DM basis) by the DMI. Nutrient intakes (CP, rumen-undegradable protein (RUP), rumen-degradable protein (RDP), and NDF) from ALF and CS were calculated in a similar manner, based on ALF and CS nutrient compositions reported in the publications. When the specific nutrient content of ALF or CS was not reported in the study, the NASEM feed library values [1] were used. Remaining DMI and nutrient intakes were calculated by subtracting the CS and ALF contributions from the total diet values. These intakes were categorized as “OTHER” (referring to other ingredients).
The NEFF, when not reported, was calculated as follows:
NEFF = Milk Nitrogen (kg/d)/Nitrogen Intake (kg/d)
2.3. Statistical Analysis
All statistical analyses were performed using the R programming language (version 2023.12.1+402) [25,26]. Descriptive statistics were calculated using the psych package (version 2.4.6.26), and preliminary plots were generated with the ggplot2 (version 3.5.1) and GGally (version 2.2.1) packages. Model development was performed using the lme4 and lmerTest (version 3.1-3) packages [27,28]. Mixed models were fitted to the data using maximum likelihood estimation, considering study as a random effect. Data were weighted by the square root of the number of observations in each treatment mean.
A stepwise approach with backward elimination was employed, sequentially removing variables from the global model until all remaining variables had p-values ≤ 0.05. Collinearity was assessed using variance inflation factors (VIFs). All variables in the final models had VIFs of less than 4, indicating minimal collinearity. The models were cross-evaluated against the database. The evaluation metrics included the concordance correlation coefficient (CCC) and root mean squared error (RMSE). These were calculated from residuals unadjusted for random study effects (as obtained using the predict function in lme4), following the methods described by Lin [29] and Bibby and Toutenburg [30].
3. Results
The three predictive models for estimating MY are presented in Table 2. Model MY1 included BW and dietary CPI as significant variables (RMSE = 4.81% mean and CCC = 0.97). Model MY2 incorporated DMI from ALF, CS, and OTHER (RMSE = 3.94% mean and CCC = 0.98). Finally, model MY3 used the specific nutrient intakes from these ingredients (RMSE = 4.88% mean and CCC = 0.96).
Table 2.
Predictive models for milk yield (kg/d) in lactating Holstein cows fed corn silage (CS) and/or alfalfa hay or haylage (ALF).
Body weight and crude protein intake (CPI) have a positive effect on MY. Corn silage and ALF both have mixed effects on MY, depending on the nutrient used for calculation. The positive coefficients of DMI from CS, ALF, and OTHER indicate that within the intake ranges in the database, higher DMI from these dietary ingredients is associated with greater MY. However, when evaluated by specific nutrient intakes, the effects varied. Rumen-undegradable protein intake (RUPI) from ALF, neutral detergent fiber intake (NDFI) from CS, and CPI from OTHER have a positive effect on MY, while NDFI from OTHER had a negative effect.
Three predictive models for ECM were generated, similar to those for MY (Table 3). Three significant models were identified. Model ECM1 included BW and dietary CPI and NDFI with both BW and CPI positively affected ECM but dietary NDFI had a negative impact (RMSE = 4.05% and CCC = 0.98). Model ECM2, similar to MY2, showed that DMI from CS, ALF, and OTHER positively affected ECM (RMSE = 3.63% and CCC = 0.98). In model ECM3 we observed that starch intake (StarchI) from OTHER, RDP intake (RDPI) from ALF, and RUPI from OTHER all had a positive effect on ECM, while NDFI from ALF and OTHER had a negative effect (RMSE = 3.43% and CCC = 0.98).
Table 3.
Predictive models for energy-corrected milk (kg/d) in lactating Holstein cows fed corn silage (CS) and/or alfalfa hay or haylage (ALF).
Nitrogen efficiency yielded five models, as shown in Table 4 and Table 5. Model NEFF1 showed both BW and MY having a positive effect on NEFF while CPI and NDFI had negative effects (RMSE = 2.39% and CCC = 0.99). Model NEFF2 also showed CPI with a negative effect with StarchI and ECM having positive effects (RMSE = 2.93% and CCC = 0.99). Model NEFF3 showed ECM had a positive effect and DMI from ALF had a negative effect (RMSE = 5.54% and CCC = 0.95). Model NEFF4 showed that both BW and ECM had positive effects on NEFF, while CPI from CS, ALF, and OTHER had negative effects (RMSE = 2.32% and CCC = 0.99). Model NEFF5 showed ECM had a positive effect and MUN, NDFI from OTHER, and RDPI from ALF and CS had negative effects (RMSE = 4.29% and CCC = 0.97).
Table 4.
Predictive models for nitrogen efficiency (NEFF) in lactating Holstein cows fed corn silage (CS) and/or alfalfa hay or haylage (ALF).
Table 5.
Predictive models for nitrogen efficiency in lactating Holstein cows fed corn silage (CS) and/or alfalfa hay or haylage (ALF) (continued models NEFF4 and NEFF5).
Three models were developed for predicting MUN (Table 6). Model MUN1 showed total RDPI and RUPI having a positive effect on MUN while NDFI and StarchI both had negative effects on MUN (RMSE = 6.28% and CCC = 0.94). Model MUN2 used DMI from CS and ECM, with both variables having a negative effect (RMSE = 9.63% and CCC = 0.88). Model MUN3 showed that RDPI from ALF and OTHER had positive effects on MUN, while NDFI from CS and StarchI from OTHER had negative effects (RMSE = 7.77% and CCC = 0.91).
Table 6.
Predictive models for milk urea nitrogen (MUN) in lactating Holstein cows fed corn silage (CS) and/or alfalfa hay or haylage (ALF).
Two models were generated for NMANURE, shown in Table 7. Model NMANURE1 showed both ECM and total CPI having a positive effect on NMANURE (RMSE = 13.25% and CCC = 0.94). Model NMANURE2 also showed ECM with a positive effect (RMSE = 1.56% and CCC = 1.00). The RDPI from CS, ALF, and OTHER all had positive effects with NDFI from OTHER and StarchI from ALF had negative effects.
Table 7.
Predictive models for manure nitrogen (NMANURE) in lactating Holstein cows fed corn silage (CS) and/or alfalfa hay or haylage (ALF).
Three models were developed for predicting MUN (Table 6). Model MUN1 showed total RDPI and RUPI having a positive effect on MUN, while NDFI and StarchI both had negative effects on MUN (RMSE = 6.28% and CCC = 0.94). Model MUN2 used DMI from CS and ECM, with both variables having a negative effect (RMSE = 9.63% and CCC = 0.88). Model MUN3 showed RDPI from ALF and OTHER had positive effects on MUN, while NDFI from CS and StarchI from OTHER had negative effects (RMSE = 7.77% and CCC = 0.91).
Two models were generated for NMANURE, shown in Table 7. Model NMANURE1 showed both ECM and total CPI having a positive effect on NMANURE (RMSE = 13.25% and CCC = 0.94). Model NMMANURE2 also showed ECM with a positive effect (RMSE = 1.56% and CCC = 1.00). The RDPI from CS, ALF, and OTHER all had positive effects, with NDFI from OTHER and StarchI from ALF having negative effects.
4. Discussion
Models created from this meta-regression study show that both DMI and specific nutrient intake from CS and ALF have an effect on MY, ECM, MUN, NMANURE, and NEFF. The recent NASEM Nutrient Requirements of Dairy Cattle [1] report that typical CS contains 7–8% CP, 30–35% starch, and 39–43% NDF. More mature CS has higher starch levels but lower NDF and CP than immature silages. It also reports that ALF has between 18 and 22% CP, 1.5 and 2.3% starch, and 37 and 46% NDF. The maturity of ALF does not appear to affect starch levels; however, CP decreases and NDF increases with advancing maturity [31]. This does not differ for ALF in the form of hay or silage. Corn silage and ALF can vary between farms, resulting in the variability of available nutrients [32]. Understanding the specific nutrients of the forages available are important to determine the effects on the response variables.
4.1. Milk Yield and Energy-Corrected Milk Yield
Both CS and ALF were shown to affect MY and ECM in similar ways. The DMI of both forages positively affected MY and ECM (see models ECM2 and MY2). Although it was beyond the scope of this meta-analysis, our models suggest the possibility that the maturity of the ALF and the changing nutrient content (i.e., CP, RDP, and NDF) can change specific nutrient intakes and impact MY and ECM [31]. More mature ALF has higher NDF, lower CP, lower RDP, and lower RUP than less mature ALF [1]. It is possible that changing the maturity of the ALF in the diet without changing the inclusion rate can alter the specific nutrient intake as suggested by Palmonari et al. [31].
Our study had a total DMI of 23.24 kg/d with 7.54 kg/d from CS and 3.97 kg/d from ALF. Work has been performed by different research groups on the combined effects of ALF and CS on MY and components at different inclusion rates. West et al. [33] substituted 33% of the dietary CS with ALF hay and found no effect on MY, but by substituting 67% of the CS with ALF, MY decreased. Baxter et al. [34] reported a positive effect of both CS and ALF together on MY. Arndt et al. [10] reported the highest MY with diets containing CS and ALF haylage in a 60:40 ratio of the dietary forage. Milk fat was also highest in the diets where ALF made up 40% or more of forage DM, which would contribute to the increase in ECM that our models predicted. Dhiman and Satter [35] suggested a similar ratio of CS to ALF for maximum MY. Charmley et al. [36] showed that CS had a positive impact on milk components, which would influence ECM. Our study concurs with prior findings that both forages have a positive effect on MY and ECM. These effects are the result of having adequate CPI to meet the cow’s needs. Previous studies show that optimum dietary CPI is approximately 16.5%, with increased production up to this level and no change above it [37,38,39]. Providing adequate energy in the diet allows the cow to utilize optimal CPI to maximize production [40].
4.2. Nitrogen Efficiency
Total dietary StarchI had a positive effect on NEFF (see NEFF2 in Table 4). Chowdhury et al. [41] reported an increase in NEFF with dietary starch supplementation when compared to a control diet. The researchers did have a reduced dietary CPI as well as a lower starch diet, which is consistent with NEFF2 (− for CPI and + for StarchI). The researchers also had two other treatments with lower CP levels with and without amino acid supplementation. These other diets also improved NEFF compared to the high-CP diet, which aligns with our predictive models showing CPI having a negative effect (see NEFF1, NEFF2, and NEFF4).
Another study by Ipharraguerre and Clark [42] produced complementary findings to those of Chowdhury et al. [41] and our predictive models. Three diets of low, medium, or high dietary CP were used with two different sources of starch. Starch levels and CP were inversely correlated in these diets; as CP increased, dietary starch decreased. The highest NEFF was achieved on the low-CP and high-starch diets. The lowest NEFF was recorded on the high CP and low starch diets. These findings are still consistent with our model NEFF2.
A study conducted by Sun et al. [6] reported a similar positive interaction between StarchI and NEFF. As StarchI levels increased, NEFF also increased. A difference between this study and the previous two is that the CPI remained constant, but RDPI was reduced independently of StarchI with no effect on NEFF. This is in agreement with our models as we found no effect of overall RDPI on NEFF; however, RDPI from ALF and CS both had a negative effect (see models NEFF4 and NEFF5).
In a study looking at different ratios of ALF to CS in the diets, Arndt et al. [10] reported that lower ALF and higher CS in the diets increased the NEFF in dairy cows. This is consistent with our findings. Our models show that DMI, CPI, and RDPI from ALF have a negative effect on NEFF. Other studies also found a similar relationship between ALF, CS, and NEFF. A study by Hassanat et al. [43] reported a consistent CPI and N intake as the ratio of ALF to CS changed, but an increase in MY and milk N as more CS was added. The difference in CPI was made up for by adding OTHER to the diet. The CPI from all three had a negative effect on NEFF in our models. However, Arndt et al. [10] and Brito and Broderick [44] both reported an increase in CPI and N intake as more ALF was added to the diet. The increased N intake could decrease the NEFF if the diet has insufficient energy to encourage microbial growth in the rumen. All three studies had a reduced NEFF as the proportion of ALF increased in the diet, suggesting that ALF has a greater negative effect than CS.
Energy-corrected milk had a positive effect on NEFF in the models where it was included. It can be influenced by the quality of ALF and quantity of both ALF and CS in the diet (see ECM2 and ECM3). The decrease in NEFF as seen by adding more ALF into the diet could be related to the ECM, which decreased with increasing ALF or reduced ALF quality. By reducing the ECM produced, a net loss in NEFF occurs, meaning it does not increase as much as it could with greater ECM production. This suggests that the negative effect of ALF on ECM can affect NEFF in the same way. More work is needed to determine if this conclusion is correct, as the relationship has not been discussed in the papers searched.
Our models show that RDPI from ALF and CS had a negative effect on NEFF. Santos et al. [45] concluded that increasing the dietary RUP:RDP ratio decreased the NEFF in the cows. Diets with a higher amount of RDP had greater NEFF. This relationship was also shown by Savari et al. [46]. The researchers increased the RDP in the diet by adding soybean meal. This increase in RDP increased the NEFF. Both research groups theorized that the increase in RDP increased the rumen production and intestinal flow of amino acids. Both also postulated that this increased flow of amino acids boosted milk production and increased the NEFF of the cow compared to diets with higher RUP.
Model NEFF5 showed RDPI from CS and ALF having an inverse effect and reducing NEFF. As more RUP from ALF and CS is added to the diet, the amount of RDP will decrease. Forage quality and source can change the RUP:RDP ratio [47]. Substituting ALF with CS in equal portions would decrease the total RDP in the diet unless added from another source [1]. The same relationship exists with CPI from ALF, CS, and OTHER, although a negative relationship exists with all three according to model NEFF4. This conclusion agrees with those shown by other research groups [48,49,50,51].
4.3. Milk Urea Nitrogen
Milk urea nitrogen is a common measure of NEFF. Both RDPI and RUPI are the primary sources of dietary N, which influences N partitioning in the body. The N partitioning in dairy cows, including digestion and absorption, has been previously explored [50,52]. As the N intake increases, the body is unable to utilize the excess N up to a certain point at the current energy levels, so it is excreted in the urine and milk [14,53]. The excess unabsorbed N is excreted in the feces. As the N utilization increases, less is wasted as more is absorbed and used for growth, reproduction, and milk production. Higher N utilization resulting in more MY and/or components increases NEFF. This can be seen when ECM is added to the predictive models (see model MUN2). Higher ECM suggests more N is used and less N is wasted in the milk and urine [54].
Naderi et al. [55] reported that diets containing ALF had decreasing MUN as CS was removed and replaced with beet pulp in the diet. This is contrary to our model MUN2 as DMI from CS had a negative effect on MUN, while DMI from ALF and OTHER had no effect. Work by Arndt et al. [10] agrees with this conclusion. However, it is possible that the beet pulp used in the study by Naderi et al. (2016) [55] contained similar energy and protein levels as CS, which would agree with our conclusions from MUN3. However, model MUN3 showed that RDPI from ALF and OTHER had a positive effect on MUN with both NDFI from CS and StarchI from OTHER having negative effects. The extra energy from increased StarchI and NDFI can improve NEFF (see NEFF2) by allowing the body to access more available protein N [52]. Improved NEFF can result in lower MUN [48]. Our models agree with other conclusions in the literature that adding more CS into diets can lower MUN values while ALF tends to increase them.
4.4. Manure Nitrogen
The other measure of NEFF that we evaluated was NMANURE. Weiss et al. [13] reported that increasing ALF in the diet reduced N digestibility and increased NMANURE. Our models concur with their findings. Model NMANURE2 shows that RDPI from ALF, CS, and OTHER have a positive effect on NMANURE. The RDPI content of ALF is much greater than for CS. As discussed previously, by substituting ALF for CS, the RDPI decrease from ALF will be greater than the increase from CS, resulting in a net reduction in NMANURE. This conclusion is based on nutrient values for these two forages [1].
A study by Wattiaux and Karg [14] supports our model conclusions from NMANURE2 about RDPI from ALF and CS. Their study substituted ALF with CS as the primary dietary forage at two different levels of CP with comparable levels of dietary RDP. The diets with high ALF had higher NMANURE than the high CS diets due to higher N intake. However, they found no impact of CPI on NMANURE, whereas our model NMANURE1 found CPI to have a positive effect. In contrast, Weiss et al. [13] reported that CPI had a positive effect on NMANURE, agreeing with our models. Other work also concludes that CPI positively impacts NMANURE [56,57].
5. Conclusions
This meta-regression demonstrates that varying the inclusion levels (proportions) of ALF and CS in lactating dairy cow diets leads to proportional shifts in nutrient intake. Those shifts, in turn, influence milk production, nitrogen utilization efficiencies, and nitrogen excretion. Our findings underscore the critical role that forage selection plays in precision nutrient and waste management strategies on dairies by optimizing nutrient intake and excretion. By tailoring forage choice and ration formulations, dairy producers can improve lactation performance, enhance nitrogen utilization efficiency, and promote the long-term sustainability of their dairy operations.
Author Contributions
Conceptualization, I.A.M.A.T. and M.C.; methodology, D.S., I.A.M.A.T. and M.C.; validation, D.S., I.A.M.A.T. and M.C.; formal analysis, D.S. and I.A.M.A.T.; investigation, D.S., I.A.M.A.T. and M.C.; resources, I.A.M.A.T. and M.C.; data curation, I.A.M.A.T. and M.C.; writing—original draft preparation, D.S.; writing—review and editing, D.S., I.A.M.A.T. and M.C.; visualization, D.S., I.A.M.A.T. and M.C.; supervision, I.A.M.A.T. and M.C.; project administration, I.A.M.A.T. and M.C.; funding acquisition, I.A.M.A.T. and M.C. All authors have read and agreed to the published version of the manuscript.
Funding
Partial funding was provided by the Idaho Agricultural Experiment Station. This work was supported by the USDA National Institute of Food and Agriculture (Hatch Multistate NC2040 and NC2042) Project (10012830; Washington, DC).
Data Availability Statement
Databases and analytical code are available upon request from the authors.
Acknowledgments
A special thanks to Maria G. Podda and Donatella Salis from the University of Sassari in Sassari, Italy, for their instrumental roles in finding the studies and compiling the original database from which this study was performed.
Conflicts of Interest
The authors declare no conflicts of interest.
References
- National Academies of Sciences, Engineering, and Medicine. Nutrient Requirements of Dairy Cattle: Eighth Revised Edition; The National Academies Press: Washington, DC, USA, 2021; ISBN 978-0-309-67777-6. [Google Scholar]
- Bhandari, S.K.; Ominski, K.H.; Wittenberg, K.M.; Plaizier, J.C. Effects of Chop Length of Alfalfa and Corn Silage on Milk Production and Rumen Fermentation of Dairy Cows. J. Dairy Sci. 2007, 90, 2355–2366. [Google Scholar] [CrossRef] [PubMed]
- Riaz, M.Q. Comparative Intake and Digestibility among Ruminant Species Fed Forage-Based Diets. Ph.D. Thesis, Rheinische Friedrich-Wilhelms-Universität Bonn, Bonn, Germany, 2015. [Google Scholar]
- Esdale, W.J.; Broderick, G.A.; Satter, L.D. Measurement of Ruminal Volatile Fatty Acid Production from Alfalfa Hay or Corn Silage Rations Using a Continuous Infusion Isotope Dilution Technique. J. Dairy Sci. 1968, 51, 1823–1830. [Google Scholar] [CrossRef]
- Schingoethe, D.J.; Voelker, H.H.; Beardsley, G.L.; Parsons, J.G. Rumen Volatile Fatty Acids and Milk Composition from Cows Fed Hay, Haylage, or Urea-Treated Corn Silage. J. Dairy Sci. 1976, 59, 894–901. [Google Scholar] [CrossRef]
- Sun, F.; Aguerre, M.J.; Wattiaux, M.A. Starch and Dextrose at 2 Levels of Rumen-Degradable Protein in Iso-Nitrogenous Diets: Effects on Lactation Performance, Ruminal Measurements, Methane Emission, Digestibility, and Nitrogen Balance of Dairy Cows. J. Dairy Sci. 2019, 102, 1281–1293. [Google Scholar] [CrossRef] [PubMed]
- Oelker, E.R.; Reveneau, C.; Firkins, J.L. Interaction of Molasses and Monensin in Alfalfa Hay- or Corn Silage-Based Diets on Rumen Fermentation, Total Tract Digestibility, and Milk Production by Holstein Cows. J. Dairy Sci. 2009, 92, 270–285. [Google Scholar] [CrossRef]
- Herrick, K.J.; Hippen, A.R.; Kalscheur, K.F.; Anderson, J.L.; Ranathunga, S.D.; Patton, R.S.; Abdullah, M. Lactation Performance and Digestibility of Forages and Diets in Dairy Cows Fed a Hemicellulose Extract. J. Dairy Sci. 2012, 95, 3342–3353. [Google Scholar] [CrossRef]
- Holt, M.S.; Neal, K.; Eun, J.S.; Young, A.J.; Hall, J.O.; Nestor, K.E. Corn Silage Hybrid Type and Quality of Alfalfa Hay Affect Dietary Nitrogen Utilization by Early Lactating Dairy Cows1. J. Dairy Sci. 2013, 96, 6564–6576. [Google Scholar] [CrossRef]
- Arndt, C.; Powell, J.M.; Aguerre, M.J.; Wattiaux, M.A. Performance, Digestion, Nitrogen Balance, and Emission of Manure Ammonia, Enteric Methane, and Carbon Dioxide in Lactating Cows Fed Diets with Varying Alfalfa Silage-to-Corn Silage Ratios. J. Dairy Sci. 2015, 98, 418–430. [Google Scholar] [CrossRef] [PubMed]
- Teixeira, I.A.M.A.; Santos, S.A.; Leytem, A.; Chahine, M. Changes in the Dietary Phosphorus of Dairy Cows in Idaho: A Case Study. J. Dairy Sci. 2023, 106, 353. [Google Scholar]
- USDA-NASS. Crop Production Historical Track Records; United States Department of Agriculture, National Agricultural Statistics Service: Washington, DC, USA, 2019. Available online: https://www.nass.usda.gov/Publications/Todays_Reports/reports/croptr19.pdf (accessed on 20 April 2025).
- Weiss, W.P.; Willett, L.B.; St-Pierre, N.R.; Borger, D.C.; McKelvey, T.R.; Wyatt, D.J. Varying Forage Type, Metabolizable Protein Concentration, and Carbohydrate Source Affects Manure Excretion, Manure Ammonia, and Nitrogen Metabolism of Dairy Cows. J. Dairy Sci. 2009, 92, 5607–5619. [Google Scholar] [CrossRef]
- Wattiaux, M.A.; Karg, K.L. Protein Level for Alfalfa and Corn Silage-Based Diets: II. Nitrogen Balance and Manure Characteristics. J. Dairy Sci. 2004, 87, 3492–3502. [Google Scholar] [CrossRef] [PubMed]
- Bown, M.J.; Sutton, A.J. Quality Control in Systematic Reviews and Meta-Analyses. Eur. J. Vasc. Endovasc. Surg. 2010, 40, 669–677. [Google Scholar] [CrossRef] [PubMed]
- Lean, I.J.; Rabiee, A.R.; Duffield, T.F.; Dohoo, I.R. Invited Review: Use of Meta-Analysis in Animal Health and Reproduction: Methods and Applications. J. Dairy Sci. 2009, 92, 3545–3565. [Google Scholar] [CrossRef]
- Page, M.J.; McKenzie, J.E.; Bossuyt, P.M.; Boutron, I.; Hoffmann, T.C.; Mulrow, C.D.; Shamseer, L.; Tetzlaff, J.M.; Akl, E.A.; Brennan, S.E.; et al. The PRISMA 2020 Statement: An Updated Guideline for Reporting Systematic Reviews. BMJ 2021, 372, n71. [Google Scholar] [CrossRef]
- Sjaunja, L.O.; Baevre, L.; Junkkarinen, L.; Pedersen, J.; Setälä, J. A Nordic Proposal for an Energy Corrected Milk (ECM) Formula. In Proceedings of the 2nd Session of Committee for Record and Productivity of Milk Animals, Paris, France, 6 July 1990; p. 156. [Google Scholar]
- Hall, M.B. Invited Review: Corrected Milk: Reconsideration of Common Equations and Milk Energy Estimates. J. Dairy Sci. 2023, 106, 2230–2246. [Google Scholar] [CrossRef]
- SaskMilk. Changing from Total Protein to True Protein; SaskMilk: Regina, SK, Canada, 2018. [Google Scholar]
- Lawlor, T. True Protein—General Information. Available online: https://www.holsteinusa.com/programs_services/true_protein.html#:~:text=The%20change%20was%20made%20because,for%20dairy%20cows%20by%200.19%25 (accessed on 5 September 2024).
- VanRaden, P.M.; Powell, R.L. Genetic Evaluations for True Protein. Available online: https://aipl.arsusda.gov/reference/trueprot.htm#:~:text=Genetic%20Evaluations%20for%20True%20Protein&text=Beginning%20in%20August%202000%2C%20genetic,protein%20instead%20of%20crude%20protein.&text=Most%20U.S.%20farmers%20are%20now,protein%20rather%20than%20crude%20protein (accessed on 5 September 2024).
- Heck, J.M.L.; van Valenberg, H.J.F.; Dijkstra, J.; van Hooijdonk, A.C.M. Seasonal Variation in the Dutch Bovine Raw Milk Composition. J. Dairy Sci. 2009, 92, 4745–4755. [Google Scholar] [CrossRef] [PubMed]
- Ruska, D.; Jonkus, D. Crude Protein and Non-Protein Nitrogen Content in Dairy Cow Milk. Proc. Latv. Univ. Agric. 2014, 32, 36–40. [Google Scholar] [CrossRef]
- R Core Team. R: A Language and Environment for Statistical Computing; R Core Team: Vienna, Austria, 2024. [Google Scholar]
- RStudio Team. RStudio: Integrated Development for R; R Core Team: Vienna, Austria, 2024. [Google Scholar]
- Kuznetsova, A.; Brockhoff, P.B.; Christensen, R.H.B. LmerTest Package: Tests in Linear Mixed Effects Models. J. Stat. Softw. 2017, 82, 1–26. [Google Scholar] [CrossRef]
- Bates, D.; Mächler, M.; Bolker, B.; Walker, S. Fitting Linear Mixed-Effects Models Using Lme4. J. Stat. Softw. 2015, 67, 1–48. [Google Scholar] [CrossRef]
- Lin, L.I.-K. A Concordance Correlation Coefficient to Evaluate Reproducibility. Biometrics 1989, 45, 255. [Google Scholar] [CrossRef]
- Bibby, J.; Toutenburg, H. Prediction and Improved Estimation in Linear Models; John Wiley & Sons Inc.: Hoboken, NJ, USA, 1977; ISBN 978-0471016564. [Google Scholar]
- Palmonari, A.; Fustini, M.; Canestrari, G.; Grilli, E.; Formigoni, A. Influence of Maturity on Alfalfa Hay Nutritional Fractions and Indigestible Fiber Content. J. Dairy Sci. 2014, 97, 7729–7734. [Google Scholar] [CrossRef]
- Barrientos-Blanco, J.A.; Moraes, L.; Lawrence, J.R.; Havekes, C.D.; Cerosaletti, P.; Lucas, A.; Romack, J.; Ketterings, Q.M.; Reed, K.F. Partitioning of Nutrient Variation in Alfalfa and Corn Silage by Source on New York Dairy Farms. J. Dairy Sci. 2024, 107, 5722–5737. [Google Scholar] [CrossRef]
- West, J.W.; Hill, G.M.; Gates, R.N.; Mullinix, B.G. Effects of Dietary Forage Source and Amount of Forage Addition on Intake, Milk Yield, and Digestion for Lactating Dairy Cows. J. Dairy Sci. 1997, 80, 1656–1665. [Google Scholar] [CrossRef]
- Baxter, H.D.; Montgomery, M.J.; Owen, J.R. Digestibility and Feeding Value of Corn Silage Fed with Boot Stage Wheat Silage and Alfalfa Silage. J. Dairy Sci. 1980, 63, 255–261. [Google Scholar] [CrossRef]
- Dhiman, T.R.; Satter, L.D. Yield Response of Dairy Cows Fed Different Proportions of Alfalfa Silage and Corn Silage. J. Dairy Sci. 1997, 80, 2069–2082. [Google Scholar] [CrossRef]
- Charmley, E.; Robinson, P.H.; McQueen, R.E. Corn or Alfalfa as the Forage Source in Predominantly Silage Diets for Late-Lactation Dairy Cows. Can. J. Anim. Sci. 1993, 73, 67–77. [Google Scholar] [CrossRef][Green Version]
- Cunningham, K.D.; Cecava, M.J.; Johnson, T.R.; Ludden, P.A. Influence of Source and Amount of Dietary Protein on Milk Yield by Cows in Early Lactation. J. Dairy Sci. 1996, 79, 620–630. [Google Scholar] [CrossRef] [PubMed]
- Leonardi, C.; Stevenson, M.; Armentano, L.E. Effect of Two Levels of Crude Protein and Methionine Supplementation on Performance of Dairy Cows. J. Dairy Sci. 2003, 86, 4033–4042. [Google Scholar] [CrossRef]
- Olmos Colmenero, J.J.; Broderick, G.A. Effect of Dietary Crude Protein Concentration on Milk Production and Nitrogen Utilization in Lactating Dairy Cows. J. Dairy Sci. 2006, 89, 1704–1712. [Google Scholar] [CrossRef]
- Broderick, G.A. Effects of Varying Dietary Protein and Energy Levels on the Production of Lactating Dairy Cows. J. Dairy Sci. 2003, 86, 1370–1381. [Google Scholar] [CrossRef]
- Chowdhury, M.R.; Wilkinson, R.G.; Sinclair, L.A. Reducing Dietary Protein and Supplementation with Starch or Rumen-Protected Methionine and Its Effect on Performance and Nitrogen Efficiency in Dairy Cows Fed a Red Clover and Grass Silage–Based Diet. J. Dairy Sci. 2024, 107, 3543–3557. [Google Scholar] [CrossRef] [PubMed]
- Ipharraguerre, I.R.; Clark, J.H. Varying Protein and Starch in the Diet of Dairy Cows. II. Effects on Performance and Nitrogen Utilization for Milk Production. J. Dairy Sci. 2005, 88, 2556–2570. [Google Scholar] [CrossRef] [PubMed]
- Hassanat, F.; Gervais, R.; Julien, C.; Massé, D.I.; Lettat, A.; Chouinard, P.Y.; Petit, H.V.; Benchaar, C. Replacing Alfalfa Silage with Corn Silage in Dairy Cow Diets: Effects on Enteric Methane Production, Ruminal Fermentation, Digestion, N Balance, and Milk Production. J. Dairy Sci. 2013, 96, 4553–4567. [Google Scholar] [CrossRef] [PubMed]
- Brito, A.F.; Broderick, G.A. Effect of Varying Dietary Ratios of Alfalfa Silage to Corn Silage on Production and Nitrogen Utilization in Lactating Dairy Cows. J. Dairy Sci. 2006, 89, 3924–3938. [Google Scholar] [CrossRef]
- Santos, F.A.P.; Santos, J.E.P.; Theurer, C.B.; Huber, J.T. Effects of Rumen-Undegradable Protein on Dairy Cow Performance: A 12-Year Literature Review. J. Dairy Sci. 1998, 81, 3182–3213. [Google Scholar] [CrossRef]
- Savari, M.; Khorvash, M.; Amanlou, H.; Ghorbani, G.R.; Ghasemi, E.; Mirzaei, M. Effects of Rumen-Degradable Protein:Rumen-Undegradable Protein Ratio and Corn Processing on Production Performance, Nitrogen Efficiency, and Feeding Behavior of Holstein Dairy Cows. J. Dairy Sci. 2018, 101, 1111–1122. [Google Scholar] [CrossRef]
- Ipharraguerre, I.R.; Clark, J.H.; Freeman, D.E. Varying Protein and Starch in the Diet of Dairy Cows. I. Effects on Ruminal Fermentation and Intestinal Supply of Nutrients. J. Dairy Sci. 2005, 88, 2537–2555. [Google Scholar] [CrossRef]
- Jonker, J.S.; Kohn, R.A.; Erdman, R.A. Using Milk Urea Nitrogen to Predict Nitrogen Excretion and Utilization Efficiency in Lactating Dairy Cows. J. Dairy Sci. 1998, 81, 2681–2692. [Google Scholar] [CrossRef]
- Jonker, J.S.; Kohn, R.A.; Erdman, R.A. Milk Urea Nitrogen Target Concentrations for Lactating Dairy Cows Fed According to National Research Council Recommendations. J. Dairy Sci. 1999, 82, 1261–1273. [Google Scholar] [CrossRef]
- Kauffman, A.J.; St-Pierre, N.R. The Relationship of Milk Urea Nitrogen to Urine Nitrogen Excretion in Holstein and Jersey Cows. J. Dairy Sci. 2001, 84, 2284–2294. [Google Scholar] [CrossRef]
- Groff, E.B.; Wu, Z. Milk Production and Nitrogen Excretion of Dairy Cows Fed Different Amounts of Protein and Varying Proportions of Alfalfa and Corn Silage. J. Dairy Sci. 2005, 88, 3619–3632. [Google Scholar] [CrossRef] [PubMed]
- Van Soest Peter, J. Nutritional Ecology of the Ruminant; Cornell University Press: New York, NY, USA, 1994; ISBN 9780801427725. [Google Scholar]
- Wattiaux, M.A.; Karg, K.L. Protein Level for Alfalfa and Corn Silage-Based Diets: I. Lactational Response and Milk Urea Nitrogen. J. Dairy Sci. 2004, 87, 3480–3491. [Google Scholar] [CrossRef] [PubMed]
- Aguilar, M.; Hanigan, M. Using Milk Urea Nitrogen to Improve Nitrogen Efficiency and Reduce Environmental Impact of Dairy Cows. Available online: https://dairy-cattle.extension.org/using-milk-urea-nitrogen-to-improve-nitrogen-efficiency-and-reduce-environmental-impact-of-dairy-cows/ (accessed on 5 August 2022).
- Naderi, N.; Ghorbani, G.R.; Sadeghi-Sefidmazgi, A.; Nasrollahi, S.M.; Beauchemin, K.A. Shredded Beet Pulp Substituted for Corn Silage in Diets Fed to Dairy Cows under Ambient Heat Stress: Feed Intake, Total-Tract Digestibility, Plasma Metabolites, and Milk Production. J. Dairy Sci. 2016, 99, 8847–8857. [Google Scholar] [CrossRef] [PubMed]
- Weiss, W.P. Factors Affecting Manure Excretion by Dairy Cows 1. In Proceedings of the Cornell Nutrition Conference, Syracuse, NY, USA, 19 October 2004; Volume 1, pp. 11–20. [Google Scholar]
- Lee, C.; Hristov, A.N.; Dell, C.J.; Feyereisen, G.W.; Kaye, J.; Beegle, D. Effect of Dietary Protein Concentration on Ammonia and Greenhouse Gas Emitting Potential of Dairy Manure. J. Dairy Sci. 2012, 95, 1930–1941. [Google Scholar] [CrossRef]
Disclaimer/Publisher’s Note: The statements, opinions and data contained in all publications are solely those of the individual author(s) and contributor(s) and not of MDPI and/or the editor(s). MDPI and/or the editor(s) disclaim responsibility for any injury to people or property resulting from any ideas, methods, instructions or products referred to in the content. |
© 2025 by the authors. Licensee MDPI, Basel, Switzerland. This article is an open access article distributed under the terms and conditions of the Creative Commons Attribution (CC BY) license (https://creativecommons.org/licenses/by/4.0/).