

Multivariate Analyses of Soil Properties and CO2 Emissions Under Long-Term Fertilization and Crop Rotation in Luvic Chernozem

 , , and
Abstract
1. Introduction
2. Materials and Methods
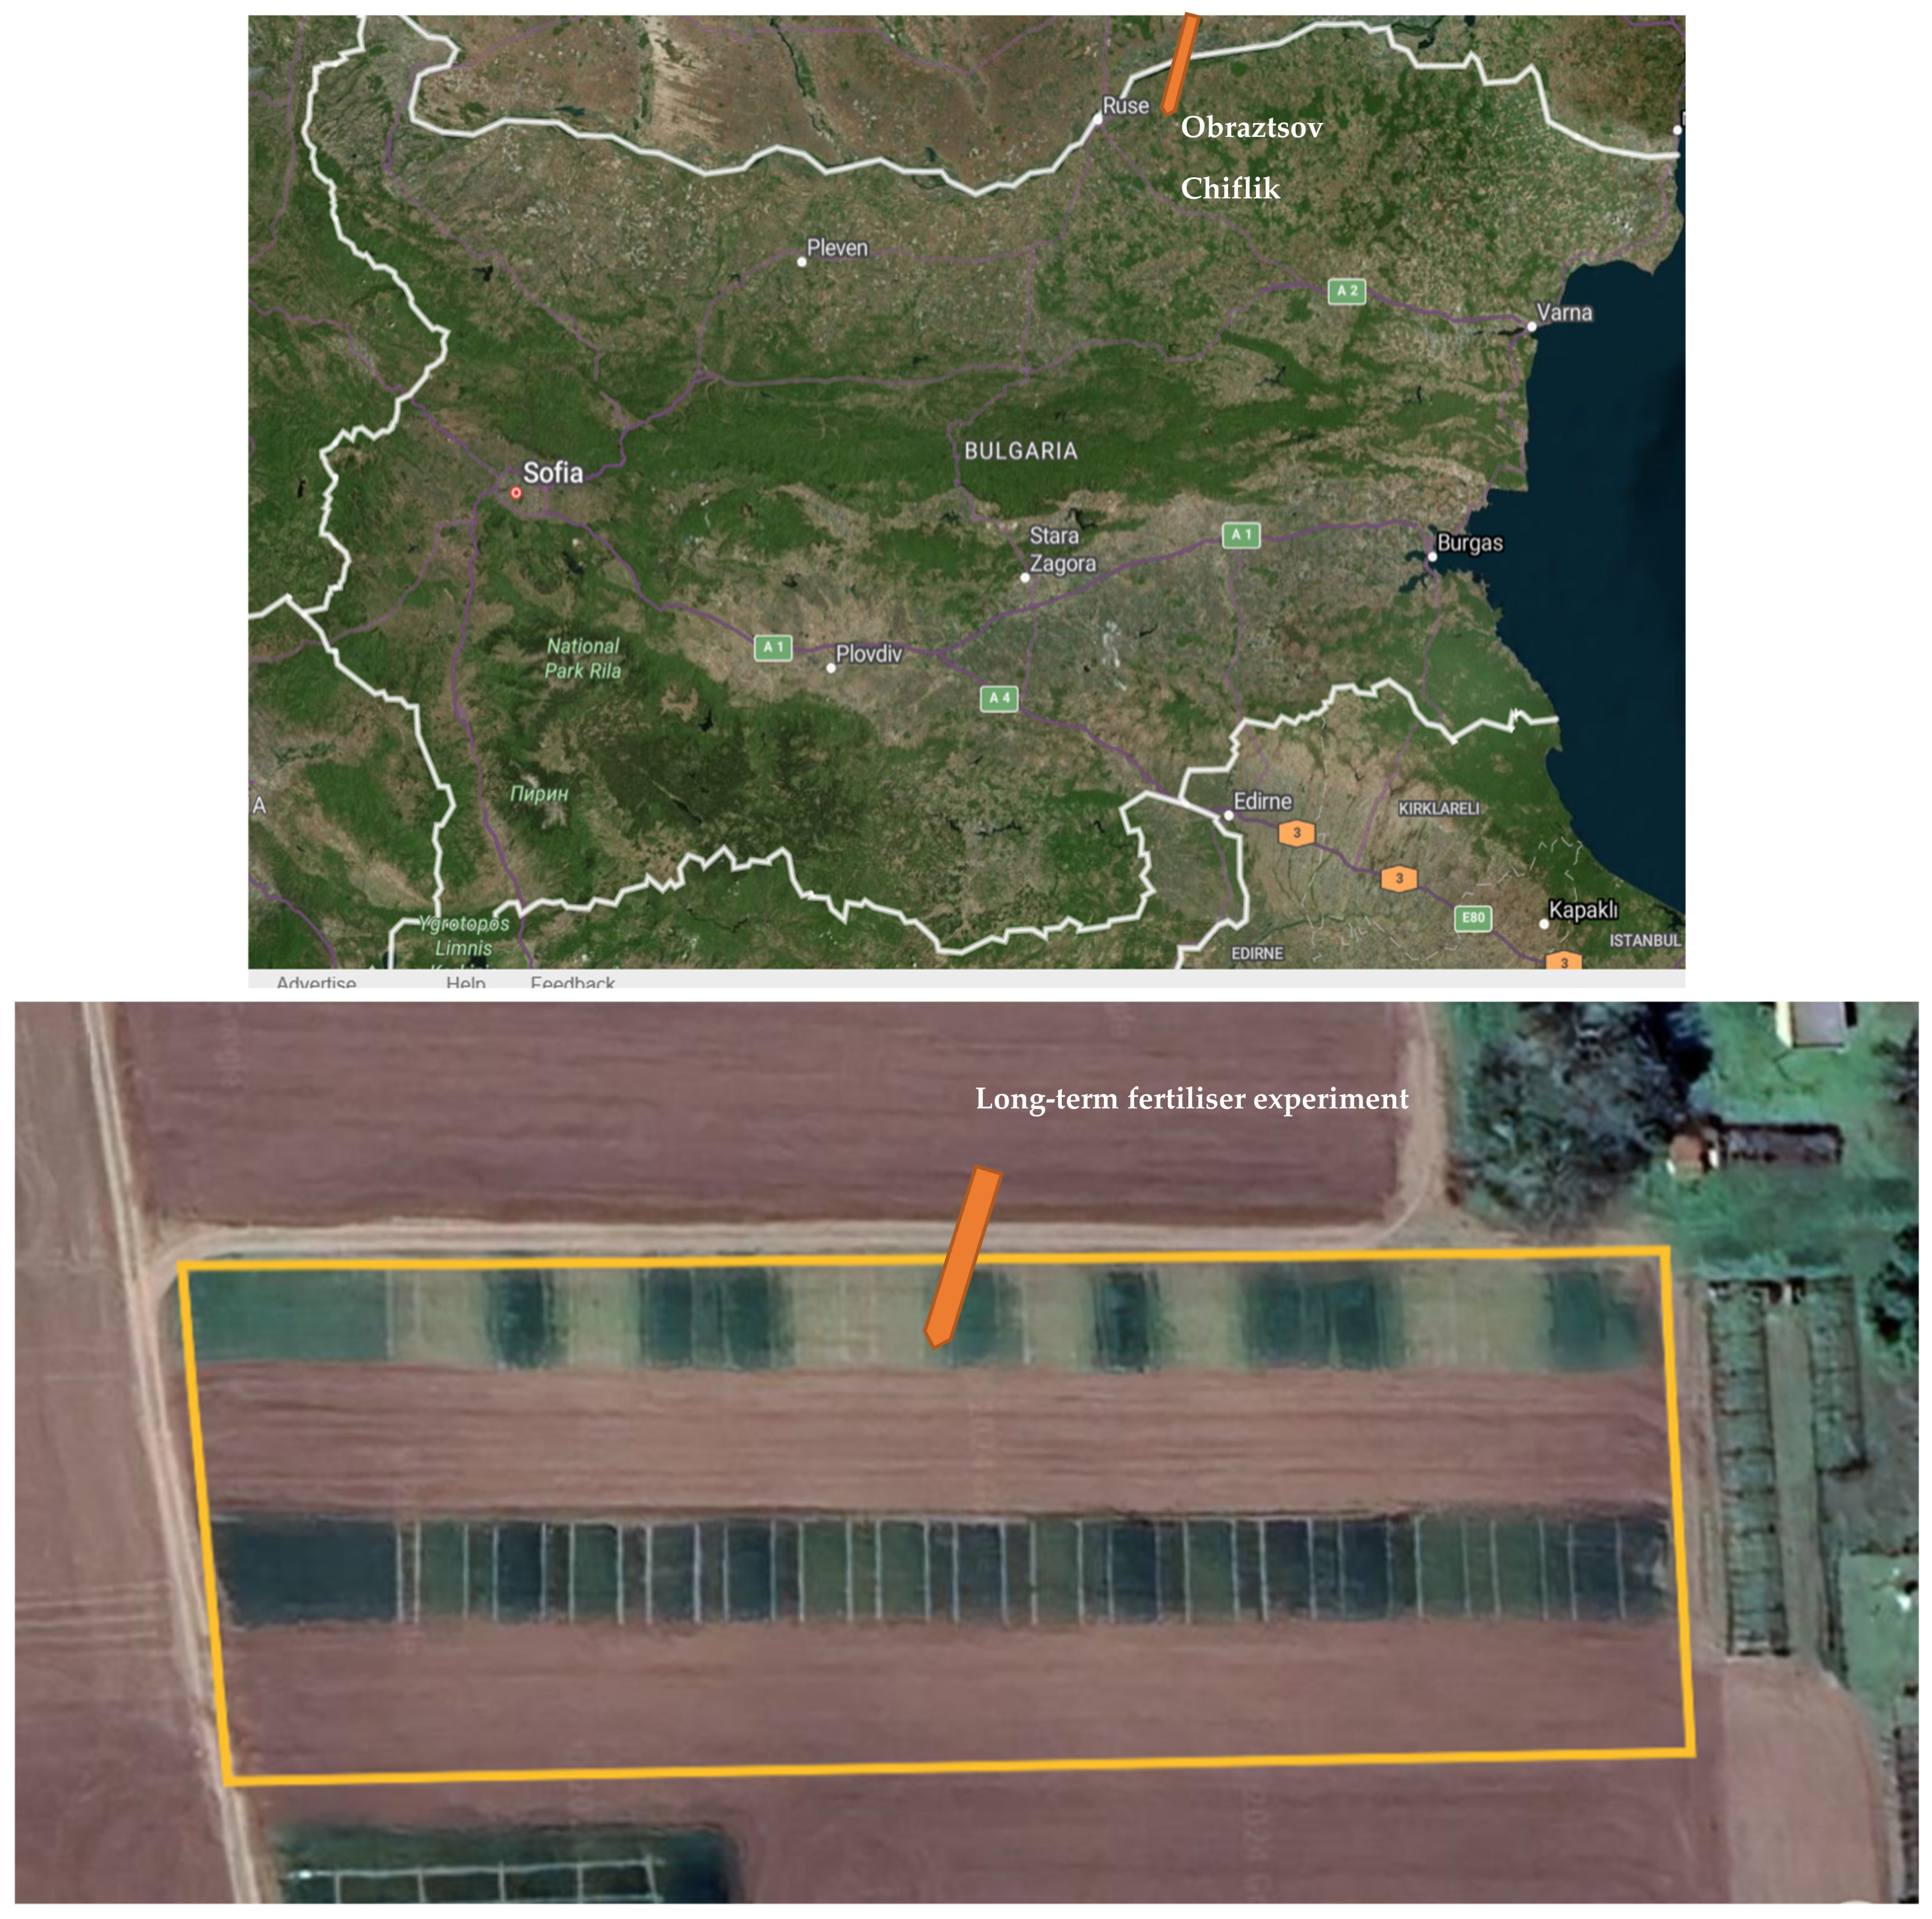
2.1. Site Description
2.2. Experiment Design
2.3. Chemical and Microbiological Analyses
2.4. Statistical Analyses
3. Results
3.1. Soil Chemical Properties and Organic Carbon Content
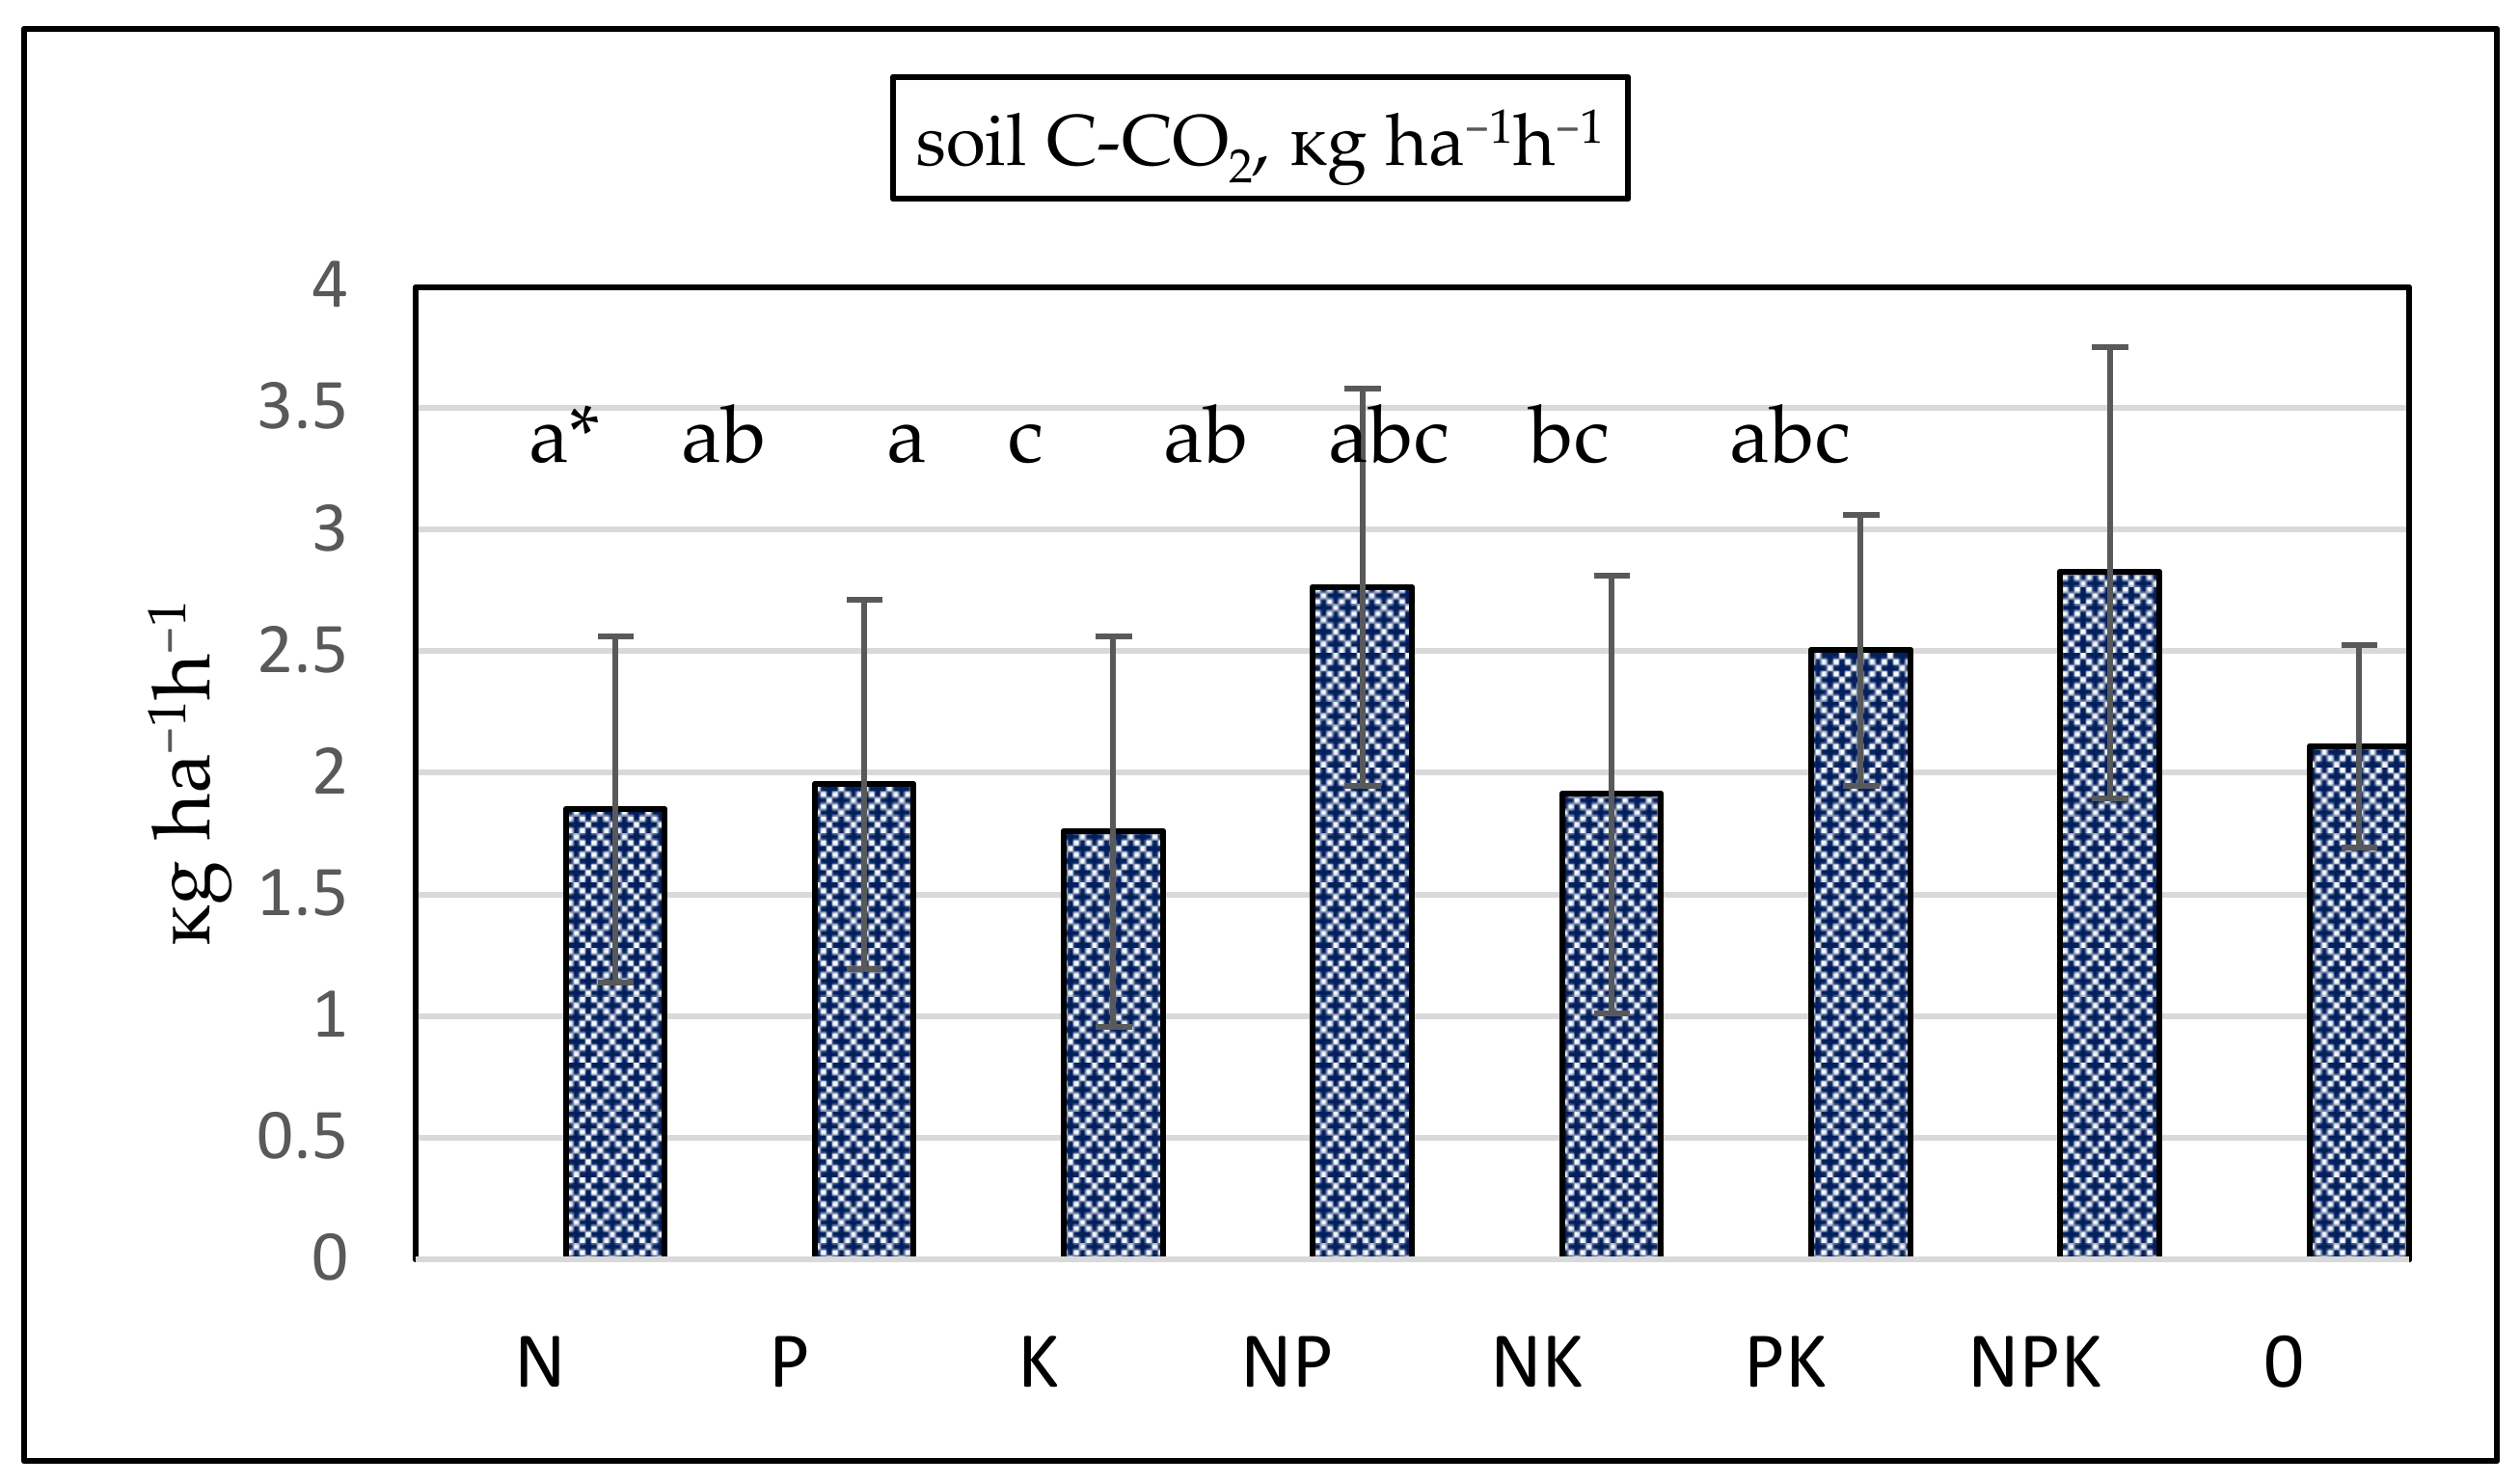
3.2. Effects of Mineral Fertilization on Soil CO2 Emissions
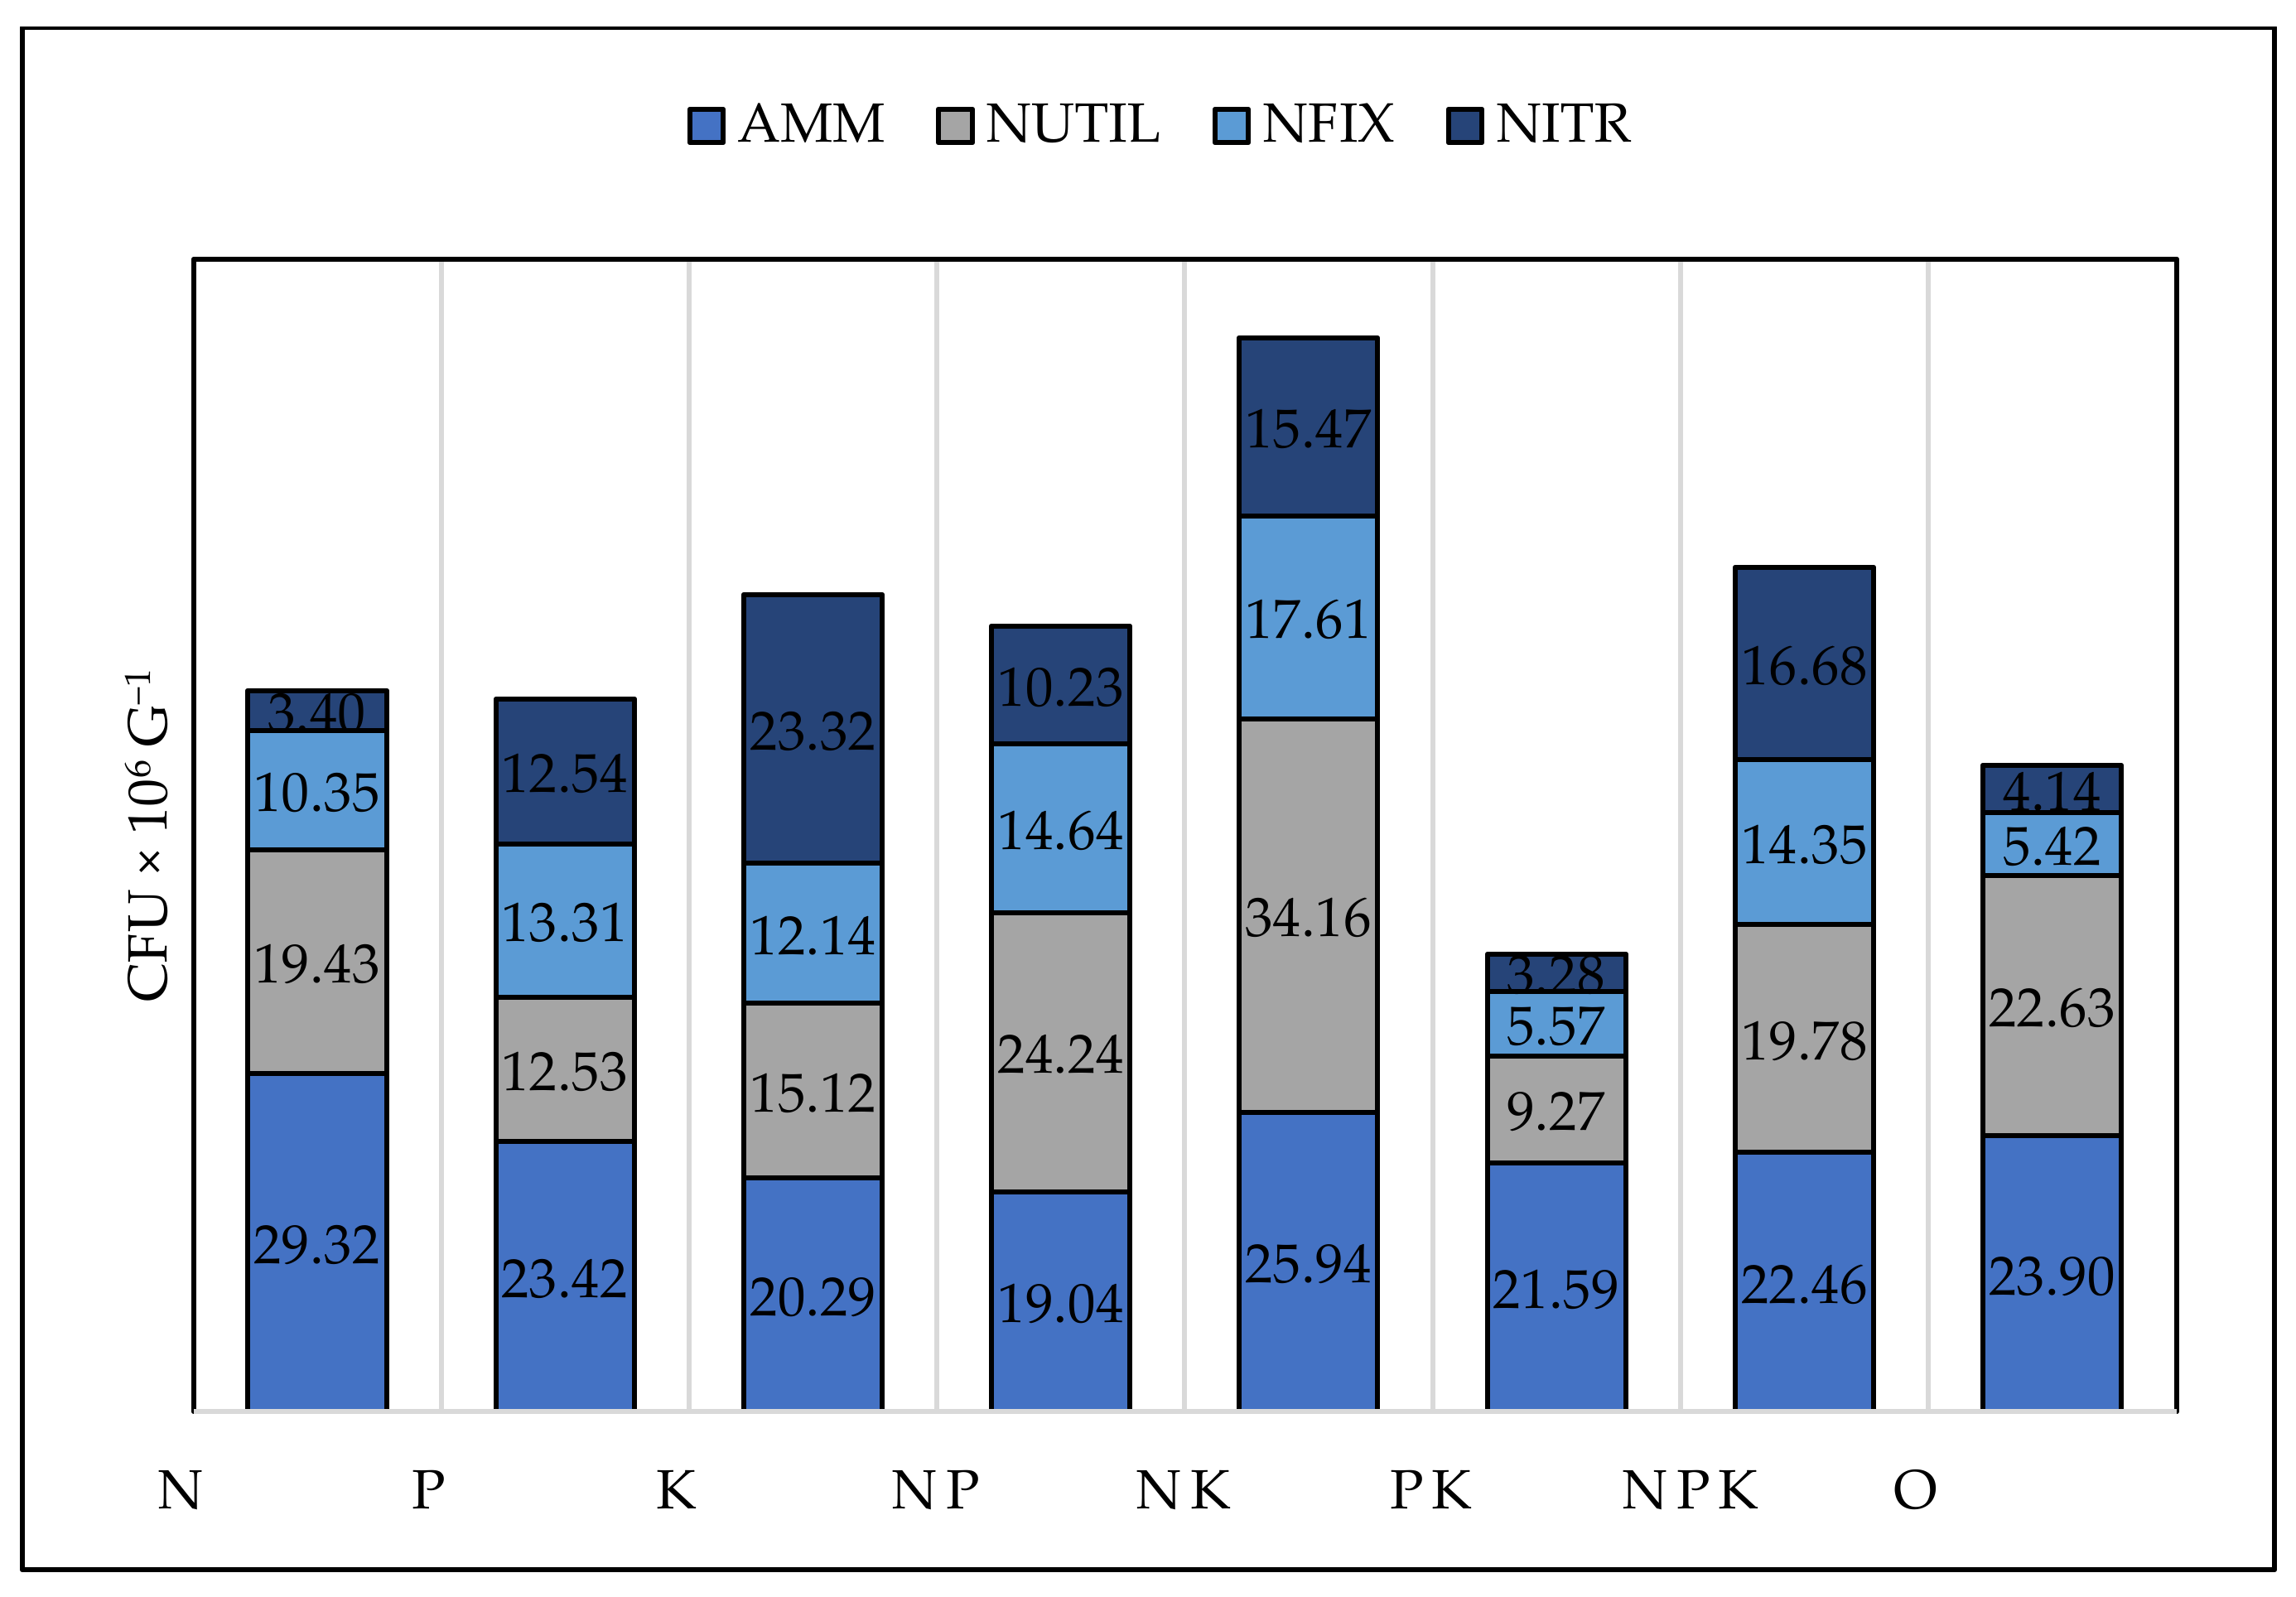
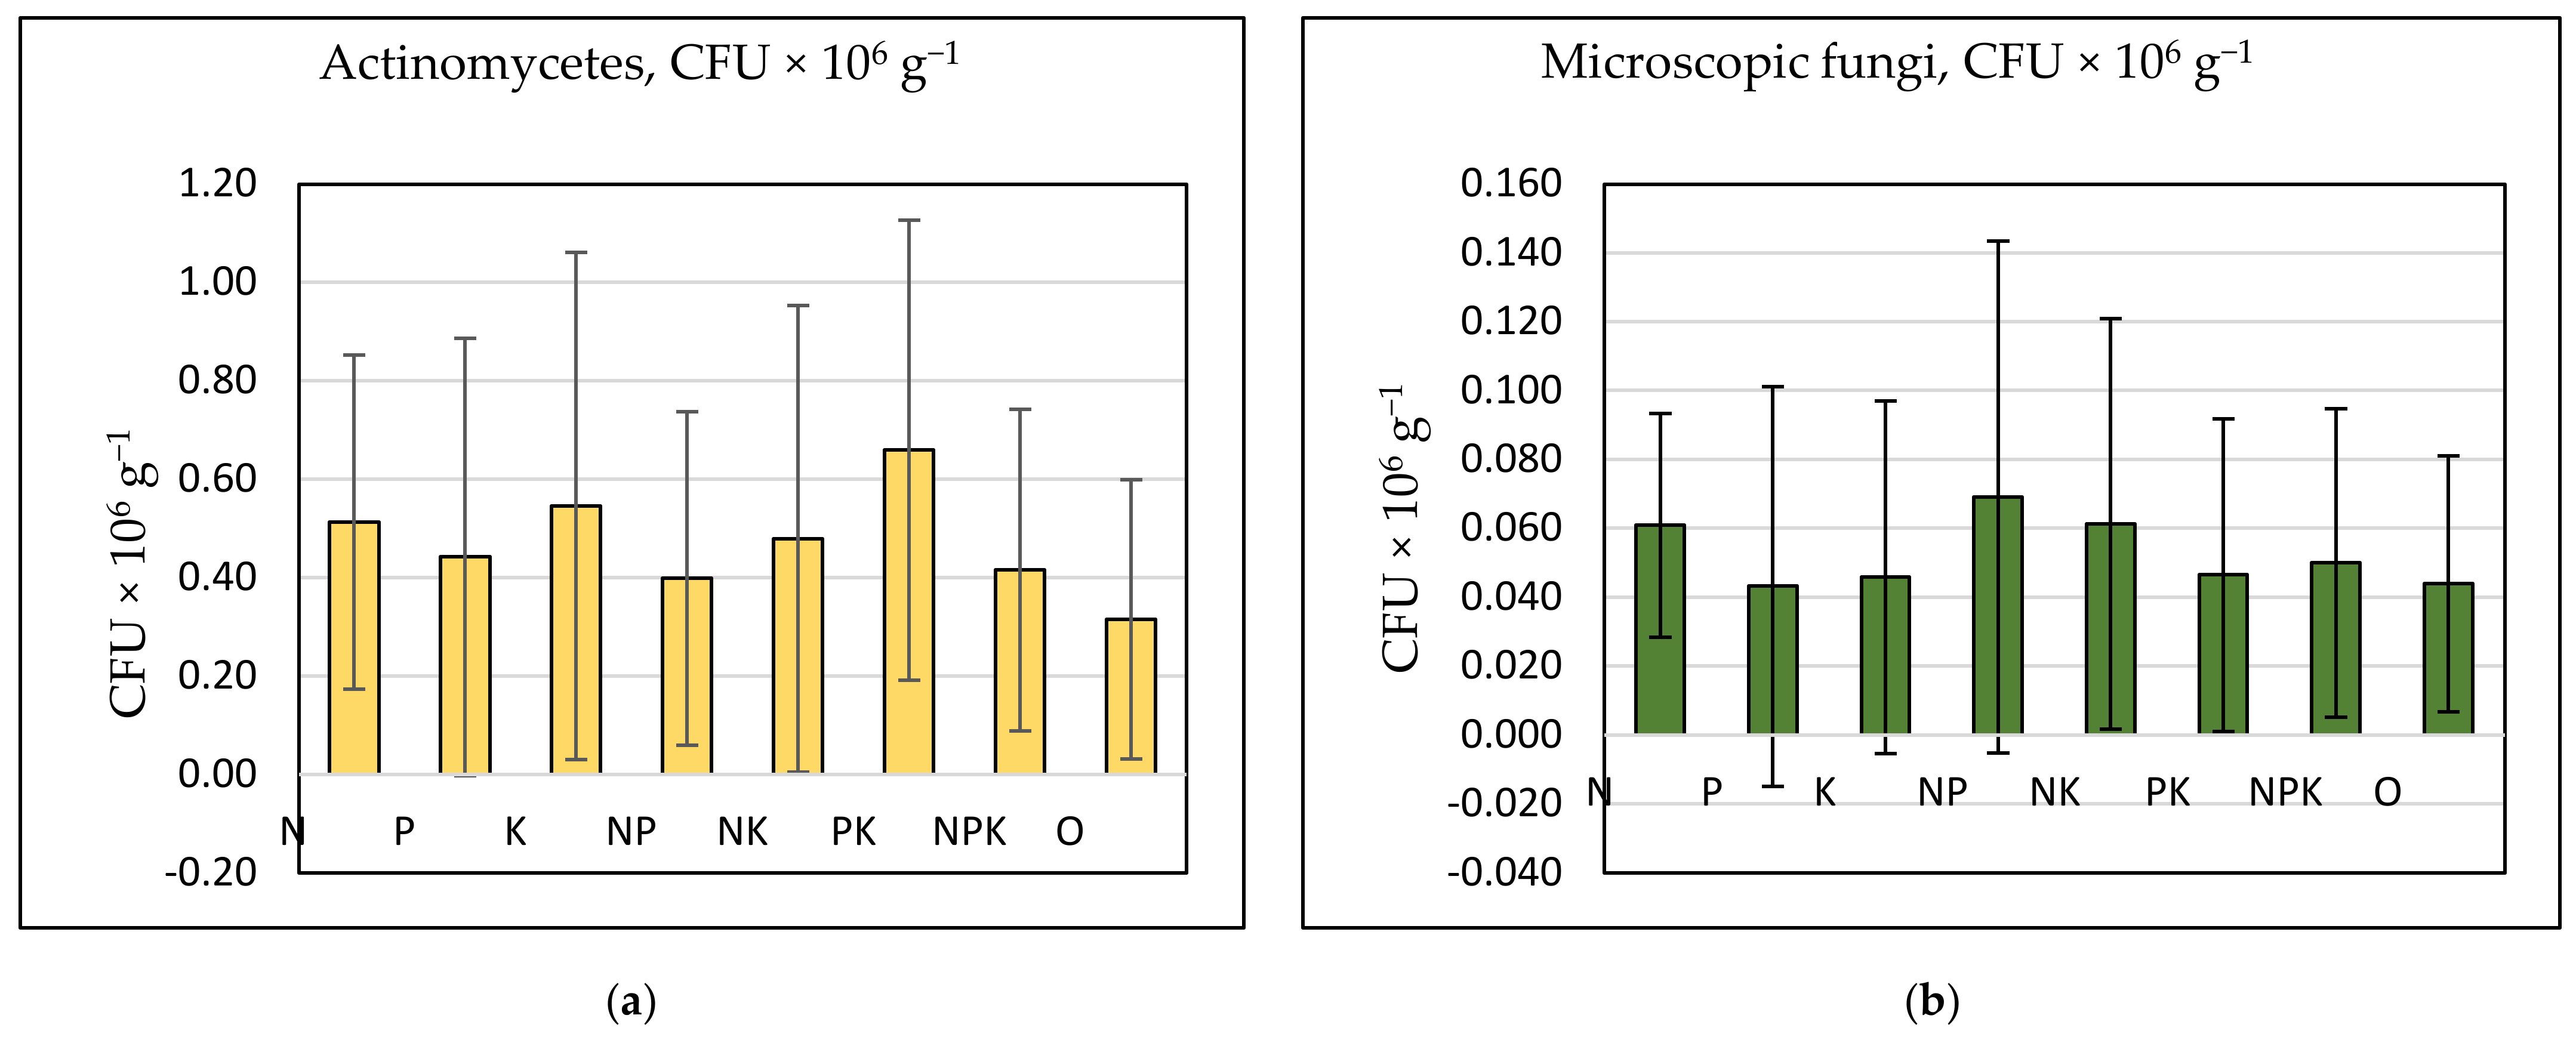
3.3. Effects of Long-Term Mineral Fertilization on Soil Microbiota
4. Discussion
5. Conclusions
Author Contributions
Funding
Data Availability Statement
Conflicts of Interest
References
- Francioli, D.; Schulz, E.; Lentendu, G.; Wubet, T.; Buscot, F.; Reitz, T. Mineral vs. organic amendments: Microbial community structure, activity and abundance of agriculturally relevant microbes are driven by long-term fertilization strategies. Front. Microbiol. 2016, 7, 1446. [Google Scholar] [CrossRef] [PubMed]
- Hu, X.J.; Liu, J.J.; Wei, D.; Zhu, P.; Cui, X.; Zhou, B.K.; Chen, X.; Jin, J.; Liu, V.; Wang, G. Effects of over 30-year of different fertilization regimes on fungal community compositions in the black soils of northeast China. Agric. Ecosyst. Environ. 2017, 248, 113–122. [Google Scholar] [CrossRef]
- Banerjee, S.; Walder, F.; Büchi, L.; Meyer, M.; Held, A.Y.; Gattinger, A.; Keller, T.; Charles, R.; van der Heijden, M.G.A. Agricultural intensification reduces microbial network complexity and the abundance of keystone taxa in roots. ISME J. 2019, 13, 1722–1736. [Google Scholar] [CrossRef]
- Šimanský, V.; Juriga, M.; Jonczak, J.; Uzarowicz, L.; Stapień, W. How relationships between soil organic carbon parameters and soil structure characteristics are affected by the long-term fertilization of a sandy soil. Geoderma 2019, 342, 75–84. [Google Scholar] [CrossRef]
- Ullah, S.; Ai, C.; Ding, W.; Jiang, R.; Zhao, S.; Zhang, J.; Zhou, W.; Hou, Y.; He, P. The response of soil fungal diversity and community composition to long-term fertilization. Appl. Soil Ecol. 2019, 140, 35–41. [Google Scholar] [CrossRef]
- Luo, P.; Han, X.; Wang, Y.; Han, M.; Shi, H.; Liu, N.; Bai, H. Influence of long-term fertilization on soil microbial biomass, dehydrogenase activity, and bacterial and fungal community structure in a brown soil of northeast China. Ann. Microbiol. 2015, 65, 533–542. [Google Scholar] [CrossRef]
- Šimanský, V.; Jonczak, J.; Horváthová, J.; Igaz, D.; Aydın, E.; Kováčik, P. Does long-term application of mineral fertilizers improve physical properties and nutrient regime of sandy soils? Soil Tillage Res. 2022, 215, 105224. [Google Scholar] [CrossRef]
- UNEP, United Nations Environmental Programme, Annual Evaluation Report. 2007. Available online: https://www.unep.org/resources/synthesis-reports/unep-annual-evaluation-report-2007 (accessed on 2 June 2008).
- Nasser, H.A.; Mahmoud, M.; Tolba, M.M.; Radwan, A.R.; Gabr, N.M.; ElShamy, A.A.; Yehya, M.S.; Ziemke, A.; Hashem, M.Y. Pros and cons of using green biotechnology to solve food insecurity and achieve sustainable development goals. Euro-Mediterr. J. Environ. Integr. 2021, 6, 29. [Google Scholar] [CrossRef]
- Patrick, M.; Tenywa, J.S.; Ebanyat, P.; Tenywa, M.M.; Mubiru, D.N.; Basamba, T.A.; Leip, A. Soil organic carbon thresholds and nitrogen management in tropical agroecosystems: Concepts and prospects. J. Sust. Dev. 2013, 6, 31–43. [Google Scholar] [CrossRef]
- Galloway, J.N.; Townsend, A.R.; Erisman, J.W.; Bekunda, M.; Cai, Z.; Freney, J.R.; Martinelli, L.A.; Seitzinger, S.P.; Sutton, M.A. Transformation of the nitrogen cycle: Recent trends, questions and potential solutions. Science 2008, 320, 889–892. [Google Scholar] [CrossRef]
- Wang, X.; Song, L. Advances in the Study of NO3—Immobilization by Mic robes in Agricultural Soils. Nitrogen 2024, 5, 927–940. [Google Scholar] [CrossRef]
- Braos, L.B.; Carlos, R.S.; Bettiol, A.C.T.; Bergamasco, M.A.M.; Terçariol, M.C.; Ferreira, M.E.; da Cruz, M.C.P. Soil Carbon and Nitrogen Forms and Their Relationship with Nitrogen Availability Affected by Cover Crop Species and Nitrogen Fertilizer Doses. Nitrogen 2023, 4, 85–101. [Google Scholar] [CrossRef]
- Kong, D.; Liu, N.; Ren, C.; Li, H.; Wang, W.; Li, N.; Ren, G.; Feng, Y.; Yang, G. Effect of Nitrogen Fertilizer on Soil CO2 Emission Depends on Crop Rotation Strategy. Sustainability 2020, 12, 5271. [Google Scholar] [CrossRef]
- Jesmin, T.; Mitchell, D.T.; Mulvaney, R.L. Short-Term Effect of Nitrogen Fertilization on Carbon Mineralization during Corn Residue Decomposition in Soil. Nitrogen 2021, 2, 444–460. [Google Scholar] [CrossRef]
- Zang, H.D.; Blagodatskaya, E.; Wang, J.Y.; Xu, X.L.; Kuzyakov, Y. Nitrogen fertilization increases rhizodeposit incorporation into microbial biomass and reduces soil organic matter losses. Biol. Fertil. Soils 2017, 53, 419–429. [Google Scholar] [CrossRef]
- Zhang, X.Q.; Pu, C.; Zhao, X.; Xue, J.F.; Zhang, R.; Nie, Z.J.; Chen, F.; Lal, R.; Zhang, H.L. Tillage effects on carbon footprint and ecosystem services of climate regulation in a winter wheat–summer maize cropping system of the North China Plain. Ecol. Indicat. 2016, 67, 821–829. [Google Scholar] [CrossRef]
- Paustian, K.; Larson, E.; Kent, J.; Marx, E.; Swan, A. Soil C sequestration as a biological negative emission strategy. Front. Clim. 2019, 1, 8. [Google Scholar] [CrossRef]
- Bradford, M.A.C.; Carey, J.; Atwood, L.; Bossio, D.; Fenichel, E.P.; Gennet, S.; Fargione, J.; Fisher, J.R.B.; Fuller, E.; Kane, D.A.; et al. Soil carbon science for policy and practice. Nat. Sustain. 2019, 2, 1070–1072. [Google Scholar] [CrossRef]
- Çakmakçı, R.; Salık, M.A.; Çakmakçı, S. Assessment and Principles of Environmentally Sustainable Food and Agriculture Systems. Agriculture 2023, 13, 1073. [Google Scholar] [CrossRef]
- Mattila, V.; Dwivedi, P.; Gauri, P.; Ahbab, M. Blockchain for Environmentally Sustainable Economies: Case Study of 5irechain. Int. J. Soc. Sci. Manag. Rev. 2022, 5, 50–62. [Google Scholar] [CrossRef]
- Smith, P.; Soussana, J.F.; Angers, D.; Schipper, L.; Chenu, C.; Rasse, D.P.; Batjes, N.H.; van Egmond, F.; McNeill, S.; Kuhnert, M.; et al. How to measure, report and verify soil carbon change to realise the potential of soil carbon sequestration for atmospheric greenhouse gas removal. Glob. Change Biol. 2019, 26, 219–241. [Google Scholar] [CrossRef] [PubMed]
- Druckman, A.; Jackson, T. The carbon footprint of UK households 1990–2004: A socio-economically disaggregated, quasi-multi-regional input–output model. Ecol. Econ. 2009, 68, 2066–2077. [Google Scholar] [CrossRef]
- Cheng, K.; Pan, G.; Smith, P.; Luo, T.; Li, L.; Zheng, J.; Zhang, X.; Han, X.; Yan, M. Carbon footprint of China’s crop production—An estimation using agro-statistics data over 1993–2007. Agric. Ecosyst. Environ. 2011, 142, 231–237. [Google Scholar] [CrossRef]
- Pathak, H. Impact, adaptation, and mitigation of climate change in Indian agriculture. Environ. Monit. Assess. 2023, 195, 52. [Google Scholar] [CrossRef]
- Bhattacharyya, S.S.; Ros, G.H.; Furtak, K.; Iqbal, H.M.N.; Parra-Saldívar, R. Soil carbon sequestration—An interplay between soil microbial community and soil organic matter dynamics. Sci. Total Environ. 2022, 815, 152928. [Google Scholar] [CrossRef]
- Hu, M.; Zhou, S.; Xiong, X.; Wang, X.; Sun, Y.; Meng, Z.; Hui, D.; Li, J.; Zhang, D.; Deng, Q. Dynamics of soil microbial communities involved in carbon cycling along three successional forests in southern China. Front. Microbiol. 2024, 14, 1326057. [Google Scholar] [CrossRef]
- Mahal, N.K.; Osterholz, W.R.; Miguez, F.E.; Poffenbarger, H.J.; Sawyer, J.E.; Olk, D.C.; Archontoulis, S.V.; Castellano, M.J. Nitrogen Fertilizer Suppresses Mineralization of Soil Organic carbon in Maize Agroecosystems. Front. Ecol. Evol. 2019, 7, 59. [Google Scholar] [CrossRef]
- Pan, H.; Chen, M.M.; Feng, H.J.; Wei, M.; Song, F.P.; Lou, Y.H.; Cui, X.; Wang, H.; Zhuge, Y. Organic and inorganic fertilizers respectively drive bacterial and fungal community compositions in a fluvo-aquic soil in northern China. Soil Till. Res. 2020, 198, 104540. [Google Scholar] [CrossRef]
- Wei, X.; Xie, B.; Wan, C.; Song, R.; Zhong, W.; Xin, S.; Song, K. Enhancing Soil Health and Plant Growth through Microbial Fertilizers: Mechanisms, Benefits, and Sustainable Agricultural Practices. Agronomy 2024, 14, 609. [Google Scholar] [CrossRef]
- Zhang, Y.; Li, P.; Liu, X.J.; Xiao, L.; Shi, P.; Zhao, B.H. Effects of farmland conversion on the stoichiometry of carbon, nitrogen, and phosphorus in soil aggregates on the Loess Plateau of China. Geoderma 2019, 351, 188–196. [Google Scholar] [CrossRef]
- Filcheva, E.; Tsadilas, C. Influence of cliniptilolite and compost on soil properties. Commun. Soil Sci Plan. 2002, 33, 595–607. [Google Scholar] [CrossRef]
- IUSS Working Group WRB. World Reference Base for Soil Resources. International Soil Classification System for Naming Soils and Creating Legends for Soil Maps, 4th ed.International Union of Soil Sciences (IUSS): Vienna, Austria, 2022. [Google Scholar]
- Hoper, H. Substrate-induced respiration. In Microbiological Methods for Assessing Soil Quality, 1st ed.; Bloem, J., Hopkins, D.W., Benedetti, A., Eds.; CABI Publishing: Wallingford, UK, 2008; Chapter 6.3; Available online: https://www.cabi.org/bookshop/book/9780851990989/ (accessed on 1 October 2008).
- Grudeva, V.; Moncheva, P.; Nedeva, S.; Gocheva, B.; Antonova-Nedeva, S.; Naumova, S. Handbook of Microbiology; University edition SU “St. Kl. Ohridski”: Sofia, Bulgaria, 2007. [Google Scholar]
- Bilandžija, D.; Zgorelec, Ž.; Kisić, I. Influence of Tillage Practices and Crop Type on Soil CO2 Emissions. Sustainability 2016, 8, 90. [Google Scholar] [CrossRef]
- Robertson, G.P.; Bruulsema, T.W.; Gehl, R.J.; Kanter, D.; Mauzerall, D.L.; Rotz, C.A. Nitrogen–climate interactions in US agriculture. Biogeochemistry 2013, 114, 41–70. [Google Scholar] [CrossRef]
- Mulvaney, R.L.; Khan, S.A.; Ellsworth, T.R. Synthetic nitrogen fertilizers deplete soil nitrogen: A global dilemma for sustainable cereal production. J. Environ. Qual. 2009, 38, 2295–2314. [Google Scholar] [CrossRef]
- Russell, A.E.; Cambardella, C.A.; Laird, D.A.; Jaynes, D.B.; Meek, D.W. Nitrogen fertilizer effects on soil carbon balances in Midwestern US agricultural systems. Ecol. Appl. 2009, 19, 1102–1113. [Google Scholar] [CrossRef]
- Poffenbarger, H.J.; Barker, D.W.; Helmers, M.J.; Miguez, F.E.; Olk, D.C.; Sawyer, J.E. Maximum soil organic carbon storage in Midwest US cropping systems when crops are optimally nitrogen-fertilized. PLoS ONE 2017, 12, e0172293. [Google Scholar] [CrossRef]
- Zhao, H.; Sun, B.; Lu, F.; Wang, X.; Zhuang, T.; Zhang, G.; Ouyang, X. Roles of nitrogen, phosphorus, and potassium fertilizers in carbon sequestration in a Chinese agricultural ecosystem. Clim. Change 2017, 142, 587–596. [Google Scholar] [CrossRef]
- Li, W.; Gan, X.; Jiang, Y.; Cao, F.; Lü, X.T.; Ceulemans, T.; Zhao, C. Nitrogen effects on grassland biomass production and biodiversity are stronger than those of phosphorus. Environ. Pollut. 2022, 309, 119720. [Google Scholar] [CrossRef]
- Liu, Y.; Li, C.; Cai, G.; Sauheitl, L.; Xiao, M.; Shibistova, O.; Ge, T.; Guggenberger, G. Meta-analysis on the effects of types and levels of N, P, and K fertilization on organic carbon in cropland soils. Geoderma 2023, 437, 116580. [Google Scholar] [CrossRef]
- Li, X.; Liu, X.; Liu, X. Long term fertilization effects on crop yield and desalinized soil properties. Agron. J. 2020, 112, 4321–4331. [Google Scholar] [CrossRef]
- Ghosh, A.; Bhattacharyya, R.; Meena, M.C.; Dwivedi, B.S.; Singh, G.; Agnihotri, R.; Sharma, C. Long-term fertilization effects on soil organic carbon sequestration in an Inceptisol. Soil Tillage Res. 2018, 177, 134–144. [Google Scholar] [CrossRef]
- Xiang, Y.; Cheng, M.; Wen, Y.; Darboux, F. Soil Organic Carbon Sequestration under Long-Term Chemical and Manure Fertilization in a Cinnamon Soil, Northern China. Sustainability 2022, 14, 5109. [Google Scholar] [CrossRef]
- Li, J.; Shen, F.Y.; Liu, Y.; Yang, Y.C.; Wang, J.; Purahong, W.; Yang, L. Contrasting altitudinal patterns and co-occurrence networks of soil bacterial and fungal communities along soil depths in the cold-temperate montane forests of China. Catena 2022, 209, 105844. [Google Scholar] [CrossRef]
- Liang, C.; Kästner, M.; Rainer Georg, J. Microbial necromass on the rise: The growing focus on its role in soil organic carbon development. Soil Biol. Biochem. 2020, 150, 108000. [Google Scholar] [CrossRef]
- Qiu, L.; Zhang, Q.; Zhu, H.; Reich, B.; Banerjee, S.; van der Heijden, M.G.A.; Sadowsky, M.J.; Ishii, S.; Jia, X.; Shao, M.; et al. Erosion reduces soil microbial diversity, network complexity and multifunctionality. ISME J. 2021, 15, 2474–2489. [Google Scholar] [CrossRef]
- Zhou, J.; Jiang, X.; Zhou, B.; Zhao, B.S.; Ma, M.C.; Guan, D.W.; Li, J.; Chen, S.; Cao, F.; Shen, D.; et al. Thirty-four years of nitrogen fertilization decreases fungal diversity and alters fungal community composition in black soil in northeast China. Soil Biol. Biochem. 2016, 95, 135–143. [Google Scholar] [CrossRef]
- Zhang, S.; Li, X.; Chen, K.; Shi, J.; Wang, Y.; Luo, P.; Yang, J.; Wang, Y.; Han, X. Long-term fertilization altered microbial community structure in an aeolian sandy soil in northeast China. Front. Microbiol. 2022, 13, 979759. [Google Scholar] [CrossRef] [PubMed]
- Yan, W.; Zhong, Y.; Liu, W.; Shangguan, Z. Asymmetric response of ecosystem carbon components and soil water consumption to nitrogen fertilization in farmland. Agric. Ecosyst. Environ. 2021, 305, 107166. [Google Scholar] [CrossRef]
- Wang, J.; Xie, J.; Li, L.; Effah, Z.; Xie, L.; Luo, Z.; Zhou, Y.; Jiang, Y. Fertilization treatments affect soil CO2 emission through regulating soil bacterial community composition in the semiarid Loess Plateau. Sci. Rep. 2022, 12, 20123. [Google Scholar] [CrossRef]
- Zhai, L.; Liu, H.; Zhang, J.; Huang, J.; Wang, B. Long-Term Application of Organic Manure and Mineral Fertilizer on N2O and CO2 Emissions in a Red Soil from Cultivated Maize-Wheat Rotation in China. Agric. Sci. China 2011, 10, 1748–1757. [Google Scholar] [CrossRef]
- Saeed, Q.; Zhang, A.; Mustafa, A.; Sun, B.; Zhang, S.; Yang, X. Effect of long-term fertilization on greenhouse gas emissions and carbon footprints in northwest China: A field scale investigation using wheat-maize-fallow rotation cycles. J. Clean. Prod. 2022, 332, 130075. [Google Scholar] [CrossRef]


| Soil Depth | Fractions According to FAO (2006), % | USDA | Texture Class | ||
|---|---|---|---|---|---|
| cm | Sand 2–0.063 mm | Silt 0.063–0.002 mm | Clay <0.002 mm | Sand 2–0.05 mm | |
| 0–5 | 5.7 | 65.5 | 28.8 | 8.1 | SiCL |
| 10–15 | 4.0 | 65.6 | 30.3 | 7.5 | SiCL |
| 15–20 | 4.4 | 65.1 | 304 | 7.5 | SiCL |
| Experiment Parameters | |
|---|---|
| Rotation | maize –> wheat –> beans –> barley |
| Variants | N, P, K, NP, NK, PK, NPK, O |
| Rates of fertilizers | Beans—N—50 kg ha−1, P—120 kg ha−1, K—70 kg ha−1 |
| Maize—N—150 kg ha−1, P—120 kg ha−1, K—70 kg ha−1 | |
| Wheat—N—150 kg ha−1, P—120 kg ha−1, K—70 kg ha−1 | |
| Barley—N—100 kg ha−1, P—120 kg ha−1, K—70 kg ha−1 | |
| Replications | 2 replicates, not randomized |
| Treatment | N (N-NO3, N-NH4) | P2O5 | K2O | EC | pH | SOC | TN | C/N |
|---|---|---|---|---|---|---|---|---|
| N | 121.74 d* | 15.97 a | 27.13 a | 90.43 c | 5.44 ab | 1.22 bc | 0.119 de | 10.25 d |
| P | 28.88 ab | 35.21 c | 34.09 b | 29.13 a | 5.90 d | 1.34 cd | 0.110 bc | 12.34 c |
| K | 28.81 ab | 21.02 ab | 42.10 c | 29.92 ab | 5.89 cd | 1.24 bc | 0.108 b | 11.54 bc |
| NP | 83.00 bcd | 27.58 bc | 29.74 ab | 46.79 ab | 5.44 ab | 1.43 d | 0.127 ef | 11.35 e |
| NK | 90.06 cd | 16.39 a | 43.95 c | 56.39 abc | 5.30 a | 1.25 bc | 0.128 f | 9.87 e |
| PK | 36.74 abc | 31.83 c | 46.17 c | 39.01 ab | 5.66 bc | 1.18 ab | 0.104 b | 11.40 b |
| NPK | 121.29 d | 37.53 c | 45.83 c | 70.54 bc | 5.42 a | 1.42 d | 0.116 cd | 12.19 d |
| 0 | 21.92 a | 17.11 a | 31.23 ab | 25.10 a | 5.82 cd | 1.05 a | 0.090 a | 11.63 a |
| ANOVA factors | Significance, p | |||||||
| Treament | 0.000 | 0.000 | 0.000 | 0.025 | 0.000 | 0.000 | 0.000 | 0.021 |
| Season | NS | NS | NS | 0.009 | 0.000 | NS | NS | NS |
| Crop | 0.001 | 0.000 | 0.095 | 0.021 | 0.001 | NS | NS | NS |
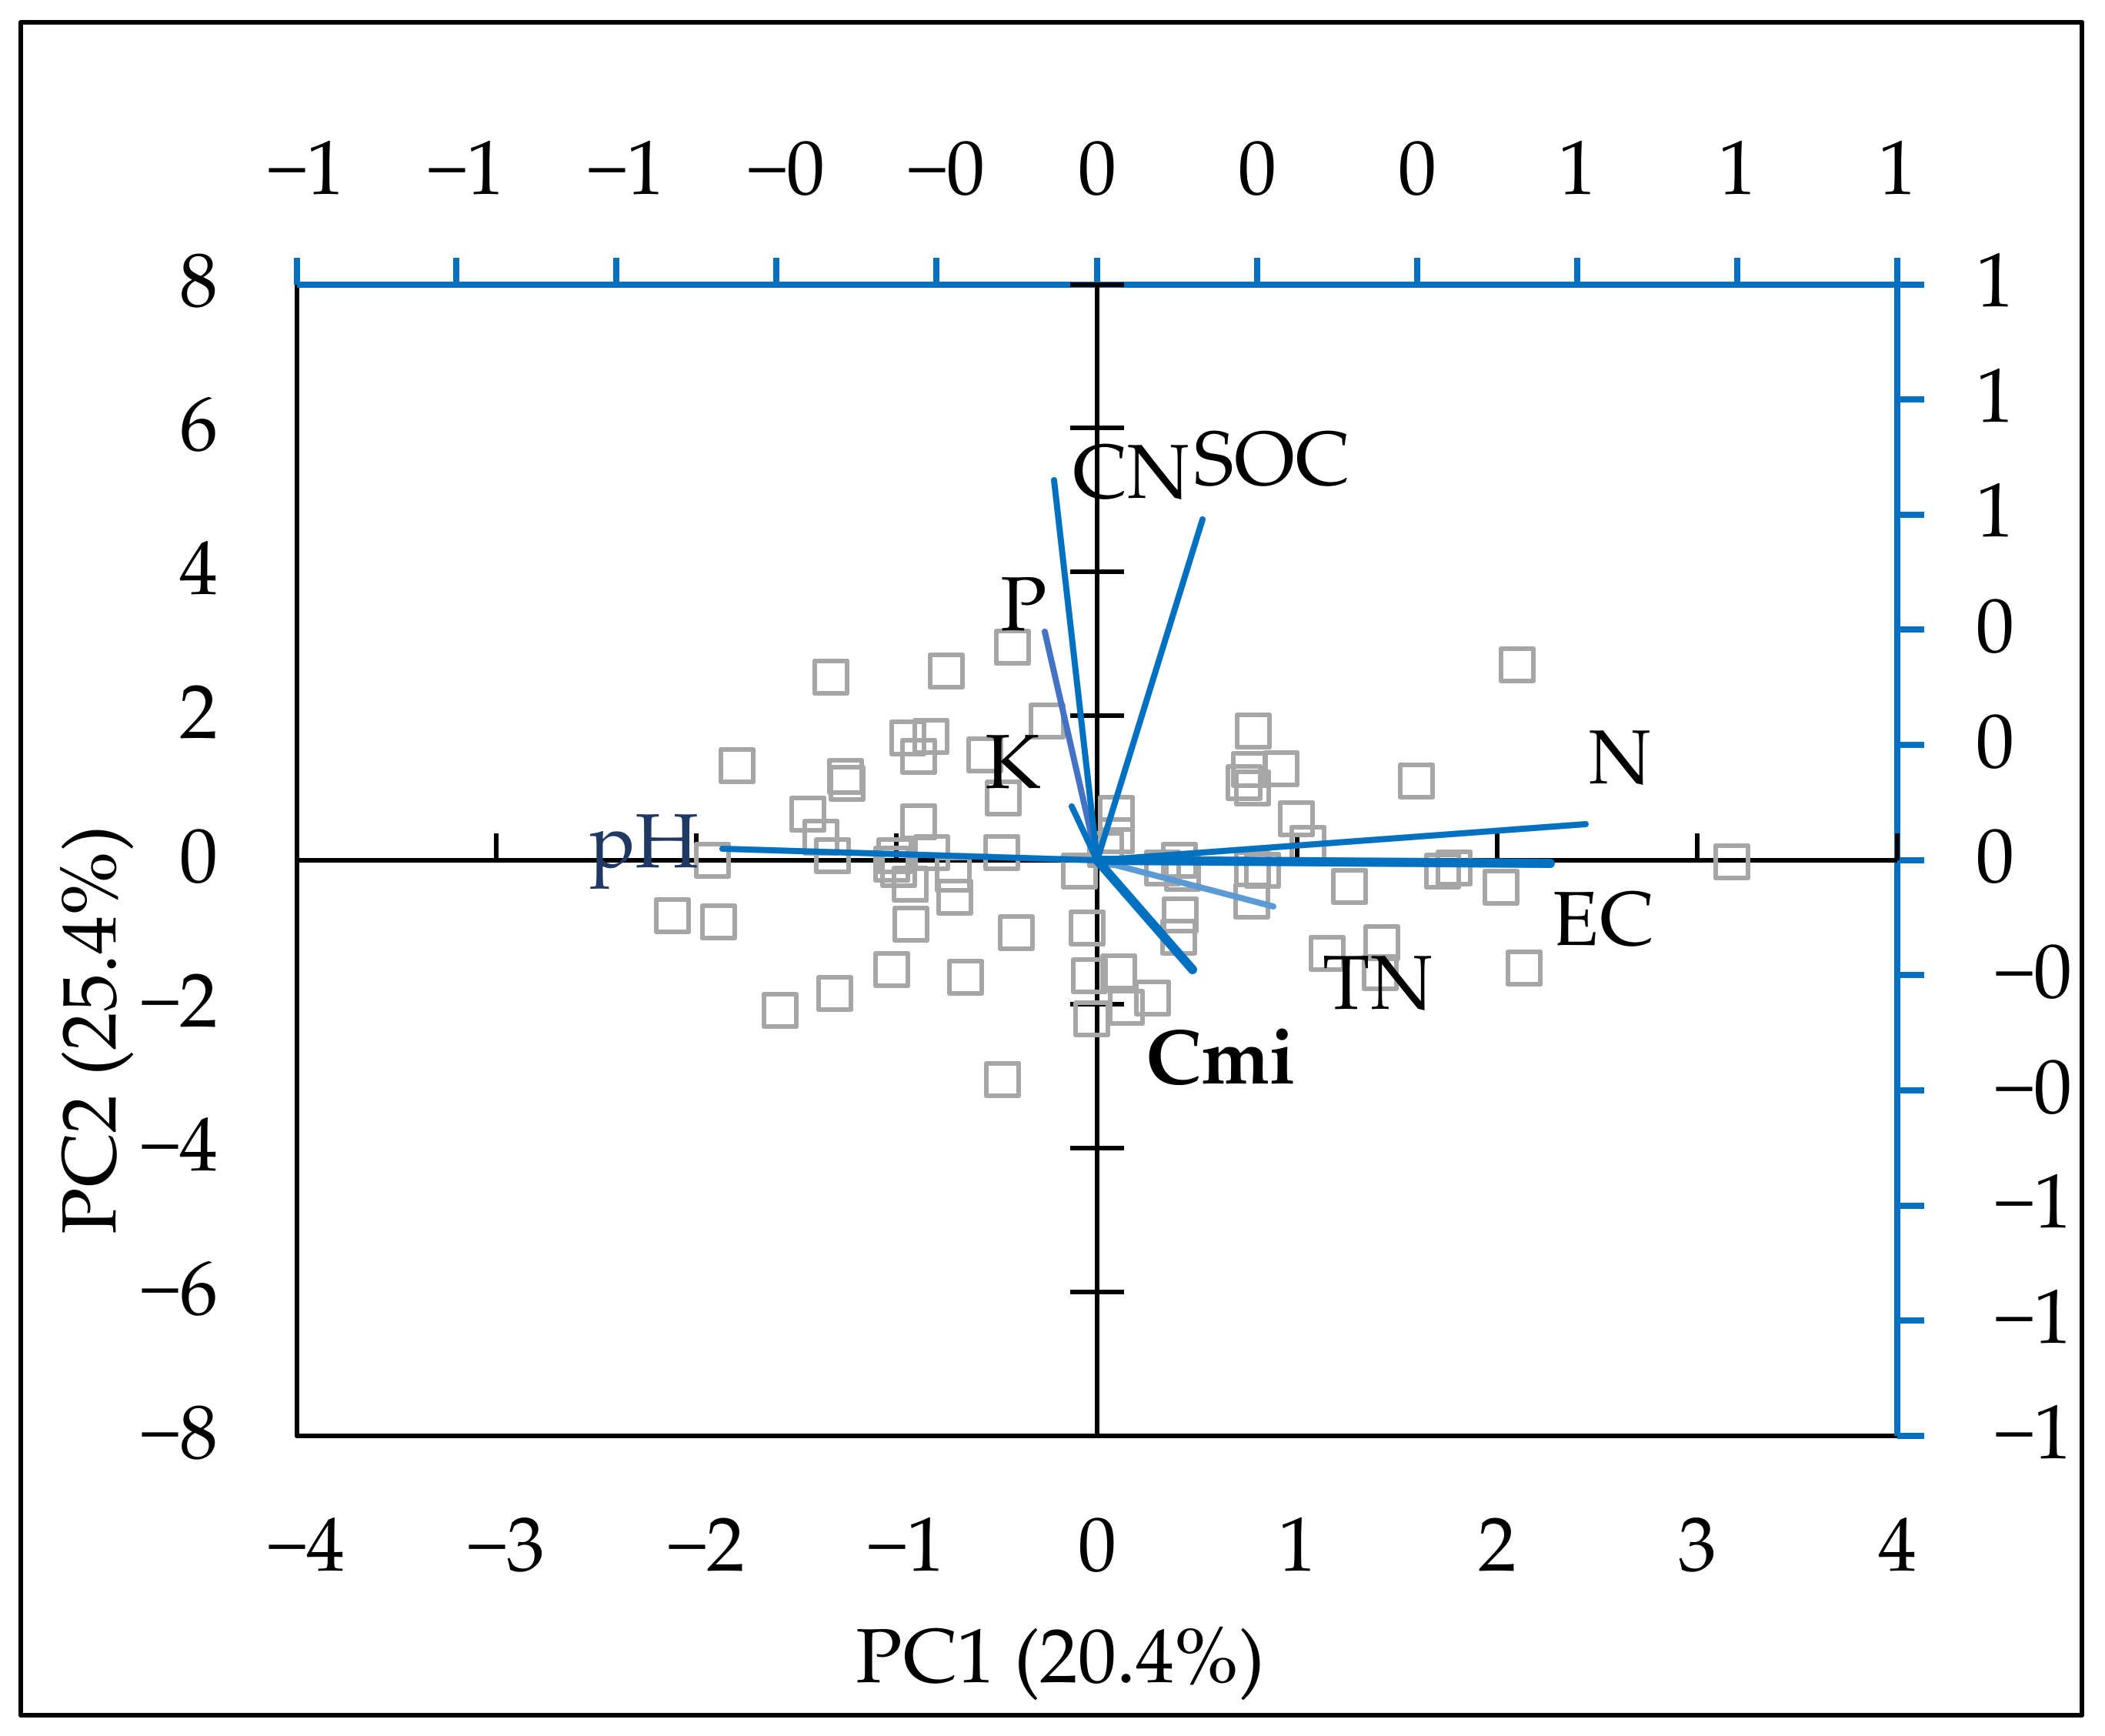
| Component 1 | Component 2 | |
|---|---|---|
| Eigenvalue | 2.28 | 1.83 |
| Percent of variance | 25.36 | 20.39 |
| N | 0.610 | 0.063 |
| P | −0.065 | 0.400 |
| K | −0.032 | 0.093 |
| TN | 0.221 | −0.080 |
| C/N | −0.054 | 0.661 |
| pH | −0.468 | 0.019 |
| EC | 0.566 | −0.005 |
| SOC | 0.132 | 0.592 |
| Cmic | 0.119 | −0.190 |
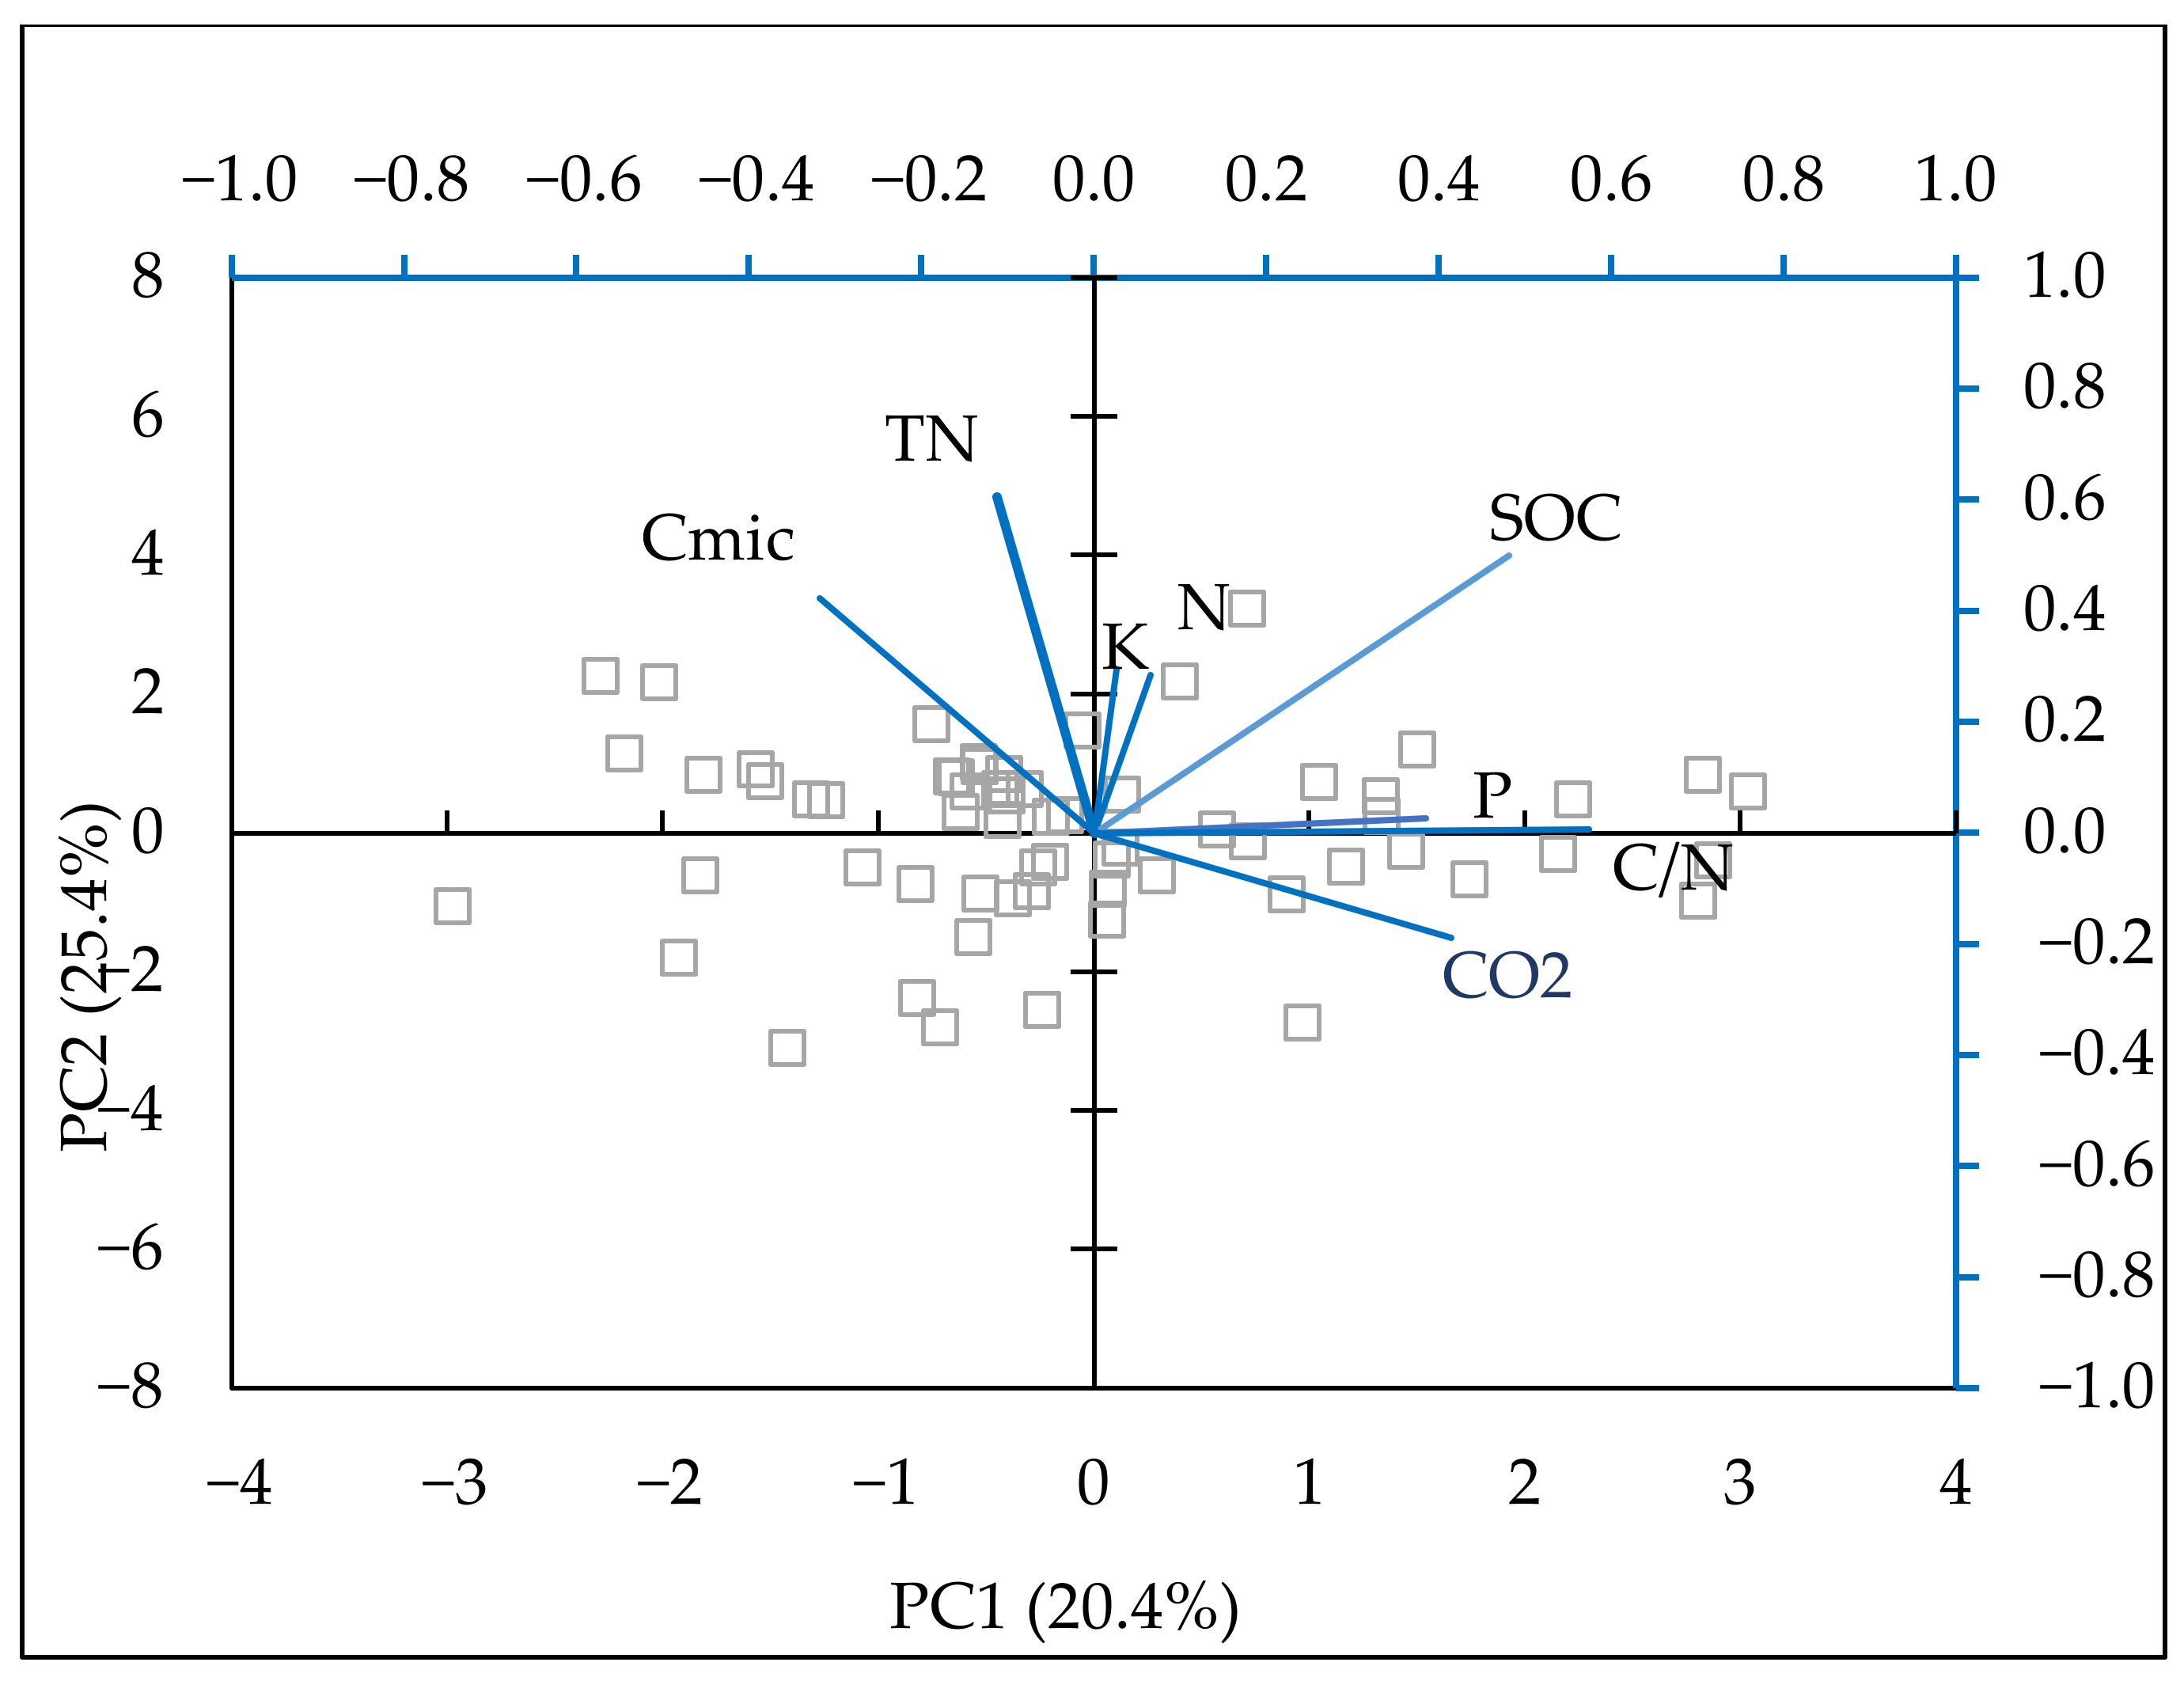
| Component 1 | Component 2 | |
|---|---|---|
| Eigenvalue | 2.02 | 1.53 |
| Percent of variance | 25.29 | 19.10 |
| N | 0.066 | 0.285 |
| P | 0.385 | 0.026 |
| K | 0.0259 | 0.295 |
| SOC | 0.481 | 0.500 |
| Cmic | −0.318 | 0.423 |
| CO2 | 0.414 | −0.189 |
| TN | −0.112 | 0.605 |
| C/N | 0.574 | 0.007 |
| Treatment | Ammonifying Bacteria | Nitrogen Fixing Bacteria | Nitrogen Utilizing Bacteria | Nitrifying Bacteria | Actinomycetes | Microscopic Fungi |
|---|---|---|---|---|---|---|
| N | b* | ab | abc | a | ab | abc |
| P | a | ab | ab | abc | a | a |
| K | a | ab | ab | c | ab | ab |
| NP | a | ab | bcd | ab | a | c |
| NK | a | b | cd | bc | ab | bc |
| PK | a | a | ab | a | b | ab |
| NPK | a | a | a | a | a | ab |
| 0 | b | ab | d | bc | a | ab |
| ANOVA factors | Significance, p | |||||
| Treament | 0.186 | 0.277 | 0.001 | 0.003 | 0.092 | 0.028 |
| Season | 0.000 | 0.000 | 0.000 | 0.000 | 0.000 | 0.000 |
| Crop | 0.003 | 0.068 | 0.074 | 0.033 | 0.002 | 0.000 |
| Component 1 | Component 2 | |
|---|---|---|
| Eigenvalue | 3.54 | 1.57 |
| Percent of variance | 32.18 | 14.32 |
| N | 0.080 | −0.167 |
| P | −0.107 | 0.571 |
| K | 0.034 | 0.381 |
| CN | 0.007 | 0.489 |
| TotalN | 0.038 | −0.337 |
| ACT | −0.180 | 0.316 |
| FUNGI | −0.267 | 0.0458 |
| AMM | 0.432 | 0.016 |
| NITR | 0.464 | 0.187 |
| NFIX | 0.476 | 0.110 |
| NUTIL | 0.496 | −0.011 |
Disclaimer/Publisher’s Note: The statements, opinions and data contained in all publications are solely those of the individual author(s) and contributor(s) and not of MDPI and/or the editor(s). MDPI and/or the editor(s) disclaim responsibility for any injury to people or property resulting from any ideas, methods, instructions or products referred to in the content. |
© 2025 by the authors. Licensee MDPI, Basel, Switzerland. This article is an open access article distributed under the terms and conditions of the Creative Commons Attribution (CC BY) license (https://creativecommons.org/licenses/by/4.0/).
Share and Cite
Kuncheva, G.; Gynchev, G.; Perfanova, J.; Kercheva, M.; Tribis, L.; Valchovski, H. Multivariate Analyses of Soil Properties and CO2 Emissions Under Long-Term Fertilization and Crop Rotation in Luvic Chernozem. Nitrogen 2025, 6, 39. https://doi.org/10.3390/nitrogen6020039
Kuncheva G, Gynchev G, Perfanova J, Kercheva M, Tribis L, Valchovski H. Multivariate Analyses of Soil Properties and CO2 Emissions Under Long-Term Fertilization and Crop Rotation in Luvic Chernozem. Nitrogen. 2025; 6(2):39. https://doi.org/10.3390/nitrogen6020039
Chicago/Turabian StyleKuncheva, Gergana, Galin Gynchev, Jonita Perfanova, Milena Kercheva, Lev Tribis, and Hristo Valchovski. 2025. "Multivariate Analyses of Soil Properties and CO2 Emissions Under Long-Term Fertilization and Crop Rotation in Luvic Chernozem" Nitrogen 6, no. 2: 39. https://doi.org/10.3390/nitrogen6020039
APA StyleKuncheva, G., Gynchev, G., Perfanova, J., Kercheva, M., Tribis, L., & Valchovski, H. (2025). Multivariate Analyses of Soil Properties and CO2 Emissions Under Long-Term Fertilization and Crop Rotation in Luvic Chernozem. Nitrogen, 6(2), 39. https://doi.org/10.3390/nitrogen6020039