Article

Variation in Leaf C, N, and P Stoichiometric Characteristics of Populus euphratica Communities in a Desert Riparian Ecosystem of Northwest China

by
Xiaolong Zhang
1,*,
Xianmeng Liu
1,
Lijiang Shi
1,
Yinbo Zhang
1,
Jingwei Wang
1,
Feng Gao
1,
Hao Qin
2,
Min Shi
1,
Yongji Wang
3 and
Yuanrun Zheng
4
1
School of Resources and Environment, Shanxi University of Finance and Economics, Taiyuan 030006, China
2
School of Statistics, Shanxi University of Finance and Economics, Taiyuan 030006, China
3
School of Life Science, Shanxi Engineering Research Center of Microbial Application Technologies, Shanxi Normal University, Taiyuan 030031, China
4
State Key Laboratory of Plant Diversity and Specialty Crops, Institute of Botany, Chinese Academy of Sciences, Beijing 100093, China
*
Author to whom correspondence should be addressed.
Nitrogen 2025, 6(2), 35; https://doi.org/10.3390/nitrogen6020035
Submission received: 2 April 2025 / Revised: 4 May 2025 / Accepted: 14 May 2025 / Published: 16 May 2025

Abstract

:
Despite extensive research on how climate and environmental factors influence leaf stoichiometry at national and global scales, experimental evidence on their effects at the community level remains limited, particularly in extremely arid regions. Herein, we investigated the leaf stoichiometry including carbon (C), nitrogen (N), and phosphorus (P) along a fine-scale riparian gradient (50–1250 m from the riverbank) in an extremely arid Populus euphratica forest in northwest China. Our results show that the community-averaged leaf total carbon (TC), total nitrogen (TN), and total phosphorus (TP) contents were 442.58 mg/g, 21.69 mg/g, and 1.18 mg/g, respectively. The community-averaged C:N, C:P, and N:P ratios were 20.74, 379.97, and 18.43, respectively. Compared to findings from other studies, the P. euphratica community exhibited lower leaf TC and TP contents but higher TN content and N:P ratios. A high N:P ratio (mean = 18.43, N:P > 16) suggests that the P. euphratica community is more susceptible to phosphorus limitation. Along the riparian gradient, community-averaged leaf TC, C:N, and C:P increased significantly, reaching their maximum (479.49 mg/g, 27.12, and 478.06, respectively) at 1250 m from the riverbank. Conversely, leaf TN and TP contents, as well as N:P, decreased significantly with increasing distance from the river, reaching their minimum values (17.49 mg/g, 0.99 mg/g, and 17.17, respectively) at 1100–1250 m. Soil available phosphorus, soil water content, soil bulk density, and soil electrical conductivity significantly influenced the leaf stoichiometry of the P. euphratica community, collectively explaining 61.78% of the total variation. Among these factors, soil water content had the most pronounced effect, surpassing soil available phosphorus, bulk density, and electrical conductivity in shaping leaf stoichiometric characteristics. Our findings indicate that at fine spatial scales, the distribution of leaf nutrients and stoichiometry seem to be predominantly influenced by local-scale factors such as soil water content, soil nutrient levels, and salt stress; P. euphratica forests would be experiencing more negative impacts in leaf nutrients and stoichiometry due to increased droughts or salt stress.

Graphical Abstract

1. Introduction

Leaves are the primary and most immediate photosynthetic organs in plants, serving as key indicators of plant adaptability to changing environmental conditions [1,2]. Leaf stoichiometry represents a fundamental set of parameters that not only provide insights into plant growth dynamics and nutrient utilization efficiency but also serve as essential indicators for assessing nutrient limitation at both individual and community levels [3,4,5]. Numerous studies have explored the characteristics and hypotheses of leaf ecological stoichiometry, confirming their validity across different spatial scales [1,2,6]. At global or large regional scales, leaf nitrogen and phosphorus concentrations exhibit significant correlations with latitude and mean annual temperature, highlighting the dominant influence of climatic factors [7,8,9]. In contrast, at finer spatial scales, local environmental factors, particularly soil moisture and nutrient availability, play a more significant role in shaping leaf traits, while climatic influences become less determinant [9]. Therefore, investigating the patterns of leaf stoichiometry and their variations across diverse directions and enhance our understanding of plant ecological adaptation strategies and nutrient limitation patterns [10].
Ecological theory indicates that community-level trait convergence results from filtering processes, where environmental constraints or biotic interactions remove divergent trait combinations, leading to a more homogeneous trait distribution within communities [9]. Numerous studies have reported that, at the community level, despite individual variations among constituent species, they exhibit convergent trait patterns when compared to species from other communities. For example, fast-growing plants may exhibit lower leaf N:P and C:P ratios while maintaining relatively high phosphorus content [11,12,13,14]. The relationships among environmental conditions, plant growth, and species distribution are regulated by functional traits, which influence community assembly and adaptation to ecological conditions [2,15]. A trait-based approach, thus, provides crucial insights into the mechanisms underlying community structure and environmental adaptation. Notably, prior reports have primarily focused on leaf C:N:P stoichiometric characteristics at regional and global scales. However, in the context of global environmental change, certain plant taxa inhabiting specialized habitats exhibit increased sensitivity to environmental fluctuations. Understanding the stoichiometric characteristics of these plants is particularly important for assessing their adaptability and responses to environmental change [15,16].
Populus euphratica Oliv. is a flagship tree species in conservation efforts for desert riparian forests in extremely arid regions, playing a crucial role in maintaining local ecosystem stability [17,18]. Current ecological research on P. euphratica forests has primarily focused on population dynamics, community characteristics, and their relationships with environmental factors [19,20]. Nevertheless, investigations into the ecological stoichiometry of P. euphratica communities and their interactions with environmental factors remain limited, particularly along environmental gradients in extremely arid desert riparian zones [18]. Understanding plant functional traits at the community level and their variations in response to environmental changes is essential for assessing plant community development and adaptation strategies under diverse conditions [3,21]. Therefore, elucidating the leaf stoichiometric characteristics of P. euphratica communities and their environmental responses will not only enhance our understanding of their ecological adaptation strategies and nutrient limitations but also provide valuable insights into the impacts of global change on forest communities in extremely arid regions.
The Ejina Desert Oasis, the terminal oasis of the Heihe River Basin (the second-largest inland river system in northwest China) has undergone significant ecological restoration since the implementation of emergency water diversion projects in 2000 [17,22,23]. These measures, which have led to rising groundwater levels, have substantially mitigated the degradation of riparian vegetation and soils [24]. Over the past decade, consistent ecological water allocation has maintained a steady increase in river discharge, stabilizing groundwater depth at approximately 3 m with minimal interannual variation due to sustained surface runoff recharge [22,23]. This relative stabilization of groundwater levels has facilitated the recovery of riparian vegetation, improving soil structure and nutrient status, and promoting the establishment of other plant communities, comprising arboreal, shrub, and herbaceous layers [22]. The distribution of P. euphratica communities along the Ejina section of the lower Heihe River follows a distinct and representative pattern, extending from riparian zones to peripheral Gobi desert areas, shaped by moisture gradients perpendicular to the riverbank [19]. This setting provides an ideal experimental site for investigating leaf C:N:P stoichiometry and its responses to environmental variations in extremely arid desert conditions. However, the spatial distribution and underlying drivers of leaf C:N:P stoichiometry in natural P. euphratica forests along desert riparian areas remain largely unknown.
In this study, an environmental gradient transect was established along the Ejina section of the lower Heihe River to examine the distribution patterns of leaf stoichiometry in relation to environmental factors. Specifically, this research aims to: (1) assess the spatial distribution of leaf C:N:P stoichiometry in the natural P. euphratica community along the Ejina section of the lower Heihe River; (2) identify the ecological adaptation strategies and nutrient limitation patterns exhibited by the P. euphratica community under current field conditions in this arid riparian ecosystem; (3) quantify the influence of key environmental factors, including soil moisture, soil salinity–alkalinity, and nutrient availability, on the leaf stoichiometry of P. euphratica. This study not only provides empirical data to support the investigation of biogeographic patterns of plant leaf trait differentiation at broader regional and global scales but also serves as a valuable contribution to research on plant–environment interactions within arid forest ecosystems.

2. Materials and Methods
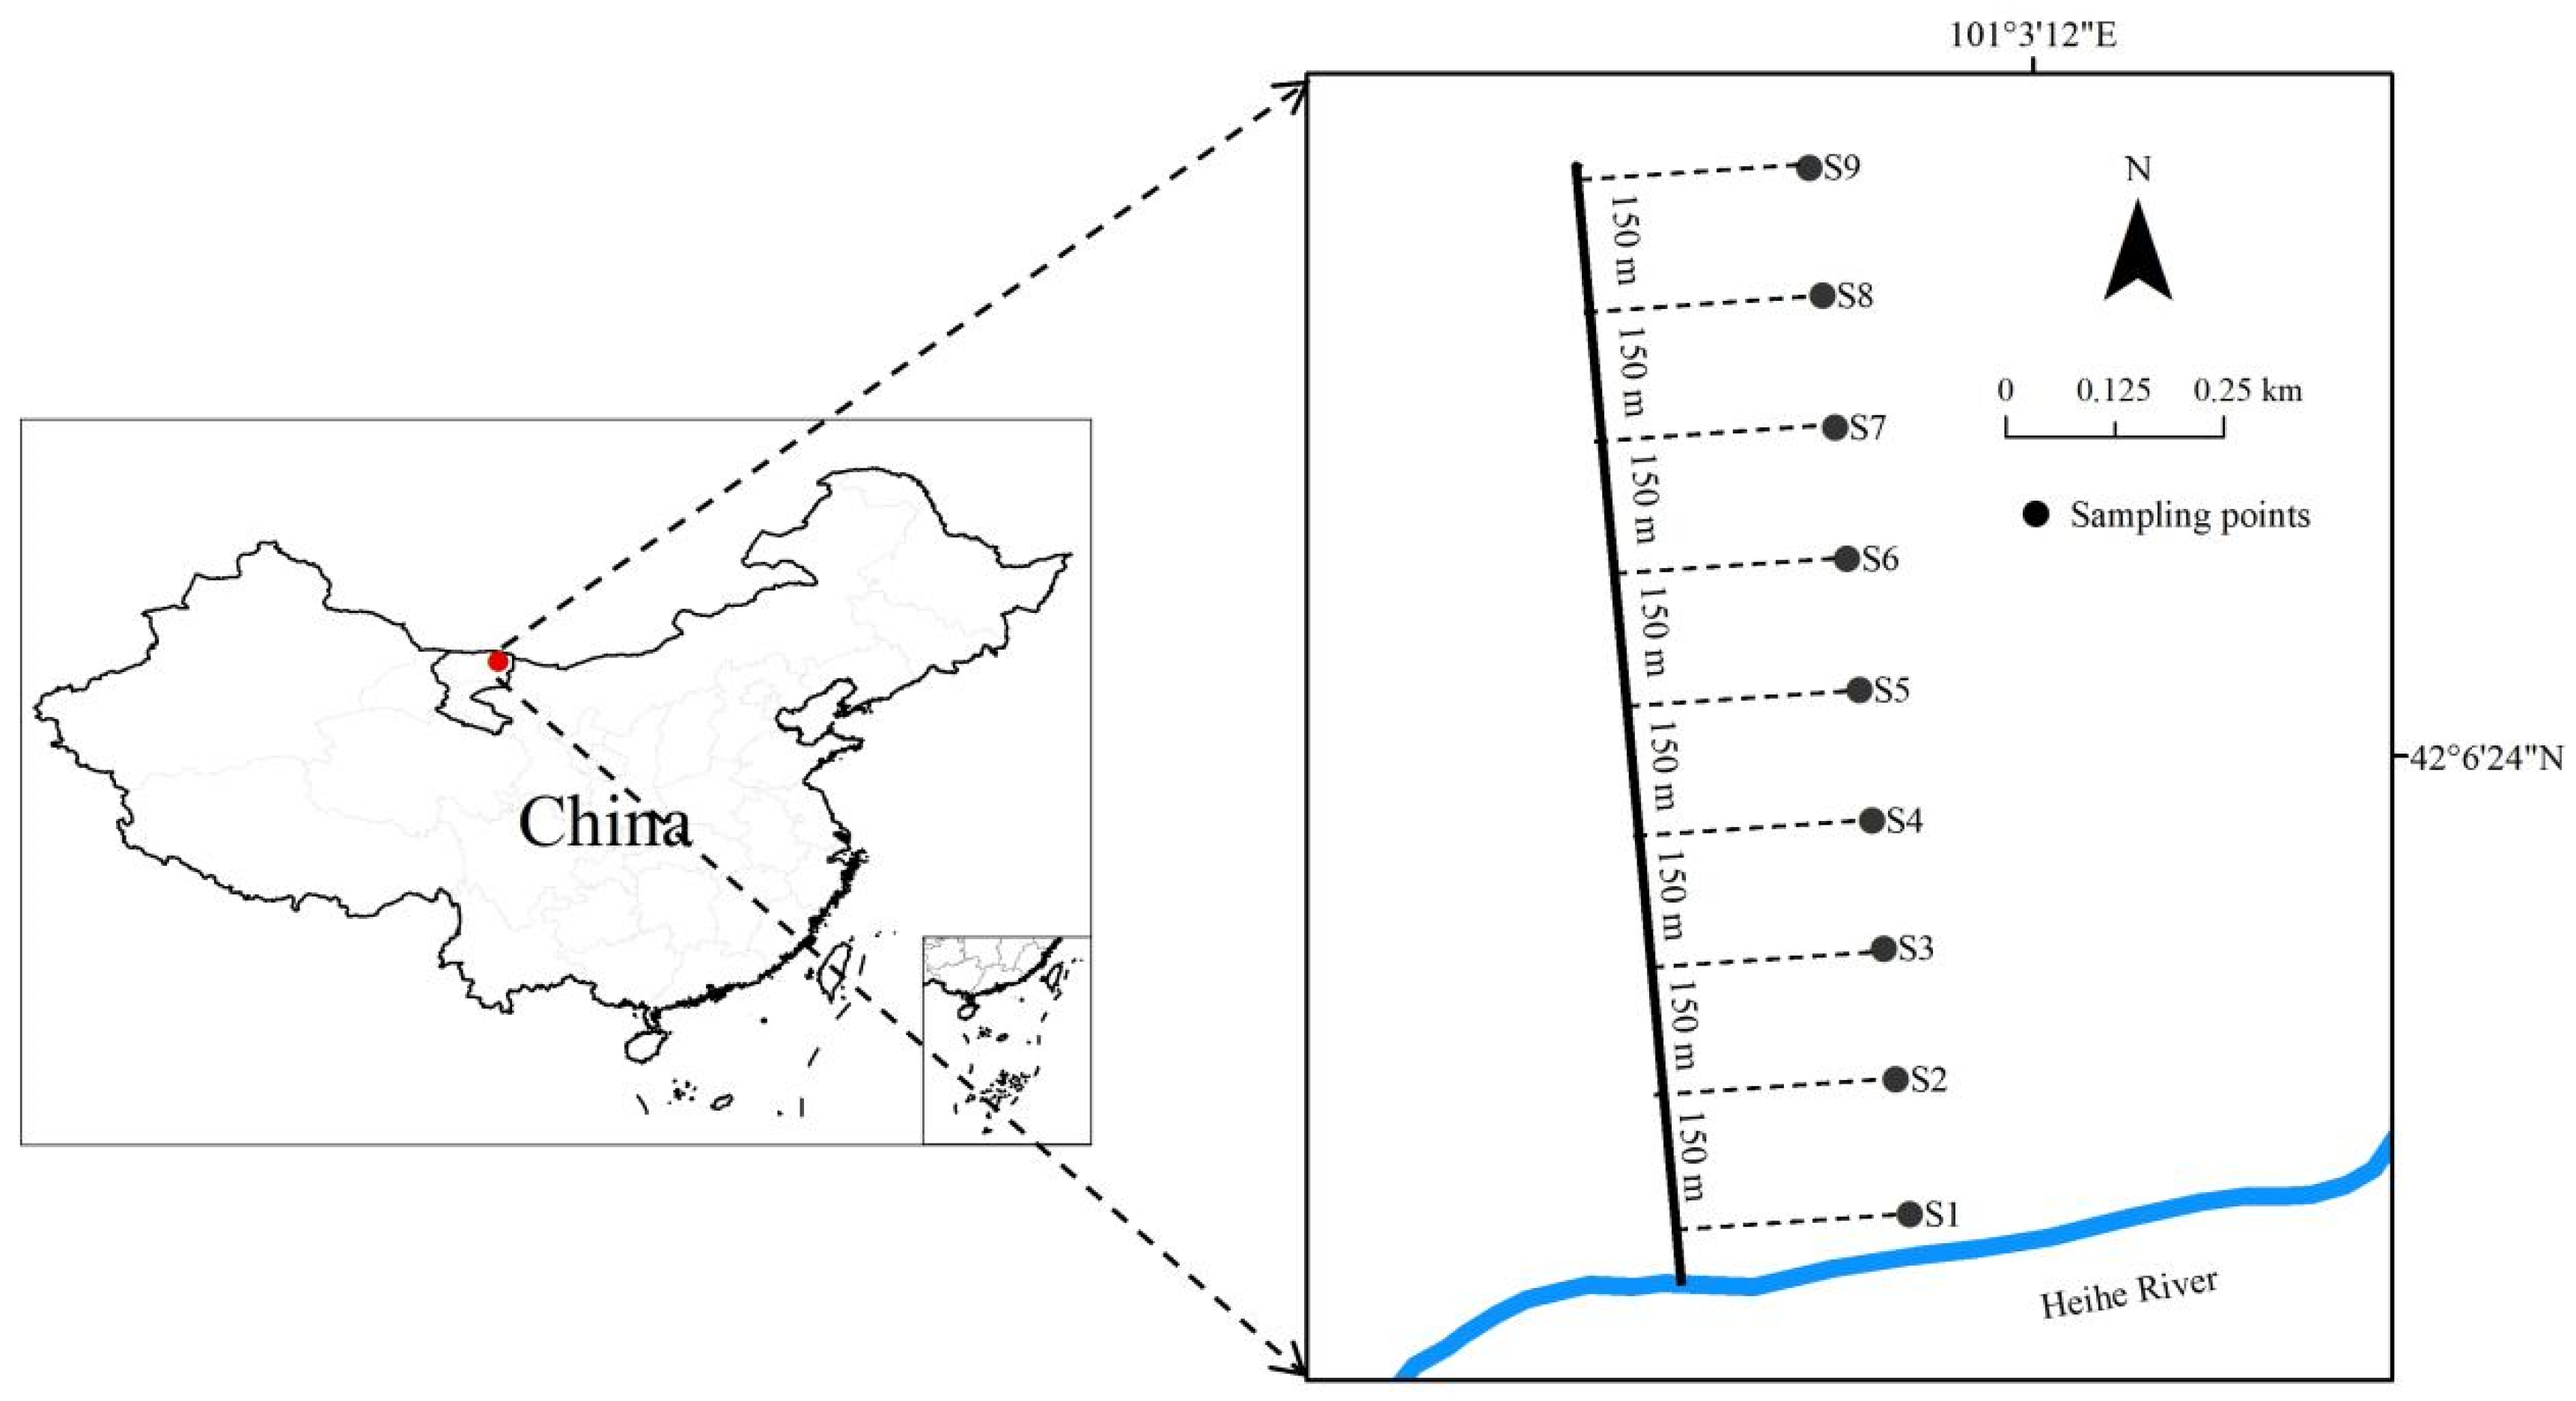
2.1. Study Sites

The study area is located within the Ulantuge monitoring section of the Ejina region in the lower Heihe River basin (101°2.88′ E–101°3.48′ E, 42°6.06′ N–42°6.9′ N), at an elevation of 912–917 m (Figure 1 and Table 1). This area experiences a typical temperate continental arid climate, characterized by a mean annual temperature of 8.57 °C and low precipitation ranging from 30 to 40 mm. More than 75% of the annual rainfall occurs between July and September, coinciding with the warmest period [22,25]. River-recharged groundwater serves as the primary water source supporting local ecosystem stability [25]. The predominant soil type is grey–brown desert soil, with a relatively stable soil pH, mainly between 8.52 and 8.90, sustaining a temperate deciduous broad-leaved forest ecosystem that exhibits relatively low floristic diversity [22]. The vegetation is predominated by Populus euphratica as the primary arboreal species, with Tamarix ramosissima as the main shrub species. The herbaceous layer exhibits comparatively higher species richness, including Sophora alopecuroides, Alhagi sparsifolia, Zygophyllum fabago, and Peganum harmala [19,23].

2.2. Field Investigation and Data Collection

In mid-August 2019, a quadrat survey methodology was employed to investigate P. euphratica forest plots along the river. Nine sampling plots (S1–S9) of size 300 × 30 m2 (each plot had 300 m of length and 30 m of width) were established along a perpendicular gradient from the riverbank at approximate intervals of 50 m, 200 m, 350 m, 500 m, 650 m, 800 m, 950 m, 1100 m, and 1250 m (Figure 1). Within each plot, three randomly selected 20 × 20 m2 quadrats were established for arboreal vegetation assessment, recording crown diameter, diameter at breast height (DBH), and tree height. The average crown width (i.e., the average of east–west crown width and north–south crown width) was used to measure the size of the crown diameter [26]. The tree height was measured using an extendable aluminum alloy pole. Along the diagonal of each arboreal quadrat, five 5 × 5 m2 shrub quadrats and five 1 × 1 m2 herbaceous quadrats were established to document species composition, individual/clump counts, height measurements, crown diameters, and coverage percentages. Essential plot characteristics were also systematically recorded. The dominant community species within each sampling plot were identified based on species importance values [27]. From each 20 × 20 m2 arboreal quadrat, species with importance values exceeding 0.1 were selected, and 5–10 healthy individuals per species were sampled. Fully expanded, mature, healthy, and unshaded leaves (or assimilating branches) were collected, with 30–40 g of fresh weight per species with three replicates per arboreal quadrat. For arboreal species, leaves were systematically collected from upper, middle, and lower sections of outer canopy branches, while herbaceous and shrub species were sampled by directly collecting leaves (or assimilating branches). All leaf samples were thoroughly mixed, stored in zip-lock bags (excluding petioles), and transported to the laboratory in preservation containers. Additionally, three soil profiles were randomly excavated per plot, with soil samples collected at 10 cm depth intervals (0–50 cm) using a 100 cm3 cutting ring. These samples were subsequently sealed in plastic bags and transported to the laboratory for analysis.
The analytical procedures included the determination of leaf total carbon (TC), leaf total nitrogen (TN), and leaf total phosphorus (TP) concentrations. Soil analyses encompassed measurements of soil bulk density (SBD), soil water content (SWC), soil mechanical composition (SMC), soil organic carbon (SOC), soil total nitrogen (STN), soil available phosphorus (SAP), soil temperature (ST), soil pH, and soil electrical conductivity (SEC), with chemical properties expressed as mass percentages. Each plant leaf sample was oven-dried at 65 °C to a constant weight, followed by fine grinding and sieving via a 0.149 mm mesh for further analysis. SWC was determined using the oven-drying method, while SBD was measured following the cutting ring method [23]. Elemental concentrations, including leaf TC and TN, SOC, and STN, were evaluated using an elemental analyzer (Vario-EL-III, Hanau, Germany). Leaf TP and SAP were quantified using inductively coupled plasma optical emission spectrometry (iCAP-6300, Waltham, MA, USA) [28,29]. SMC was assessed with a laser diffraction particle size analyzer (Mastersizer-2000, Malvern, UK). Soil pH and SEC measurements were conducted using soil-to-water ratio of 1:1 and 1:5 (Multiline F/SET-3, Weilheim, Germany) [30]. For this study, soil data represent the mean values for the 0–50 cm depth.

2.3. Data Analysis

The community-level leaf TC, TN, and TP concentrations in P. euphratica stands were calculated as weighted averages of the corresponding leaf nutrient concentrations across constituent species, using the following equations [14,31]:
The community-level leaf TC content:
T C = i = 1 S C i × I i
The community-level leaf TN content:
T N = i = 1 S N i × I i
The community-level leaf TP content:
T P = i = 1 S P i × I i
In these equations, S represents the number of species, Ci denotes the leaf TC concentration of species i, Ni signifies the leaf TN concentration of species i, Pi indicates the leaf TP concentration of species i, and Ii represents the relative abundance of species i.
After confirming normal distribution and homogeneity of variance, one-way ANOVA was employed to assess significant variations in leaf TC, TN, and TP concentrations, as well as their stoichiometric ratios along the riparian gradient. Post hoc comparisons were conducted using LSD tests. Pearson correlation coefficients were used to examine the relationships between leaf stoichiometric characteristics and environmental factors at α < 0.05. All statistical tests were performed with SPSS 18.0 and Origin 2021. To quantitatively evaluate the influence of environmental factors on leaf stoichiometric variations in P. euphratica communities, detrended canonical correspondence analysis (DCCA) was conducted to identify primary environmental drivers. The Monte Carlo permutation test (with 9999 permutations) was applied to determine significant correlations between leaf stoichiometry and environmental factors while minimizing redundancy effects. The significance level was set at α < 0.05. Multivariate testing was carried out with Canoco 5.0 for Windows [32].

3. Results

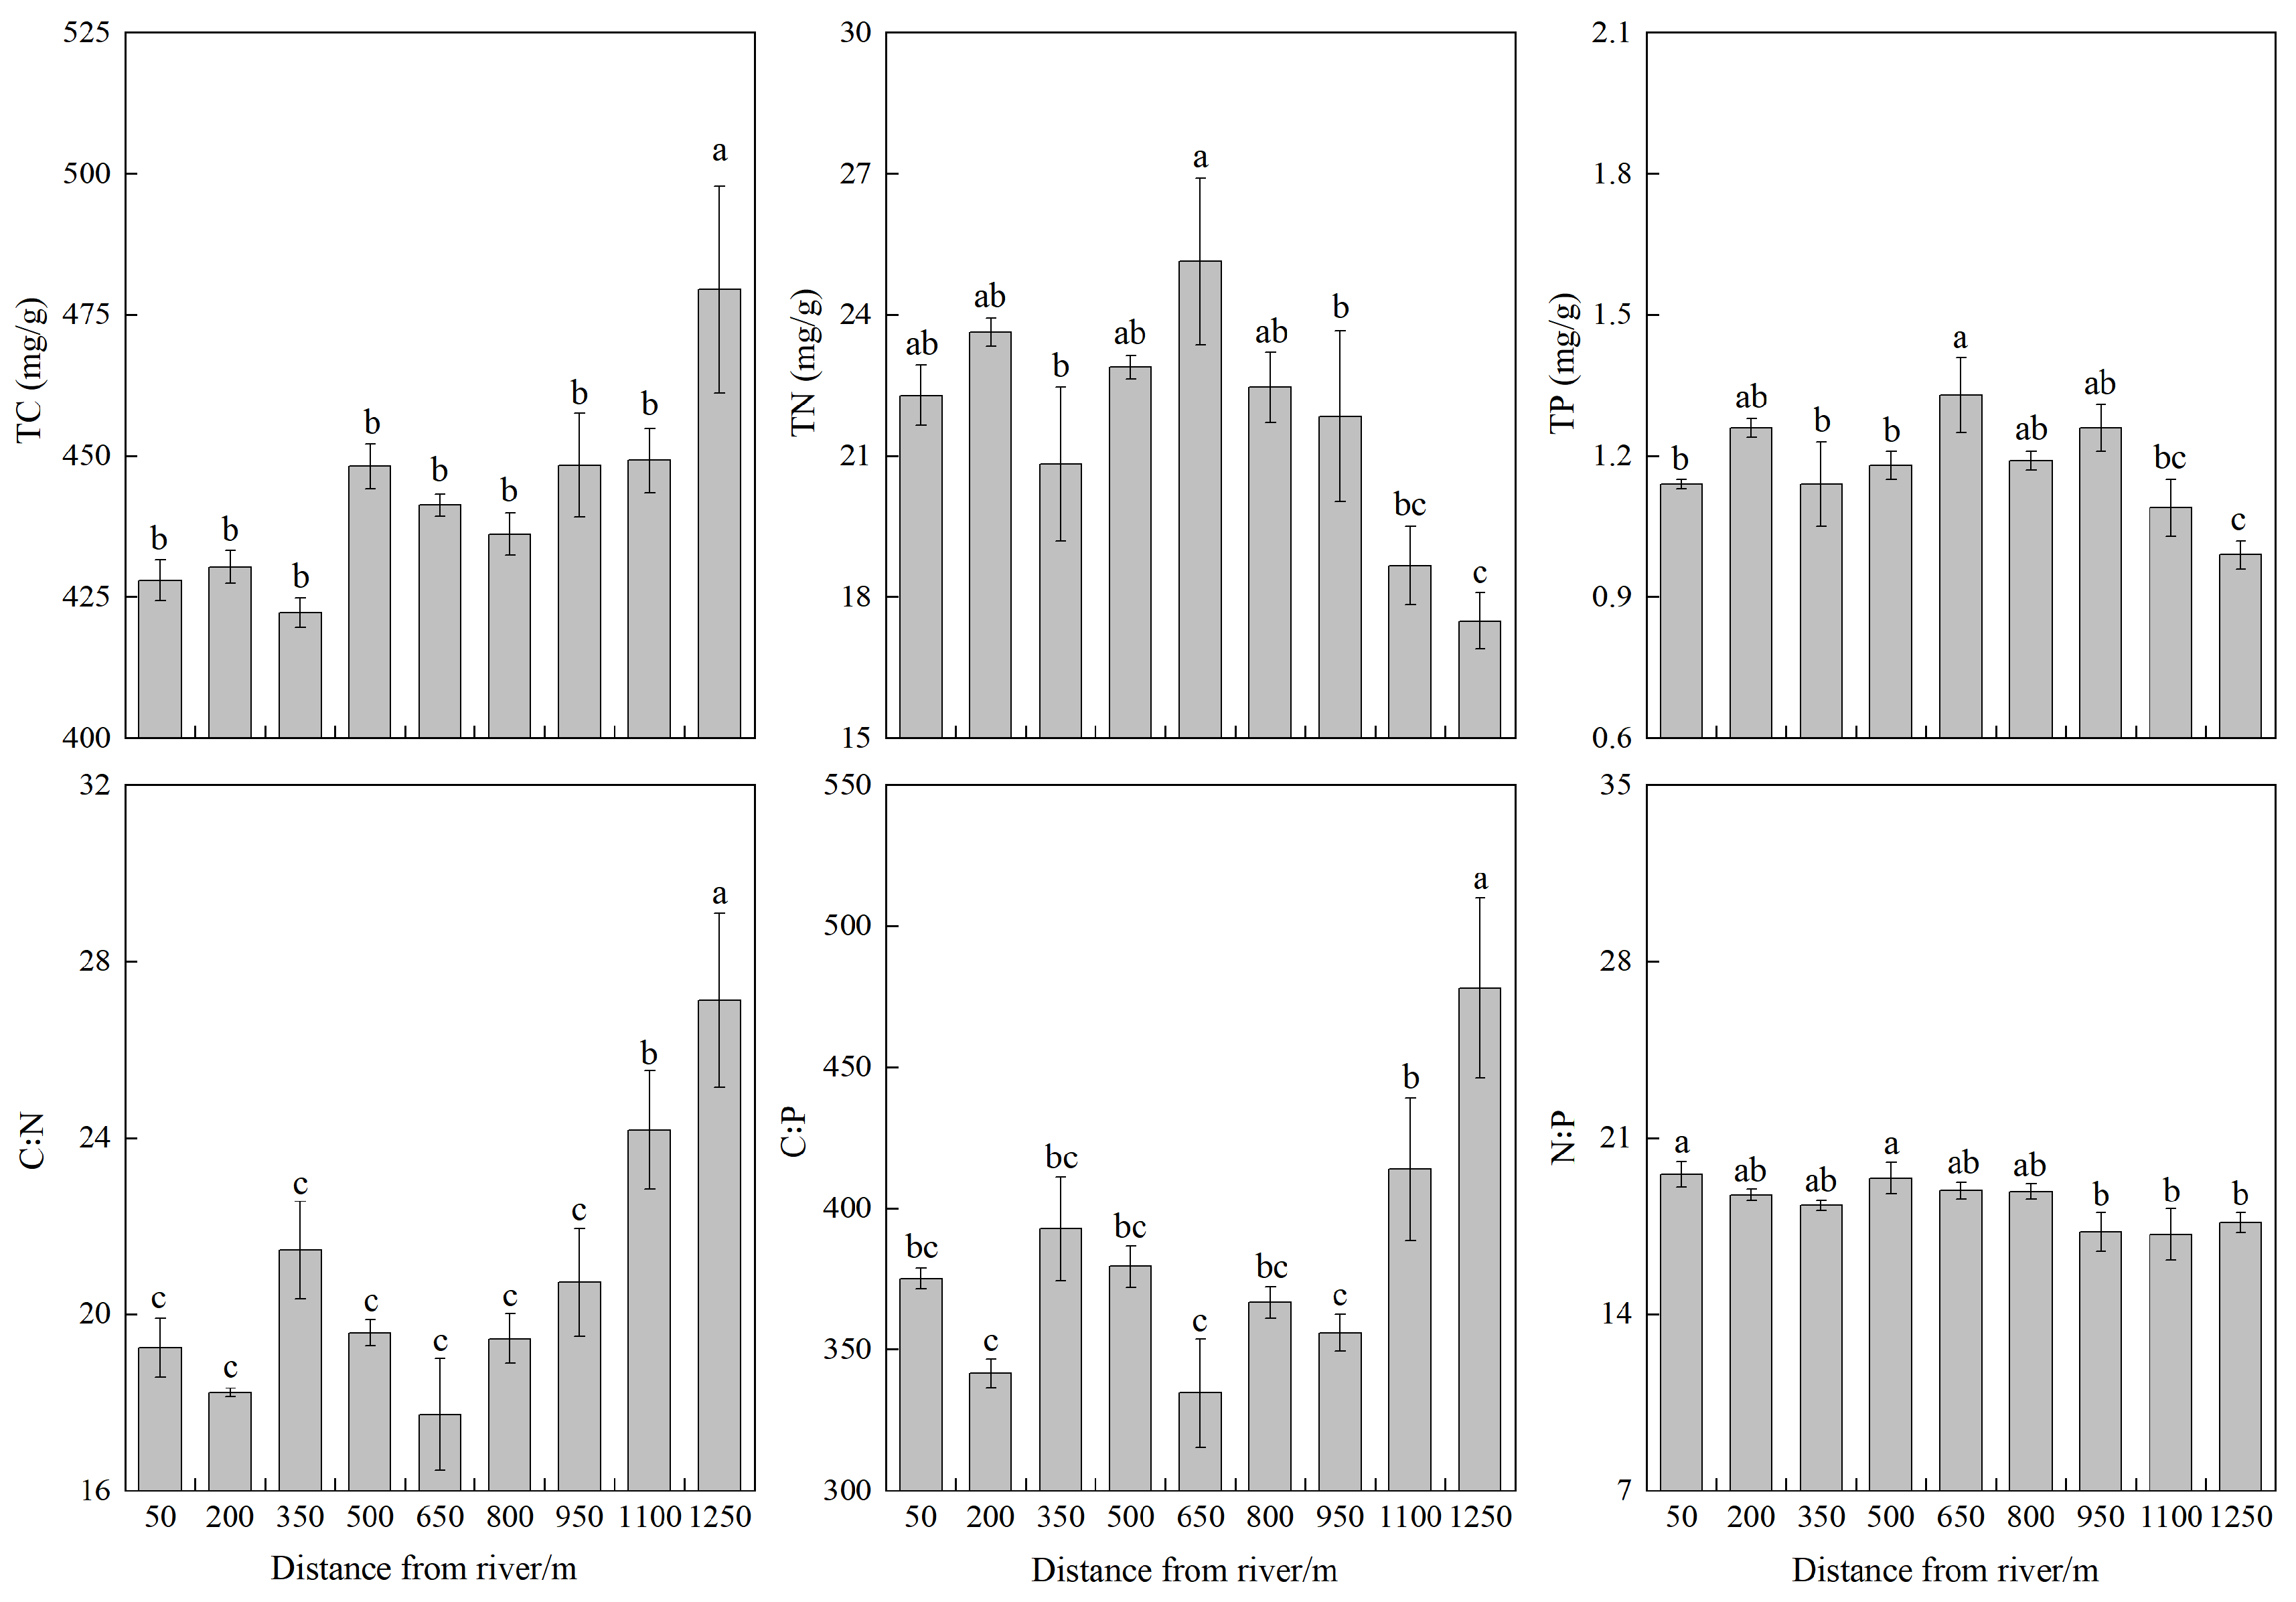
3.1. Leaf TC, TN, and TP Stoichiometric Characteristics of Populus euphratica Community

At the local scale along the perpendicular riparian gradient, significant differences were observed in the P. euphratica community’s leaf TC content (F = 2.839, p = 0.031), leaf TN content (F = 4.555, p = 0.004), leaf TP content (F = 4.328, p = 0.005), C:N (F = 8.442, p < 0.001), C:P (F = 7.722, p < 0.001), and N:P (F = 2.569, p = 0.046) among plots located at various distances from the riverbank (Table 2). The leaf TC content ranged from 377.08 to 508.69 mg/g, with an average value of 442.58 mg/g. The leaf TN content varied between 16.37 and 27.57 mg/g (mean value: 21.69 mg/g), whereas the leaf TP concentration ranged from 0.94 to 1.45 mg/g (mean value: 1.18 mg/g). The C:N, C:P, and N:P ratios varied between 16.00 and 31.69, 303.34 and 550.78, and 15.24 and 20.63, respectively, with mean values of 20.81, 381.03, and 18.43 (Table 2).
Along the perpendicular riparian gradient, the community leaf TC content was elevated with increasing distance from the river, reaching its highest value of 479.49 mg/g at 1250 m from the riverbank. In contrast, both leaf TN and TP contents demonstrated significant decreasing trends, with minimum values of 17.49 and 0.99 mg/g, respectively, at 1250 m (Figure 2). The C:N and C:P ratios displayed positive correlations (p < 0.05) with distance from the river, peaking at 27.12 and 478.06, respectively, at 1250 m, indicating increased carbon accumulation relative to nitrogen and phosphorus at greater distances. Conversely, the N:P ratio exhibited a significant negative trend, reaching its lowest value of 17.17 between 1100 and 1250 m, suggesting potential shifts in nutrient limitation patterns along the gradient. These findings highlight the spatial heterogeneity of leaf stoichiometry in P. euphratica communities and suggest that distance from the river exerts a strong influence on nutrient allocation strategies in this arid riparian ecosystem (Figure 2).

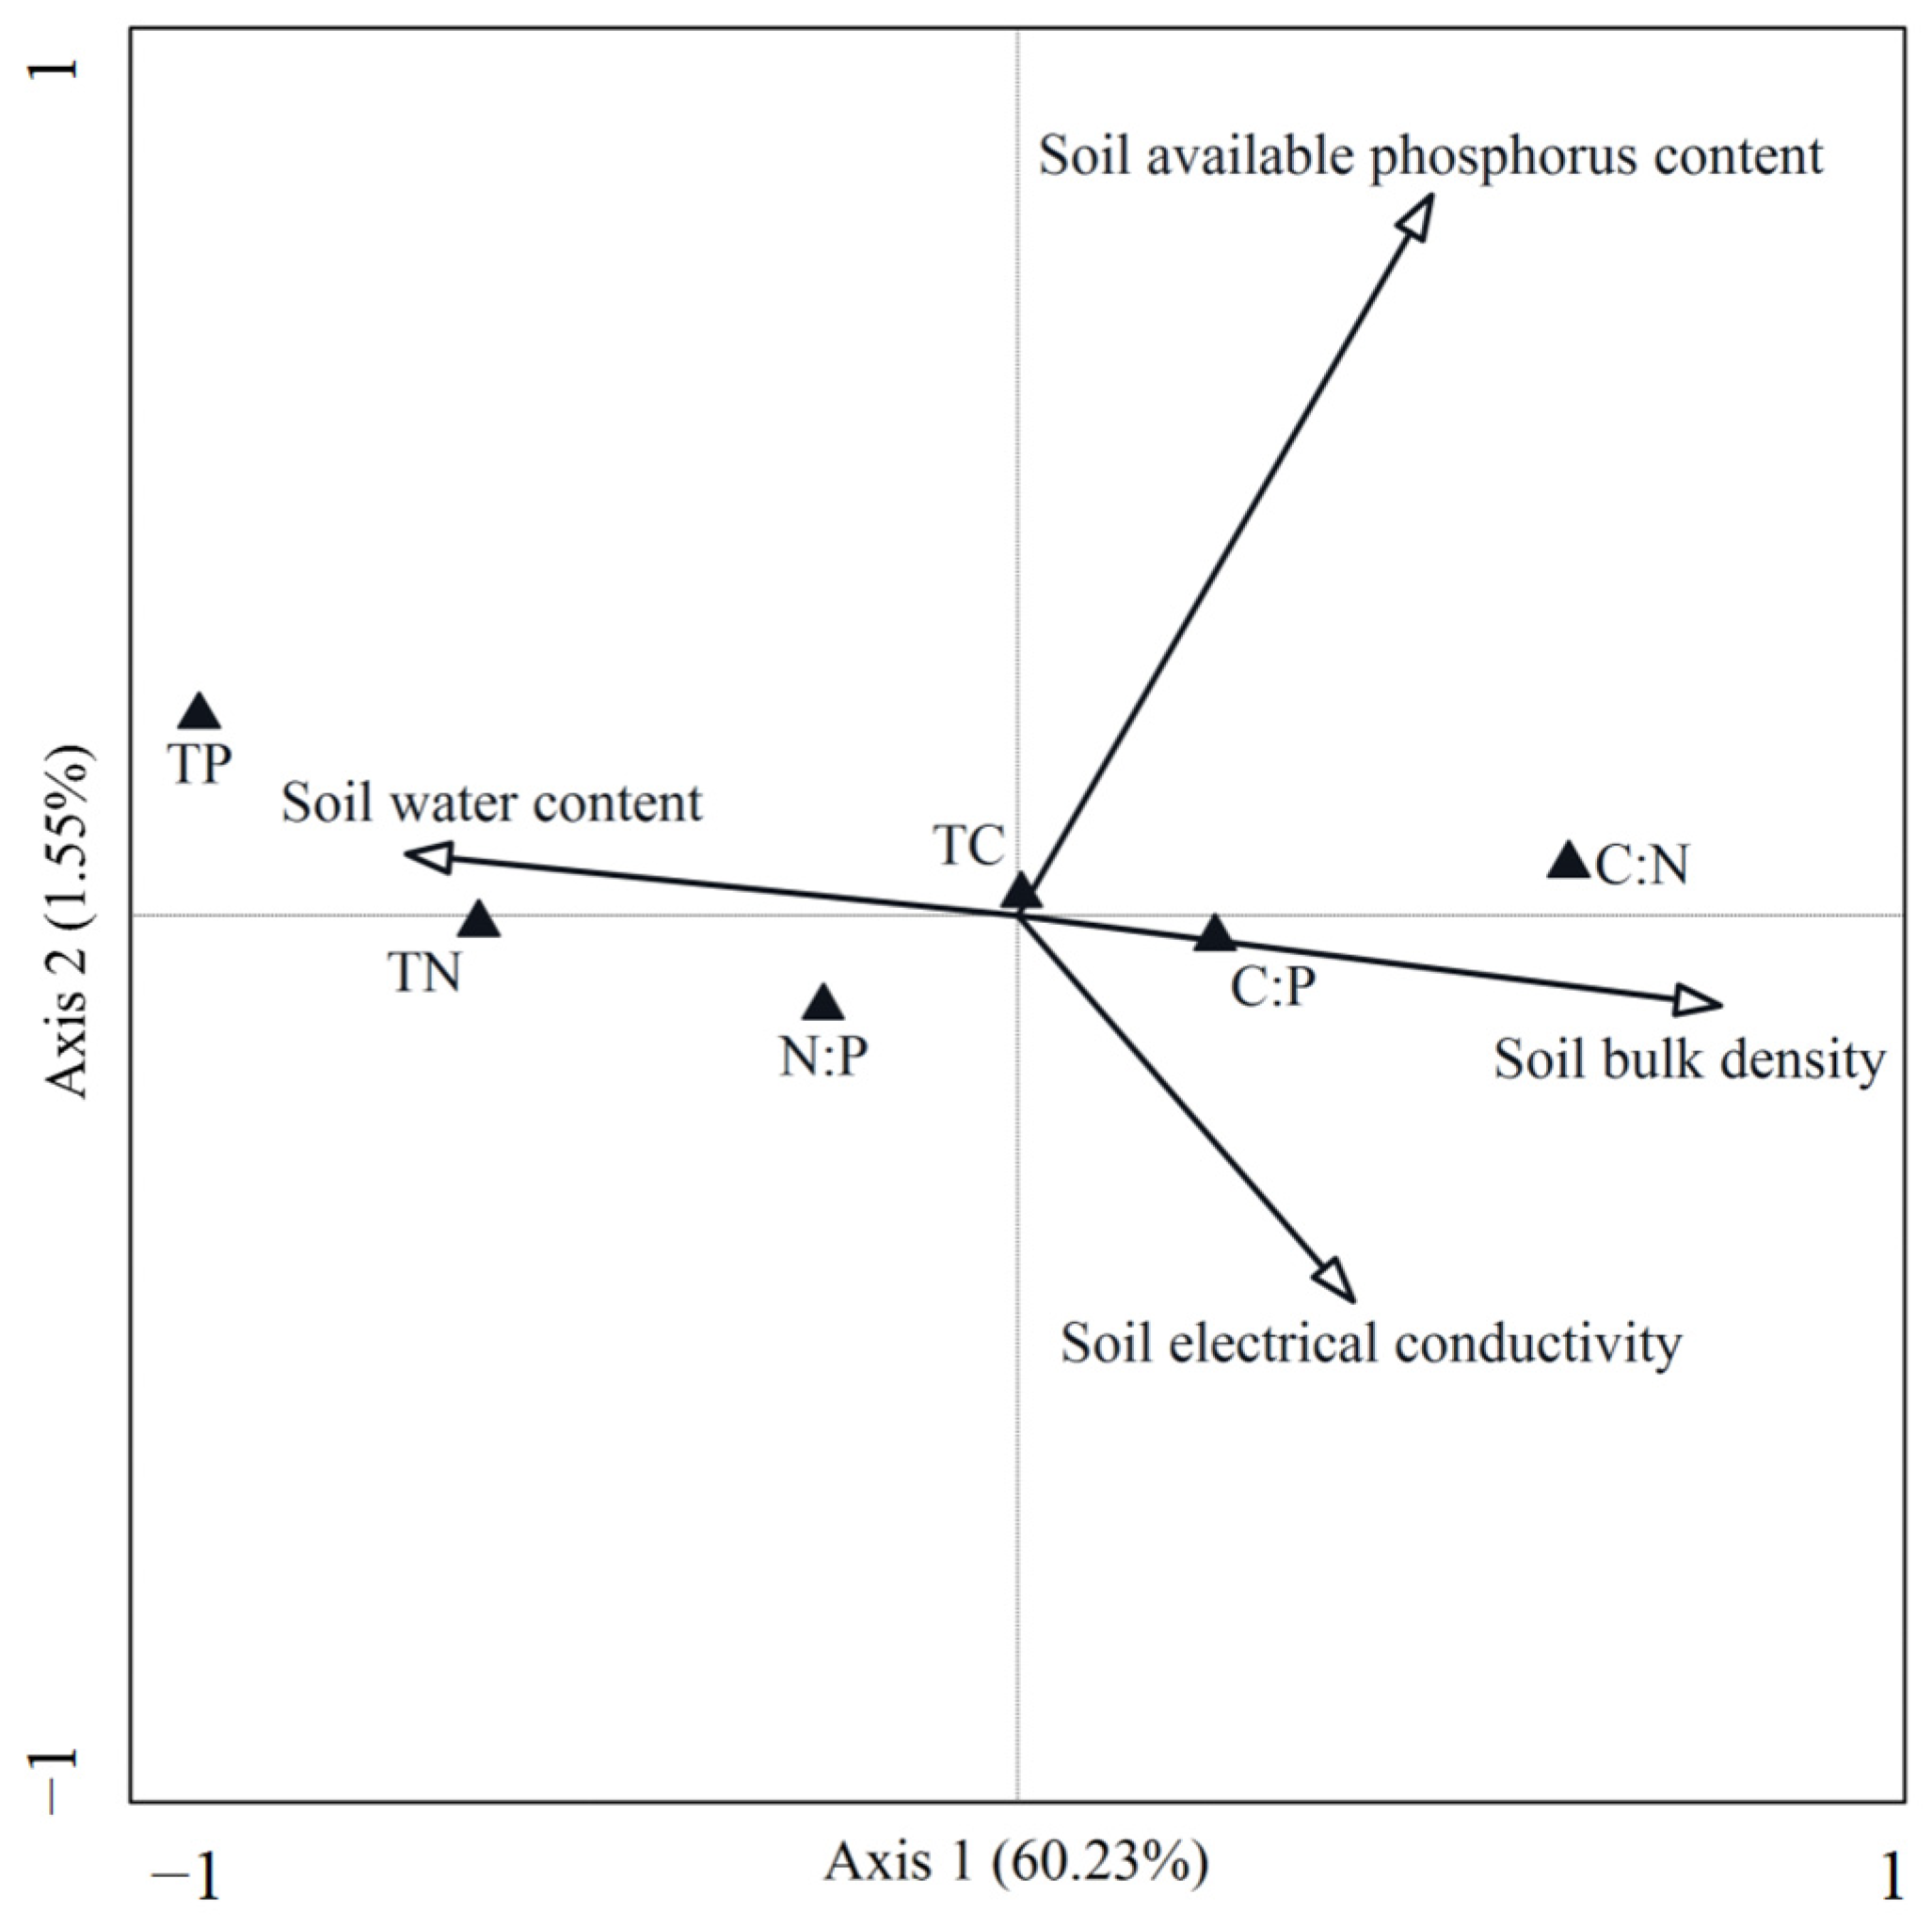
3.2. Relationship Between Community Leaf Stoichiometry Characteristics and Environmental Factors

The community leaf TC content exhibited no significant correlations with any of the measured environmental factors (Figure 3). In contrast, the community leaf TN content exhibited a positive correlation (p < 0.05) with SWC but demonstrated negative correlations (p < 0.05) with both SBD and ST. Similarly, the community leaf TP content was positively correlated with SWC, while exhibiting negative correlations (p < 0.05) with SBD and SEC (Figure 3). The community leaf C:N ratio displayed positive correlations (p < 0.05) with SBD, SAP, ST, and SEC, whereas it was significantly negatively correlated with SWC. Likewise, community leaf C:P ratio showed a negative correlation (p < 0.05) with SWC but was positively correlated with SBD, ST, and SEC. In contrast, community leaf N:P ratio exhibited a positive correlation (p < 0.05) with SWC, while showing negative correlations (p < 0.05) with SBD and SAP (Figure 3). These results highlight the strong influence of soil moisture, bulk density, and nutrient availability on the stoichiometric composition of P. euphratica communities, suggesting that water availability plays a critical role in shaping nutrient allocation strategies in this arid riparian ecosystem.

3.3. Key Environmental Drivers of Community Leaf Stoichiometric Characteristics

DCCA ordination analysis indicates that the first two axes collectively explained 61.78% of the total variation in community leaf stoichiometry characteristics within the extreme arid riparian ecosystem (Figure 4). Among the environmental variables, soil water content, soil bulk density, soil available phosphorus content, and soil electrical conductivity were identified as the primary drivers influencing leaf stoichiometry. The first ordination axis accounted for 60.23% of the total variance and primarily reflected the strong effects of soil water content and soil bulk density on community leaf stoichiometry characteristics. These factors likely play an essential role in regulating nutrient uptake and allocation strategies in P. euphratica communities along the riparian gradient. The second ordination axis, explaining an additional 1.55% of the total variance, was mainly associated with soil available phosphorus content and electrical conductivity. These results suggest that phosphorus availability and soil salinity may also contribute to variations in leaf stoichiometry, potentially influencing nutrient limitation patterns and plant adaptation strategies in this arid ecosystem.

4. Discussion

4.1. Variations of Leaf C:N:P Stoichiometry at the Community Level

This study provides a comprehensive analysis of leaf C:N:P stoichiometry at the community level, with P. euphratica as the dominant species. The TC content in P. euphratica community leaves was 442.58 mg/g, comparable to reported values from the Tarim River Basin of northwest China (437.77 mg/g) [33] but lower than the global average for terrestrial plants (461.6 mg/g) [10]. In hyper-arid regions, desert vegetation is strongly affected by drought and saline–alkali stress. In particular, saline–alkali stress accelerates chlorophyll degradation in plant leaves, reducing stomatal conductance and net photosynthetic rates, which, in turn, inhibits photosynthetic carbon fixation [34,35]. Moreover, to survive under such harsh conditions, desert plants allocate significant energy to counteracting environmental stressors. The intense selective pressures in arid regions increase metabolic costs, thereby reducing carbon fixation [36], which may explain the relatively lower leaf carbon content observed in this study. The TN content in P. euphratica community leaves was 21.69 mg/g, substantially higher than that reported in the Tarim River Basin of northwest China (13.67 mg/g) [33] and slightly exceeding both the national average for Chinese plants (20.2 mg/g) [37] and the global mean for terrestrial vegetation (20.1 mg/g) [7]. Several studies have demonstrated that nitrogenous compounds, including amino acids and imino acids, tend to accumulate in desert plant leaves under arid and saline–alkali conditions, leading to increased TN concentration [38]. The relatively high TN concentration observed in the P. euphratica community in this study may thus reflect a long-term adaptive response to the arid and saline–alkali environment.
The TP content in P. euphratica community leaves was 1.18 mg/g, significantly lower than values reported in the Tarim River Basin of northwest China (1.87 mg/g) [33], the national average for Chinese plants (1.46 mg/g) [37], and the global mean for terrestrial vegetation (1.77 mg/g) [7]. This relatively low TP content contributes to the elevated C:P and N:P ratios observed in the study area, suggesting that the P. euphratica community follows a slow-growth strategy with enhanced resistance to environmental stressors. Although previous studies have established a correlation between foliar phosphorus content and soil phosphorus availability [37], the soil available phosphorus content in our study area (5.58 mg/kg) exceeded both the national average (3.83 mg/kg) and values reported in other regions, such as the United States (3.41 mg/kg) [39]. This discrepancy suggests that foliar phosphorus content is not solely determined by soil phosphorus availability. This is consistent with our findings, which show no significant correlation between leaf TP content and available soil phosphorus (Figure 3). In arid regions, soil salinity stress plays a crucial role in limiting phosphorus uptake. High concentrations of anions such as sulfate and chloride in saline soils compete with phosphorus for plant uptake [40,41]. Additionally, for leaf phosphorus dynamics, a very important variable at the ecosystem level is nutrient resorption, which can be measured by the difference between young and old leaves. Previous studies have shown that the P resorption level in desert plants is significantly lower than the average level of global terrestrial plants, primarily because of high salt stress that significantly inhibits phosphorus resorption in desert plants, leading to reduced foliar phosphorus content [42]. In this study, a negative correlation (p < 0.05) between leaf TP content and soil electrical conductivity was detected (Figure 3), this could imply that to survive under high salt stress, plants tend to have lower leaf TP content in Populus euphratica forests. As for how phosphorus resorption contribute to the leaf phosphorus dynamics in Populus euphratica forests, researches on the characteristics of leaf nutrient resorption in different levels such as individual and community are needed in future. According to the N:P ratio theory proposed by Koerselman and Meuleman (1996) and further validated by Aerts and Chapin (2000) [11,43], vegetation with an N:P ratio below 14 is typically nitrogen-limited, whereas ratios exceeding 16 indicate phosphorus limitation. The P. euphratica community in our study exhibits an N:P ratio of 18.43. This finding is consistent with previous research on T. ramosissima communities, which reported a mean N:P ratio of 20.04 [44], and is further supported by the negative correlation (p < 0.05) between leaf N:P ratios and available soil phosphorus content in our study (Figure 3). A comparative analysis with global and regional studies reveals distinct stoichiometric characteristics in P. euphratica communities, including relatively low TC and TP contents, elevated TN content, and high N:P ratios. These findings demonstrate the ecological adaptations of P. euphratica to the unique environmental conditions of hyper-arid regions, highlighting its physiological strategies for survival under conditions of nutrient limitation and salinity stress.

4.2. Patterns and Drivers of Leaf C:N:P Stoichiometry at the Community Level

Along the riparian gradient, significant variations were observed in the P. euphratica community leaf TC, TN, and TP contents, as well as their stoichiometric ratios, with increasing distance from the riverbank. Notably, leaf TC content exhibited a significant increasing trend with distance from the river, although no significant correlations were detected with environmental factors (Figure 3). This pattern may reflect the predominantly atmospheric origin of plant carbon through photosynthetic processes [45]. In contrast, leaf TN and TP contents were decreased with increasing distance from the river (Figure 2). As essential limiting nutrients for plant growth, nitrogen and phosphorus availability in soils play a critical role in shaping plant community composition and distribution [21]. Along the perpendicular riparian gradient, increasing distance from the river is associated with a more simplified community structure and reduced species diversity in P. euphratica communities [19,44]. The decline in herbaceous plant abundance, coupled with reduced organic matter input and lower soils moisture, could explain the observed decreases in leaf TN and TP contents [18,23]. DCCA ordination results identify soil water content, bulk density, available phosphorus content, and electrical conductivity as key environmental factors influencing leaf C:N:P stoichiometric characteristics. Among these, soil water content exhibited the highest explanatory power, surpassing that of available phosphorus, bulk density and electrical conductivity, establishing it as the primary limiting factor for leaf stoichiometric variations in arid regions. This finding is consistent with previous studies [44,45,46], suggesting that P. euphratica might be experiencing more negative impacts in leaf nutrients and stoichiometry due to increased droughts or salt stress. Additionally, the significant roles of soil available phosphorus, bulk density, and electrical conductivity suggest that multiple environmental factors collectively regulate leaf stoichiometry characteristics. In this study, only soil water content was considered, In fact, physical soil properties, such as available soil water or water potential, may be more significant in explaining community relationships and environmental properties, and research on the relative importance of available soil water or water potential is needed in future.
These findings indicate that variations in leaf C:N:P stoichiometry along the vertical riparian gradient in this desert ecosystem are governed by multiple interacting environmental factors rather than a single determinant. In reality, foliar stoichiometric characteristics are shaped by both biotic and abiotic influences. This study has primarily focused on soil environmental factors to elucidate patterns of leaf C:N:P stoichiometry in P. euphratica forest along the riparian gradient, which provides valuable insights into the relationship between foliar stoichiometry and environmental conditions at a local scale. Nevertheless, future research should integrate additional biotic factors and environmental variables, including phylogenetic constraints, groundwater depth, and deep soil physicochemical properties, to elucidate the mechanisms driving foliar stoichiometric variations in arid ecosystems.

Author Contributions

Conceptualization, X.Z.; methodology, Y.Z. (Yuanrun Zheng) and X.Z.; formal analysis, X.Z. and X.L.; investigation, Y.Z. (Yuanrun Zheng), X.Z. and Y.W.; data curation, X.L.; writing—original draft preparation, X.Z. and X.L.; writing—review and editing, X.Z., Y.Z. (Yinbo Zhang), L.S., J.W., H.Q., F.G. and M.S.; funding acquisition, X.Z., Y.Z. (Yinbo Zhang), H.Q. and F.G. All authors have read and agreed to the published version of the manuscript.

Funding

This research was funded by National Natural Science Foundation of China, grant number 32171658; Talents Introduction Project of Shanxi University of Finance and Economics, grant number Z18209; Fundamental Research Program of Shanxi Province, grant number 20210302124646; Fund Program for the Scientific Activities of Selected Returned Overseas Professionals in Shanxi Province, grant number 20230027; and Humanity and Social Science Youth Foundation of Ministry of Education of China, grant number 23YJCZH050.

Data Availability Statement

Publicly available datasets are available on request from the corresponding author.

Conflicts of Interest

The authors declare no conflicts of interest.

References

  1. Wright, I.J.; Reich, P.B.; Westoby, M.; Ackerly, D.D.; Baruch, Z.; Bongers, F.; Cavender-Bares, J.; Chapin, T.; Cornelissen, J.H.C.; Diemer, M.; et al. The worldwide leaf economics spectrum. Nature 2004, 428, 821–827. [Google Scholar] [CrossRef]
  2. Ma, H.Z.; Crowther, T.W.; Mo, L.D.; Maynard, D.S.; Renner, S.S.; van den Hoogen, J.; Zou, Y.; Liang, J.; De-Miguel, S.; Nabuurs, G.-J.; et al. The global biogeography of tree leaf form and habit. Nat. Plants 2003, 9, 1795–1809. [Google Scholar] [CrossRef] [PubMed]
  3. Yang, X.; Chi, X.L.; Ji, C.J.; Liu, H.Y.; Ma, W.H.; Mohhammat, A.; Shi, Z.; Wang, X.; Yu, S.; Yue, M.; et al. Variations of leaf N and P concentrations in shrubland biomes across northern China: Phylogeny, climate, and soil. Biogeosciences 2016, 13, 4429–4438. [Google Scholar] [CrossRef]
  4. Tang, Z.Y.; Xu, W.T.; Zhou, G.Y.; Bai, Y.F.; Li, J.X.; Tang, X.L.; Chen, D.; Liu, Q.; Ma, W.; Xiong, G.; et al. Patterns of plant carbon, nitrogen, and phosphorus concentration in relation to productivity in China’s terrestrial ecosystems. Proc. Natl. Acad. Sci. USA 2018, 115, 4033–4038. [Google Scholar] [CrossRef] [PubMed]
  5. Tian, D.; Yan, Z.B.; Niklas, K.J.; Han, W.X.; Kattge, J.; Reich, P.B.; Luo, Y.; Chen, Y.; Tang, Z.; Hu, H.; et al. Global leaf nitrogen and phosphorus stoichiometry and their scaling exponent. Natl. Sci. Rev. 2018, 5, 728–739. [Google Scholar] [CrossRef]
  6. Pan, Y.J.; Cieraad, E.; Armstrong, J.; Armstrong, W.; Clarkson, B.R.; Colmer, T.D.; Pedersen, O.; Visser, E.J.W.; Voesenek, L.A.C.J.; van Bodegom, P.M. Global patterns of the leaf economics spectrum in wetlands. Nat. Commun. 2020, 11, 4519. [Google Scholar] [CrossRef] [PubMed]
  7. Reich, P.B.; Oleksyn, J. Global patterns of plant leaf N and P in relation to temperature and latitude. Proc. Natl. Acad. Sci. USA 2004, 101, 11001–11006. [Google Scholar] [CrossRef]
  8. Han, W.X.; Fang, J.Y.; Reich, P.B.; Woodward, F.I.; Wang, Z.H. Biogeography and variability of eleven mineral elements in plant leaves across gradients of climate, soil and plant functional type in China. Ecol. Lett. 2011, 14, 788–796. [Google Scholar] [CrossRef]
  9. Bruelheide, H.; Dengler, J.; Purschke, O.; Lenoir, J.; Jiménez-Alfaro, B.; Hennekens, S.M.; Botta-Dukát, Z.; Chytrý, M.; Field, R.; Jansen, F.; et al. Global trait-environment relationships of plant communities. Nat. Ecol. Evol. 2018, 2, 1906–1917. [Google Scholar] [CrossRef]
  10. Elser, J.J.; Fagan, W.F.; Denno, R.F.; Dobberfuhl, D.R.; Folarin, A.; Huberty, A.; Interlandi, S.; Kilham, S.S.; McCauley, E.; Schulz, K.L.; et al. Nutritional constraints in terrestrial and freshwater food webs. Nature 2000, 408, 578–580. [Google Scholar] [CrossRef]
  11. Aerts, R.; Chapin, F.S.I. The mineral nutrition of wild plants revisited: A re-evaluation of processes and patterns. Adv. Ecol. Res. 2000, 30, 1–67. [Google Scholar] [CrossRef]
  12. Sterner, R.W.; Elser, J.J. Ecological Stoichiometry: The Biology of Elements from Molecules to the Biosphere; Princeton University Press: Princeton, NJ, USA, 2002. [Google Scholar]
  13. Niklas, K.J.; Cobb, E.D. N, P, and C stoichiometry of Eranthis hyemalis (Ranunculaceae) and the allometry of plant growth. Am. J. Bot. 2005, 92, 1256–1263. [Google Scholar] [CrossRef]
  14. Garnier, E.; Navas, M.L.; Grigulis, K. Plant Functional Diversity–Organism Traits, Community Structure, and Ecosystem Properties; Oxford University Press: Oxford, UK, 2016. [Google Scholar]
  15. Aguirre-Gutiérrez, J.; Díaz, S.; Rifai, S.W. Tropical forests in the Americas are changing too slowly to track climate change. Science 2025, 387, eadl5414. [Google Scholar] [CrossRef]
  16. Zheng, S.X.; Shangguan, Z.P. Spatial patterns of leaf nutrient traits of the plants in the Loess Plateau of China. Trees-Struct. Funct. 2007, 21, 357–370. [Google Scholar] [CrossRef]
  17. Zhu, Y.H.; Chen, Y.N.; Ren, L.L.; Lü, H.S.; Zhao, W.Z.; Yuan, F.; Xu, M. Ecosystem restoration and conservation in the arid inland river basins of Northwest China: Problems and strategies. Ecol. Eng. 2016, 94, 629–637. [Google Scholar] [CrossRef]
  18. Wei, Y.H.; Liang, W.Z.; Han, L.; Wang, H.Z. Leaf functional traits of Populus euphratica and its response to groundwater depths in Tarim extremely arid area. Acta Ecol. Sin. 2021, 41, 5368–5376. [Google Scholar] [CrossRef]
  19. Ding, J.Y.; Zhao, W.W.; Daryanto, S.; Wang, L.X.; Fan, H.; Feng, Q.; Wang, Y.P. The spatial distribution and temporal variation of desert riparian forests and their influencing factors in the downstream Heihe River basin, China. Hydrol. Earth Syst. Sci. 2017, 21, 2405–2419. [Google Scholar] [CrossRef]
  20. Zeng, Y.; Zhao, C.Y.; Kundzewicz, Z.W.; Lv, G.H. Distribution pattern of tugai forests species diversity and their relationship to environmental factors in an arid area of China. PLoS ONE 2020, 15, e0232907. [Google Scholar] [CrossRef]
  21. Elser, J.J.; Bracken, M.E.S.; Cleland, E.E.; Gruner, D.S.; Harpole, W.S.; Hillebrand, H.; Ngai, J.T.; Seabloom, E.W.; Shurin, J.B.; Smith, J.E. Global analysis of nitrogen and phosphorus limitation of primary producers in freshwater, marine and terrestrial ecosystems. Ecol. Lett. 2007, 10, 1135–1142. [Google Scholar] [CrossRef]
  22. Fu, A.H.; Chen, Y.N.; Li, W.H. Water use strategies of the desert riparian forest plant community in the lower reaches of Heihe River Basin, China. Sci. China Earth Sci. 2014, 57, 1293–1305. [Google Scholar] [CrossRef]
  23. Zhang, X.L.; Zhou, J.H.; Guan, T.Y.; Cai, W.T.; Jiang, L.H.; Lai, L.M.; Gao, N.N.; Zheng, Y.R. Spatial variation in leaf nutrient traits of dominant desert riparian plant species in an arid inland river basin of China. Ecol. Evol. 2019, 9, 1523–1531. [Google Scholar] [CrossRef] [PubMed]
  24. Zhang, X.L.; Guan, T.Y.; Zhou, J.H.; Cai, W.T.; Gao, N.N.; Du, H.; Jiang, L.H.; Lai, L.M.; Zheng, Y.R. Groundwater depth and soil properties are associated with variation in vegetation of a desert riparian ecosystem in an arid area of China. Forests 2018, 9, 34. [Google Scholar] [CrossRef]
  25. Li, W.; Yu, T.F.; Li, X.Y.; Zhao, C.Y. Sap flow characteristics and their response to environmental variables in a desert riparian forest along lower Heihe River Basin, Northwest China. Environ. Monit. Assess. 2016, 188, 561. [Google Scholar] [CrossRef] [PubMed]
  26. Hemery, G.E.; Savill, P.S.; Pryor, S.N. Applications of the crown diameter-stem diameter relationship for different species of broadleaved trees. For. Ecol. Manag. 2005, 215, 285–294. [Google Scholar] [CrossRef]
  27. Curtis, J.T.; Mcintosh, R.P. An upland forest continuum in the prairie forest border region of Wisconsin. Ecology 1951, 32, 476–496. [Google Scholar] [CrossRef]
  28. Ding, Y.; Zhang, Z.H.; Lu, Y.; Li, L.; Islam, W.; Zeng, F.J. Film mulching counteracts the adverse effects of mild moisture deficiency, and improves the quality and yield of Cyperus esculentus. L grass and tuber in the oasis area of Tarim Basin. Front. Plant Sci. 2024, 15, 1296641. [Google Scholar] [CrossRef]
  29. Ding, D.D.; Arif, M.; Liu, M.H.; Li, J.J.; Hu, X.; Geng, Q.W.; Yin, F.; Li, C.X. Plant-soil interactions and C:N:P stoichiometric homeostasis of plant organs in riparian plantation. Front. Plant Sci. 2022, 13, 979023. [Google Scholar] [CrossRef]
  30. Zuo, X.A.; Wang, S.K.; Lv, P.; Zhou, X.; Zhao, X.Y.; Zhang, T.H.; Zhang, J. Plant functional diversity enhances associations of soil fungal diversity with vegetation and soil in the restoration of semiarid sandy grassland. Ecol. Evol. 2016, 6, 318–328. [Google Scholar] [CrossRef]
  31. Lavorel, S.; Grigulis, K.; Mcintyre, S.; Williams, N.S.G.; Garden, D.; Dorrough, J.; Berman, S.; Quétier, F.; Thébault, A.; Bonis, A. Assessing functional diversity in the field-methodology matters. Funct. Ecol. 2008, 22, 134–147. [Google Scholar] [CrossRef]
  32. Ter Braak, C.J.F.; Smilauer, P. Canoco Reference Manual and User’s Guide: Software for Ordination; Version 5.0; Microcomputer Power, Ithaca: Wageningen, The Netherlands, 2012. [Google Scholar]
  33. Shi, J.H.; Wang, X.Y.; Liu, M.X.; Ma, X.X. Stoichiometric characteristics of leaves of Populus euphratica with different stand ages and soil. Arid Zone Res. 2017, 34, 815–822. [Google Scholar] [CrossRef]
  34. Chaves, M.M.; Flexas, J.; Pinhiro, C. Photosynthesis under drought and salt stress: Regulation mechanisms from whole plant to cell. Ann. Bot. 2009, 103, 551–560. [Google Scholar] [CrossRef] [PubMed]
  35. Rahnama, A.; James, R.A.; Poustini, K.; Munns, R. Stomatal conductance as a screen for osmotic stress tolerance in durum wheat growing in saline soil. Funct. Plant Biol. 2010, 37, 255–263. [Google Scholar] [CrossRef]
  36. McCree, K. Whole-plant carbon balance during osmotic adjustment to drought and salinity stress. Funct. Plant Biol. 1986, 13, 33–43. [Google Scholar] [CrossRef]
  37. Han, W.X.; Fang, J.Y.; Guo, D.L.; Zhang, Y. Leaf nitrogen and phosphorus stoichiometry across 753 terrestrial plant species in China. New Phytol. 2005, 168, 377–385. [Google Scholar] [CrossRef]
  38. Wang, L.L.; Zhao, G.X.; Li, M.; Zhang, M.T.; Zhang, L.F.; Zhang, X.F.; An, L.; Xu, S.J. C:N:P stoichiometry and leaf traits of halophytes in an arid saline environment, Northwest China. PLoS ONE 2015, 10, e0119935. [Google Scholar] [CrossRef] [PubMed]
  39. Geng, Y.; Wu, Y.; He, J.S. Relationship between leaf phosphorus concentration and soil phosphorus availability across Inner Mongolia grassland. Chin. J. Plant Ecol. 2011, 35, 1–8. [Google Scholar] [CrossRef]
  40. Balba, A.M. Management of Problem Soils in Arid Ecosystems; CRC Press: Boca Raton, FL, USA, 1995. [Google Scholar]
  41. Zhao, C.Z.; Zhang, H.; Song, C.P.; Zhu, J.K.; Shabala, S. Mechanisms of plant responses and adaptation to soil salinity. Innovation 2020, 1, 100017. [Google Scholar] [CrossRef] [PubMed]
  42. Wang, L.L.; Wang, L.; He, W.L.; An, L.Z.; Xu, S.J. Nutrient resorption or accumulation of desert plants with contrasting sodium regulation strategies. Sci. Rep. 2017, 7, 17035. [Google Scholar] [CrossRef]
  43. Koerselman, W.; Meuleman, A.F.M. The vegetation N: P ratio: A new tool to detect the nature of nutrient limitation. J. Appl. Ecol. 1996, 33, 1441–1450. [Google Scholar] [CrossRef]
  44. Zhang, X.L.; Zhou, J.H.; Lai, L.M.; Jiang, L.H.; Zheng, Y.R. Carbon, nitrogen and phosphorus stoichiometric characteristics of Tamarix ramosissima Ledeb. shrubland and their influencing factors in a desert riparian area of China. Res. Environ. Sci. 2021, 34, 698–706. [Google Scholar] [CrossRef]
  45. Li, S.J.; Gou, W.; Wang, H.; Wu, G.Q.; Su, P.X. Characteristics of C, N, P, and their response to soil water and salt in leaves of Lycium ruthenicum in the lower reaches of the Heihe River. Acta Ecol. Sin. 2019, 39, 7189–7196. [Google Scholar] [CrossRef]
  46. Li, R.X.; Wu, X.; Gong, L. Leaf characteristics of typical desert plants in the upper reaches of Tarim River and their relationship with soil factors. Acta Ecol. Sin. 2022, 42, 5360–5370. [Google Scholar] [CrossRef]
Figure 1. Location map of the study area.
Nitrogen 06 00035 g001
Figure 2. Changes in Populus euphratica community leaf stoichiometric characteristics along the riverbank. Different Lowercase letters indicate significant differences (p < 0.05).
Nitrogen 06 00035 g002
Figure 3. Correlations between community leaf stoichiometric characteristics and environmental factors. SWC—soil water content; SBD—soil bulk density; SOC—soil organic carbon; STN—soil total nitrogen; SAP—soil available phosphorus; ST—soil temperature; SEC—soil electrical conductivity. ** p < 0.01; * p < 0.05.
Nitrogen 06 00035 g003
Figure 4. DCCA ordination diagram showing the relationships between community leaf stoichiometry and environmental factors. Black triangles indicate leaf C, N and P stoichiometric characteristics, arrows indicate environmental factors.
Nitrogen 06 00035 g004
Table 1. Environmental and vegetation characteristics of Populus euphratica forest sampling sites.
SiteDistance/mAltitude/mStructureMain SpeciesDominant Species
S150916Arbor–shrub–herbPopulus euphratica, Sophora alopecuroides, Tamarix ramosissimaP. euphratica
S2200917Arbor–shrub–herbP. euphratica, S. alopecuroides, T. ramosissimaP. euphratica
S3350914Arbor–shrub–herbP. euphratica, S. alopecuroides, T. ramosissima, Alhagi sparsifoliaP. euphratica
S4500914Arbor–shrub–herbP. euphratica, S. alopecuroides, T. ramosissima, A. sparsifolia, Peganum harmalaP. euphratica
S5650913Arbor–shrub–herbP. euphratica, S. alopecuroides, T. ramosissima, A. sparsifoliaP. euphratica
S6800913Arbor–shrub–herbP. euphratica, S. alopecuroides, T. ramosissima, P. harmalaP. euphratica
S7950912Arbor–herbP. euphratica, S. alopecuroidesP. euphratica
S81100916Arbor–herbP. euphratica, S. alopecuroidesP. euphratica
S91250915Arbor–herbP. euphratica, S. alopecuroidesP. euphratica
Table 2. Variations in community-level leaf stoichiometry along the riparian gradient.
ParameterMean ValueSDCVMinimumMaximumDfF Valuep-Value
TC (mg/g)442.5821.770.05377.08508.6982.8390.031
TN (mg/g)21.692.800.1316.3727.5784.5550.004
TP (mg/g)1.180.120.100.941.4584.3280.005
C:N20.813.450.1716.0031.6988.4420.001
C:P381.0350.850.13303.34550.7887.7220.001
N:P18.431.170.0615.2420.6382.5690.046
Disclaimer/Publisher’s Note: The statements, opinions and data contained in all publications are solely those of the individual author(s) and contributor(s) and not of MDPI and/or the editor(s). MDPI and/or the editor(s) disclaim responsibility for any injury to people or property resulting from any ideas, methods, instructions or products referred to in the content.

