Article

Data-Driven and Mechanistic Soil Modeling for Precision Fertilization Management in Cotton

by
Miltiadis Iatrou
1,
Panagiotis Tziachris
1,
Fotis Bilias
1,
Panagiotis Kekelis
1,
Christos Pavlakis
1,
Aphrodite Theofilidou
1,
Ioannis Papadopoulos
1,
Georgios Strouthopoulos
1,
Georgios Giannopoulos
1,
Dimitrios Arampatzis
1,
Evangelos Vergos
1,
Christos Karydas
2,
Dimitris Beslemes
3 and
Vassilis Aschonitis
1,*
1
Soil and Water Resources Institute, Hellenic Agricultural Organization DIMITRA, 57001 Thessaloniki, Greece
2
Ecodevelopment S.A., 57010 Thessaloniki, Greece
3
Institute of Industrial and Forage Crops, Hellenic Agricultural Organization DIMITRA, 41335 Larissa, Greece
*
Author to whom correspondence should be addressed.
Nitrogen 2025, 6(2), 29; https://doi.org/10.3390/nitrogen6020029
Submission received: 6 March 2025 / Revised: 10 April 2025 / Accepted: 17 April 2025 / Published: 19 April 2025

Abstract

:
This study introduces a novel methodology for predicting cotton yield by integrating machine learning (ML) with mechanistic soil modeling. This hybrid approach enhances yield prediction by combining data-driven ML techniques with soil process modeling. Using the developed yield model, yield curves for various nitrogen (N) levels can be constructed to identify the optimal N dose that maximizes yield. Estimating cotton N requirements is crucial, as growers often apply excessive N, exceeding the amount needed for maximum yield. By comparing the Mean Absolute Error (MAE) between predicted and observed cotton yield values across three ML algorithms, i.e., Random Forest (RF), XGBoost, and LightGBM, the RF model achieved the lowest error (422.6 kg/ha), outperforming XGBoost (446 kg/ha) and LightGBM (449 kg/ha). Additionally, the RF model exhibited high sensitivity to N fertilization, ranking N as the most influential variable in feature importance analysis. Furthermore, phosphorus (P) availability in the soil model was found to be a significant factor influencing the RF yield model, highlighting P’s crucial role in cotton growth and productivity.

1. Introduction

Cotton (Gossypium hirsutum L.) is among the most important crops cultivated in Greece, accounting for approximately 9% of the country’s total agricultural output [1]. Greece is the largest cotton producer in Europe and a major exporter, making efficient cotton cultivation crucial for both economic stability and agricultural sustainability [2].
Cotton production in Greece is highly intensive, requiring substantial input application at various growth stages [3]. However, current nitrogen (N) fertilization practices rely heavily on growers past experiences and manual judgement, where previously successful N rates are repeatedly applied to the same field parcel [4]. While this approach may yield satisfactory results, it may lead to inefficiency of N application. This includes excessive fertilizer use, increased production costs, and heightened environmental risks due to N losses [5,6]. On the other hand, growers are reluctant to apply low N doses, because a potential yield reduction would result in economic losses that outweigh the savings from reduced fertilization costs [7].
Several cotton crop simulation models have been developed to simulate plant growth and soil interactions, including GOSSYM, COTONS, and COMAX [8,9,10,11,12]. These models integrate both plant physiology and soil processes, providing valuable insights into cotton growth under various environmental conditions. However, despite their sophistication, these models face significant limitations in real-world applications. The cost of obtaining the necessary input data is often prohibitively high, and under commercial farming conditions, the quality of input data is frequently compromised [13].
Complex simulation models try to capture cotton growth and soil interactions, but they are resource-intensive to develop and operate. Many require data inputs that are not readily available to growers [14]. Furthermore, existing models struggle to fully represent the intricate plant–soil interactions, as incorporating all known processes would lead to models of extreme complexity. Additionally, knowledge gaps remain in our understanding of how plants respond to their physical environment, further limiting the predictive accuracy of such models. Moreover, the predictive accuracy of the cotton growth simulation models is often limited by outdated physiological parameters or incomplete representations of biological processes. For instance, they lack integration with real-time data and cannot easily adapt to changes in physiological parameters or fertilizer inputs, like new varieties, new types of fertilizers, etc. As our understanding of plant and soil interaction evolves, it becomes increasingly difficult to incorporate every relevant mechanism into a single mechanistic model without making it unmanageable [15,16]. These limitations point to a research gap in developing a system that balances accuracy, usability, and adaptability. To address this, our study explores a hybrid modeling approach that combines the explanatory power of a mechanistic soil model with the pattern recognition strengths of ML. This approach aims to improve prediction performance while remaining responsive to real-world data constraints, as ML models can easily be retrained with new data and stay updated with the evolving dynamics of cotton cropping. This will finally offer a more practical decision support framework for site-specific N management.
By leveraging field data, environmental factors, and advanced soil modeling techniques, this approach finally seeks to enhance N use efficiency, minimize excessive fertilizer application, and promote sustainable cotton production in Greece. ML offers a powerful tool for capturing nonlinear relationships in complex datasets by uncovering intricate patterns in environmental variables that traditional statistical methods often fail to model [17,18]. Additionally, advanced soil modeling techniques provide an unprecedented wealth of information that could even further reduce prediction error [19].
This study explores the incorporation of mechanistic soil model outputs as features in ML algorithms, enabling a more holistic representation of the influence of soil variability on yield and improving prediction accuracy. The primary objective is to develop an ML model for cotton yield prediction to select the optimum N fertilizer dose. The study also explores the inclusion of soil model equations in the feature space of the training ML model to better capture soil variability.

2. Materials and Methods

2.1. Study Area

The study area is in the Drama Plain, northern Greece, where cotton is a major crop, cultivated on approximately 3573 hectares in 2023 [20]. The region exhibits a temperate Mediterranean climate, with cool and wet springs and hot, dry summers. Rainfall is scarce during summer, making irrigation a critical factor for sustaining crop productivity. However, growers typically apply sufficient irrigation to meet the crop’s water requirements. In total, 309 cotton field parcels were sampled for soil analysis, and cotton yield was reported by the growers. Moreover, an extensive survey was conducted to collect all the agronomic information associated with these parcels from the farmers (such as yields, fertilization types and rates, agrochemicals’ applications, etc.). Figure 1 shows the cotton field parcels where this study was conducted.

2.2. Soil Properties

A composite sample from 0–15 cm depth per field parcel was extracted during winter before the cotton growing season (summer 2024). The samples were sent for full analysis to the Soil and Water Resource Institute, Hellenic Agricultural Organization (DIMITRA). The samples underwent full analysis for a set of 18 soil properties: sand%, clay%, silt%, bulk density, soil acidity (pH), electrical conductivity (EC), organic matter (OM), CaCO3, nitrate nitrogen, phosphorus, potassium, magnesium, iron, zinc, manganese, copper, boron, and calcium. The pH and EC values were measured using the saturated paste method with specific meters [21]. Nitrate–nitrogen was extracted using the 2M potassium chloride (KCl) extraction method quantified via the UV-VIS spectrophotometric procedure [22], while organic matter was determined through the Walkley–Black method [23]. The CaCO3 content was assessed through titration [24], and the soil texture was evaluated using the Bouyoucos hydrometer approach [25]. The Olsen method was employed for P [26]. The ammonium acetate method was used for the extraction of Na, K, Ca, and Mg, and these elements were quantified using Inductively Coupled Plasma Spectroscopy (ICP) [27]. Additionally, Mn, Cu, Fe, and Zn were extracted using DTPA and quantified with ICP [28]. Soil B was extracted using the hot 0.02M CaCl2 method, which involves boiling the soil solution for 5 min, and the extracted B was measured using ICP [29].

2.3. Yield, Crop Spectral Properties, and Farming Practices

Yield data for each field parcel were provided by the growers, with the reported values representing the mean yield per parcel expressed in cotton seed yield kg/ha. These average values were subsequently used in the analysis.
The main use of the collected optical satellite data in the current study was to assess the relationship between the Chlorophyll Red Edge Index (CLRE), which is a known vegetation index for cotton [30], and yield, and to thus validate the quality of the yield data. In this research, CLRE was estimated from Sentinel-2 images acquired from the Open Access Hub of the Copernicus Land Monitoring Service on 17 August 2024, a date close to cotton harvest.
The CLRE based on the Sentinel-2 images was calculated based on the following equation:
C L R E = N I R R e d E d g e 1
where NIR is near-infrared band and RedEdge is the red-edge band [30,31,32].
The Modified Chlorophyll Absorption Ratio Index (MCARI) was also calculated based on the Sentinel-2 images according to the following equation,
M C A R I = V N I R R E D 0.2 × V N I R G R E E N × ( V N I R R e d )
using Sentinel-2 Band 5 (VNIR), Band 4 (Red), and Band 3 (Green) [33]. The Sentinel-2 images were captured on 17 August 2024, near the harvesting period, to facilitate the correlation between cotton yield and remote sensing indices.
Farming practices may affect crop growth dramatically, as they concern the type of cultivar seeded, the N, the potassium and phosphorus rates, irrigation, drainage, weed management, disease and pest control, etc. Information on all these practices was available from the growers.

2.4. The Soil Model

The equations for the soil model were based on Koukoulakis and Papadopoulos [34].

2.4.1. Phosphorus Correction Coefficient (PCC)

Phosphorus plays a pivotal role in cotton by increasing plant growth and yield, as it plays an important role in the energy transfer processes [35]. The extent to which phosphorus is available in soil depends on several soil parameters, including organic matter content, calcium carbonate levels, pH, and the percentage of clay content [36]. The following approach was used to estimate phosphorus fixation and availability in the soil.
Thus, the Phosphorus Fixation Index (PFI) was calculated as a function of the soil properties, including the organic matter content (O.O.), calcium carbonate (CaCO3), Olsen phosphorus availability, pH, and clay content.
PFI = (0.013 × C) + (0.0634 × CaCO3 + 0.0002) + (0.0691 × O.O. − 0.0005) − (0.3964 × pHadj) − (0.0038 × P) + 6.72,
where C is the clay content (%), CaCO3 is the calcium carbonate content (%), P is the Olsen available phosphorus content in soil, and pH adj is the adjusted soil pH, defined as 5.5 if pH is less than 5.5; otherwise, it remains unchanged.
The Phosphorus Fixation Percentage (PFP) was defined as the proportion of phosphorus that is fixed in the soil and thus unavailable for plant uptake. It was calculated as follows:
PFP = ((PF1 − 1.5 × Gs) × 100)/PFI
where Gs is the specific gravity of the soil. A higher PFP value indicates a greater proportion of P being fixed, reducing its availability to the plants.
To express the fraction of P that remains available for plant uptake, phosphorus availability was expressed as follows:
PCC = 1 − (PFP/100)

2.4.2. Cotton Phosphorus Need

P need for cotton was calculated based on the soil texture classification. Thus, for sandy soils, P_need = 12.466 × e−0.098P.
For loamy soils, P_need = 12.006 × e−0.086P.
For clayey soils, P_need = 10.755 × e−0.079P,
where P is the Olsen available phosphorus.

2.4.3. Phosphorus Soil Availability

Phosphorus (P) availability in soil is influenced by soil texture, P content, and organic matter mineralization. To estimate the total available P, Koukoulakis and Papadoulos (2001) [34] defined a set of equations that were based on experimental data to determine P release from soil particles and organic matter, considering different soil textures. For sandy, loamy, and clayey soils, the P release coefficients were set to 1.3, 1.6, and 1.9, respectively. The P release from soil particles was determined as a function of Olsen P availability and a texture-specific release factor. In sandy soils, the released P was calculated as the Olsen P multiplied by 0.53. In loamy soils, the release factor was set to 0.46, and in clayey soils, it was set to 0.43. The P contribution from organic matter mineralization was set out as a function of the organic matter content of the soil and texture-specific mineralization. In sandy soils, the P release from organic matter was calculated as the organic matter content multiplied by 3.99. In loamy soils, the mineralization factor was 3.45, and in clayey soils, it was set to 3.22.
The total P availability is computed as the sum of the above factors. Thus,
P_availability = Prelease + Psoil + (POM × PCC), where PCC was analyzed above.

2.4.4. Nitrogen Soil Losses

Nitrogen (N) is the most critical nutrient limiting plant growth if it is not supplied in sufficiency [37,38,39,40]. Three primary N losses were considered for calculating the total N losses from soil: pH-induced N losses, CaCO3 N losses, and N losses due to denitrification and leaching.
pH-induced N losses (PHNL) were determined based on soil texture:
In sandy soils, PHNL = 5.44 × pH − 29.91.
In loamy soils, PHNL = 4.12 × pH − 22.66.
In clayey soils, PHNL = 2.72 × pH − 14.96.
CaCO3-Induced Nitrogen Losses (CCNL)
If the CaCO3 is greater than 10%, N losses are assigned a fixed value of 10.2 kg N/stremma.
If the CaCO3 is less than 10%, N losses are calculated as 1.03 × CaCO3, and if CaCO3 is 0, then N losses are assumed to be negligible.
N Losses due to Denitrification and Leaching (DLNL)
In sandy, loamy, and clayey soils, the loss is set to 35%, 25%, and 10%, respectively.
The Nitrogen Efficiency Factor (NEF) is derived by integrating the three loss components into an equation, as follows:
NEF = (1 − PHNL/100) × (1 − CCNL/100) × (1 − DLNL/100)
The final N soil losses are calculated through the following equation:
N_soil_losses = 100 × (1 − NEF)

2.4.5. Manganese Need

Manganese (Mn) is an essential micronutrient that plays a critical role in plant metabolic processes, including photosynthesis and enzyme activation [41].
Estimation of the Mn Fixation Factor (MnFF) was calculated according to the following equation: MnFF = 7.05/((0.5101 × O.O. + 0.0012) + (0.11 × pH) − (0.13 × CaCO3) + 58.8).
To determine the fraction of Mn that remains available for plant uptake, the manganese conservation coefficient was computed as follows:
MnCC = 1 − MnFF
The Mn requirement for cotton was also calculated as a function of the existing Mn concentration in soil and soil texture. The relationships were defined as follows:
In sandy soils, Mn_requirement = − 0.23 × Mn + 2.09.
In loamy soils, Mn_requirement = − 0.20 × Mn + 1.82.
In clayey soils, Mn_requirement = − 0.19 × Mn + 1.69.
The final Mn_need was calculated according to the following equation:
Mn_need = 0.7 × Mn_requirement/MnCC

2.4.6. Copper Need

Copper (Cu) is an essential micronutrient involved in several enzymatic processes and plant metabolic functions [42]. However, its availability in soil is influenced by organic matter content, pH, and clay content [34].
Estimation of the Copper Fixation Factor (CuFF) was calculated using the following equation:
CuFF= 1.38/(0.51 × O.O. − 0.84 × pH − 0.026 × C + 9.35)
To determine the fraction of copper that remains available for plant uptake, the Copper Conservation Coefficient (CuCC) was computed as follows:
CuCC = 1 − CuFF
The copper requirement for crops was also calculated as a function of the existing Cu concentration in soil and soil texture. The relationships were defined as follows:
In sandy soils, Cu_requirement = −0.23 × Cu + 0.09.
In loamy soils, Cu_requirement = −0.20 × Cu+0.08.
In clayey soils, Cu_requirement = −0.19 × Cu+0.075.
The final corrected copper dose (Cu_need) was calculated as follows:
Cu_need = Cu_requirement/CuCC
This model provides a structured approach to assessing Cu availability in the soil and determining the required Cu fertilization for optimal plant growth.

2.4.7. Potassium Need

Potassium (K) is a vital macronutrient required for plant growth, playing a crucial role in water regulation, enzyme activation, and overall plant health [43]. The availability of potassium in soil is influenced by soil texture and initial Κ concentration [44].
The Κ requirement (K_need) was calculated as a function of the existing K concentration in soil and soil texture. The relationships were defined as follows:
In sandy soils, K_need = 51 × e−0.018K.
In loamy soils, K_need = 44.7 × e−0.016K.
In clayey soils, K_need = 39.16 × e−0.015K.
This model accounts for the differences in potassium retention across various soil textures, with sandy soils requiring higher potassium supplementation due to their lower cation exchange capacity compared to loamy and clayey soils. The results can be used to optimize potassium fertilization strategies, ensuring adequate potassium availability for plant growth while minimizing nutrient losses.

2.4.8. Magnesium Correction Coefficient

Magnesium (Mg) is an essential nutrient for plant growth, playing a key role in chlorophyll formation, enzyme activation, and overall metabolic functions [45]. However, its availability in soil is significantly influenced by CaCO3 levels [46].
The Magnesium Precipitation Factor (MgPF) was calculated using the following equation:
MgPF = −0.029 × (CaCO3)2 + 3.16 × CaCO3 − 0.0018
To determine the fraction of magnesium that remains available for plant uptake, the Magnesium Correction Coefficient (MgCC) was computed as follows:
MgCC = 1 − MgPF/100
This model accounts for the influence of calcium carbonate on magnesium retention, where higher CaCO3 concentrations can lead to increased magnesium precipitation, reducing its availability to plants. The MgCC provides an essential parameter for optimizing magnesium fertilization strategies, ensuring sufficient magnesium availability for plant uptake while minimizing nutrient loss due to precipitation.

2.4.9. Zn Correction Coefficient and Cotton Zn Need

Zinc (Zn) is an essential micronutrient required for various physiological and biochemical processes in plants, including enzyme activation and protein synthesis [47]. Its availability in soil is influenced by organic matter content, pH, clay content, and phosphorus levels [34].
The Zinc Fixation Percentage (ZnFP), which represents the proportion of zinc that becomes chemically fixed and unavailable for plant uptake, was calculated using the following equation:
ZnFP = 0.572/((0.313 × O.O.) − (0.23 × pH − 0.0018) − (0.02 × C − 0.0003) + (0.01 × P) + 0.0025))
To determine the fraction of zinc that remains available for plant uptake, the Zinc Correction Coefficient (ZnCC) was computed as follows:
ZnCC = 1 − ZnFP/100
A higher ZnCC value indicates greater zinc availability, while a lower value suggests increased zinc fixation in the soil. This model provides a quantitative approach to assessing zinc availability and optimizing fertilization strategies to ensure adequate Zn supply for plant growth while minimizing nutrient loss due to fixation.
Finally, the cotton Zn need (Zn_need) was estimated based on the soil Zn concentration and texture classification. Thus, if the soil texture was classified as sandy, the zinc needed dose was computed using the following equation:
ZnD = −0.23 × Zn + 0.40
If the soil texture was classified as loamy, the zinc dose was determined using the following equation:
ZnD = −0.20 × Zn + 0.34
And, if the soil texture was classified as clayey, the zinc dose was determined using the following equation:
ZnD = −0.19 × Zn + 0.32
The Zn_final dose accounts for the zinc conservation coefficient to refine the final zinc requirement. It was determined as follows:
Zn_final = ZnD/ZnCC
This model provides a structured approach for optimizing the Zn fertilization strategy. By considering zinc fixation, conservation, and soil texture, it ensures efficient zinc management for improved plant growth and productivity.

2.4.10. Boron Correction Coefficient for Medium Soils (BCCM)

Boron (B) is an essential micronutrient that plays a key role in cell wall formation, sugar transport, and reproductive development in plants [48]. However, its availability in soil is influenced by pH, soil texture, and the native boron content [49].
The Boron Fixation Factor for Medium Soils (BFFM) was calculated through a series of equations incorporating soil pH and boron concentration.
First, the Boron Fixation Factor for Exchangeable Boron (BFFE) was determined using the following equation:
BFFE = 149.3/(1.49 × pH − 5.03)
This value represents the portion of boron that becomes unavailable due to fixation in the soil matrix.
To further refine the model, the Residual Soil Boron (RSB) was determined as follows:
RSB = 67.17 × B
where B represents the boron concentration in the soil.
Additionally, the Residual Soil Boron Effect (RSBE) was defined as follows:
RSBE = (206.38 × B + 0.0004)
The Boron Fixation Factor for Medium Soils (BFFM) was then computed by combining these elements:
BFFM = ((RSB + 31.22) × 100))/(RSBE + 63.22) + BFFE
Finally, the Boron Correction Coefficient for Medium Soils (BCCM), which represents the fraction of boron that remains available for plant uptake for medium soils, was determined as follows:
BCCM = 1 − (BFFM/100)
A higher BCCM value indicates greater boron availability for the medium soils, while a lower value suggests increased boron fixation. This model provides an analytical framework for assessing boron availability and guiding fertilization strategies to ensure optimal boron supply for plant growth in medium-textured soils. Because boron availability in medium soils was found to be significant for the model presented in this study, only the equations related to boron availability for medium soils are provided here. Including all soil model equations would make this section excessively lengthy.

2.5. Machine Learning
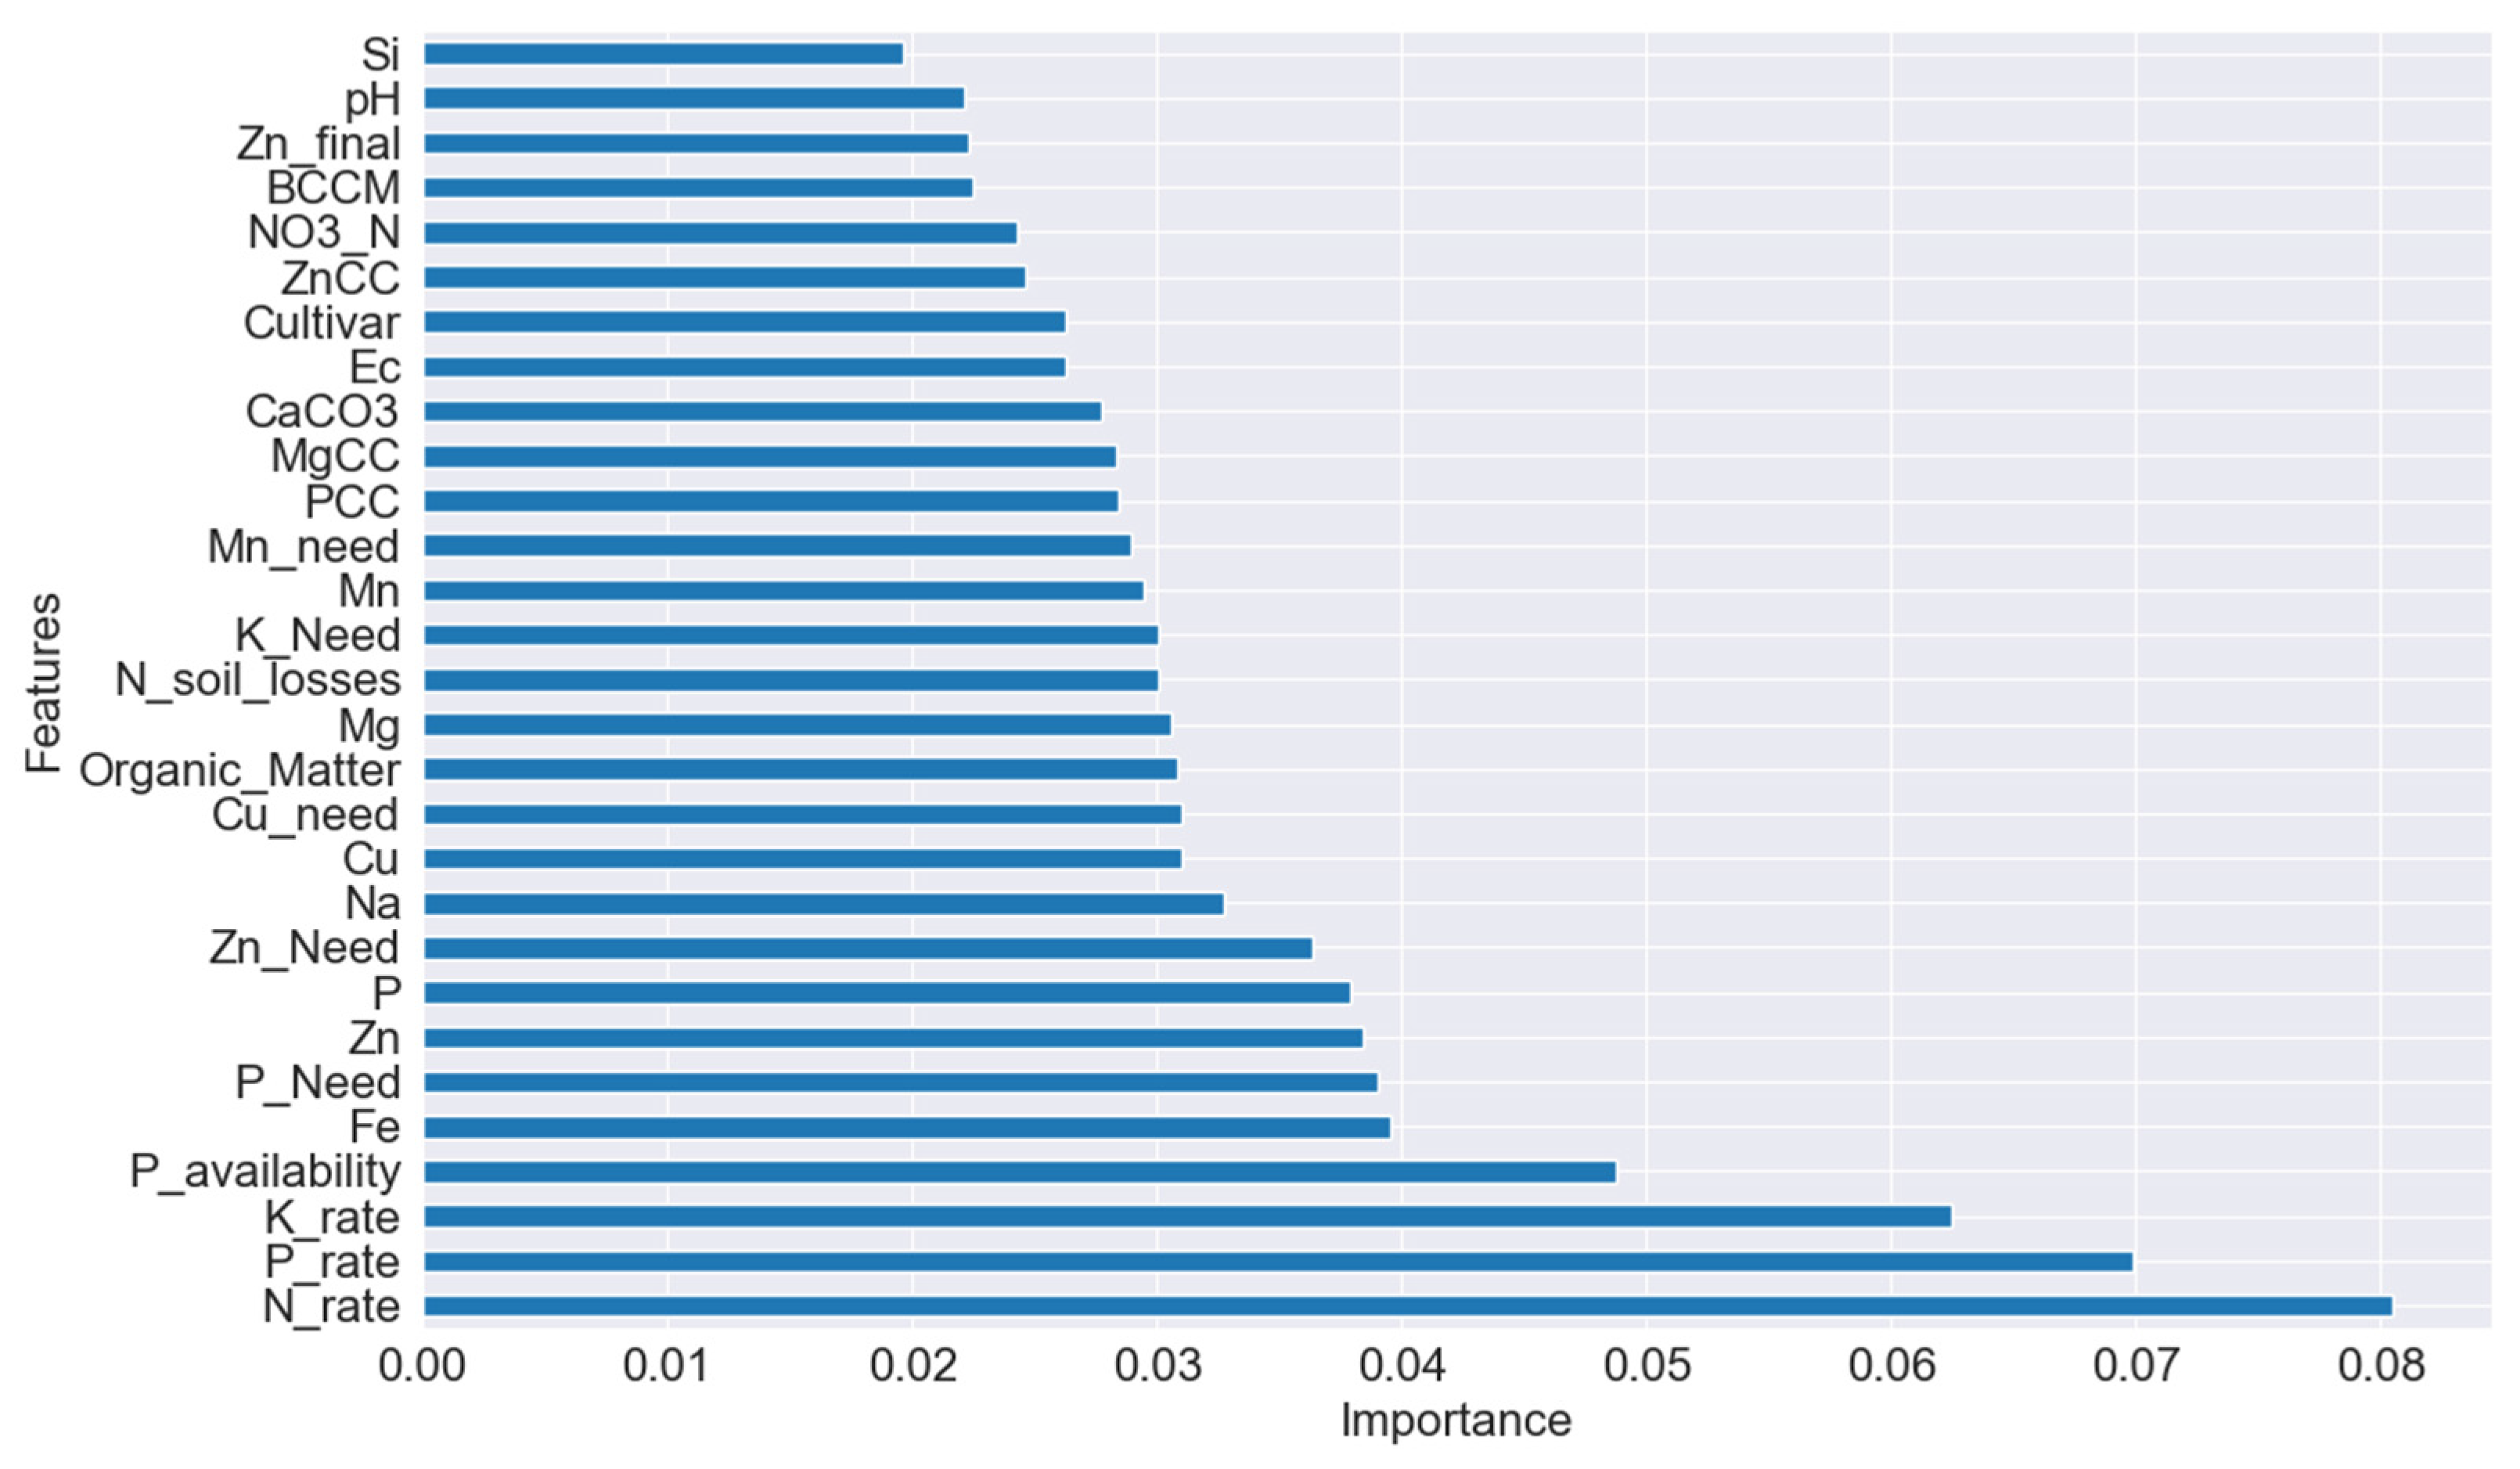
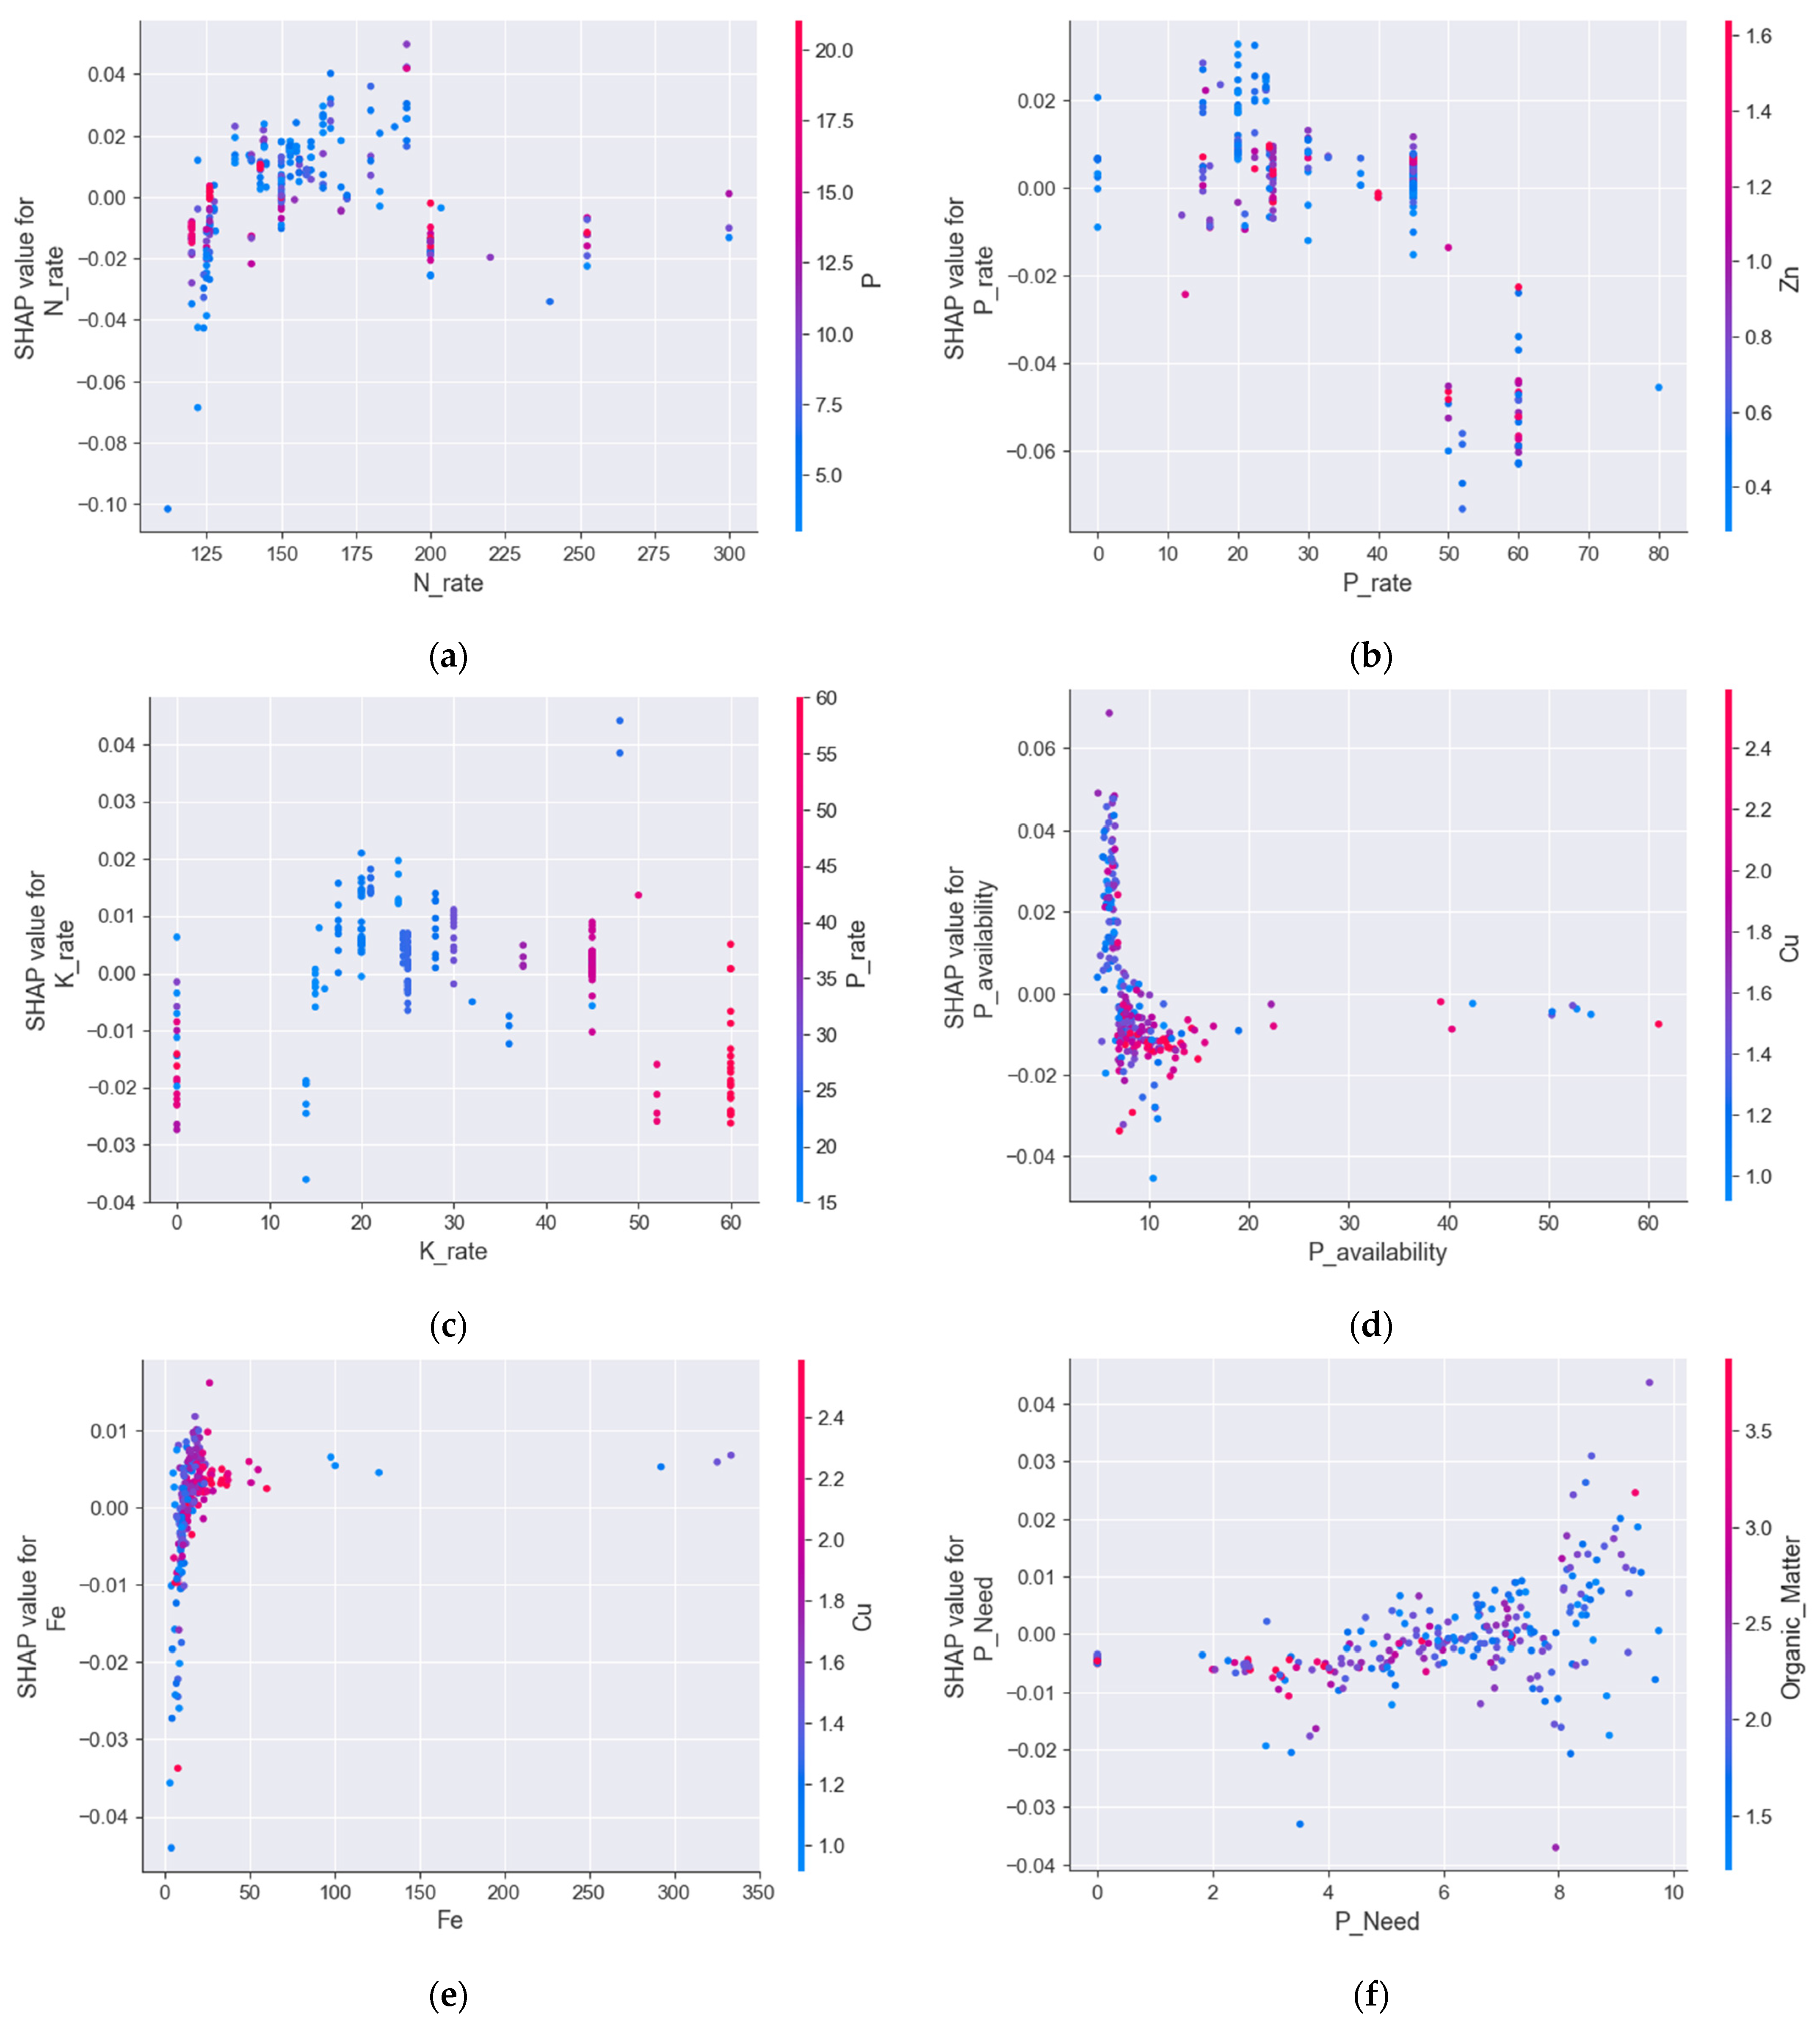
Three machine learning (ML) algorithms were tested here: Random Forest (RF), Extreme Gradient Boosting (XGBoost), and LightGBM. They are widely used ML algorithms, each offering unique advantages for predictive modeling. These three ML algorithms were selected because tree ensemble models are usually recommended for regression problems with tabular data. According to Swartz-Ziv and Armon [50], a systematic comparison of XGBoost with deep learning models on various datasets with tabular data showed that XGBoost outperformed the deep models. The authors explained that in cases where the deep models performed better compared to tree models, there was probably a more extensive hyperparameter search. Even in such cases, tree-based models generally require significantly less hyperparameter tuning than deep learning models. Moreover, although the dataset consists of 309 cotton field parcels, which reflects the considerable scale and effort involved in this study, it remains relatively small in the context of deep learning requirements. As such, deep learning approaches would not be suitable or efficient for this application.
RF is an ensemble learning method based on bagged decision trees [51]. It enhances model stability by constructing multiple decision trees using different subsets of the training data, drawn with replacements. This technique reduces the correlation between individual trees by randomly selecting a subset of features at each split, leading to a more generalized model. Unlike XGBoost and LightGBM, RF does not rely on boosting but rather improves prediction accuracy by averaging predictions from multiple decision trees. This approach effectively addresses the overfitting problem commonly observed in algorithms relying on boosting. RF was implemented using the scikit-learn library [52].
XGBoost is a decision-tree-based algorithm that employs the gradient boosting framework, achieving state-of-the-art performance in many ML tasks [53]. It improves prediction accuracy by focusing on areas of high error within the dataset, refining the initial weak predictors through iterative adjustments. XGBoost is implemented via the xgboost Python library [53].
LightGBM is an advanced gradient boosting model introduced by Microsoft, which offers several improvements over other ML algorithms employing the gradient boosting framework [54]. LightGBM is designed for large datasets and high-dimensional problems, making it an effective alternative to XGBoost in cases requiring high-speed training and lower resource consumption. LightGBM was implemented using the lightgbm library [54].
All models were trained using 5-fold cross-validation on the training set to ensure robustness, and model performance was evaluated on the testing set using as a metric the Mean Absolute Error (MAE). The Optuna library was used for the hyperparameter tuning of the three ML algorithms [55]. The optimized hyperparameters for all models are presented in Table 1.
To better elucidate the factors influencing cotton yield, the Shapley Additive Explanation (SHAP) analysis was employed [56,57]. More advanced algorithms like RF, XGBoost, and LightGBM excel at identifying nonlinear patterns in data but pose challenges in terms of interpretability. This approach is particularly valuable for interpreting nonlinear models, which, despite their high predictive accuracy, often lack transparency in their decision-making process. To enhance visualization for the SHAP dependency plots, the SHAP library was used, providing deeper insight into the relationships between soil variables and cotton yield.
The entire process, including data analysis, model development, and visualization, was carried out in Python [58], with tools like Matplotlib 3.10.1 assisting in creating visual representations [59].

3. Results

A cotton yield prediction model was developed using three ML algorithms: RF, XGBoost, and LightGBM. Among them, the RF model achieved the highest accuracy, with the lowest MAE. The CLRE vegetation index showed the strongest correlation with actual yield, confirming that yield data obtained by the growers were reliable. Feature importance analysis and SHAP dependence plots revealed that the N application rate was the most influential factor in predicting yield, followed by variables related to phosphorus and potassium availability. Also, trace elements, such as zinc, copper, and iron, followed in importance. The analysis also highlighted key nutrient interactions and thresholds beyond which additional fertilization no longer provided yield benefits and could potentially have adverse effects.
A strong correlation (r2 = 0.72) was observed between cotton yield and the CLRE index, suggesting that the reported yields from growers aligned well with the cotton yield prediction index (Figure 2). Therefore, the yield variable was utilized as the target variable in the ML algorithm to develop a cotton yield model aimed at identifying the optimal N rates for maximizing yield. The CLRE was superior to the MCARI index for expressing cotton yield, as it correlated better with yield compared to MCARI (r2 = 0.66).
Using the Mean Absolute Error (MAE) between the predicted and observed yield values for all tested models, it was found that the RF model resulted in the lowest error compared to the other two models. Thus, the MAE for the RF model was equal to a cotton seed yield of 422.6 kg/ha compared to 446 and 449 kg/ha for XGBoost and LightGBM, respectively.
Among the included parameters, the N_rate was the most influential parameter for the RF model, which was expected. This is because the N rate is key in cotton growth and yield. The feature importance is presented in Figure 3, and it reflects the mean decrease in impurity (MDI), which quantifies how much each feature contributes to reducing the prediction error (i.e., variance) across all decision trees in the forest. During model training, the feature importance algorithm loops through every tree and recursively evaluates each split. At every decision node, it identifies the feature used for the split and calculates the resulting improvement in model performance. This improvement, weighted by the number of samples affected by the split, is added to that feature’s cumulative importance score. These contributions are summed across all splits in all trees of the forest. After training, the total importance scores are normalized so that they sum to one. Each variable included in the model is thus assigned a relative importance value based on how much it helped reduce the prediction error across the ensemble [60]. The feature importance plot in Figure 3 shows, also, that the soil model was a significant determinant of cotton yield. Thus, the importance of many variables coming from the soil model, e.g., P_availability, P_need, Zn_need, Cu_need, N_soil_lossses, K_need, Mn_need, PCC, etc., showed that these variables explained a significant proportion of the yield variability.
When the CLRE, as recorded on August 17 by Sentinel-2, was included in the input parameters of the model, the MAE only dropped from 422.6 kg/ha of cotton seed yield to 414.6 kg/ha.
SHAP dependence plots show the influence on yield of the first six most significant variables in the feature importance score (Figure 4). Figure 4a shows an upward trend in yield with an increasing N rate, up to approximately 200 kg N/ha. Beyond this threshold, the SHAP values tend to decline or stabilize, suggesting diminishing returns or even a potential negative effect on yield at excessive nitrogen levels. The color scale indicates P concentration, highlighting potential interactions between these nutrients. As N is critical for cotton growth and yield, Figure 4a gives insight into the importance of accurately estimating N needs of the cotton crop, as above the 200 kg N/ha limit, no yield benefit was identified.
Variables related to P availability from the soil model were highly influential in the RF yield model, such as P_rate, P_availability, and P_Need, as shown in Figure 4. Figure 4b suggests that yield increases with P application up to around 30–40 kg P/ha. However, at higher rates beyond this range, SHAP values decrease, indicating that excess P may not contribute positively to yield and could even have negative impacts. The color gradient, representing zinc (Zn) levels, implies a potential interplay between P and Zn availability. It is known that high applications of P fertilizers increase the risk of Zn deficiency, especially in soils with raised pH [61]. Because most of the field parcels used in the experiment were alkaline, a negative interaction between P and Zn availability was anticipated.
Figure 4c demonstrates that yield is positively influenced by potassium application up to approximately 30–40 kg K/ha. Beyond this point, SHAP values become more scattered, suggesting that excess potassium does not necessarily translate into additional yield benefits. Notably, at higher K_rate levels (>40 kg/ha), the SHAP values tend to drop when accompanied by higher P_rate values (indicated by red points).
Figure 4d reveals a strong nonlinear relationship, with the most significant yield impact occurring at low P availability (below 10 kg P/stremma). This finding is crucial because, when interpreted alongside Figure 4b, it highlights the need to align P application rates with soil P availability. Otherwise, increasing the P rate could lead to a decline in cotton yield. Typically, growers apply a standard P rate based on the phosphorus content of chemical fertilizers without considering the actual P availability in their soils. As P availability increases, there is a negative effect on yield, likely due to indirect factors, such as zinc deficiency in the young plant meristems. Interestingly, Figure 4d reveals an interaction of P availability with copper (Cu). At low P_availability, data points with low copper levels (blue points) are generally associated with more positive SHAP values. This probably reveals that growers applying high doses of P fertilizers may make intensive use of copper for the control of fungal diseases.
Figure 4e shows that yield increases with increasing Fe concentrations in soil, indicating that iron availability is crucial for cotton yield. However, at high Fe levels (>100 mg/kg), the influence on yield becomes neutral. Regarding the interaction with copper, the color gradient reveals that higher Cu concentrations (red points) tend to correspond with slightly more positive SHAP values at lower Fe levels.
Finally, Figure 4f suggests a gradual increase in yield influence with increasing P_Need values up to around 8–10 kg P/stremma. This implies that higher phosphorus demand in plants correlates with increased yield response. The color scale represents organic matter levels, which could be influencing P retention and availability in the soil. Thus, in low organic matter (blue points), there is obviously lower P availability, and the estimated P need is increased—a trend that is expected.

4. Discussion

Obviously, the CLRE index correlates well with yield, as shown in Figure 2, because the images were taken close to the cotton harvest. However, the soil model, along with the farming practices, were adequate in explaining the yield variance, and, thus, the MAE did not increase significantly when the CLRE index was excluded from the model. This proves that the soil model aided in the prediction accuracy of the cotton RF yield model and, thus, it can safely be used for estimating the N rate of the cotton crop. The concept of using a yield model to predict the optimal N rate was described by Iatrou et al. [62], where yield curves were generated by supplying varying N rates to the algorithm. Ultimately, the minimum N rate that maximized yield was recommended to growers. A similar approach is applied here, where the optimal N rate for each field parcel is determined based on a constructed yield curve for various rates of N of each field parcel. The ideal fertilization dose is identified at the point where the maximum yield is achieved with the lowest N input.
N is critical for cotton growth and yield, as lack of N reduces the yield and quality of cotton bolls [12]. Visible symptoms of N deficiency are light green plants and yellow lower leaves that, in some cases, are brownish in color. On the other hand, N increases plant height and boll bearing capacity [8]. Figure 4a illustrates the crucial role of N in cotton yield, showing a positive correlation between yield and increasing N levels. However, beyond 200 kg N/ha, the likelihood of further yield gains becomes uncertain, with a potential risk of yield reduction rather than improvement. Excess N usually results in poor fruiting, delayed maturity, difficult defoliation, and boll rot. Also, excess N can intensify insect infestations and promote disease outbreaks. Thus, for cotton, as for many other crops, N balance is critical for optimum plant growth and yield.
The integration of ML with mechanistic soil modeling, as explored in this study, presents a significant advancement in precision N management for cotton cultivation. A major strength of this study is the robust dataset collected from 309 cotton field parcels, coupled with soil and yield analysis. The inclusion of the soil model ensures a comprehensive understanding of nutrient interactions and their impact on yield. With the inclusion of more indicators related to soil variability, this integrated approach, which leverages both a data-driven ML model and soil process simulation, allows for calculating the optimum dose of N for cotton, ensuring efficient use while minimizing waste. This tool enables growers to optimize N use effectively, alleviating the complexity of comprehending the intricate mechanisms behind cotton N losses and demand. The model presented in this study has increased sensitivity to the N fertilization rate, as the N rate ranks as the most influential factor in the feature importance score. This holds significant agronomic value, as growers often face challenges in determining the optimal N dose for their fields. N is the key fertilization input for cotton, directly influencing yield by either enhancing it when applied at optimal levels or reducing it when over-supplied.
Variables related to P availability and cotton P need were high in the feature importance score. This is because P is a key nutrient for cotton growth and yield [35]. P has low mobility in the soil, and mobility to the roots is the prime limitation to uptake, particularly for alkaline soils rich in CaCO3, which characterizes most of the field parcels used in the current study. The limited availability of P in the soil significantly restricts cotton productivity, as P deficiency in cotton plants leads to slower shoot growth, delayed flower bud formation, dark green foliage, and necrosis of lower buds, often accompanied by yellowing of older leaves. P improves root development, water use efficiency, energy balance, the weight of fiber, and fiber quality [63]. Figure 4d, though, shows that yield decreases at P availability above 10 kg P/stremma. On the other hand, Figure 4b shows that yield increases up to a dose of 30 kg P/ha and then starts decreasing. This decrease is probably due to the indirect effect of excess P on zinc deficiency in the young plant meristems. Thus, the P rate in cotton fertilization must be considered along with P availability in the soil for obtaining the maximum yield.
Despite its strengths, the study has certain limitations. While the dataset is extensive and incorporates a comprehensive understanding of the soil nutrient interactions, there is no adjustment in water, which is a major determinant of N availability. Adjustment of the water factor would certainly enhance the model’s accuracy in yield prediction. However, incorporating the water parameter would necessitate adjustments throughout the cotton growing season, reducing the model’s practical applicability. This is because topdressing N fertilization for cotton is completed early in the season (by the early square stage, around 35 days after seeding), as late N applications can delay crop maturity. Therefore, including variables that fluctuate during the growing season is unnecessary, as N fertilization decisions must be made early on. Thus, the error in the calculated optimum in the yield prediction of the RF model is acceptable, as it cannot be significantly improved by integrating the water parameter. Furthermore, in the Drama region, where the study was conducted, growers typically apply sufficient irrigation to meet the crop’s water requirements. Thus, the irrigation infrastructure ensures that water is not a limiting factor for cotton cultivation. Therefore, under the prevailing conditions, water availability is consistently sufficient, and its exclusion from the model would likely only influence the estimation of N losses through leaching without affecting nutrient availability due to water deficiency. However, future studies should consider integrating additional variables related to water management, such as irrigation practices, to further improve model accuracy. Validating the model across different cotton-growing regions with diverse climatic and soil conditions will also enhance its generalizability and robustness. Importantly, to ensure practical adoption, the model will be deployed as a software tool at the Soil and Water Resources Institute of the Hellenic Agricultural Organization (DIMITRA), where it will be used in combination with soil analysis data to support farmer decision making. Further research should also investigate the environmental benefits of optimized N fertilization, particularly the model’s impact on reducing nitrate leaching and improving soil health. In addition, long-term field trials are needed to validate model predictions and assess their influence on yield stability and sustainability over multiple growing seasons. Finally, as interest in yield mapping for cotton harvesters grows, more yield data will become available in the future, as has already occurred with rice [7,62]. This will facilitate the development of advanced ML models by leveraging big data and ultimately provide significant improvements in our ability to effectively engineer N management for cotton crops.

5. Conclusions

This study introduces a hybrid approach that combines mechanistic soil modeling with data-driven ML to improve precision N management in cotton cropping. Based on the current study, it was demonstrated that mechanistic and ML approaches can complement and enhance each other, enabling more effective N prediction for cotton crops. Furthermore, the findings highlight the significant role of N and P availability in optimizing cotton yield. The RF model emerged as the most effective ML algorithm, achieving the lowest prediction error and demonstrating the potential for reliable yield forecasting. Additionally, SHAP analysis provided insights into the complex interactions between soil properties, nutrient availability, and cotton growth, reinforcing the importance of site-specific fertilization strategies. The results suggest that beyond 200 kg N/ha, additional N input may not provide further benefits in yield and could even be detrimental.

Author Contributions

Conceptualization, M.I. and V.A.; methodology, M.I.; software, M.I.; validation, M.I., P.T., C.K. and V.A.; formal analysis, M.I.; investigation, M.I., V.A., F.B., P.K., C.P., A.T., I.P., G.S. and G.G.; resources, V.A.; data curation, M.I., F.B., P.K., C.P., A.T., I.P., G.S. and G.G.; writing—original draft preparation, M.I.; writing—review and editing, M.I., V.A., C.K., D.A. and E.V.; visualization, M.I., P.T. and C.K.; supervision, M.I., V.A. and D.B.; project administration, V.A. and D.B.; funding acquisition, V.A. and D.B. All authors have read and agreed to the published version of the manuscript.

Funding

This research study was funded by the Prefecture of East Macedonia and Thrace (Project title: “Nutrient overview in cotton cultivation in drama prefecture. Investigation of management practices to confront premature maturity syndrome and to support rational fertilization of cotton cultivation in drama prefecture” Project approved by the Prefecture of East Macedonia and Thrace, No.Decision 134/2022, Project Code AΔA: 9ΓA77ΛΒ-AΞΔ).

Data Availability Statement

The data can be made available by contacting the corresponding authors.

Conflicts of Interest

The authors declare no conflicts of interest.

Abbreviations

The following abbreviations are used in this manuscript:
MDPIMultidisciplinary Digital Publishing Institute
NNitrogen
PPhosphorus
MLMachine learning
RFRandom Forest
MAEMean Absolute Error
MnManganese
CuCopper
KPotassium
MgMagnesium
ZnZinc
BBoron
ECElectrical conductivity
OMOrganic matter

References

  1. Karagiannis, G. The EU Cotton Policy Regime and the Implications of the Proposed Changes for Producer Welfare; FAO: Rome, Italy, 2004. [Google Scholar]
  2. Tsaliki, E.; Loison, R.; Kalivas, A.; Panoras, I.; Grigoriadis, I.; Traore, A.; Gourlot, J.-P. Cotton Cultivation in Greece under Sustainable Utilization of Inputs. Sustainability 2024, 16, 347. [Google Scholar] [CrossRef]
  3. Dai, J.; Dong, H. Intensive Cotton Farming Technologies in China: Achievements, Challenges and Countermeasures. Field Crops Res. 2014, 155, 99–110. [Google Scholar] [CrossRef]
  4. Chen, P.; Dai, J.; Zhang, G.; Hou, W.; Mu, Z.; Cao, Y. Diagnosis of Cotton Nitrogen Nutrient Levels Using Ensemble MobileNetV2FC, ResNet101FC, and DenseNet121FC. Agriculture 2024, 14, 525. [Google Scholar] [CrossRef]
  5. Fink, M.; Scharpf, H.C. Apparent Nitrogen Mineralization and Recovery of Nitrogen Supply in Field Trials with Vegetable Crops. J. Hortic. Sci. Biotechnol. 2000, 75, 723–726. [Google Scholar] [CrossRef]
  6. Greenwood, D.J.; Cleaver, T.J.; Loquens, S.M.H.; Niendorf, K.B. Relationship between Plant Weight and Growing Period for Vegetable Crops in the United Kingdom. Ann. Bot. 1977, 41, 987–997. [Google Scholar] [CrossRef]
  7. Iatrou, M.; Karydas, C.; Tseni, X.; Mourelatos, S. Representation Learning with a Variational Autoencoder for Predicting Nitrogen Requirement in Rice. Remote Sens. 2022, 14, 5978. [Google Scholar] [CrossRef]
  8. Jallas, E. Improved Model-Based Decision Support by Modeling Cotton Variability and Using Evolutionary Algorithms. Ph.D. Thesis, Mississippi State University, Starkville, MS, USA, 1998. [Google Scholar]
  9. Lemmon, H. Comax: An Expert System for Cotton Crop Management. Comput. Sci. Econ. Manag. 1990, 3, 177–185. [Google Scholar] [CrossRef]
  10. Hodges, H.F.; Whisler, F.D.; Bridges, S.M.; Reddy, K.R.; McKinion, J.M. Simulation in Crop Management: GOSSYM/COMAX. In Agricultural Systems Modeting and Simulation; CRC Press: Boca Raton, FL, USA, 2018. [Google Scholar]
  11. Whisler, F.D.; Acock, B.; Baker, D.N.; Fye, R.E.; Hodges, H.F.; Lambert, J.R.; Lemmon, H.E.; McKinion, J.M.; Reddy, V.R. Crop Simulation Models in Agronomic Systems. In Advances in Agronomy; Brady, N.C., Ed.; Academic Press: Cambridge, MA, USA, 1986; Volume 40, pp. 141–208. ISBN 0065-2113. [Google Scholar]
  12. Baker, D.N.; Lambert, J.R.; McKinion, J.M. GOSSYM: A Simulator of Cotton Crop Growth and Yield; Technical bulletin (South Carolina Agricultural Experiment Station); S.C. Agricultural Experiment Station: Clemson, SC, USA, 1983. [Google Scholar]
  13. Gómez, D.; Salvador, P.; Sanz, J.; Casanova, J.L. Potato Yield Prediction Using Machine Learning Techniques and Sentinel 2 Data. Remote Sens. 2019, 11, 1745. [Google Scholar] [CrossRef]
  14. Reddy, K.R.; Reddy, V.R. Cotton Phenology and Growth Processes: Model Development. In Proceedings of the World Cotton Research Conference 2: New Frontiers in Cotton Research, Athens, Greece, 6–12 September 1998; Gillham, F., Ed.; Petridis: Thessaloniki, Greece, 1998; pp. 526–529. [Google Scholar]
  15. Jeong, J.; Resop, J.; Mueller, N.; Fleisher, D.; Yun, K.; Butler, E.; Timlin, D.; Shim, K.-M.; Gerber, J.; Reddy, V.; et al. Random Forests for Global and Regional Crop Yield Predictions. PLoS ONE 2016, 11, e0156571. [Google Scholar] [CrossRef]
  16. Ko, J.; Shin, T.; Kang, J.; Baek, J.; Sang, W.-G. Combining Machine Learning and Remote Sensing-Integrated Crop Modeling for Rice and Soybean Crop Simulation. Front. Plant Sci. 2024, 15, 1320969. [Google Scholar] [CrossRef]
  17. Viana, C.M.; Santos, M.; Freire, D.; Abrantes, P.; Rocha, J. Evaluation of the Factors Explaining the Use of Agricultural Land: A Machine Learning and Model-Agnostic Approach. Ecol. Indic. 2021, 131, 108200. [Google Scholar] [CrossRef]
  18. Borgnis, F.; Pedroli, E. Technological Interventions for Obsessive–Compulsive Disorder Management. In Reference Module in Neuroscience and Biobehavioral Psychology; Elsevier: Amsterdam, The Netherlands, 2021; ISBN 978-0-12-809324-5. [Google Scholar]
  19. Zhang, J.; Petersen, S.D.; Radivojevic, T.; Ramirez, A.; Pérez-Manríquez, A.; Abeliuk, E.; Sánchez, B.J.; Costello, Z.; Chen, Y.; Fero, M.J.; et al. Combining Mechanistic and Machine Learning Models for Predictive Engineering and Optimization of Tryptophan Metabolism. Nat. Commun. 2020, 11, 4880. [Google Scholar] [CrossRef] [PubMed]
  20. MINAGRIC Aξιολόγηση Προγράμματος Γεωργικών Προειδοποιήσεων Oλοκληρωμένης Φυτοπροστασίας Στην Καλλιέργεια Βάμβακος Στην ΠΕ Δράμας, Για Το Έτος. 2023. Available online: https://www.minagric.gr/images/stories/docs/agrotis/BAMBAKI/Georgikes_Proeidop/bambaki_georgikes_proid2023/Drama-23.pdf#page=1.14 (accessed on 28 March 2025).
  21. Jones, J.B. Laboratory Guide for Conducting Soil Tests and Plant Analysis; Taylor & Francis: Abingdon, UK, 2001; ISBN 9780849302060. [Google Scholar]
  22. Magdoff, F.R.; Jokela, W.E.; Fox, R.H.; Griffin, G.F. A Soil Test for Nitrogen Availability in the Northeastern United States. Commun. Soil Sci. Plant Anal. 1990, 21, 1103–1115. [Google Scholar] [CrossRef]
  23. Walkley, A.; Black, I.A. An Examination of the Degtjareff Method for Determining Soil Organic Matter, and a Proposed Modification of the Chromic Acid Titration Method. Soil Sci. 1934, 37, 29–38. [Google Scholar] [CrossRef]
  24. Van Reeuwijk, L.P. Procedures for Soil Analysis; International Soil Reference and Information Centre (ISRIC): Wageningen, The Netherlands; Food and Agriculture Organization of the United Nations (FAO): Rome, Italy, 2002. [Google Scholar]
  25. Bouyoucos, G.J. Hydrometer Method Improved for Making Particle Size Analyses of Soils. Agron. J. 1962, 54, 464–465. [Google Scholar] [CrossRef]
  26. Iatrou, M.; Papadopoulos, A.; Papadopoulos, F.; Dichala, O.; Psoma, P.; Bountla, A. Determination of Soil Available Phosphorus Using the Olsen and Mehlich 3 Methods for Greek Soils Having Variable Amounts of Calcium Carbonate. Commun. Soil Sci. Plant Anal. 2014, 45, 2207–2214. [Google Scholar] [CrossRef]
  27. Knudsen, D.; Peterson, G.A.; Pratt, P.F. Lithium, Sodium, and Potassium. In Methods of Soil Analysis; Agronomy Monographs; American Society of Agronomy, Inc.: Madison, WI, USA; Oil Science Society of America, Inc.: Madison, WI, USA, 1983; pp. 225–246. ISBN 9780891189770. [Google Scholar]
  28. Iatrou, M.; Papadopoulos, A.; Papadopoulos, F.; Dichala, O.; Psoma, P.; Bountla, A. Determination of Soil-Available Micronutrients Using the DTPA and Mehlich 3 Methods for Greek Soils Having Variable Amounts of Calcium Carbonate. Commun. Soil Sci. Plant Anal. 2015, 46, 1905–1912. [Google Scholar] [CrossRef]
  29. Jeffrey, A.J.; McCallum, L.E. Investigation of a Hot 0.01m CaCl2 Soil Boron Extraction Procedure Followed by ICP-AES Analysis. Commun. Soil Sci. Plant Anal. 1988, 19, 663–673. [Google Scholar] [CrossRef]
  30. Babashli, B.; Badalova, A.; Shukurov, R.; Ahmadov, A. Cotton Yield Estimation Using Several Vegetation Indices. Turk. J. Eng. 2024, 8, 139–151. [Google Scholar] [CrossRef]
  31. Zhang, H.; Li, J.; Liu, Q.; Lin, S.; Huete, A.; Liu, L.; Croft, H.; Clevers, J.G.P.W.; Zeng, Y.; Wang, X.; et al. A Novel Red-Edge Spectral Index for Retrieving the Leaf Chlorophyll Content. Methods Ecol. Evol. 2022, 13, 2771–2787. [Google Scholar] [CrossRef]
  32. Gitelson, A.A.; Viña, A.; Ciganda, V.; Rundquist, D.C.; Arkebauer, T.J. Remote Estimation of Canopy Chlorophyll Content in Crops. Geophys. Res. Lett. 2005, 32, L08403. [Google Scholar] [CrossRef]
  33. Nagler, P.L.; Daughtry, C.S.T.; Goward, S.N. Plant Litter and Soil Reflectance. Remote Sens. Environ. 2000, 71, 207–215. [Google Scholar] [CrossRef]
  34. Κουκουλάκης, Π.; Παπαδόπουλος, A. H Ερμηνεία Της Aνάλυσης Του Εδάφους; Σταμούλης: Athens, Greece, 2001. [Google Scholar]
  35. Iqbal, B.; Kong, F.; Ullah, I.; Ali, S.; Li, H.; Wang, J.; Khattak, W.A.; Zhou, Z. Phosphorus Application Improves the Cotton Yield by Enhancing Reproductive Organ Biomass and Nutrient Accumulation in Two Cotton Cultivars with Different Phosphorus Sensitivity. Agronomy 2020, 10, 153. [Google Scholar] [CrossRef]
  36. Johnston, A.E. Soil and Plant Phosphate; International Fertilizer Industry Association: Paris, France, 2000. [Google Scholar]
  37. Lemaire, G.; Gastal, F. Uptake and Distribution in Plant Canopies. In Diagnosis of the Nitrogen Status in Crops; Lemaire, G., Ed.; Springer: Berlin/Heidelberg, Germany, 1997; pp. 3–43. ISBN 978-3-642-60684-7. [Google Scholar]
  38. Greenwood, D.J.; Gastal, F.; Lemaire, G.; Draycott, A.P.; Millard, P.; Neeteson, J.J. Growth Rate and % N of Field Grown Crops: Theory and Experiments. Ann. Bot. 1991, 67, 181–190. [Google Scholar] [CrossRef]
  39. Sinclair, T.R.; Horie, T. Leaf Nitrogen, Photosynthesis, and Crop Radiation Use Efficiency: A Review. Crop Sci. 1989, 29, 90–98. [Google Scholar] [CrossRef]
  40. Gastal, F.; Bélanger, G. The Effects of Nitrogen Fertilization and the Growing Season on Photosynthesis of Field-Grown Tall Fescue (Festuca arundinacea Schreb.) Canopies. Ann. Bot. 1993, 72, 401–408. [Google Scholar] [CrossRef]
  41. Alejandro, S.; Höller, S.; Meier, B.; Peiter, E. Manganese in Plants: From Acquisition to Subcellular Allocation. Front. Plant Sci. 2020, 11, 300. [Google Scholar] [CrossRef]
  42. Yruela, I. Copper in Plants: Acquisition, Transport and Interactions. Funct. Plant Biol. 2009, 36, 409–430. [Google Scholar] [CrossRef]
  43. Hasanuzzaman, M.; Bhuyan, M.H.M.B.; Nahar, K.; Hossain, M.S.; Mahmud, J.A.; Hossen, M.S.; Masud, A.A.C.; Moumita; Fujita, M. Potassium: A Vital Regulator of Plant Responses and Tolerance to Abiotic Stresses. Agronomy 2018, 8, 31. [Google Scholar] [CrossRef]
  44. Thomas, G.W.; Hipp, B.W. Soil Factors Affecting Potassium Availability. In The Role of Potassium in Agriculture; ASA, CSSA, and SSSA Books; American Society of Agronomy, Inc.: Madison, WI, USA, 1968; pp. 269–291. ISBN 9780891182504. [Google Scholar]
  45. Ahmed, N.; Zhang, B.; Bozdar, B.; Chachar, S.; Meghwar, M.; Li, J.; Li, Y.; Hayat, F.; Chachar, Z.; Tu, P. The Power of Magnesium: Unlocking the Potential for Increased Yield, Quality, and Stress Tolerance of Horticultural Crops. Front. Plant Sci. 2023, 14, 1285512. [Google Scholar] [CrossRef]
  46. Heald, W.R. Calcium and Magnesium. In Methods of Soil Analysis; Agronomy Monographs; American Society of Agronomy, Inc.: Madison, WI, USA, 1965; pp. 999–1010. ISBN 9780891182047. [Google Scholar]
  47. Marschner, H. Mineral Nutrition of Higher Plants; Academic Press: London, UK, 1995. [Google Scholar]
  48. Day, S.; Aasim, M. Role of Boron in Growth and Development of Plant: Deficiency and Toxicity Perspective. In Plant Micronutrients: Deficiency and Toxicity Management; Aftab, T., Hakeem, K.R., Eds.; Springer International Publishing: Cham, Switzerland, 2020; pp. 435–453. ISBN 978-3-030-49856-6. [Google Scholar]
  49. Wear, J.I.; Patterson, R.M. Effect of Soil PH and Texture on the Availability of Water-Soluble Boron in the Soil. Soil Sci. Soc. Am. J. 1962, 26, 344–346. [Google Scholar] [CrossRef]
  50. Shwartz-Ziv, R.; Armon, A. Tabular Data: Deep Learning Is Not All You Need. Inf. Fusion 2022, 81, 84–90. [Google Scholar] [CrossRef]
  51. Breiman, L. Random Forests. Mach. Learn. 2001, 45, 5–32. [Google Scholar] [CrossRef]
  52. Varoquaux, G.; Buitinck, L.; Louppe, G.; Grisel, O.; Pedregosa, F.; Mueller, A. Scikit-Learn: Machine Learning Without Learning the Machinery. GetMobile Mob. Comput. Commun. 2015, 19, 29–33. [Google Scholar] [CrossRef]
  53. Chen, T.; Guestrin, C. XGBoost: A Scalable Tree Boosting System. In Proceedings of the 22Nd ACM SIGKDD International Conference on Knowledge Discovery and Data Mining, San Francisco, CA, USA, 13–17 August 2016; ACM: New York, NY, USA, 2016; pp. 785–794. [Google Scholar]
  54. Ke, G.; Meng, Q.; Finley, T.; Wang, T.; Chen, W.; Ma, W.; Ye, Q.; Liu, T.-Y. LightGBM: A Highly Efficient Gradient Boosting Decision Tree. In Proceedings of the Advances in Neural Information Processing Systems; Guyon, I., Von Luxburg, U., Bengio, S., Wallach, H., Fergus, R., Vishwanathan, S., Garnett, R., Eds.; Curran Associates, Inc.: Red Hook, NY, USA, 2017; Volume 30. [Google Scholar]
  55. Akiba, T.; Sano, S.; Yanase, T.; Ohta, T.; Koyama, M. Optuna: A Next-Generation Hyperparameter Optimization Framework. In Proceedings of the 25th ACM SIGKDD International Conference on Knowledge Discovery and Data Minin, Anchorage, AK, USA, 4–8 August 2019; Association for Computing Machinery: New York, NY, USA, 2019. [Google Scholar]
  56. Gramegna, A.; Giudici, P. SHAP and LIME: An Evaluation of Discriminative Power in Credit Risk. Front. Artif. Intell. 2021, 4, 752558. [Google Scholar] [CrossRef]
  57. Lloyd, S. N-Person Games. Defense Tech. Inf. Cent. 1952, 295–314. [Google Scholar]
  58. Van Rossum, G.; Drake, F.L., Jr. Python Tutorial. History 2010, 42, 1–122. [Google Scholar] [CrossRef]
  59. Hunter, J.D. Matplotlib: A 2D Graphics Environment. Comput. Sci. Eng. 2007, 9, 90–95. [Google Scholar] [CrossRef]
  60. Howard, J.; Gugger, S. Deep Learning for Coders with Fastai and PyTorch; O’Reilly Media: Sebastopol, ON, Canada, 2020. [Google Scholar]
  61. Alloway, B.J. Soil Factors Associated with Zinc Deficiency in Crops and Humans. Environ. Geochem. Health 2009, 31, 537–548. [Google Scholar] [CrossRef]
  62. Iatrou, M.; Karydas, C.; Iatrou, G.; Pitsiorlas, I.; Aschonitis, V.; Raptis, I.; Mpetas, S.; Kravvas, K.; Mourelatos, S. Topdressing Nitrogen Demand Prediction in Rice Crop Using Machine Learning Systems. Agriculture 2021, 11, 312. [Google Scholar] [CrossRef]
  63. Sun, M.; Li, P.; Wang, N.; Zheng, C.; Sun, X.; Dong, H.; Han, H.; Feng, W.; Shao, J.; Zhang, Y. Soil Available Phosphorus Deficiency Reduces Boll Biomass and Lint Yield by Affecting Sucrose Metabolism in Cotton-Boll Subtending Leaves. Agronomy 2022, 12, 1065. [Google Scholar] [CrossRef]
Figure 1. The studied cotton fields located in the Drama Plain, Greece.
Nitrogen 06 00029 g001
Figure 2. Relationship between the CLRE index and yield on 17 August 2024, showing that the yield variable correlates with the cotton yield index, CLRE.
Nitrogen 06 00029 g002
Figure 3. Feature importance for the RF model. The N rate, as expected, is the most significant factor for the model.
Nitrogen 06 00029 g003
Figure 4. SHAP dependence plots showing (a) N rate, (b) P rate, (c) K rate, (d) P_availability, (e) Fe, and (f) P need influence of the RF yield model.
Nitrogen 06 00029 g004
Table 1. A summary of the hyperparameters used for RF, XGBoost, and LightBBM algorithms.
HyperparameterRFXGBoostLightGBM
n_estimators76835631000
max_depth471520
max_featuressqrt--
max_leaf_nodes257--
bootstrapFalse--
criterionmae--
reg_lambda-4.750.70
reg_alpha-0.0020.46
colsample_bytree-0.90.6
subsample-0.61.0
learning_rate-0.040.02
min_child_weight-2-
num_leaves--319
min_child_samples--4
min_data_per_group--63
metric--mae
Disclaimer/Publisher’s Note: The statements, opinions and data contained in all publications are solely those of the individual author(s) and contributor(s) and not of MDPI and/or the editor(s). MDPI and/or the editor(s) disclaim responsibility for any injury to people or property resulting from any ideas, methods, instructions or products referred to in the content.

