Article

Ecosystem Recovery in Progress? Initial Nutrient and Phytoplankton Response to Nitrogen Reduction from Sewage Treatment Upgrade in the San Francisco Bay Delta

by
Patricia M. Glibert
1,*,
Frances P. Wilkerson
2,
Richard C. Dugdale
2 and
Alexander E. Parker
3
1
Horn Point Laboratory, University of Maryland Center for Environmental Science, P.O. Box 775, Cambridge, MD 21613, USA
2
Estuary and Ocean Science Center, Romberg Tiburon Campus, San Francisco State University, 3150 Paradise Drive, Tiburon, CA 94920, USA
3
Department of Sciences and Mathematics, California State University Maritime Academy, 200 Maritime Academy Drive, Vallejo, CA 94590, USA
*
Author to whom correspondence should be addressed.
Nitrogen 2022, 3(4), 569-591; https://doi.org/10.3390/nitrogen3040037
Submission received: 25 August 2022 / Revised: 1 October 2022 / Accepted: 8 October 2022 / Published: 13 October 2022
(This article belongs to the Special Issue Microbial Nitrogen Cycling)

Abstract

:
The San Francisco Bay Delta has been an estuary of low productivity, with causes hypothesized to relate to light limitation, grazing by invasive clams, and polluting levels of NH4+ discharge from a wastewater treatment plant. Suppression of phytoplankton NO3 uptake by NH4+ has been well documented, and thus this estuary may have experienced the counterintuitive effect of depressed productivity due to wastewater NH4+ enrichment. In 2021, a new wastewater treatment plant came online, with a ~75% reduction in nitrogen load, and within-plant nitrification, converting the discharge to NO3. The expectation was that this change in nitrogen loading would support healthier phytoplankton production, particularly of diatoms. Here, responses of the post-upgrade Bay Delta phytoplankton were compared to five years of data collected pre-upgrade during the fall season. Indeed, increased chlorophyll a accumulation in the estuary was documented after the implementation of the upgraded wastewater treatment and photophysiological responses indicated comparatively less stress. Major differences in river flow were also observed due to drought conditions during the decade covered by this study. While short-term favorable effects were observed, understanding longer-term ecological feedback interactions that may follow from this major nutrient change under variable flow conditions will require more years of observations.

1. Introduction

The San Francisco Bay Delta has long been considered an estuary of High Nutrient-Low Growth (HNLG) [1,2,3]. The low productivity condition has not always been the case, as annual summer blooms with chlorophyll a (chl a) > 20 μg L−1 occurred in the 1970s [4] especially during drought periods [5,6]. In recent years, phytoplankton blooms have been a relative rarity, although occasional blooms have occurred, typically dominated by the centric diatom, Aulacoseira granulate, e.g., [7,8,9]. For example, an extensive bloom of A. granulata was observed in the northern Bay Delta in spring 2016 [10]. Due to comparative infrequency of algal blooms, the Bay Delta has been considered to be immune from conditions of eutrophication. On the one hand, this is positive, in that conditions of large blooms and prolonged hypoxia are not problematic. On the other hand, the condition of low chl a has been considered to be limiting for food availability for major fish species, leading to a condition referred to as the pelagic organism decline [11,12]. The exception to the low productivity condition in the Bay Delta is the region of the central Delta and confluence of the Sacramento and San Joaquin Rivers, where blooms of the cyanobacterium Microcystis aeruginosa have been a recurring feature for more than two decades, e.g., [13,14,15]. Production of cyanobacterial blooms are not supportive of fish production.
A major source of nutrients to the Bay Delta since the early 1980s has been a wastewater treatment plant (WWTP) located in the upper Sacramento River. This WWTP discharged nitrogen (N) to the Sacramento River at the rate of 14–15 tons day−1 and at concentrations at the point of discharge that increased from ~10 mg L−1 when the plant came online in the early 1980s to >30–40 mg L−1 in the 2000s [5,16,17]. Under average flow conditions, >90% of the total N in the northern San Francisco Estuary originated from this single source [5]. Importantly, this N was discharged in the form of NH4+. The Sacramento River served as a region of nitrification, inferred from both water column changes in concentrations of NH4+ and NO3 [18] and the presence of nitrifying bacteria and archaea [19,20]. Agricultural sources also supply nutrients to the Bay Delta [21,22,23].
The NH4+ originating from the WWTP has been hypothesized to be suppressive or repressive for phytoplankton growth, rather than stimulatory [1,7,8,9,24,25], although this has been a topic of considerable debate, e.g., [26,27,28]. While NH4+ can be a preferred form of N for phytoplankton, at high levels it can be toxic for cell growth [29] (and references therein). The phenomenon of productivity suppression in the presence of elevated NH4+ has been observed in other rivers, lakes, estuarine and coastal ecosystems impacted by either WWTP effluent or fertilizer runoff [3,30,31,32,33]. The same phenomenon of reduced growth with elevated NH4+ has also been observed in higher plants and is known as the “NH4+ syndrome” [34,35].
Beginning in 2015, new discharge requirements were imposed on the Sacramento River WWTP, necessitating the building of a major new treatment plant. Servicing over 1.6 million people, the new discharge permit required that NH4+ be removed from discharge, and that total N discharge be reduced by 75%, with a river discharge of 181 million gallons per day (=685 million liters per day, average dry weather amount) [36]. No requirements for a change in PO43− discharge were imposed. Thus, with reduced N loads, the dissolved inorganic N:dissolved inorganic P (DIN:DIP) was reduced accordingly. Biological nutrient removal was added and advanced filtration removed many smaller particles that were also discharged in the pre-upgrade effluent. The upgraded WWTP—a nearly USD2 billion investment—known as the EchoWater Project (https://www.regionalsan.com/echowater-project, accessed on 1 May 2022) was fully implemented by late spring 2021 and represents one of the largest plants in the USA.
An alternative hypothesis for persistent low productivity in the Bay Delta is that the phytoplankton are light limited [37,38,39]. Due to high suspended particulate matter caused by river inflow as well as turbulence due to tides and waves [40], light availability can be poor. However, suspended particulate matter varies considerably with bay region and season, being highest during the winter and spring wet period, leading to lowest light availability during these seasons [41]. Additionally, biomass accumulation may be controlled by aggressive benthic grazing predominantly by the invasive clam, Potamocorbula amurensis [6,42,43]; P. amurensis = Corbula amurensis, [44]. Grazing by clams is highest in late summer/fall.
Over the past decade, California has also experienced periods of major drought, with a few years during which drought conditions were alleviated. Drought has significant impacts on waters of the Bay Delta by altering residence times, which, in turn, may allow for more in situ phytoplankton growth, which, unless grazed, would be more likely to accumulate. Conversely, for periods of high flow, it has previously been suggested that phytoplankton growth may be limited due to the short transport times in the river/estuary [45,46]. During drought there is also less dilution of effluent nutrients, potentially leading to more localized impacts. The timing of final implementation of EchoWater occurred during the most recent—and ongoing—drought.
The overarching hypothesis that will be tested over the coming years is that if the high loads of NH4+ were indeed suppressive to phytoplankton growth, then an increase in phytoplankton growth should be seen when these loads are reduced. Furthermore, shifting the form of N to NO3 should favor the growth of diatoms, as they are considered NO3 opportunists [29]. An increase in diatom production would also be expected from the reduction in DIN:DIP, as diatoms typically have a high P requirement, e.g., [47,48]. While it may take years for the system to fully adapt to the new nutrient conditions, phytoplankton physiology responds rapidly, whereas the multiple biogeochemical and ecological feedbacks of ecosystem recovery will take multiple seasons to become fully established. Here, initial responses to EchoWater are reported for the fall season, a few months after full implementation, and water quality conditions and phytoplankton physiology are compared to similar times of year for five previous years that varied in flow conditions. Although not all years have availability of precisely the same measured parameters, they do allow us a first look as to how the phytoplankton community responded to changes in nutrients post-upgrade. This first assessment appears to support the hypothesis that alleviation of excessive NH4+ loads allowed increased production and less photosynthetic stress.

2. Materials and Methods

2.1. Site Description

The northern San Francisco Estuary, or Bay Delta, consists of the Central Bay, San Pablo Bay, Suisun Bay and the Sacramento-San Joaquin Bay Delta, which is a complex web of rivers, channels, wetlands and floodplains (Figure 1) [49,50]. On a long-term basis, the Sacramento River contributes >80% of the river inflow to the Bay Delta [5]. The sampling herein covered the region of the Sacramento River through Suisun Bay. The Sacramento and San Joaquin Rivers converge at the confluence of the Delta, then flow into Suisun Bay. The mean depths of these regions of the Bay Delta range from 3.3 to 5.7 m [6].
The dendritic nature of the Sacramento River and the many other tributaries and subestuaries, as well as the specific point source discharges, lead to several natural change points in the river hydrology and ecology [9]. Viewing the river from the upper station, the first change occurs between stations 3 (GRC) and 4 (RM44), where the wastewater is discharged. The next natural change occurs at Station 8 (657), as there is inflow from the Sacramento Ship Channel and other tributaries exit into the Sacramento River between sites 7 (ISL) and Station 8 (657). The next natural change occurs at station 12 (US2), where the Sacramento River exits into Suisun Bay. The San Joaquin River discharges between stations 11 and 12.

2.2. River Flow

Daily river discharge data were downloaded from USGS site 11,455,420 (at Rio Vista (Station 8), www.waterdata.usgs.gov, accessed 15 May 2022). Average values for the 30 days prior to sampling were calculated for each year of sampling.

2.3. Sample Collection

Sampling was undertaken in the months of September or October under the umbrella of three different projects encompassing different years (2011–2013, 2014–2015, 2021). Each sampling period covered stations from above the wastewater treatment plant to Suisun Bay. Although not all stations were sampled on each sampling date, as the different projects had different goals or equipment available, each sampling effort covered the same transect from the upper Sacramento River through Suisun Bay. Stations were identified with varying names, and thus herein, both station number and local name are given for each station reference. Samples were collected on 1-day trips on the R/V Questuary on 6 September 2011, 14 September 2012, 23 September 2013, and on back-to-back 1-day trips encompassing shorter segments of the transects on 15-16 October 2014, 28-30 October 2015 during the pre-upgrade conditions, and five months after full implementation on 22–23 September 2021.
In all years, samples were collected and processed following Wilkerson et al. [25,51]. Samples were collected via a rosette CTD (Seabird Electronics SB-32) equipped with 6, 3-L Niskin bottles. A Secchi disk was used to estimate water clarity. Samples from different depths were collected, but consistently near-surface samples were collected and represent the data herein. All were filtered onboard in duplicate through Whatman GF/F filters (nominally 0.7 µm) for the collection of chl a and (except for 2011 and 2021) analysis of phytoplankton diagnostic pigments. Syringe filters (GF/F) were used to collect nutrient samples. Filtrates were stored on ice, and returned to the laboratory for subsequent analysis of NH4+, NO3, PO43− and Si(OH)4.

2.4. Analytical Protocols

Ambient nutrient concentrations were analyzed using manual colorimetric assays (NH4+) and autoanalysis techniques (NO3 + NO2 (hereafter NO3), PO43−, Si(OH)4). Concentrations of NH4+ were analyzed according to Solorzano [52], while the other nutrients followed Bran and Lubbe protocols [53,54,55]. Samples for chl a were analyzed using a Turner Designs Model 10-AU fluorometer following a 24 h 90% acetone extraction at 4 °C [56]. The fluorometer was calibrated with commercially available chl a (Turner Designs).
From 2012 to 2015, phytoplankton pigments were also analyzed using high performance liquid chromatography (HPLC) using methods described by Van Heukelem and Thomas [57]. In 2012 and 2013, samples were processed at the Horn Point Laboratory, University of Maryland Center for Environmental Science (UMCES), and in 2014 and 2015 samples were analyzed at Oregon State University, Corvallis. Although the analysis protocol includes a full suite of pigments, of relevance here are fucoxanthin, chlorophyll b (chl b), and zeaxanthin, which, when normalized to chl a, are a measure of diatoms, green algae, and cyanobacteria, respectively [58,59].

2.5. Photophysiological State and Irradiance Relationships

From 2012 to 2015, a Turner Designs PhytoFlash variable fluorometer was used to assess phytoplankton physiological state. Samples were collected and dark adapted for at least 20 min and measurements of variable fluorescence were taken. Variable fluorescence is the ratio of (Fv) to maximum fluorescence (Fm), Fv/Fm, and is taken as a measure of photosynthetic efficiency, the maximum quantum yield of photosystem II. Reductions in Fv/Fm are taken as a measure of stress in photosystem II. The PhytoFlash provides a single value for the community sample.
In 2021, photophysiological state was measured differently. Samples were collected at each station, kept at ambient temperature under 50–60% irradiance until return to the dock. Samples were then dark acclimated for ~20 min and fluorescence parameters were measured using a Walz PhytoPAM II (Heinz Walz GmbH, Effeltrich, Germany). In contrast to the PhytoFlash instrument, the PhytoPAM II’s multiwavelengh capability allows deconvolution of signals from different functional groups but does not provide an integrated value for the entire phytoplankton community; it determines the photophysiological condition of each algal group individually. The PhytoPAM II deconvolutes signals associated with brown algae (diatoms and dinoflagellates), green algae, blue-green algae and phycoerythrin-containing algae (e.g., picoplankton such as Synechococcus). The instrument was calibrated with diatom, green and phycoerythrin-containing (cyanobacteria) reference spectra. While the brown algal signal includes both diatoms and dinoflagellates, microscopic analyses confirmed that the dominant organism present in this category was diatoms. The major signals that were resolved herein were brown algae (diatoms) and green algae. PE-containing signals were detected at some stations, but values were consistently very low. A non-PE cyanobacterial signal was not resolvable in these samples.
Using the PhytoPAM II, Fv/Fm was first measured for the different algal groups after dark acclimation of ~20 min. Then, the photosynthesis-irradiance response of each sample was measured using the rapid light curve (RLC) function of the PhytoPAM II. RLCs use electron transport rate (ETR) for the currency of photosynthesis and values are expressed as μmol electrons m−2 s−1. Samples were exposed to 12 step changes in irradiance at 10 s per step, covering the irradiance range of 5 to 580 μM photons m−2 s−1. The ETR of PSII and parameters of the RLCs were calculated using the equation of Platt et al. [60] using the WinControl software package of the PhytoPAM II instrument. For selected stations in 2021, RLCs were conducted with samples that were enriched with variable amounts of NH4+ for several hours prior to measurement. The purpose of these experiments was to assess how phytoplankton might have responded in pre-upgrade years if exposed to elevated effluent NH4+.

2.6. Statistical Analyses

Environmental data and photosynthetic parameters were processed in Microsoft Excel or Walz WinControl software. Comparisons were made with ANOVA and Pearson correlations were calculated to examine relationships between parameters.

3. Results

3.1. Flow Conditions

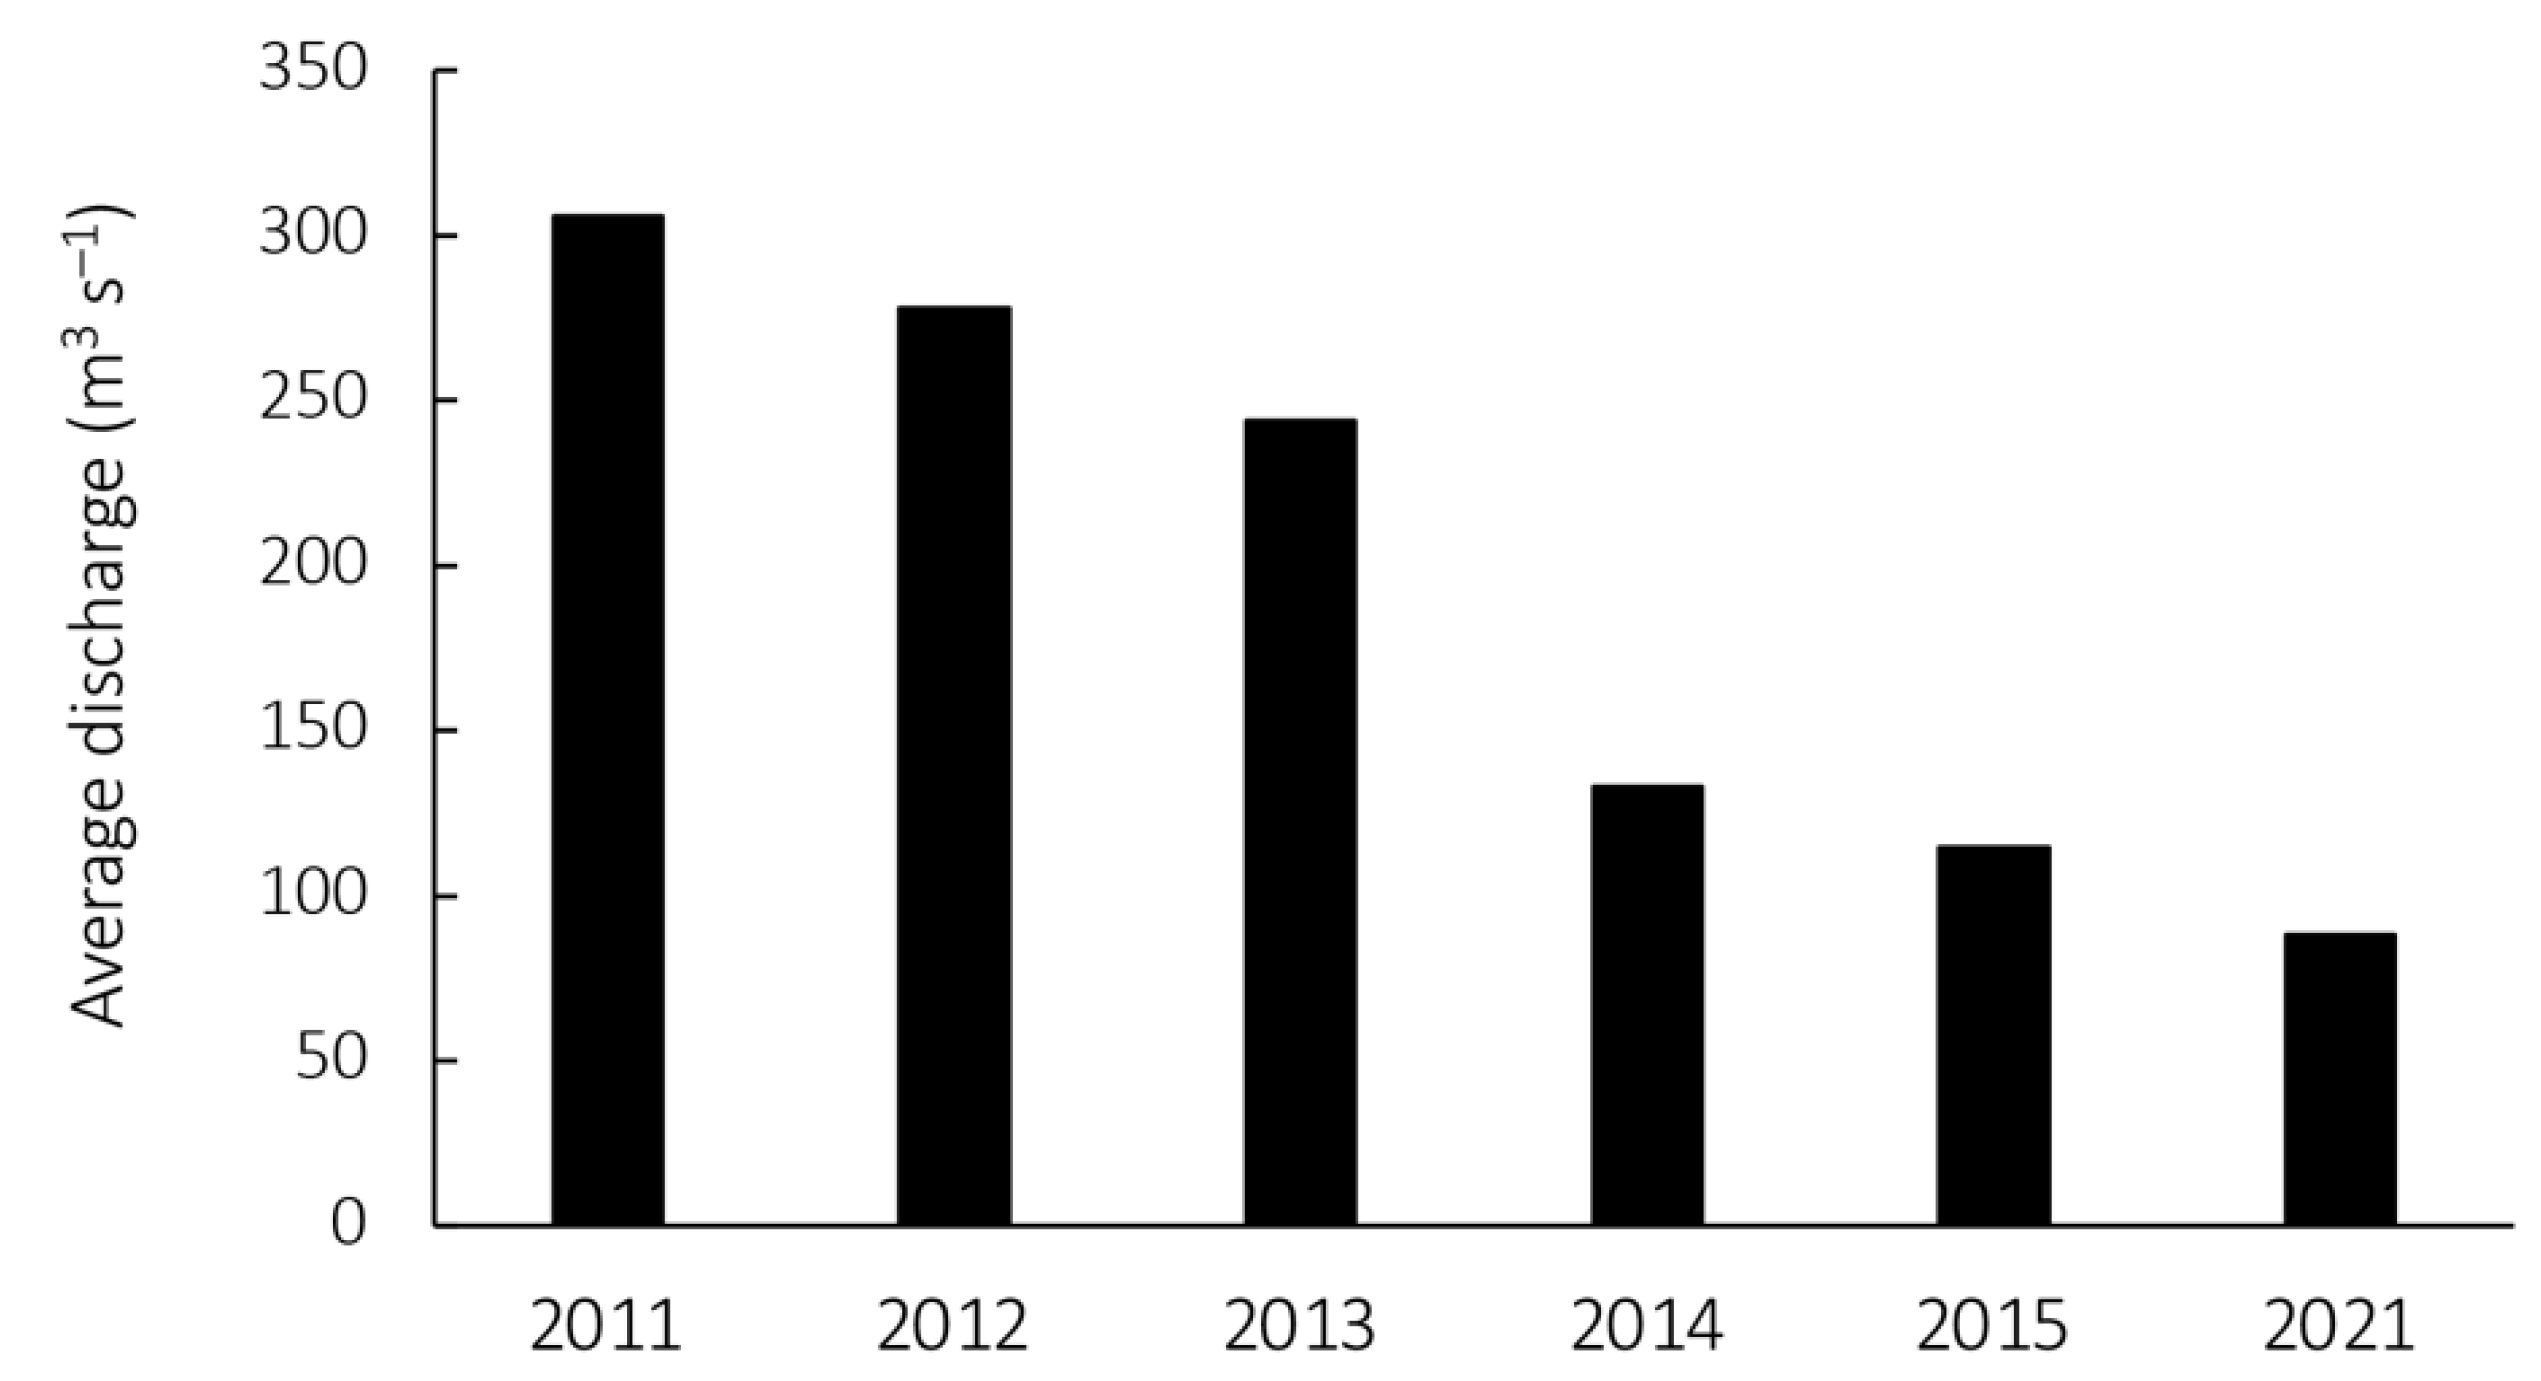
River flow changed substantially over the time period of study. The earlier samplings occurred during non-drought to moderate drought conditions (Figure 2). Over the period of the six studied years, river flow decreased about 3.5-fold when the average discharge of the 30 days prior to sampling was considered. During 2011, when no drought was evident, average flow during the month before sampling was 306 m3 s−1, but by 2021, when drought was considered severe, discharge was only 88 m3 s−1 (Figure 2).

3.2. Ambient Water Column Conditions

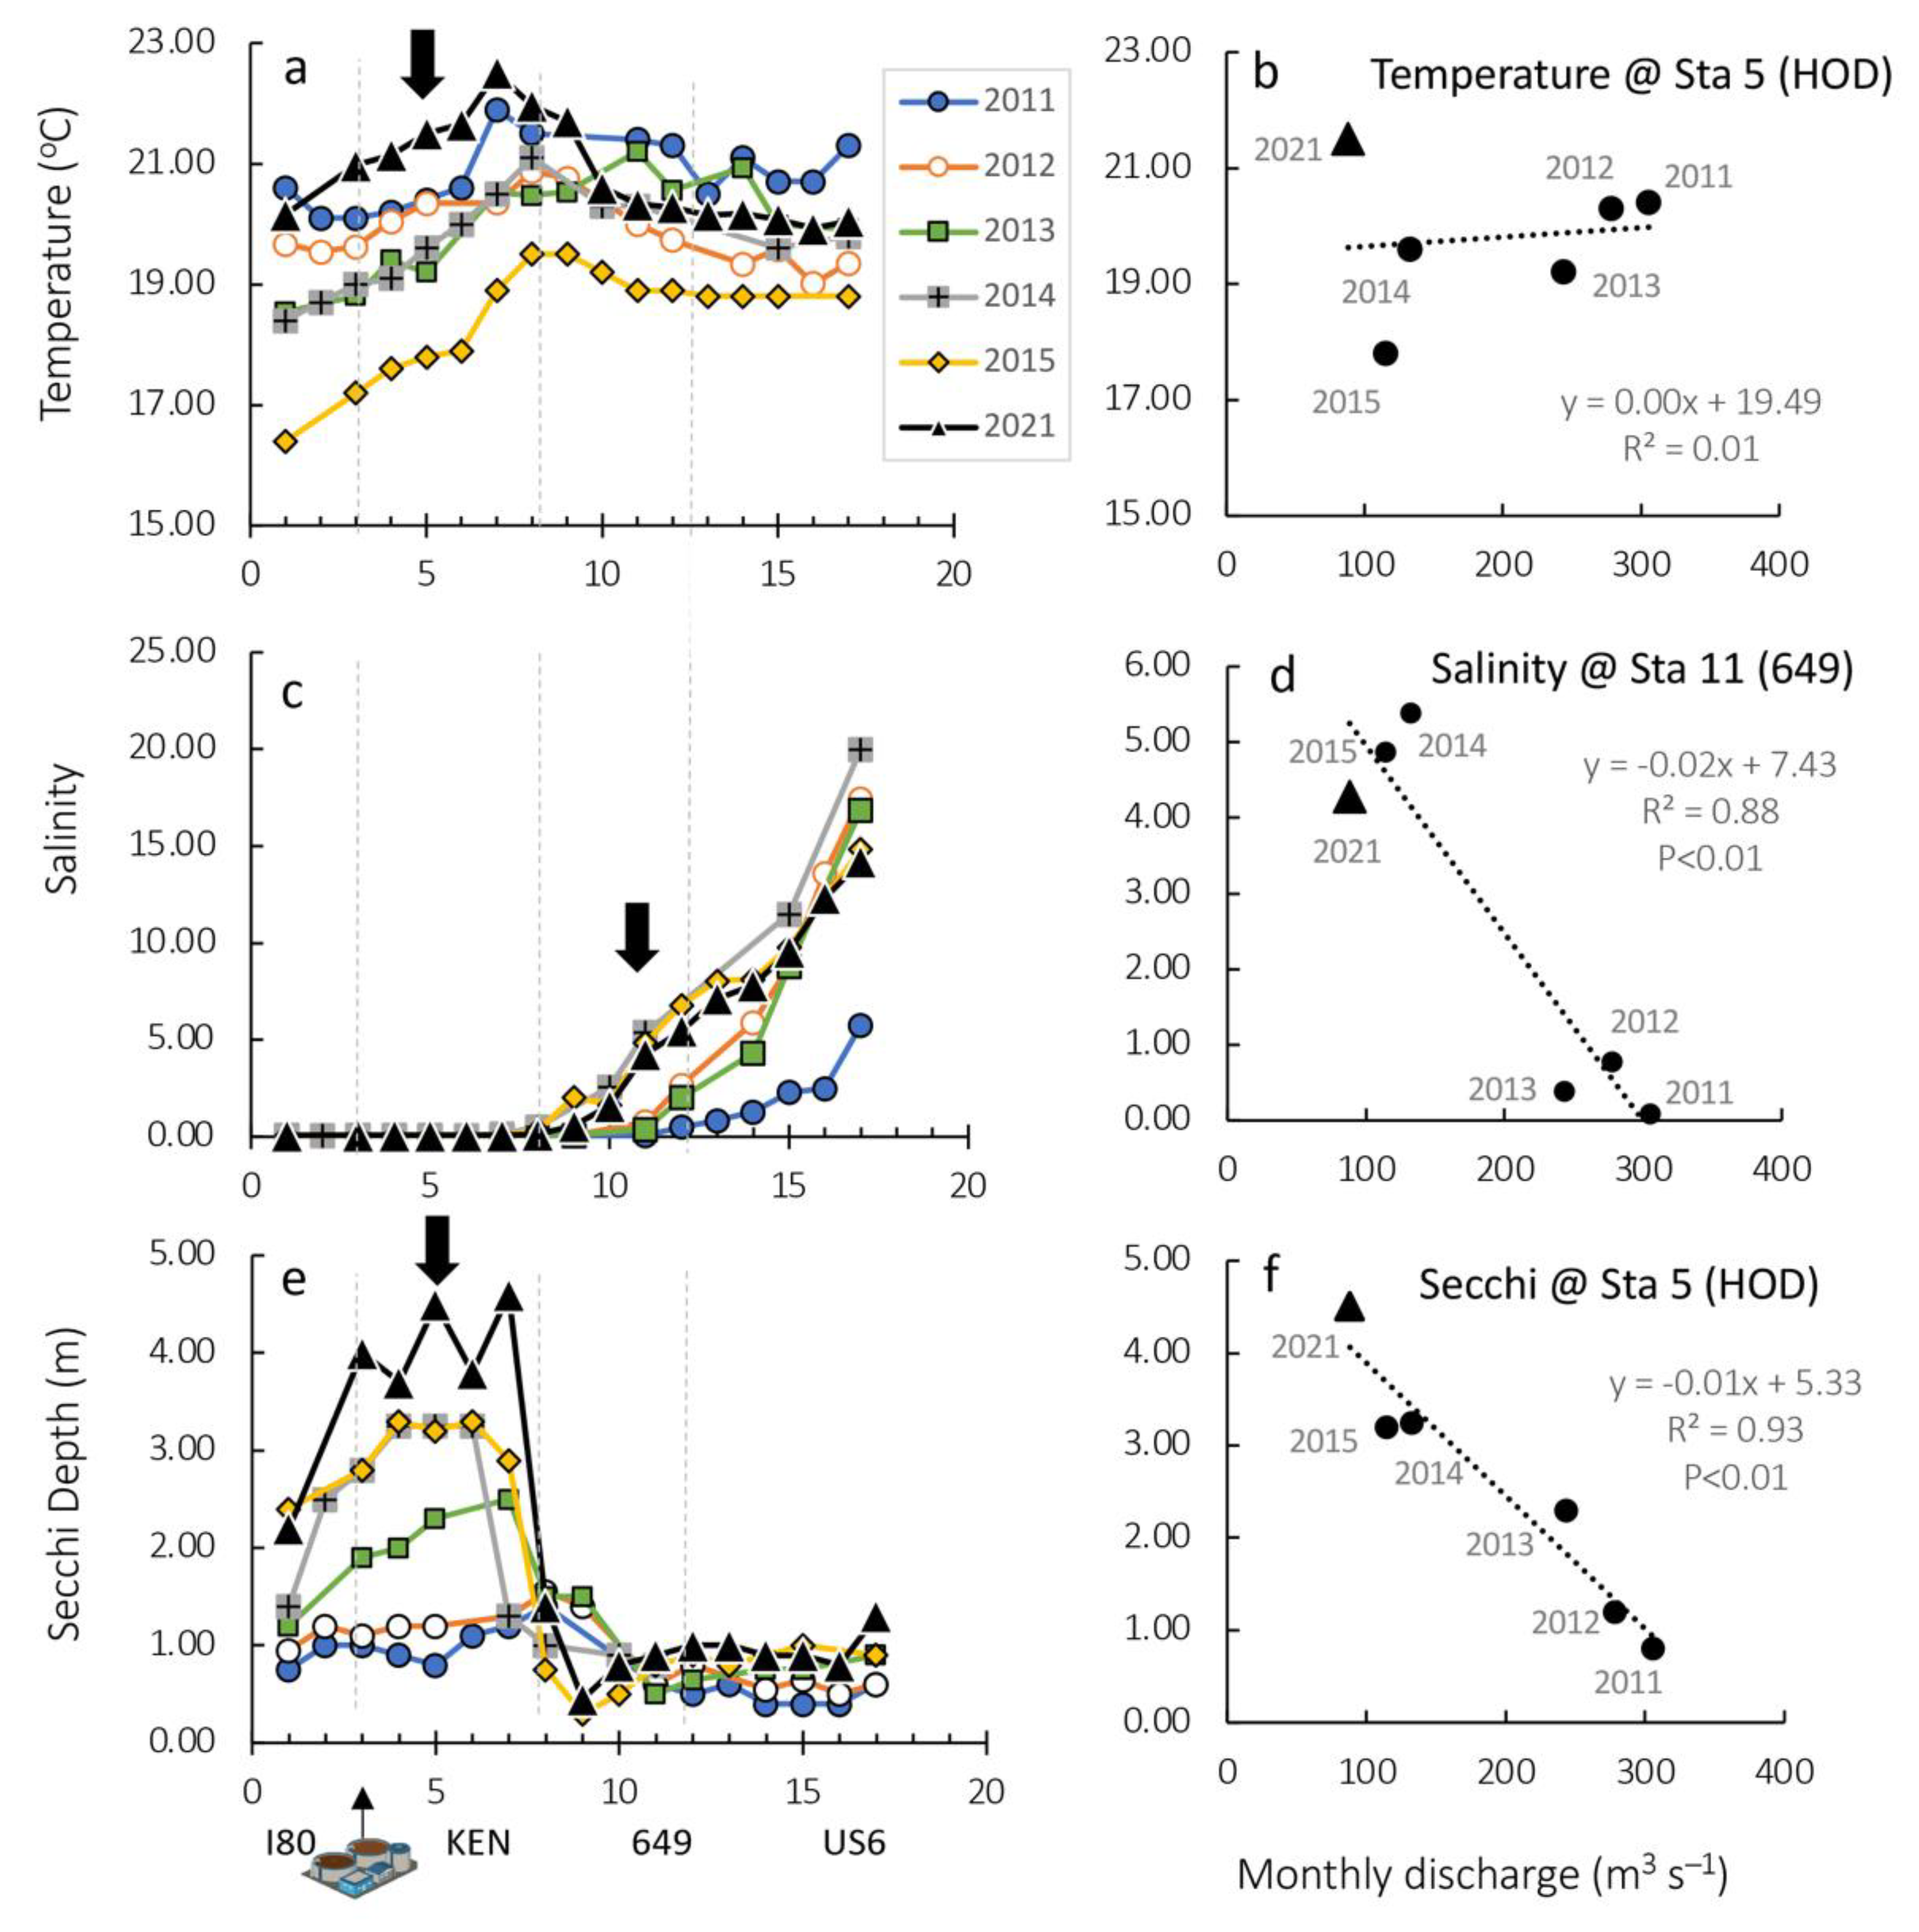
Average water temperatures ranged from a low of 18.5 °C in 2015, the year when sampling was several weeks later than the other years, to 20.8 °C in 2021, when flow was extremely low. With the exception of 2015, within-transect temperature variability did not generally exceed 2 °C (Figure 3a). Given the several-weeks variability in timing of sampling from year to year, temperature was not related to flow conditions (Figure 3b).
Salinity differed significantly between years of sampling (Figure 3c). In 2011, the highest flow year, salinity remained < 6 for the entire transect. In the drier years, salt intrusion was apparent by Station 11 (649), with salinities as high as 5.4 (e.g., 2014). At Station 11, where salt intrusion could be resolved, salinity for all years was significantly related to flow conditions (R2 = 0.88, p < 0.01, Figure 3d).
Light availability differed between years and from upriver to down-estuary (Figure 3e). For the first two years of study, 2011 and 2012, the Secchi depth barely exceeded 1 m at any point along the transects. Secchi depth increased with the next two years of study, exceeding 3 m in the upper reach of the river, but dropped to about 1 m in the lower stretch of the transect. Highest Secchi depth was observed in 2021, post upgrade, but this region of relative water clarity was limited to the upper segment of the river. For the four latter years of study, Secchi depth increased from Station 1 (I80) to 3 (GRC), and further increased to Station 7 (ISL) before dropping to values comparable to the other years in the lower section of the transect. At Station 5 (HOD), the Secchi depth for all years of sampling was significantly negatively correlated with monthly discharge (R2 = 0.93, p < 0.01, Figure 3f), suggesting that high turbidity was associated with upriver sources (i.e., above Station 1 (I80), and that with reduced flow, particles were more likely to settle from the water column or were diluted with water from effluent discharge. Station 5 is located a few km south of the WWTP diffusers and represents the first station at which the WWTP effluent is well mixed with the river water.
The nutrients differed significantly between pre- and post-upgrade conditions, and significant differences were also observed with flow conditions. Concentrations of NH4+ during the first two years of study, when drought was modest or absent, were <30 μM near the outfall site (Figure 4a). In 2013, as drier conditions developed, concentrations of NH4+ exceeded 50 μM near the outfall, and during the drought years prior to upgrade (2014, 2015), concentrations of NH4+ near the outfall site were 80–90 μM. In the post-upgrade sampling–and consistent with the permit requirements–concentrations of NH4+ were <5 μM throughout the transect. For all years, concentrations of NH4+ fell rapidly over the transect and were consistently very low by Station 9 (655) or before. At Station 5 (HOD), concentrations of NH4+ for the years prior to upgrade were significantly negatively correlated with flow conditions (R2 = 0.98, p < 0.01, Figure 4b), consistent with the notion that the WWTP was the major source of NH4+ and concentrations at the point source were diluted with higher flow.
Concentrations of NO3 consistently increased down-estuary, but to varying extents from year to year (Figure 4c). Two patterns with distance downstream were apparent. During the higher flow years (2011, 2012, 2013), near-linear increases in NO3 concentrations were seen, suggesting a downstream source of this N form or increasing nitrification. For the drier years pre-upgrade (2014, 2015), a sharp transition to elevated NO3 concentrations > 30 μM was seen by Station 9 (655), reflecting localized nitrification, with no further increases downriver. Input of NO3 from the San Joaquin River is another possible source in this stretch of the estuary. For the EchoWater sample (2021), the peak in concentration at Station 5 (HOD) to ~15 μM can be directly attributed to the wastewater discharge. From Station 6 (KEN) through 10 (653), concentrations declined, potentially due to NO3 uptake by phytoplankton, then gradually increased through the remainder of the transect stations, reaching concentrations no greater than ~13 μM. At Station 11 (649), where elevated concentrations of NO3 for the years prior to upgrade were apparent, concentrations were significantly negatively correlated with flow conditions (R2 = 0.85 p < 0.05, Figure 4d), which would suggest that with reduced flow conditions, more nitrification could be realized.
For PO43− during the pre-upgrade years, distinct peaks were recorded at Station 5 (HOD), associated with WWTP discharge (Figure 5a). During the driest year pre-upgrade, 2015, the concentration at this point source was nearly 6 μM. Concentrations declined over the next few stations (likely due to phytoplankton uptake), then resumed an upward trajectory for the remained of the river transect, likely reflecting a downstream source. Although the upgrade did not have a requirement to reduce PO43− in the discharge, it appears that such reductions have occurred, with post-upgrade PO43− concentrations at the discharge site of 1.3 μM. At Station 5 (HOD), concentrations of PO43− were significantly negatively correlated with flow conditions for the pre-upgrade years (R2 = 0.80, p < 0.05, Figure 5b), indicating that the source of PO43− was indeed the WWTP.
For all years, all stations, concentrations of Si(OH)4 remained in the range of 100–300 μM, thus at no time was considered limiting or controlling for phytoplankton growth (Figure 5c). During the three latter years when flow was reduced, concentrations of Si(OH)4 declined more rapidly than during the high flow years, suggestive of increased time for uptake by diatoms (see also below). By Station 11 (649), the concentration of Si(OH)4 was significantly related to monthly flow over all years (R2 = 0.70, p < 0.05, Figure 5d).

3.3. Chlorophyll a and Phytoplankton Composition

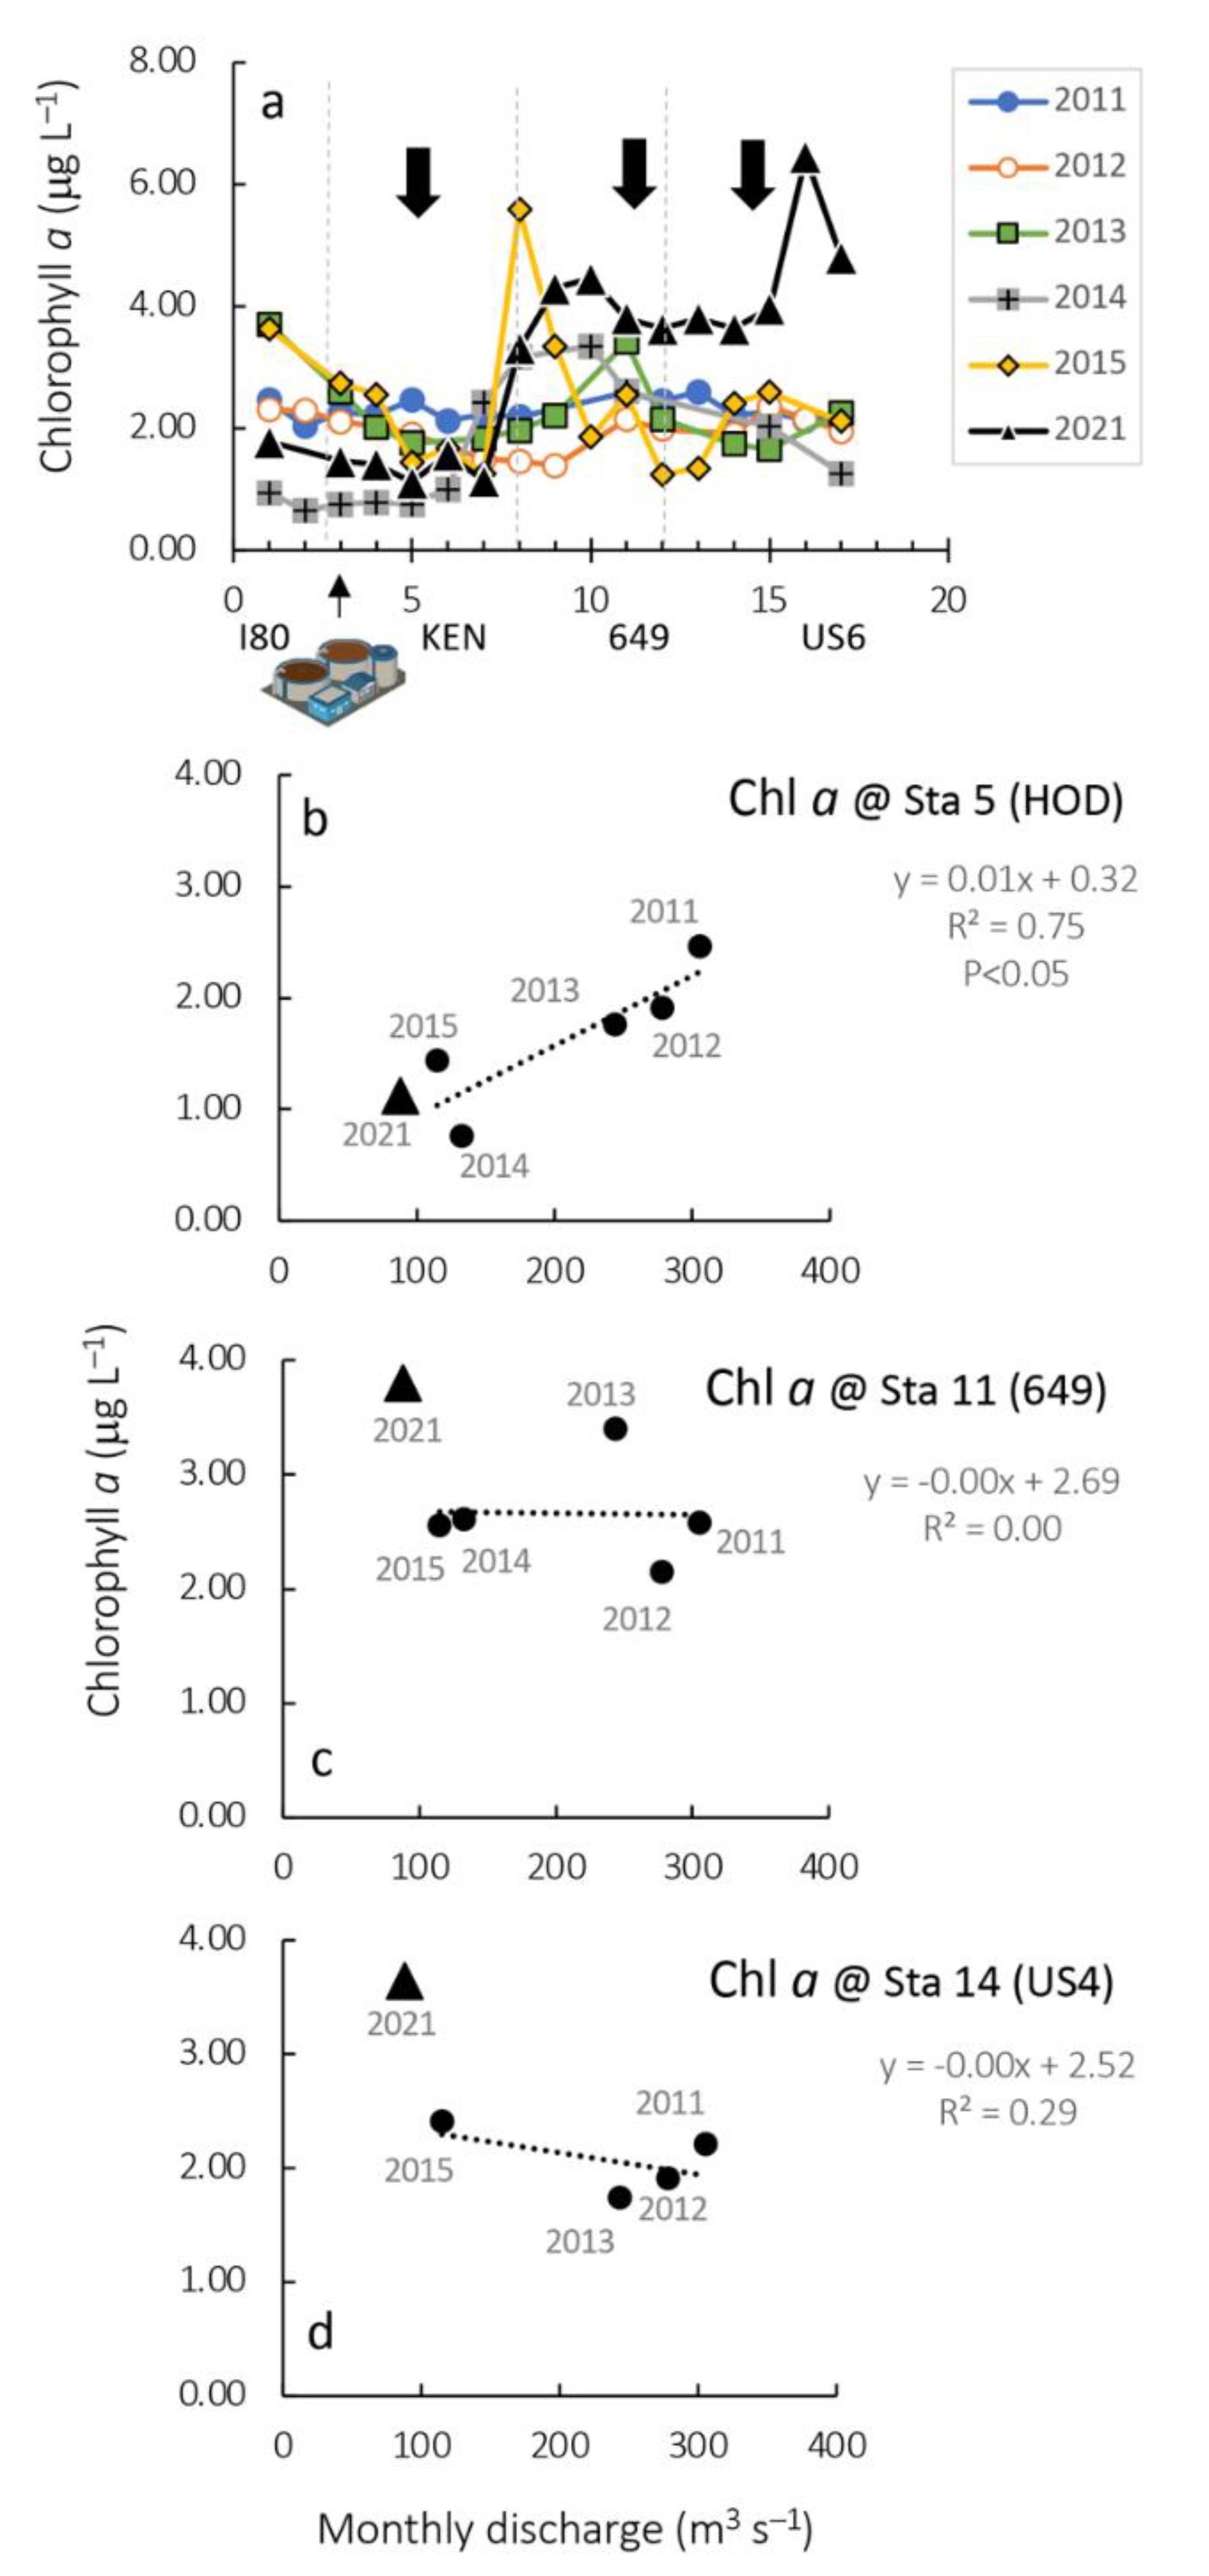
Concentrations of chl a varied considerably between years and sites (Figure 6a). In virtually all years, regardless of flow conditions, concentrations decreased in the first stretch of the river, up to Station 7 (KEN). This would suggest that the river above Station 1 (I80) was a source of chl a, and became diluted with wastewater effluent. Thus, at Station 5 (HOD), chl a concentrations for all years were significantly and positively related to flow (R2 = 0.75, p < 0.05, Figure 6b). Concentrations of chl a diverged with distance along the transect depending on flow and other conditions. For the two higher flow years (2011, 2012), concentrations of chl a did not significantly increase in the lower stretch of the transect. In the lowest flow year prior to upgrade (2015), concentrations increased rapidly at Station 8 (657), but then rapidly declined by Station 10 (653). For the post-upgrade sampling, chl a increased from Station 7 to 8, and remained high throughout the rest of the river transect, even increasing again in a short-lived peak at Station 16. For 2021, the average chl a in the lower river stretch (Stations 2–7) averaged twice (4.30 μg L−1) that observed in any of the other years of sampling (mean of 2.14 μg L−1). Thus, when chl a was correlated with flow conditions for Station 11 (649) and Station 14 (US4), no significant relationships were observed (Figure 6c,d). This underscores that algal biomass was not regulated solely by flow.
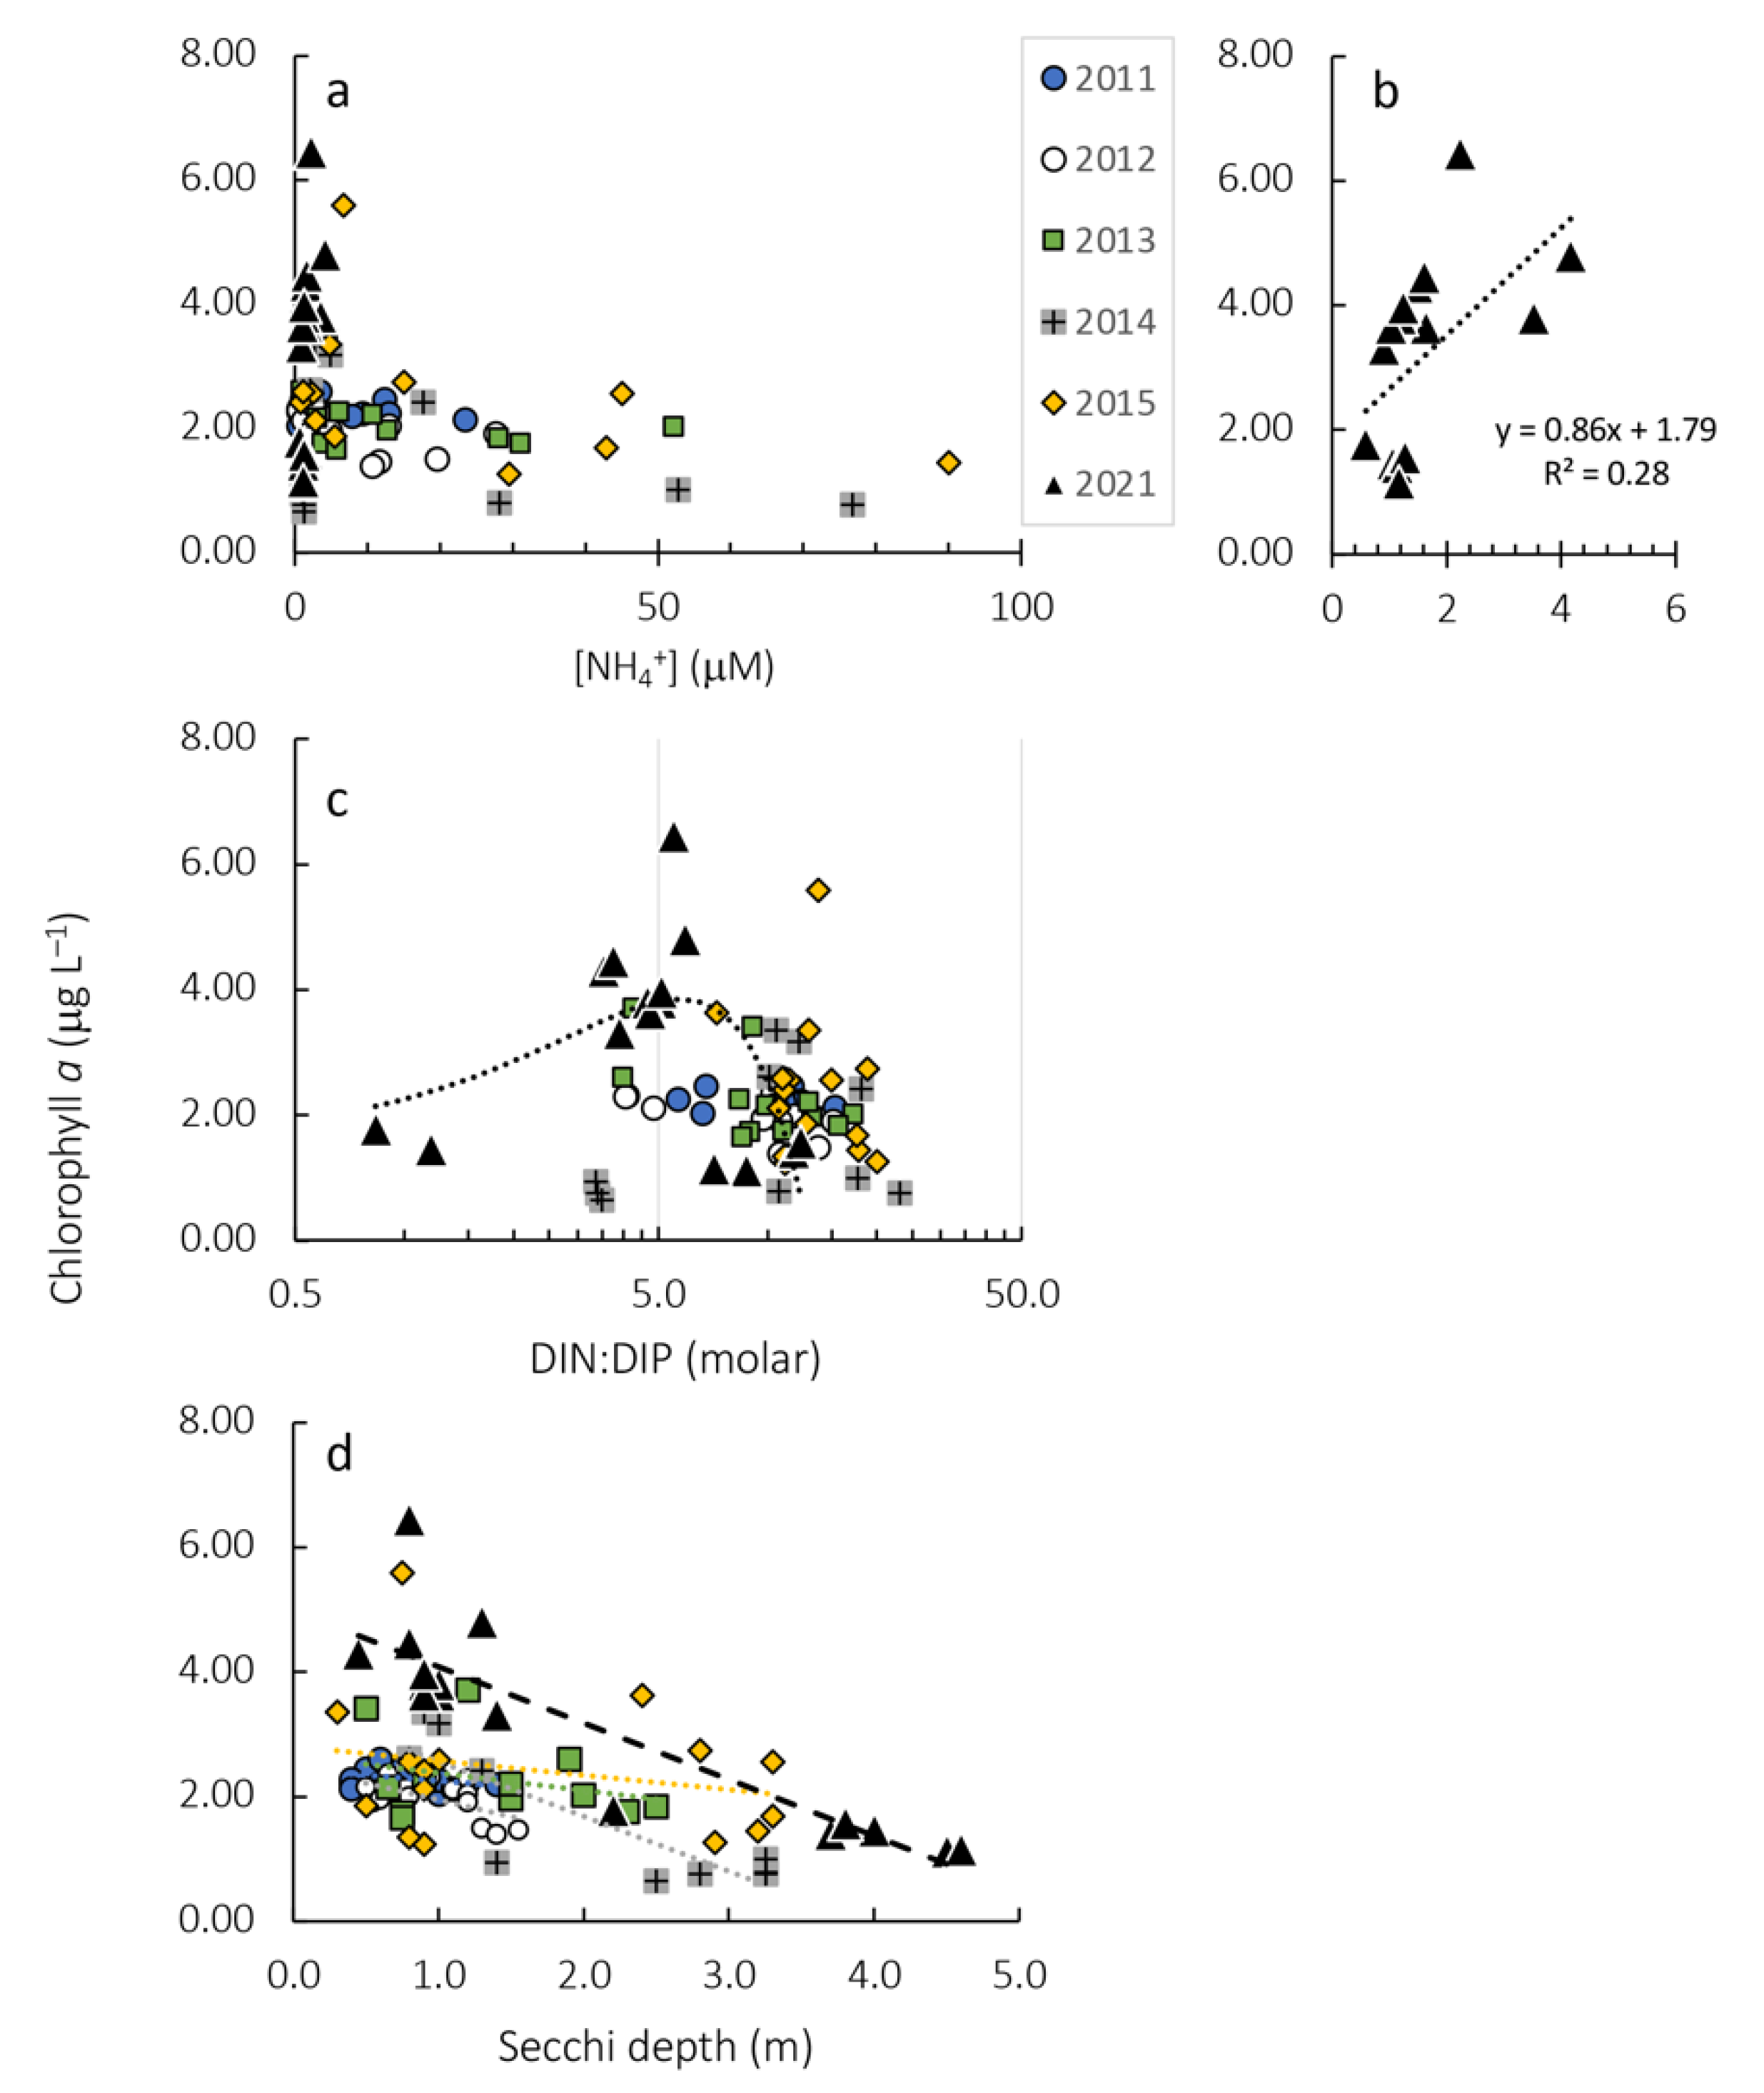
When chl a for all years, all stations, are compared with concentrations of NH4+, a clear decline can be observed with increasing NH4+ up to 90 μM (Figure 7a). Accumulations of chl a above 3 μg L−1 were witnessed only when ambient concentration of NH4+ was <5 μM. Indeed, for 2021, when concentrations of NH4+ remained <5 μM, a significant positive relationship with chl a was observed with NH4+ availability (Figure 7b). Highest concentrations of chl a were also observed when DIN:DIP was in the range of ~5 on a molar basis (Figure 7c).
When chl a for all years, all stations, are compared with light availability (as Secchi depth), an inverse relationship is apparent (Figure 7d, Table 1). This relationship was significant for 2012 (p < 0.05), 2014 (p < 0.01) and 2021 (p < 0.001). Higher light availability in the upper river reaches were related to comparatively lower chl a values, and as light decreased with distance along the transect, chl a increased. This trend was most apparent for 2021.
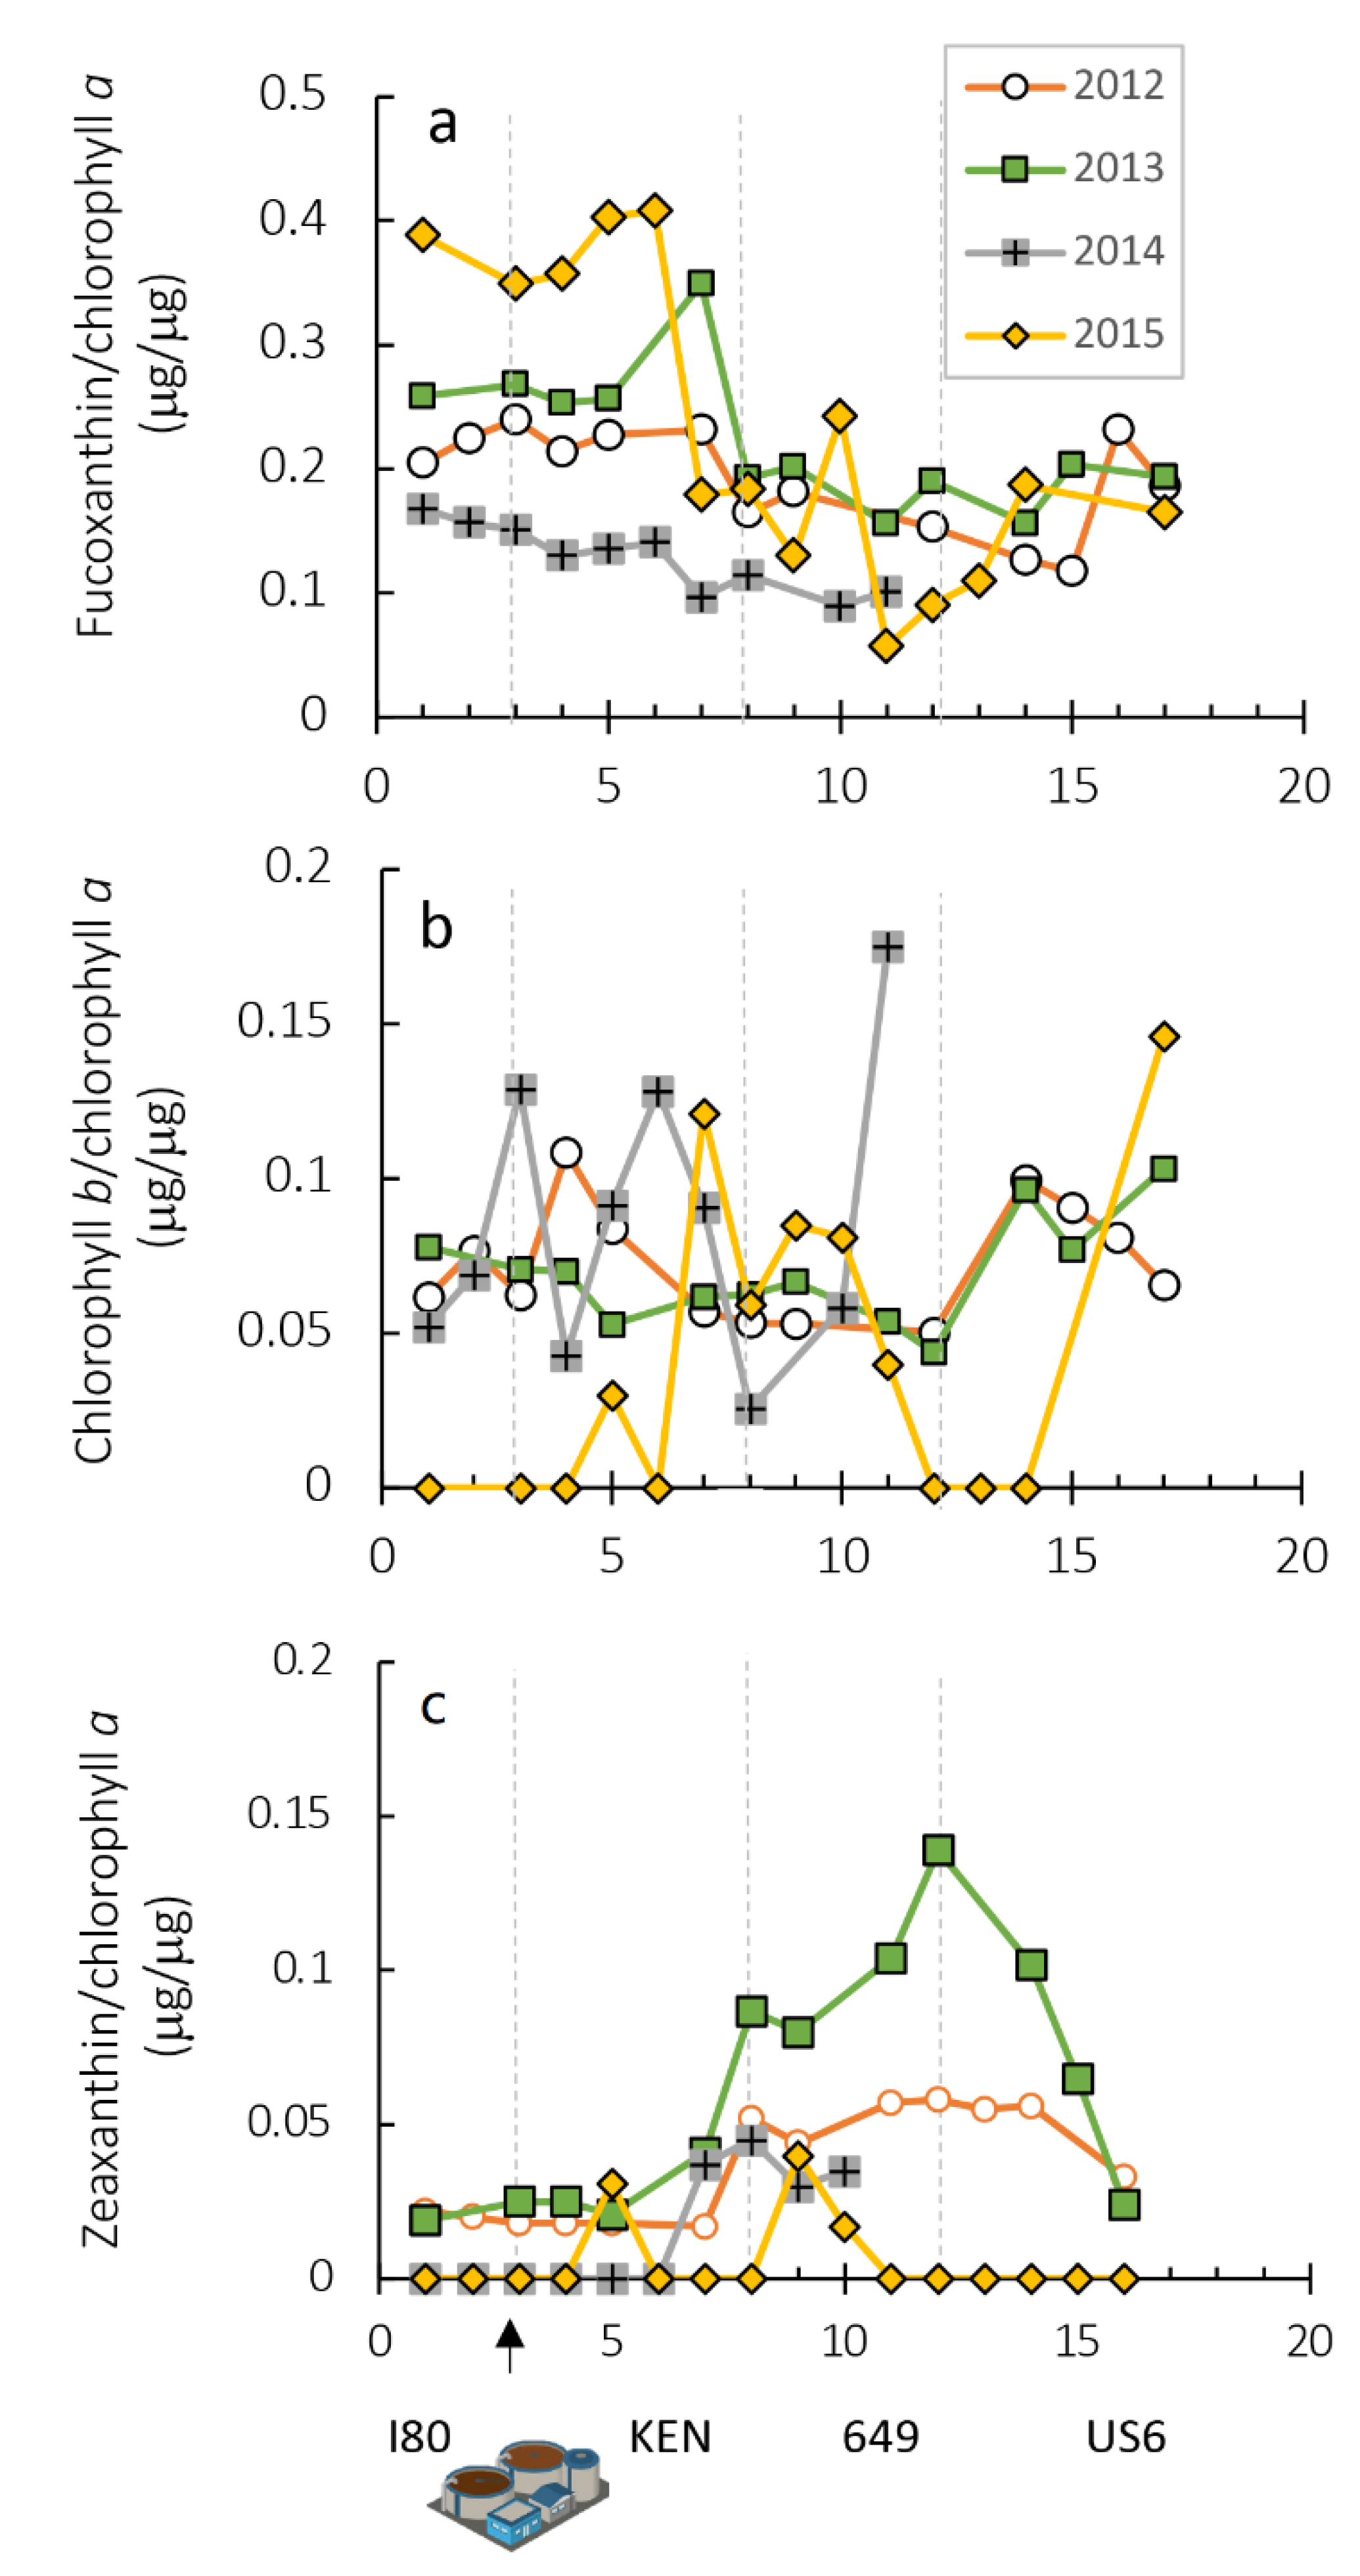
Using pigment ratios, the change in phytoplankton composition can be seen to vary between years prior to the WWTP upgrade (Figure 8). For the years prior to WWTP upgrade, the general trend in fucoxanthin/chl a was a decline from about Station 5 (HOD) to about Station 10 (653), then an increase for the remainder of the transect (Figure 8a). For chl b/chl a, much more variability was observed (Figure 8b). In 2013, there were only moderate fluctuations until Station 12 (US2) when an increase was apparent. In 2014, an increase in the proportion of chl b/chl a was observed down-estuary from Station 10 (653). In 2015, the driest year prior to WWTP upgrade, a peak was observed at Station 7 (ISL), and a secondary increase was observed at Station 17 (US7).
For the cyanobacterial fraction, reflected in the proportions of zeaxanthin/chl a, mid-transect peaks were seen in all years for which data are available (Figure 8c). The peaks were observed to begin in the range of Station 8 (657), and that of 2013 was particularly pronounced. Both 2012 and 2013 were wetter years.
No HPLC data are available for 2021, but an estimate of the relative diatom proportion was made using the rate of depletion of Si(OH)4 along the lower half of the transects [61]. To do so, the rate of depletion in Si(OH)4 was calculated for each year using data for the last segment of the estuary, from Stations 11 to 17 (649 to US7) (Table 2). Then, the slopes of those correlations were related to the fucoxanthin/chl a data for those years for which HPLC data were available. Using that relationship, the fucoxanthin/chl a ratio for 2021 at station 12 was estimated to be 0.16, or 80% higher than the value measured for 2015, the other very dry year.

3.4. Photophysiology

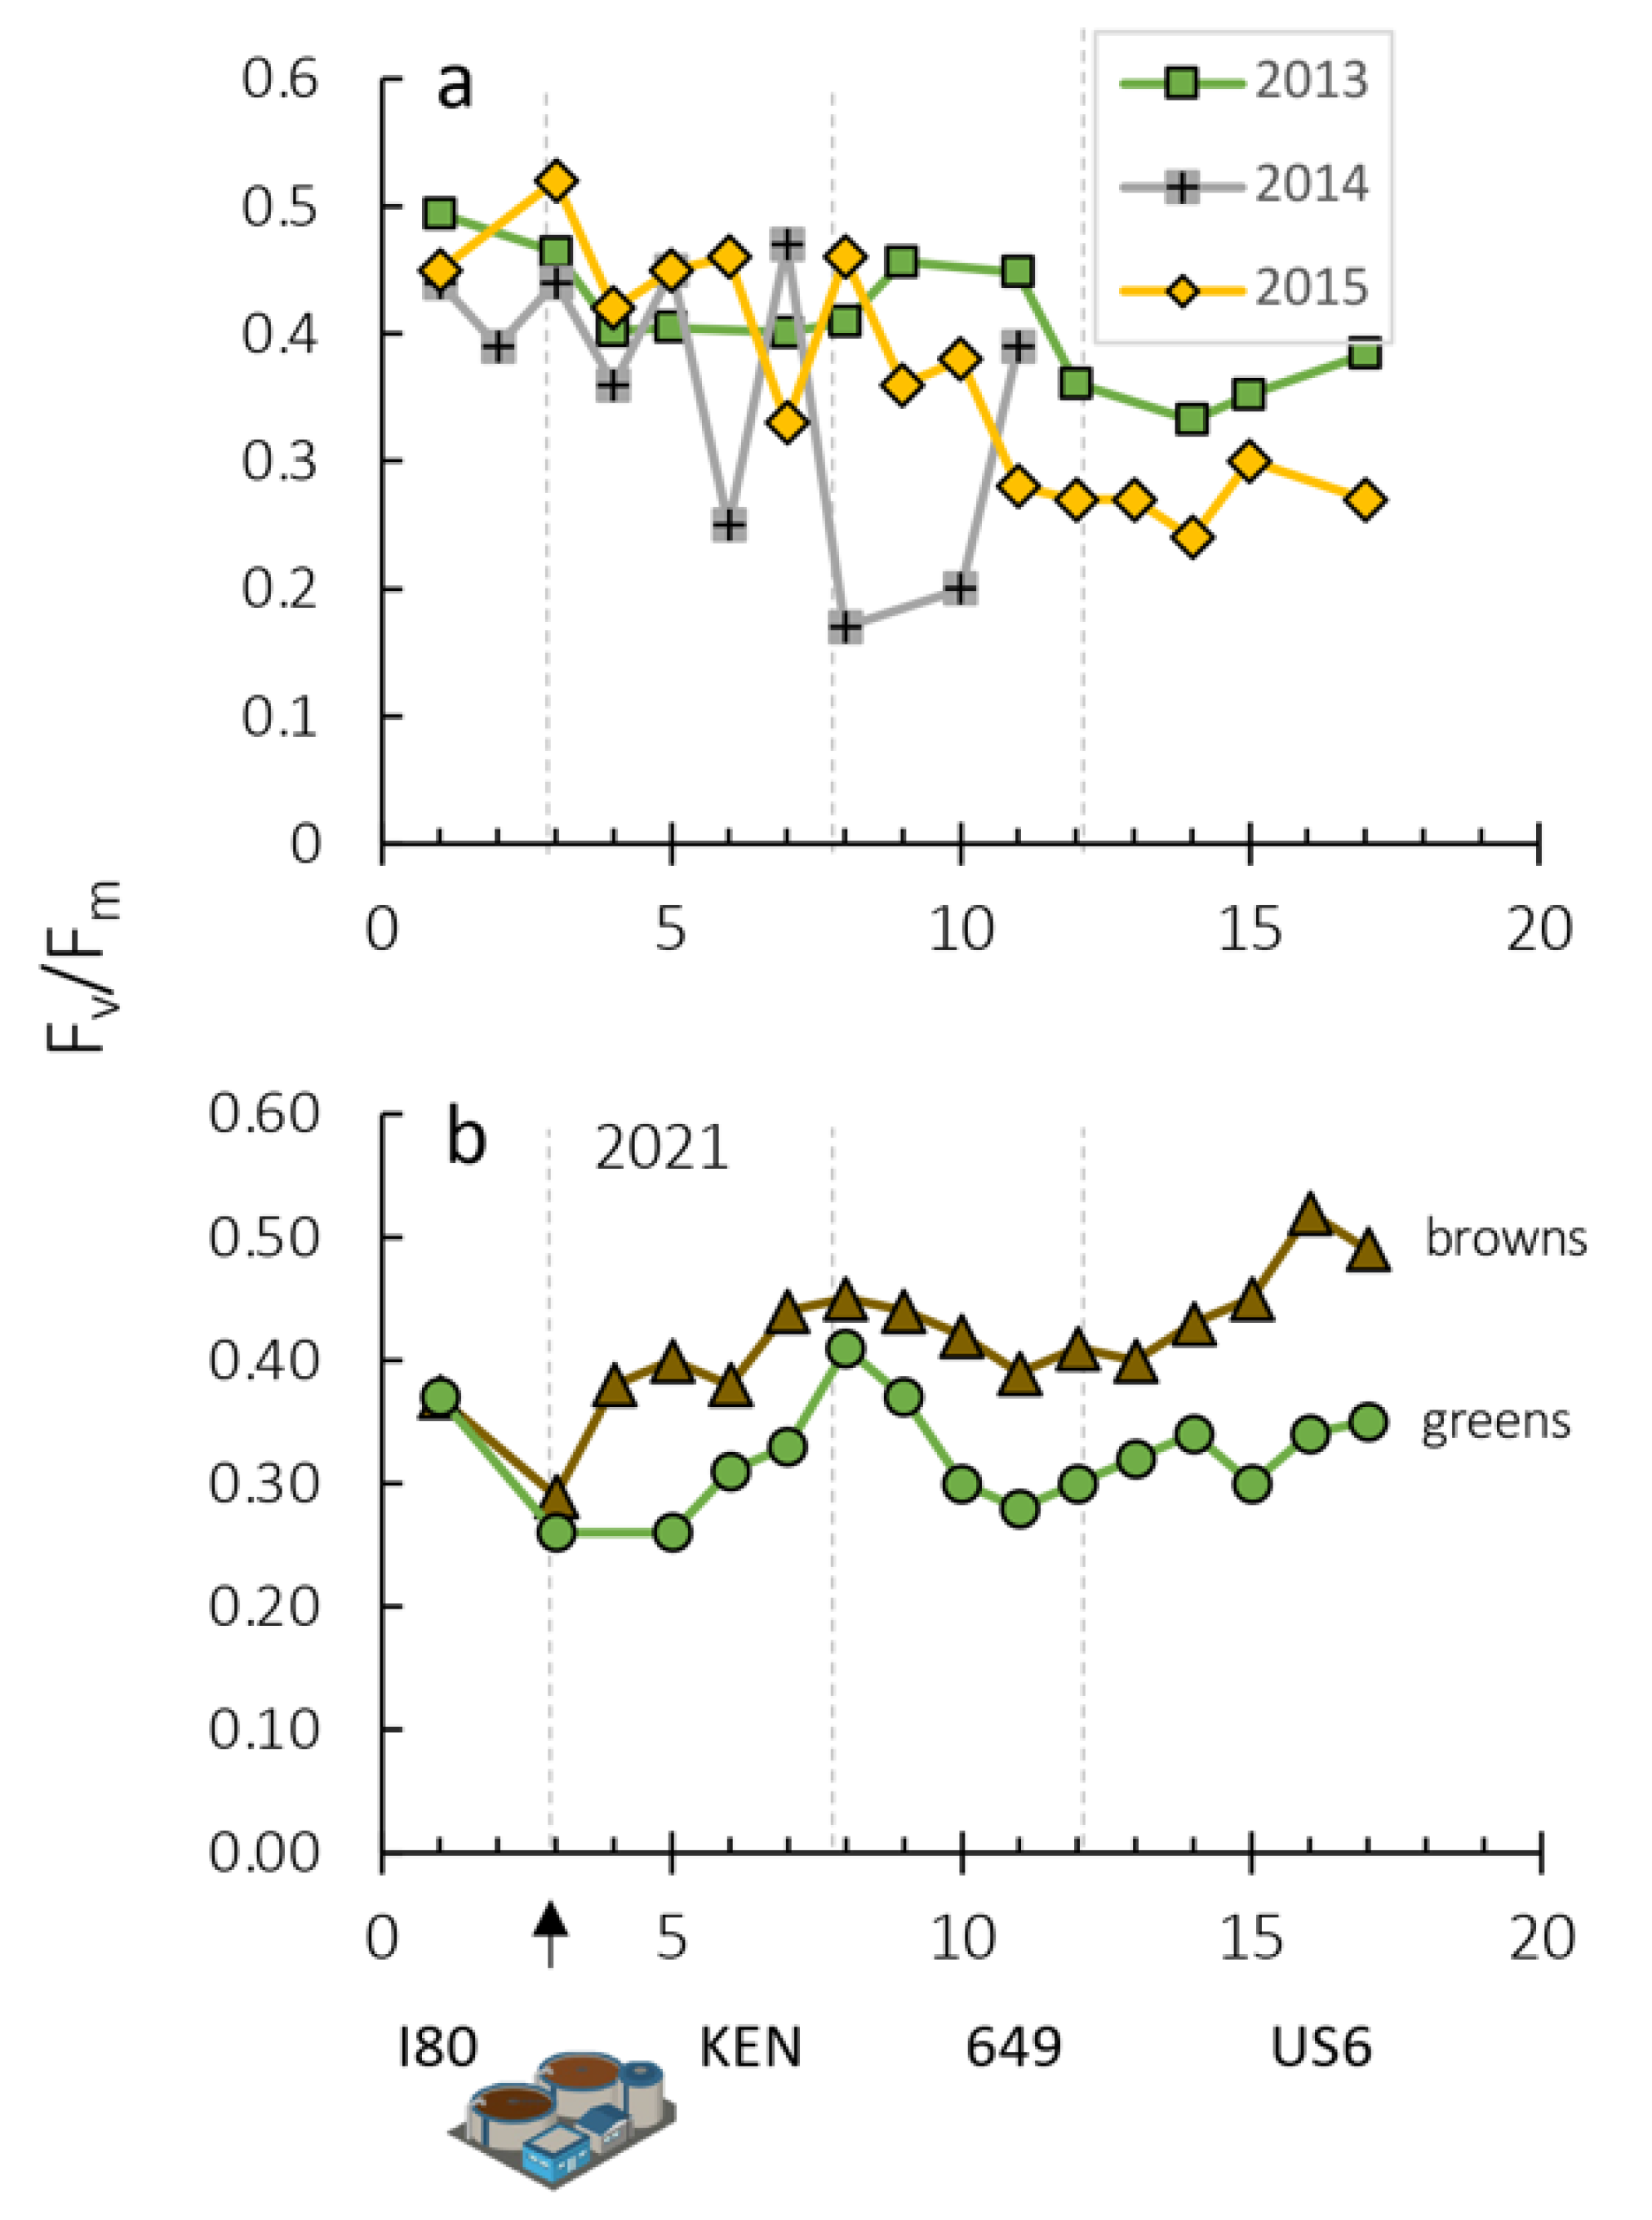
For the years prior to upgrade, values of FV/Fm—although displaying station-to-station variability—generally decreased down-estuary (Figure 9a). A greater decrease, indicative of greater stress, was observed in 2015 relative to 2013. Values for 2014 were much more variable, and actually increased from Stations 10 to 11.
For 2021, the Fv/Fm signal was deconvoluted for the brown (diatom) and green algae (note that the phycoerythrin signal was only discernable in the lower river sites, so a transect for this group of algae is not reported; Figure 9b). Fv/Fm was consistently and significantly higher for the brown compared to the green algae (ANOVA, p < 0.01), and neither showed a decline with river position; in fact, there was an increase in the brown Fv/Fm along the transect, from 0.29 at the point source of discharge (Station 3 (GRC) to 0.52 at Station 16 (US6). Comparing the two driest years, 2015 and 2021, at the entrance to Suisun Bay (Station 12, US2), the Fv/Fm for the brown and green algae were 0.41 and 0.30, respectively in 2021, while in 2015, the community Fv/Fm was 0.27.
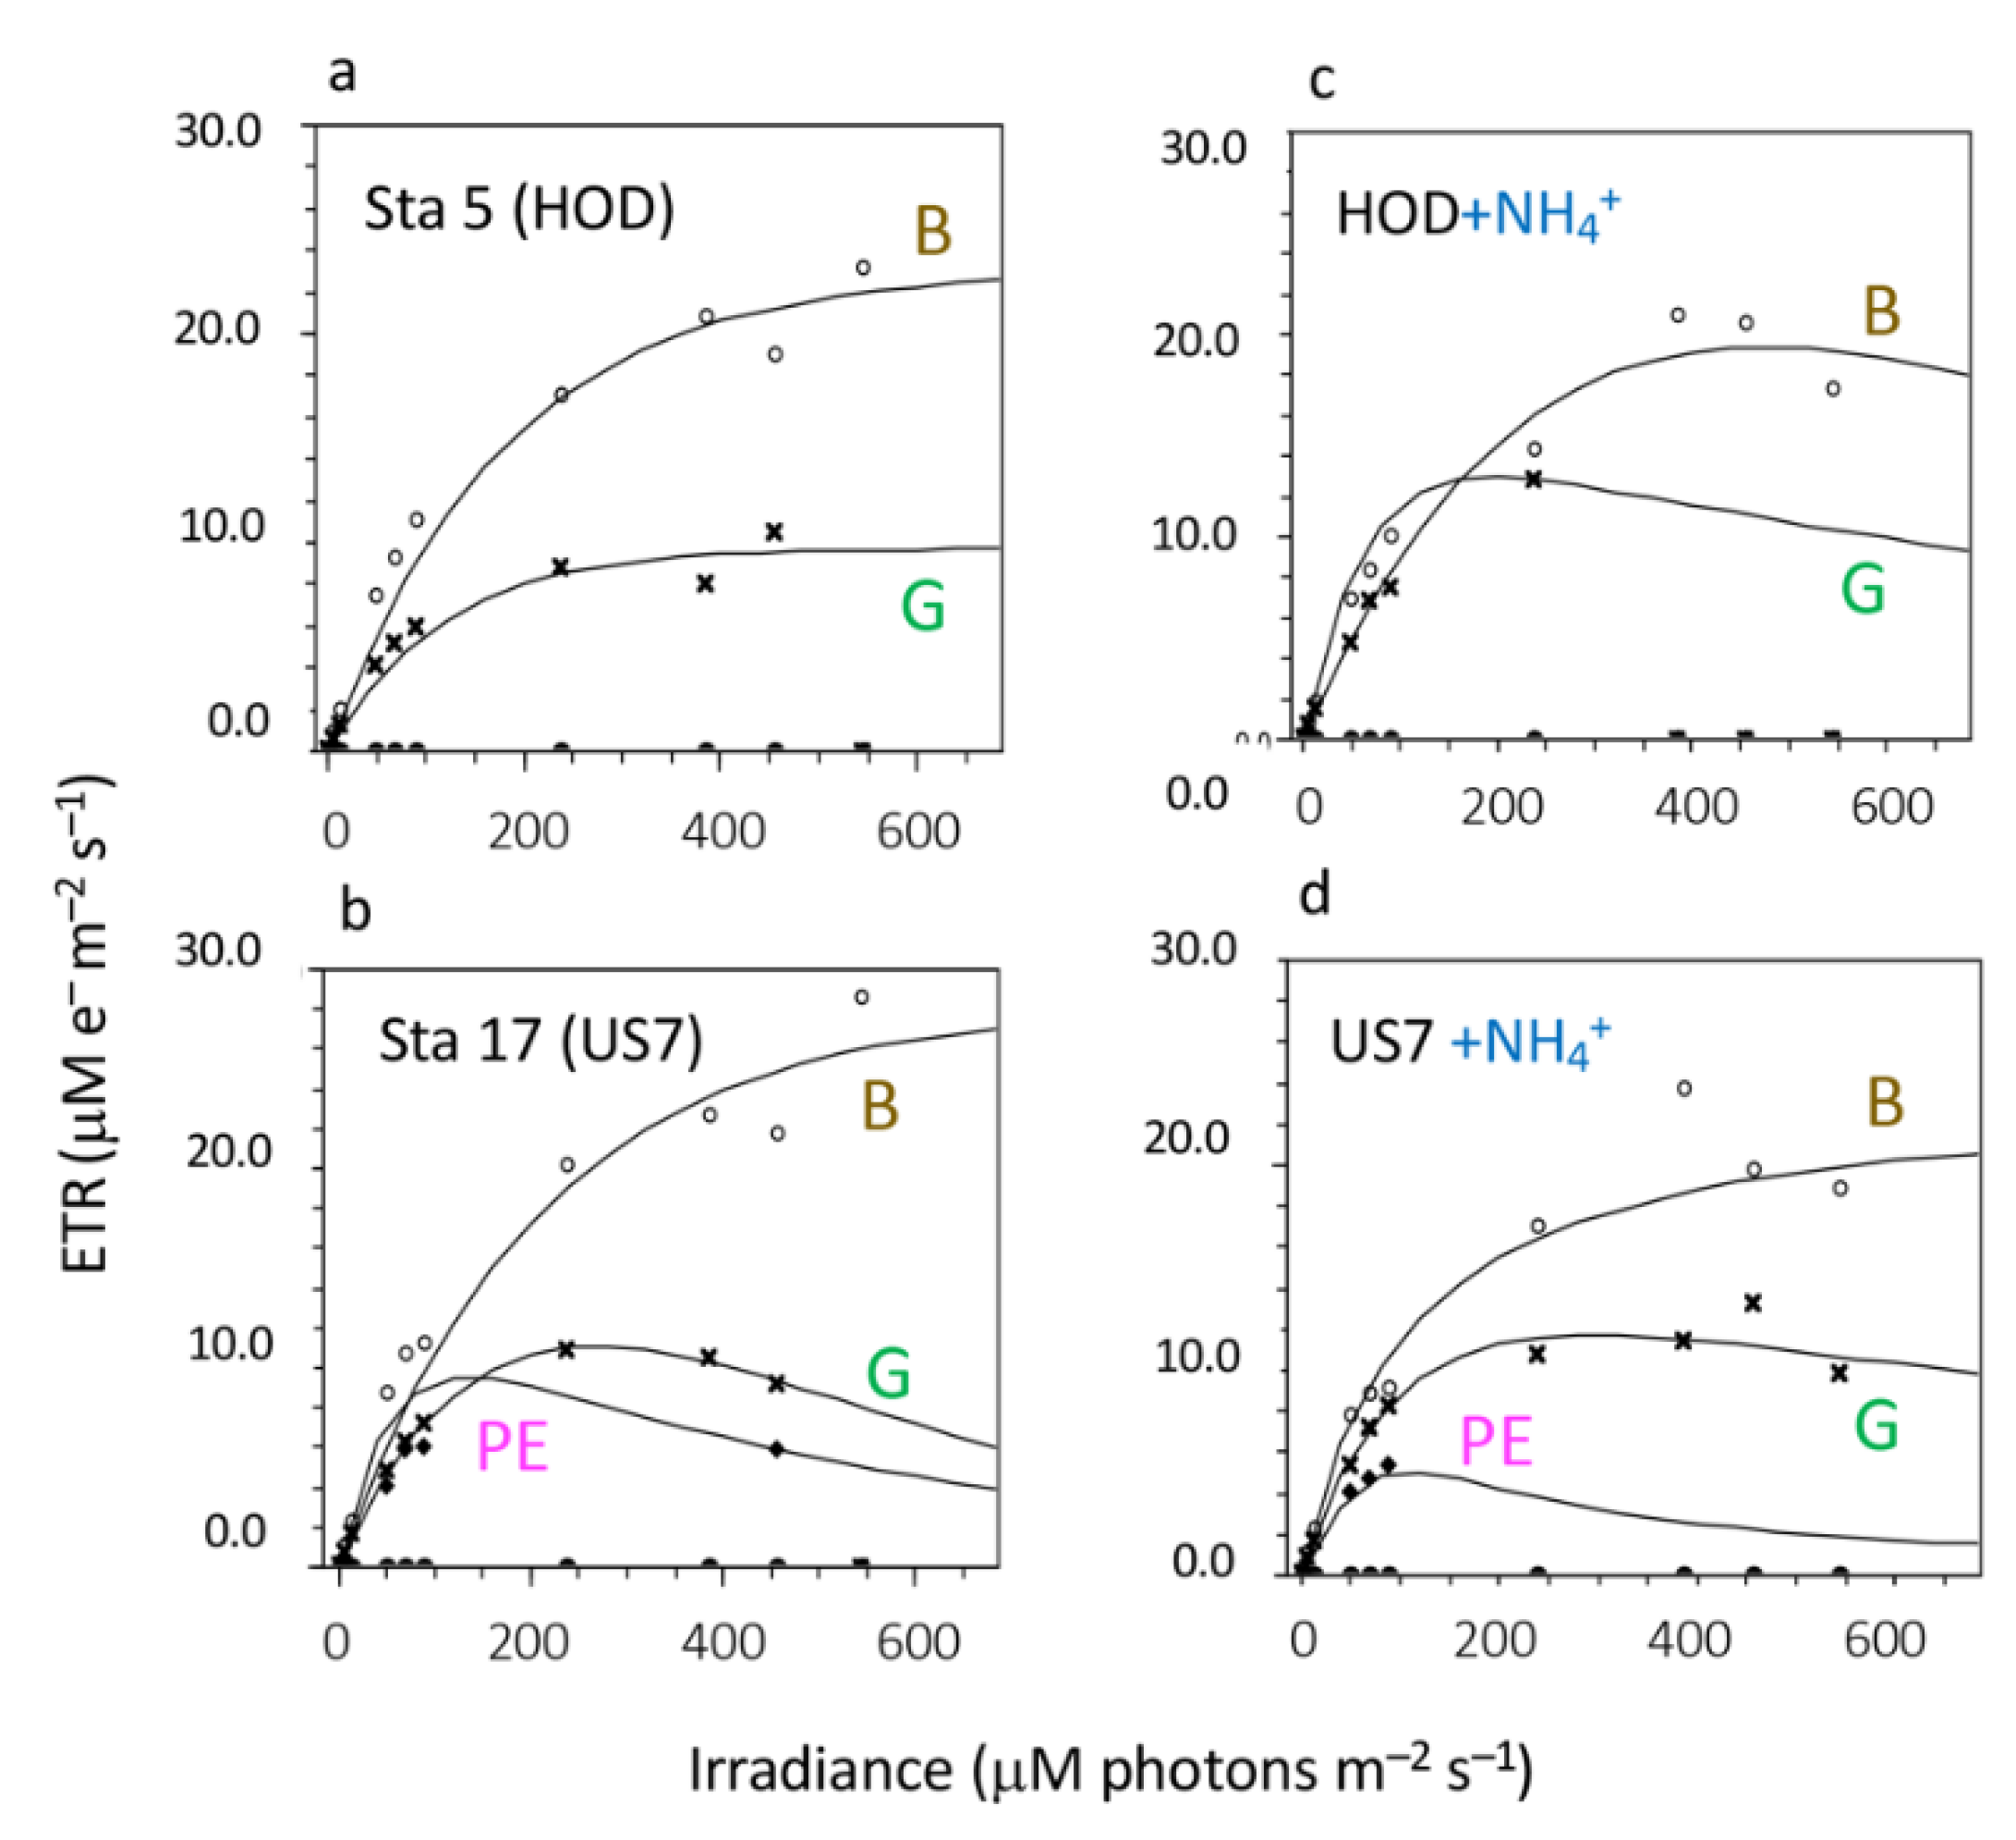
Rapid light curves conducted in 2021 revealed several patterns and provided several insights into photophysiology. First, for all stations, values of ETRmax for the brown algal fraction consistently exceeded those of the green algal fraction (Figure 10, Table 3). Second, for those stations for which experimental manipulations of NH4+ were conducted prior to assessment of RLCs, there was a general trend of decreasing ETRmax and a decrease in the value of α for the brown algal fraction. For the green algal fraction, changes with enrichment with NH4+ were not as consistent, and even increased with NH4+ enrichment for some stations. Third, only at the lower estuary sites (Station 17 (US7)) was there a signal that could resolve the phycoerythrin response. An increase in PE-containing cells in this region of the estuary would be consistent with the increase in zeaxanthin/chl a observed in 2012 and 2013.

4. Discussion

4.1. Major Trends and Interannual Responses

The role of sewage effluent in the ecology of the Bay Delta has long been a topic of considerable discussion and controversy, e.g., [1,17,18,26,27,28,38]. The complexity of the Bay Delta system—hydrologically and ecologically—cannot be underestimated. From phytoplankton to fish, the food web of this system has changed significantly over the past several decades [5,6,17,37,62]. Unlike conventional nutrient-impacted systems, the Bay Delta has experienced a decline in productivity as nutrient enrichment has increased over the past several decades. Declines in productivity have been ascribed to multiple causes, ranging from light limitation [37,38,39], to grazing by invasive clams [6,42,43] and suppressive effects of elevated NH4+ on phytoplankton production [1,7,17,18,51]. The Bay Delta ecosystem has also been significantly modified by other invasive species, not only by clams, but also by bay grasses, various species of copepods, and fish over the past several decades [63,64,65]. The roles of these various stressors need not be mutually exclusive. The WWTP—that had been responsible for the high loads of NH4+ to the upper Bay Delta—and its recent upgrade provides an ecosystem test of the hypothesis that NH4+ may have negatively impacted productivity over the decades over which it was in operation. The results presented here reflect a “first look” at the system change in the fall season, less than half a year after full implementation of EchoWater. These results reflect short-term phytoplankton responses and do not encompass all the biogeochemical and ecological feedbacks that will become apparent over years. It must be emphasized that the upgrade also occurred during one of the driest years of the past decade and ecosystem responses may also change if and when drought is alleviated.
The major findings emerging from the post-upgrade data are that more chl a accumulated in the estuary post-upgrade and, based on photophysiology, phytoplankton appeared to be less photosynthetically stressed with station position in the lower estuary compared with prior years. Prior to upgrade, concentrations of chl a above ~2 μg L−1 were not observed for any sample collected at any point along the transects in any year if NH4+ concentrations were elevated above 5 μM regardless of flow conditions, but over that range, chl a increased as NH4+ increased (Figure 7a,b). In the post-upgrade sampling, when N loadings decreased, concentrations of chl a doubled. The more than halving of N loadings also resulted in a comparable reduction in DIN:DIP. Faster phytoplankton growth rates are associated with higher relative proportions of P and more chl a was thus associated with a decline in DIN:DIP (Figure 7c), e.g., [48].
Concentrations of chl a were also negatively related to Secchi depth, and significantly so for 2012, 2014 and 2021 (Figure 7d). This would suggest, especially for the low flow year of 2021, a down-regulation of chl a content as a function of increased light. This finding seemingly contrasts with the notion that low primary production in the Bay Delta is largely controlled by light limitation, e.g., [37,38,39]. Secchi depths and chl a at station 5 (HOD) were significantly negatively correlated with monthly discharge (Figure 3f), further implicating acclimation to ambient conditions as the reason for lower chl a values upriver in 2021 compared to other years. From station 10 to 17, the Secchi values for all years were <1 m, and while modestly higher for 2021, they were not more than a 0.2 m higher than values recorded in 2013, 2014, or 2015. Light availability alone cannot explain the approximately 2-fold higher chl a accumulation down-estuary in 2021 compared with all prior studied years.
This study compared data collected in fall when blooms not only have been historically low, but seasonally have been shown to be comparatively rare [66]. The doubling of chl a observed here does not represent a bloom, but it was a significant change compared to five prior fall samplings encompassing a range of flow conditions. Fall is also a period when grazing pressure by Potamocorbula is likely highest, e.g., [6] but no direct grazing data are available for the post-upgrade period. Observations will be required in additional seasons to fully understand the magnitude of ecosystem effects from nutrient reduction.
The data herein suggest that the elevated NH4+ in effluent prior to the WWTP upgrade—reaching concentrations of many tens of μM—impacted phytoplankton in multiple ways. In addition to suppressed chl a accumulation, the general trend in Fv/Fm for the samples collected during pre-upgrade years trended downward with distance along the river, indicating stress, while post-upgrade values trended upwards for the brown (diatom) phytoplankton component post-upgrade, indicating increased photosynthetic efficiency (Figure 9). Additionally, the experimental manipulations of samples with NH4+ prior to measuring the photosynthetic response indicated a decrease in ETRmax and in α in the brown (diatom) fraction of the treated samples compared to the untreated samples (Figure 10, Table 3). The decrease in α values also provides potential insight into light limitation in NH4+-laden waters. Lower α would imply that the cells could not photoacclimate to low light conditions as well. Accordingly, light stress would be more apparent. Diatoms have highly effective non-photochemical quenching (NPQ, xanthophyll cycling) to protect photosynthetic pigments from sudden exposure to high light. Xanthophyll cycling activity in diatoms is much higher than that of higher plants and has been referred to as “super-NPQ” [67]. Previous studies have shown that additions of very high concentrations of NH4+ can abolish the formation of NPQ [67]. Future studies will explore NPQ changes in Bay Delta phytoplankton in more detail, and on longer time scales than the RLC experiments conducted here.
Years of different flow, combined with changing nutrient regime, led to differences in the phytoplankton community. In the pre-upgrade years for which pigment data are available, the diatom fraction declined down-estuary, while that of the green algal fraction or the cyanobacterial fraction increased (Figure 8). Many algae and higher plants have lower rates of growth on NH4+ than on NO3 [34,68] (and references therein). The effect of NH4+ on NO3 metabolism is complex. It can cause repression of uptake of NO3, it can lead to degradation of nitrate reductase (NR), the enzyme necessary for NO3 assimilation, and it can suppress synthesis of new NR in the cell [29,69,70]. Repression of key NO3 enzymes requires time for the cell to recover, and thus along a transect down-estuary—especially when flow is high—cells may not have sufficient time to do so and grow. Cells generally do not de-repress (express an ability to transport and metabolize NO3) unless their internal N status is sufficiently low [71,72]. With exposure to NH4+ at the level of 10 s to nearly 100 μM, the internal NH4+ concentrations can remain high for an extended time.
Diatoms also have a dependence on the reduction of NO3 to NO2 in cellular energy balance. They can reduce NO3 via NR in a non-assimilatory mode [73,74,75,76] and this process serves as a sink for excess reductant that derives from the splitting of water when photochemistry exceeds the assimilatory capacity of the cell. Clearly an important criterion for this pathway to function is the availability of NO3 and its key enzymes in the cell. Without this pathway, cells become stressed. This effect likely contributed to the stress seen in the photosynthetic efficiency (Fv/Fm) in the pre-upgrade years. After upgrade, the diatoms were no longer stressed by lack of the NO3 reduction pathway to protect the chloroplast from over-reduction. After upgrade, the depletion of Si(OH)4 increased down-estuary, further suggesting growth by diatoms (Figure 5c).
Green algae and cyanobacteria do not depend on NO3 reduction for energy balance in the same way as diatoms. Chlorophytes have well developed Mehler activity for energy balance, and they, as well as cyanobacteria are generally considered to show less stress in the presence of elevated concentrations of NH4+, e.g., [29,77]. Both of these algal groups trended upwards with distance down-estuary (Figure 8b,c).
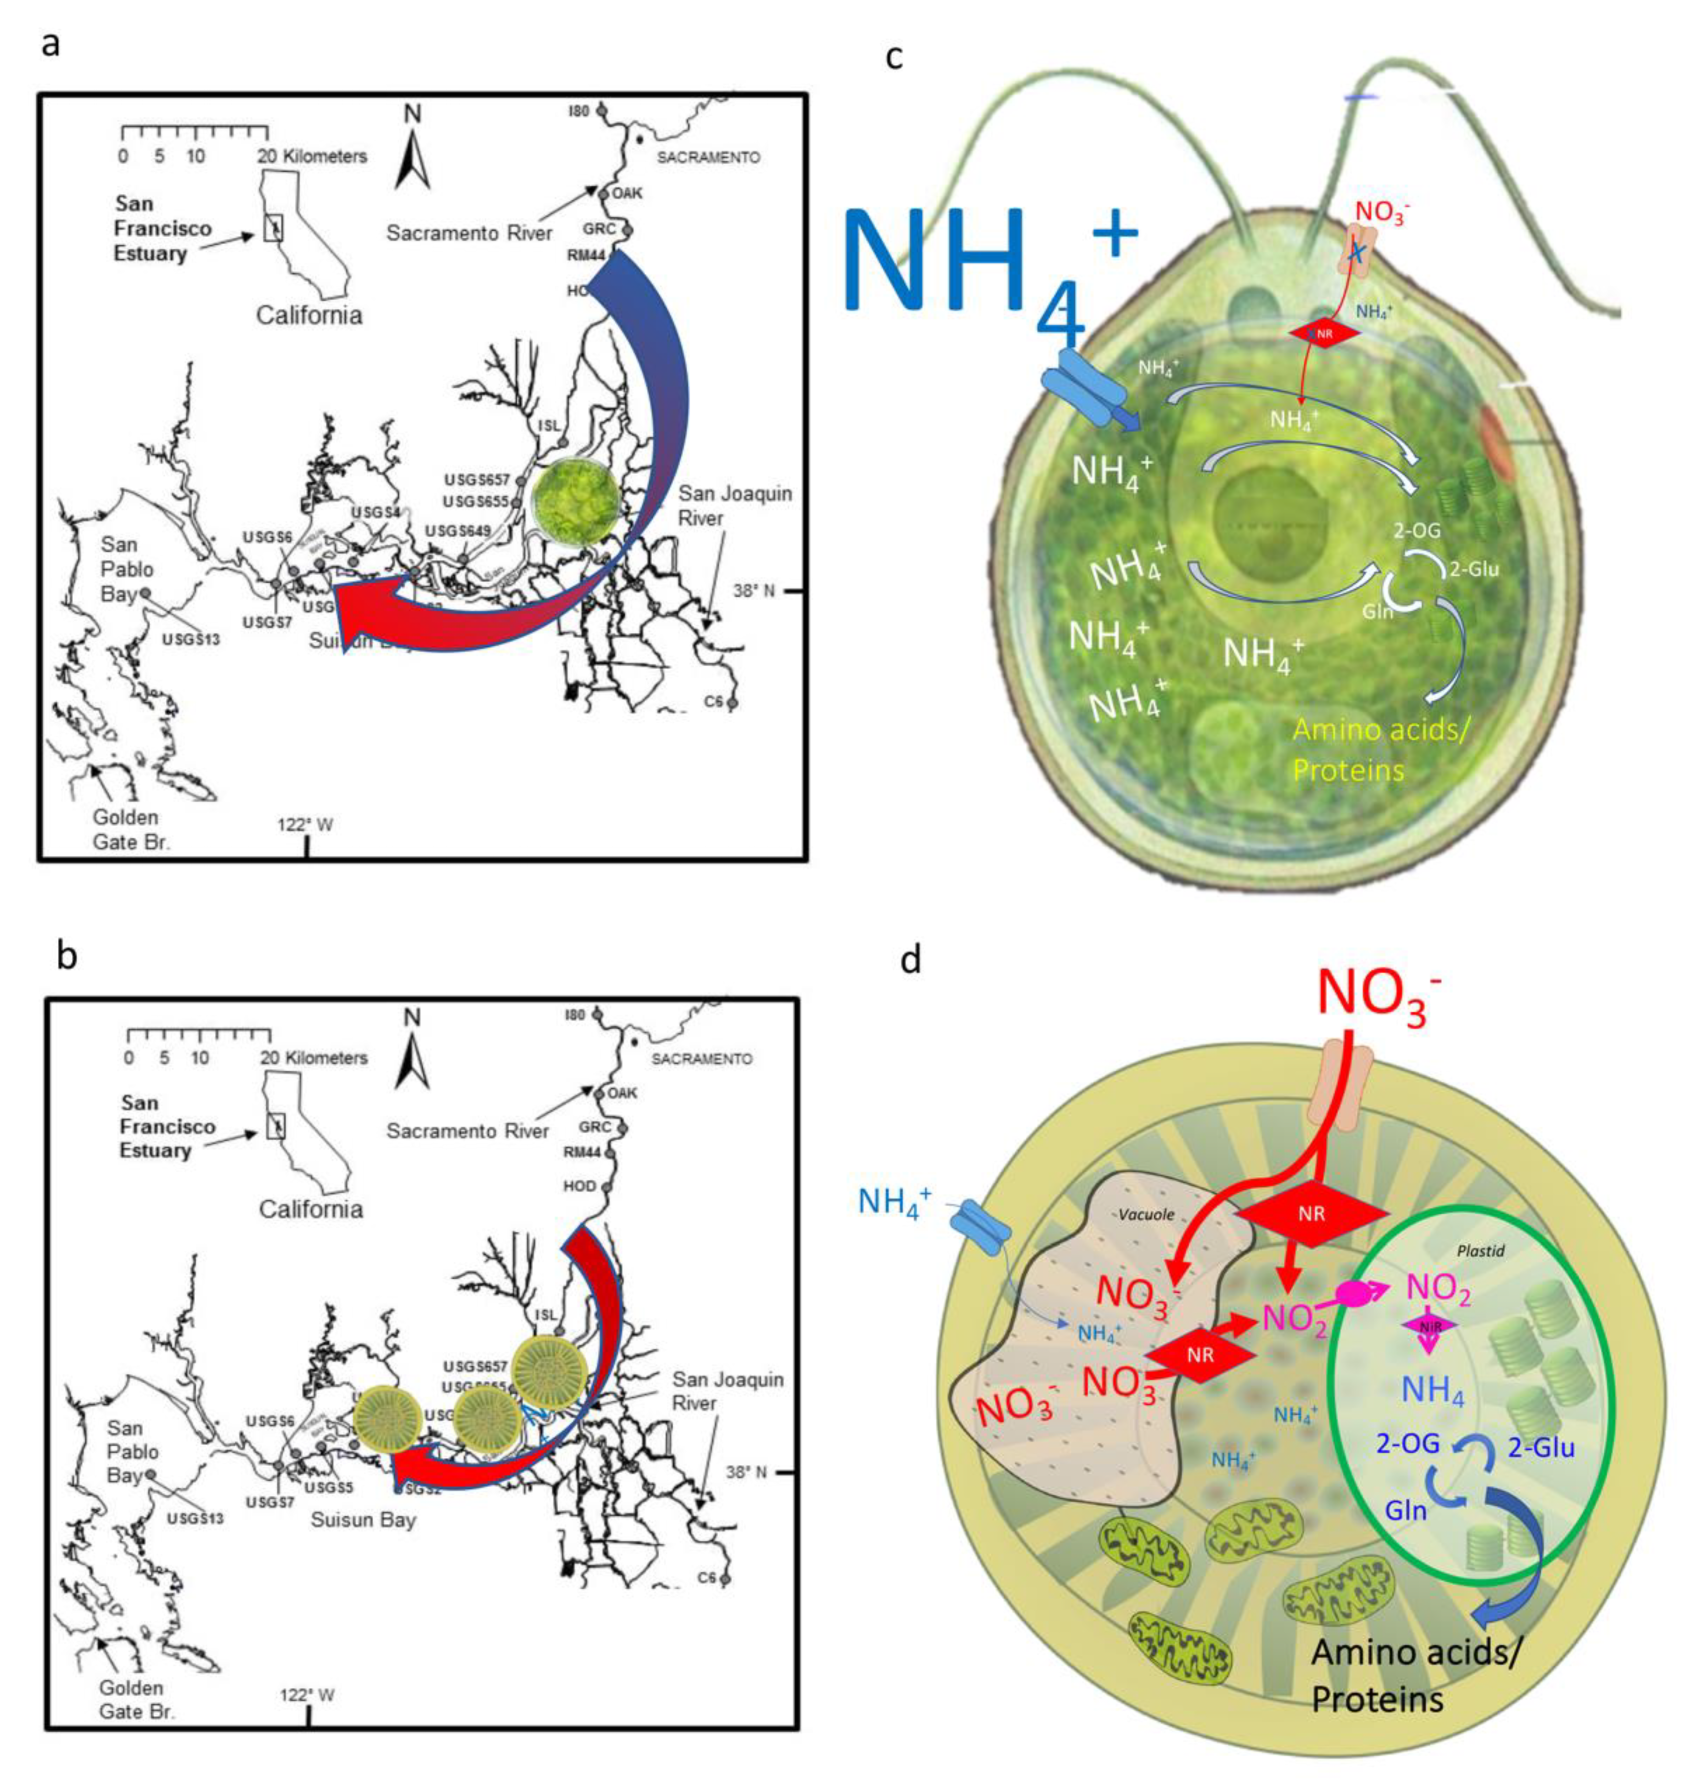
Building on these physiological pillars, a conceptual model comparing the responses of 2015 and 2021, the driest of the studied years, can be developed (Figure 11). In comparing these years, flow effects can be considered minor. In 2015, the effluent pulse of NH4+ was 90 μM (Figure 4a), and in 2021, at the site of effluent discharge it was 1.1 μM. In 2015, although nitrification led to accumulation of NO3 of ~40 μM through most of the river transect (after Station 7 (ISL)), cellular accumulation of NH4+ did not allow diatoms to access this nutrient substrate. Chlorophytes (based on chl b/chl a ratios) and a short-lived peak of cyanobacteria (based on zeaxanthin/chl a) developed in the region of Station 8 (657), but they rapidly declined. Down-estuary in 2015, both diatoms and chlorophytes remained, but in a comparatively more stressed condition, as evidenced by declining photosynthetic efficiency (Figure 9a).
In contrast, in 2021, chl a rose after Station 8 (657) and did not decline substantially down-estuary (Figure 6a). Values were approximately twice those observed in previous years. Diatom abundance in Suisun Bay were estimated to be up to 80% higher than in 2015. The diatom photosynthetic efficiency (Fv/Fm) increased. The green algal fraction also showed an increase in Fv/Fm at Station 8 but did not otherwise vary substantially along the transect (Figure 9b).
While the biogeochemical response of the Bay Delta to this ecosystem-scale change in nutrient loads and concentrations will likely play out over longer time scales, the photophysiological response documented here appears to provide a sensitive indicator of changes at the base of the foodweb.

4.2. Importance of Physiological and Ecosystem Scale Experiments

Lessons can be learned from both short-term experimental studies and ecosystem-scale level changes in this and other systems. For example, Berg et al. [26] conducted a laboratory study with species isolated from the Bay Delta, grown on NO3, then exposed to NH4+ at varying concentrations in order to mimic the exposures such species would encounter under effluent exposure. However, cultures were not given time to deplete internal pools before physiological measurements were undertaken. Berg et al. [26] did observe variable taxon and concentration effects. Recently, Strong et al. [27] conducted a single 48 h amendment experiment with water from upstream and downstream of the Sacramento wastewater plant prior to upgrade and exposed samples to two light intensities, 50% and 5% of natural irradiance, the latter being light-limiting for growth. They used those data to conclusively state that “NH4+ from wastewater are not likely to be the cause of POD in the Delta... [and that] high anthropogenic NH4+ loading from wastewater effluent is not driving the lower productivity and decline of pelagic organisms in the Delta [27] (p. 14). Interestingly, Glibert et al. [24] conducted similar incubation experiments with multiple substrates and light intensities (50% and 15% of natural irradiance) over multiple seasons and years and found that different microbial communities developed when enriched with oxidized vs. chemically reduced forms of N, and that proportionately more chl a and fucoxanthin was produced per unit N taken up when enriched with NO3 compared to NH4+ at reduced light levels. Such a finding may have relevance to the additional chl a in the down-estuary sites in 2021 compared with prior years. The comparison of results from these experimental studies [24,26,27] highlights that there is still much to be learned regarding physiological responses and how they can change with experimental treatment and other factors. A key difference in the studies by Strong [27] and Glibert et al. [24] was the use of 5% vs. 15% of surface irradiance as a low light treatment.
The potential for variable responses to NH4+ enrichment over time and by different community assemblages was highlighted in a long-term study by Swarbrick et al. [33] in the Qu’Appelle Lakes of the Northern Great Plains of Canada. By using 72 h nutrient bioassays with NH4+, these authors assessed the effects of NH4+ over the growing season of two lakes over 16 years (1996–2011), a period during which use of N fertilizer in the watersheds increased. They found that with NH4+ enrichment, the phytoplankton responses (as Chl a) ranged from a 2691% increase (mean stimulation = 188.1 ± 365.8%) to a 160% suppression (mean suppression = 54.5 ± 25.7%). With time, the frequency of spring suppression and of summer stimulation increased markedly over the studied period. Growth enhancement by NH4+ was greatest when phytoplankton communities exhibited a high abundance of chlorophytes, consistent with earlier studies which demonstrate chlorophytes prefer NH4+ over other forms of N [24,29,77,78,79] (and that they can outcompete other taxa for chemically reduced N species when light is sufficient) [80]. In contrast, NH4+ pollution was likely to suppress lake production during spring, when low-light adapted phytoplankton (diatoms, cryptophytes, possibly pico-cyanobacteria) predominated.
Other large-scale or mesocosm-level nutrient manipulation experiments further support the notion that dichotomous communities develop in response to comparable NH4+ and NO3 enrichment. For example, in mesocosm studies Glibert and Berg [81] showed that NO3 uptake was directly related to the fraction of the community as diatoms, while the proportion of NH4+ uptake was directly proportional to the fraction of the community as cyanobacteria. Domingues et al. [82] also showed that enrichment by NH4+ in a freshwater tidal estuary favored chlorophytes and cyanobacteria, whereas diatoms were favored under NO3 enrichment. Shangguan et al. [83] showed a shift in phytoplankton taxa to smaller sized cells and a loss of diatoms as NO3 availability declined with managed flow changes in lakes near northern Florida Bay. They also showed [84] in mesocosm studies based in Florida Bay that P enrichment along with N in the form of NO3 stimulated diatoms while N in the form of NH4+ led to picocyanobacteria-dominated communites. Fawcett and Ward [85] showed an acceleration of uptake of NO3 by diatoms in mesocosm studies in Monterey Bay, CA, suggesting this to be a mechanism by which diatoms exploit upwelling conditions. In all, various results from short-term nutrient enrichment studies, e.g., [24,84,85], month-long mesocosm experiments [78,86], long-term monitoring [87,88], and mass-balance studies [89,90] from many regions show that effects of N form vary with taxa and environmental conditions at the time of exposure. Cloern [28] has urged caution in interpreting correlations in interpreting causes and effects. We agree and similarly advise caution in disregarding understanding of relationships derived from comparative systems.

5. Summary

There is no doubt that the Bay Delta will continue to experience multiple stresses in the future and the conversation regarding causes and impacts of various drivers will continue for years to come. The results of this natural ecosystem-scale experiment should be of interest not only to the Bay Delta management community, but to all systems undergoing natural or anthropogenic changes in nutrient loadings, forms and proportions.
In sum, this study has shown that following wastewater improvement and the removal of high NH4+ loading from the Sacramento River, there was a significant ecological change in the river-estuary in contrast to water quality parameters at the same time of year for several years prior to upgrade. It appears that EchoWater had an immediate effect on chl a accumulation, and the extent to which this effect continues in the future deserves continual assessment. An increase in chl a in the post-upgrade relative to pre-upgrade conditions was associated with cells, especially diatoms, that showed less photosynthetic stress relative to the phytoplankton assemblages in pre-upgrade years. Time will tell whether the Bay Delta estuary recovers to a healthy state, including a healthy food web. These early glimpses into the trajectory of recovery of the important primary producers are promising.

Author Contributions

Conceptualization, P.M.G., F.P.W., R.C.D. and A.E.P.; methodology, P.M.G., F.P.W., R.C.D. and A.E.P.; formal analysis, P.M.G., F.P.W., R.C.D. and A.E.P.; investigation, P.M.G., F.P.W., R.C.D. and A.E.P.; data curation, F.P.W., A.E.P., R.C.D. and P.M.G.; writing—original draft preparation, P.M.G.; writing—review and editing, F.P.W., R.C.D. and A.E.P.; project administration, F.P.W. and P.M.G.; funding acquisition, F.P.W., R.C.D., P.M.G. and A.E.P. All authors have read and agreed to the published version of the manuscript.

Funding

This work was supported by the Delta Stewardship Council (Agreement Number 2038), State and Federal Contractors Water Agency (Agreement Number 12–20), State Water Contractors Agreement Number 20–43, NASA Grant NNX14AD79G and California Department of Fish and Wildlife Agreement Number Q1996035.

Data Availability Statement

Data are being deposited with the Environmental Data Initiative (EDI) https://environmentaldatainitiative.org/.

Acknowledgments

We thank S. Blaser, J. Wilson, S. Randall, E. Antell, A. Pimenta, J.Lee, N. Travis, T. Lee, S. Strong (Estuary and Ocean Science Center, San Francisco State University), J. Alexander (UMCES), and S. Murasko (Florida Fish and Wildlife Research Institute) for participation in sample collection on cruises and lab analyses, the Horn Point Analytical Services Laboratory for HPLC data for 2011–2013 and C. O. Davis (Oregon State University) for providing HPLC data for 2014 and 2015, and T. Kana and Bay Instruments, LLC., for providing the PhytoPAM II for use in this project. This is contribution number 6227 from the University of Maryland Center for Environmental Science.

Conflicts of Interest

The funders had no role in the design of the study; in the collection, analyses, or interpretation of data; in the writing of the manuscript; or in the decision to publish the results. PMG is a co-owner of Bay Instruments, LLC.

References

  1. Dugdale, R.C.; Wilkerson, F.P.; Hogue, V.E.; Marchi, A. The role of ammonium and nitrate in spring bloom development in San Francisco Bay. Estuar. Coast. Shelf Sci. 2007, 73, 17–29. [Google Scholar] [CrossRef]
  2. Sharp, J.H. Marine and aquatic communities, stress from eutrophication. In Encyclopedia of Biodiversity; Levine, S., Ed.; Academic Press: Amsterdam, The Netherlands, 2001; Volume 4, pp. 1–11. [Google Scholar]
  3. Yoshiyama, K.; Sharp, J.H. Phytoplankton response to nutrient enrichment in an urbanized estuary: Apparent inhibition of primary production by overeutrophication. Limnol. Oceanogr. 2006, 51, 424–434. [Google Scholar] [CrossRef]
  4. Ball, M.D.; Arthur, J.F. Planktonic chlorophyll dynamics in the Northern San Francisco Bay and Delta. In San Francisco Bay: The Urbanized Estuary; Conomos, T.J., Ed.; Pacific Division of the American Association for the Advancement of Science: San Francisco, CA, USA, 1979; pp. 265–286. [Google Scholar]
  5. Jassby, A. Phytoplankton in the upper San Francisco Estuary: Recent biomass trends, their causes and their trophic significance. San Fr. Estuary Watershed Sci. 2008, 6, 1–26. Available online: https://escholarship.ord/uc/item/71h077r1 (accessed on 1 April 2022).
  6. Kimmerer, W.J. Open water processes of the San Francisco Estuary: From physical forcing to biological responses. San Fr. Estuary Watershed Sci. 2004, 2, 1. Available online: https://escholarship.org/uc/item/9bp499mv (accessed on 1 April 2022). [CrossRef] [Green Version]
  7. Dugdale, R.; Wilkerson, F.; Parker, A.E.; Marchi, A.; Taberski, K. River flow and ammonium discharge determine spring phytoplankton blooms in an urbanized estuary. Estuar. Coast. Shelf Sci. 2012, 115, 187–199. [Google Scholar] [CrossRef]
  8. Dugdale, R.C.; Wilkerson, F.P.; Parker, A.E. A biogeochemical model of phytoplankton productivity in an urban estuary: The importance of ammonium and freshwater flow. Ecol. Modell. 2013, 263, 291–307. [Google Scholar] [CrossRef] [Green Version]
  9. Glibert, P.M.; Dugdale, R.C.; Wilkerson, F.; Parjer, A.E.; Alexander, J.; Antell, E.; Blaser, S.; Johnson, A.; Lee, J.; Lee, T.; et al. Major—But rare—Spring blooms in San Francisco Bay Delta, California, a result of the long-term drought, increased residence times, and altered nutrient loads and forms. J. Exp. Mar. Biol. Ecol. 2014, 460, 8–18. [Google Scholar] [CrossRef] [Green Version]
  10. Jungbluth, M.; Lee, C.; Patel, C.; Ignoffo, T.; Bergamaschi, B.; Kimmerer, W. Production of the copepod Pseudodiaptomus forbesi is not enhanced by ingestion of the diatom Aulacoseira granulata during a bloom. Est. Coasts 2021, 44, 1083–1099. [Google Scholar] [CrossRef]
  11. Sommer, T.R.; Armor, C.; Baxter, R.; Breuer, R.; Brown, L.; Chotkowski, M.; Culberson, S.; Feyrer, F.; Gingas, M.; Herbold, B.; et al. The collapse of pelagic fishes in the upper San Francisco Estuary. Fisheries 2007, 32, 270–277. [Google Scholar] [CrossRef]
  12. Baxter, R.; Breuer, R.; Brown, L.; Conrad, L.; Feyrer, F.; Fong, S.; Gehrts, K.; Grimaldo, L.; Herbold, B.; Hrodey, P.; et al. Interagency Ecological Program 2010 Pelagic Organism Decline Work Plan and Synthesis of Results. Interagency Ecological Program for the San Francisco Estuary. Available online: www.waterboardds.ca.gov (accessed on 3 August 2022).
  13. Lehman, P.W.; Boyer, G.; Hall, C.; Walker, S.; Gehrts, K. Distribution and toxicity of a new colonial Microcystis aeruginosa bloom in the San Francisco Bay Estuary, California. Hydrobiologia 2005, 541, 87–99. [Google Scholar] [CrossRef]
  14. Lehman, P.W.; Boyer, G.; Stachwell, M.; Walker, S. The influence of environmental conditions on seasonal variation of Microcystis abundance and microcystins concentration in San Francisco Estuary. Hydrobiologia 2008, 600, 187–204. [Google Scholar] [CrossRef]
  15. Lehman, P.W.; Kurobe, T.; Lesmeister, S.; Baxa, D.; Tung, A.; Teh, S.J. The impacts of the 2014 severe drought on the Microcystis bloom in the San Francisco Estuary. Harmful Algae 2017, 63, 94–108. [Google Scholar] [CrossRef]
  16. Van Nieuwenhuyse, E. Response of summer chlorophyll concentration to reduced total phosphorus concentration in the Rhine River (Netherlands) and the Sacramento-San Joaquin Delta (California, USA). Can. J. Fish. Aq. Sci. 2007, 64, 1529–1542. [Google Scholar] [CrossRef]
  17. Glibert, P.M.; Fullerton, D.; Burkholder, J.M.; Cornwell, J.; Kana, T.M. Ecological stoichiometry, biogeochemical cycling, invasive species, and aquatic food webs: San Francisco Estuary and comparative systems. Rev. Fish. Sci. 2011, 19, 358–417. [Google Scholar] [CrossRef]
  18. Parker, A.E.; Hogue, V.E.; Wilkerson, F.P.; Dugdale, R.C. Inorganic nitrogen speciation and phytoplankton growth in the high nutrient, low chlorophyll San Francisco Estuary. Est. Coast. Shelf Sci. 2012, 104–105, 91–101. [Google Scholar] [CrossRef]
  19. Mosier, A.C.; Francis, C.A. Relative abundance and diversity of ammonia-oxidizing archaea and bacteria in the San Francisco Bay estuary. Environ. Microb. 2008, 10, 3002–3016. [Google Scholar] [CrossRef] [PubMed]
  20. Damashek, J.; Casciotti, K.L.; Francis, C.A. Variable nitrification rates across environmental gradients in turbid, nutrient-rich estuary waters of San Francisco Bay. Est. Coasts 2016, 39, 1050–1071. [Google Scholar] [CrossRef]
  21. Sobota, D.J.; Harrison, J.A.; Dahlgren, R.A. Influences of climate, hydrology, and land use on input and export of nitrogen in California watersheds. Biogeochemistry 2009, 94, 43–62. [Google Scholar] [CrossRef]
  22. Sobota, D.J.; Harrison, J.A.; Dahlgren, R.A. Linking dissolved and particulate phosphorus export in rivers draining California’s Central Valley with anthropogenic sources at the regional scale. J. Environ. Qual. 2011, 40, 1290–1302. [Google Scholar] [CrossRef] [PubMed]
  23. Novick, E.; Senn, D. External Nutrient Loads to San Francisco Bay; Contribution No. 704 San Francisco Estuary Institute: Richmond, CA, USA, 2014. [Google Scholar]
  24. Glibert, P.M.; Wilkerson, F.P.; Dugdale, R.C.; Parker, A.E.; Alexander, J.; Blaser, S.; Murasko, S. Microbial communities from San Francisco Bay Delta respond differently to oxidized and reduced nitrogen substrates—Even under conditions that would otherwise suggest nitrogen sufficiency. Front. Mar. Sci. 2014, 1, 17. [Google Scholar] [CrossRef] [Green Version]
  25. Wilkerson, F.P.; Dugdale, R.C.; Parker, A.E.; Blaser, S.B.; Pimenta, A. Nutrient uptake and primary productivity in an urban estuary: Using rate measurements to evaluate phytoplankton response to different hydrological and nutrient conditions. Aquat. Ecol. 2015, 49, 211–233. [Google Scholar] [CrossRef]
  26. Berg, G.M.; Driscoll, S.; Hayashi, K.; Ross, M.; Kudela, R. Variation in growth rate, carbon assimilation, and photosynthetic efficiency in response to nitrogen source and concentration in phytoplankton isolated from upper San Francisco Bay. J. Phycol. 2017, 53, 664–679. [Google Scholar] [CrossRef] [Green Version]
  27. Strong, A.L.; Mills, M.M.; Huang, I.B.; van Dijken, G.L.; Driscoll, S.E.; Berg, G.M.; Kudela, R.M.; Monismith, S.G.; Francis, C.A.; Arrigo, K.R. Response of lower Sacramento River phytoplankton to high-ammonium wastewater effluent. Elementa 2021, 9, 040. [Google Scholar] [CrossRef]
  28. Cloern, J.E. Use care when interpreting correlations: The ammonium example in the San Francisco Estuary. San Fran. Est. Watershed Sci. 2021, 19, 1. [Google Scholar] [CrossRef]
  29. Glibert, P.M.; Wilkerson, F.P.; Dugdale, R.C.; Raven, J.A.; Dupont, C.L.; Leavitt, P.R.; Parker, A.E.; Burkholder, J.M.; Kana, T.M. Pluses and minuses of ammonium and nitrate uptake and assimilation by phytoplankton and implications for productivity and community composition, with emphasis on nitrogen-enriched conditions. Limnol. Oceanogr. 2016, 61, 165–197. [Google Scholar] [CrossRef]
  30. MacIsaac, J.J.; Dugdale, R.C.; Huntsman, S.; Conway, H.L. The effect of sewage on uptake of inorganic nitrogen and carbon by natural populations of marine phytoplankton. J. Mar. Sci. 1979, 37, 51–66. [Google Scholar]
  31. Waiser, M.J.; Tumber, V.; Holm, J. Effluent-dominated streams. Part 1: Presence and effects of excess nitrogen and phosphorus in Wascana Creek, Saskatchewan, Canada. Environ. Tox. Chem. 2011, 30, 496–507. [Google Scholar] [CrossRef]
  32. Xu, J.; Glibert, P.M.; Lui, H.; Yin, K.; Yuan, X.; Chen, M.; Harrison, P.J. Nitrogen sources and rates of phytoplankton uptake in different regions of Hong Kong waters in summer. Estuaries Coasts 2012, 35, 559–571. [Google Scholar] [CrossRef]
  33. Swarbrick, V.J.; Simpson, G.L.; Glibert, P.M.; Leavitt, P.R. Differential stimulation and suppression of phytoplankton growth by ammonium enrichment in eutrophic hardwater lakes over 16 years. Limnol. Oceanogr. 2019, 64, S130–S149. [Google Scholar] [CrossRef] [Green Version]
  34. Britto, D.T.; Kronzucker, H.J. NH4+ toxicity in higher plants: A critical review. J. Plant Physiol. 2002, 159, 567–584. [Google Scholar] [CrossRef] [Green Version]
  35. Britto, D.T.; Kronzucker, H.J. Ecological significance and complexity of N-source preference in plants. Ann. Bot. 2013, 112, 957–963. [Google Scholar] [CrossRef] [PubMed] [Green Version]
  36. California Regional Water Quality Control Board Central Valley Region. Waste discharge requirements for the Sacramento Regional County Sanitation District, Permit. R5-2021-0019. Available online: http:///www.waterboards.ca.gov/centralvalley (accessed on 2 August 2022).
  37. Alpine, A.E.; Cloern, J.E. Trophic interactions and direct physical effects control phytoplankton biomass and production in an estuary. Limnol. Oceanog. 1992, 37, 946–955. [Google Scholar] [CrossRef]
  38. Cloern, J.E.; Dufford, R. Phytoplankton community ecology: Principles applied in San Francisco Bay. Mar. Ecol. Prog. Ser. 2005, 285, 1–28. [Google Scholar] [CrossRef]
  39. Cole, B.E.; Cloern, J.E. Significance of biomass and light availability to phytoplankton productivity in San Francisco Bay. Mar. Ecol. Prog. Ser. 1984, 17, 15–24. [Google Scholar] [CrossRef]
  40. Bever, A.J.; MacWilliams, M.L. Simulating sediment transport processes in San Pablo Bay using coupled hydrodynamic, wave, and sediment transport models. Mar. Geol. 2013, 345, 235–253. [Google Scholar] [CrossRef]
  41. Schoellhamer, D.H.; Wright, S.A.; Drexler, J. A conceptual model of sedimentation in the Sacramento–San Joaquin Delta. San Franc. Estuary Watershed Sci. 2012, 10. Available online: https://escholarship.org/uc/item/2652z8sq (accessed on 12 May 2022). [CrossRef] [Green Version]
  42. Kimmerer, W.J.; Thompson, J.K. Phytoplankton growth balanced by clam and zooplankton grazing and net transport into the low-salinity zone of the San Francisco Estuary. Est. Coasts 2014, 37, 1202–1218. [Google Scholar] [CrossRef] [Green Version]
  43. Lucas, L.V.; Cloern, J.E.; Thompson, J.K.; Stacey, M.T.; Koseff, J.R. Bivalve grazing can shape phytoplankton communities. Front. Mar. Sci. 2016, 3, 14. [Google Scholar] [CrossRef] [Green Version]
  44. Huber, M. Potamocorbula amurensis (Schrenck, 1981). In World Marine Mollusca Database; Bouchet, P., Gofas, S., Rosenberg, G., Eds.; 2010; Available online: http:www.marinespecies.org/aphia.php?p=taxdetails&id=397175 (accessed on 13 May 2022).
  45. Lucas, L.V.; Thompson, J.K.; Brown, L.R. Why are diverse relationships observed between phytoplankton biomass and transport time? Limnol. Oceanogr. 2009, 54, 381–390. [Google Scholar] [CrossRef]
  46. Wang, Z.; Chai, F.; Dugdale, R.; Liu, Q.; Xue, H.; Wilkerson, F.; Chao, Y.; Zhang, Y.; Zhang, H. The interannual variabilities of chlorophyll and nutrients in San Francisco Bay: A modeling study. Ocean Dyn. 2020, 70, 1169–1186. [Google Scholar] [CrossRef]
  47. Klausmeier, C.A.; Litchman, E.; Daufresne, T.; Levin, S.A. Phytoplankton stoichiometry. Ecol. Res. 2008, 23, 479–485. [Google Scholar] [CrossRef]
  48. Hillebrand, H.; Steinert, G.; Boersma, M.; Malzahn, A.; Meunier, C.L.; Plum, C.; Ptacnik, R. Goldman revisited: Faster-growing phytoplankton has lower N:P and lower stoichiometric flexibility. Limnol. Oceanogr. 2013, 58, 2076–2088. [Google Scholar] [CrossRef]
  49. Atwater, B.F.; Conard, S.G.; Dowden, J.N.; Hedel, C.W.; MacDonald, R.L.; Savage, W. History, landforms, and vegetation of the estuary’s tidal marshes. In San Francisco Bay: The Urbanized Estuary; Conomos, T.J., Ed.; Pacific Division of the American Association for the Advancement of Science: San Francisco, CA, USA, 1979; pp. 347–385. [Google Scholar]
  50. Mueller-Solger, A.B.; Jassby, A.D.; Müller-Navarra, D. Nutritional value of particulate organic matter for zooplankton (Daphnia) in a tidal freshwater system (Sacramento-San Joaquin River Delta, USA). Limnol. Oceanogr. 2002, 47, 1468–1476. [Google Scholar] [CrossRef] [Green Version]
  51. Wilkerson, F.P.; Dugdale, R.C.; Hogue, V.E.; Marchi, A. Phytoplankton blooms and nitrogen productivity in San Francisco Bay. Est. Coasts 2006, 29, 401–416. [Google Scholar] [CrossRef]
  52. Solórzano, L. Determination of ammonia in natural waters by the phenolhypochlorite method. Limnol. Oceanogr. 1969, 14, 799–801. [Google Scholar] [CrossRef]
  53. Bran Luebbe, Inc. Bran Luebbe AutoAnalyzer Applications: AutoAnalyzer Method No. G-172-96 Nitrate and Nitrite in Water and Seawater; Bran Luebbe, Inc.: Buffalo Grove, IL, USA, 1999. [Google Scholar]
  54. Bran Luebbe, Inc. Bran Luebbe AutoAnalyzer Applications: AutoAnalyzer Method No. G-175-96 Phosphate in Water and Seawater; Bran Luebbe, Inc.: Buffalo Grove, IL, USA, 1999. [Google Scholar]
  55. Bran Luebbe, Inc. Bran Luebbe AutoAnalyzer Applications: AutoAnalyzer Method No. G-177-96 Silicate in Water and Seawater; Bran Luebbe, Inc.: Buffalo Grove, IL, USA, 1999. [Google Scholar]
  56. Arar, E.J.; Collins, G.B. In Vivo Determination of Chlorophyll a and Phaeophytin a in Marine and Freshwater Phytoplankton by Fluorescence, Method 445.0. U.S. In In Vivo Determination of Chlorophyll a and Phaeophytin a in Marine and Freshwater Phytoplankton by Fluorescence, Method 445.0. U.S; Environmental Protection Agency: Washington, DC, USA, 1997. Available online: https://cfpub.epa.gov/si/si_public_record_report.cfm?Lab=NERL&dirEntryId=309417 (accessed on 22 September 2021).
  57. Van Heukelem, L.; Thomas, C.S. Computer-assisted high-performance liquid chromatography method development with applications to the isolation and analysis of phytoplankton pigments. J. Chromatogr. 2001, 910, 31–49. [Google Scholar] [CrossRef]
  58. Jeffrey, S.W.; Wright, S.W. Photosynthetic pigments in the haptophyta. In The Haptophyte Algae; Green, J.C., Leadbeater, B.S.C., Eds.; Clarendon Press: Oxford, UK, 1994; pp. 111–132. [Google Scholar]
  59. Jeffrey, S.W.; Vesk, M. Introduction to marine phytoplankton and their pigment signatures. In Phytoplankton Pigments in Oceanography: Guidelines to Modern Methods; Jeffrey, S.W., Mantoura, R.F.C., Wright, S.W., Eds.; NESCO: Paris, France, 1997; pp. 37–84. [Google Scholar]
  60. Platt, T.; Gallegos, C.; Harrison, W.G. Photoinhibition of photosynthesis in natural assemblages of marine phytoplankton. J. Mar. Res. 1980, 38, 687–701. [Google Scholar]
  61. Kimmerer, W. Long-term changes in apparent uptake of silica in the San Francisco estuary. Limnol. Oceanogr. 2005, 50, 793–798. [Google Scholar] [CrossRef] [Green Version]
  62. Jassby, A.D.; Cloern, J.E.; Cole, B.E. Annual primary production: Patterns and mechanisms of change in a nutrient-rich tidal ecosystem. Limnol. Oceanogr. 2002, 47, 698–712. [Google Scholar] [CrossRef] [Green Version]
  63. Carlton, J.T.; Thompson, J.K.; Schemel, L.E.; Nichols, F.H. Remarkable invasion of San Francisco Bay (California, USA) by the Asian clam, Potamocorbula amurensis. 1. Invasion and dispersal. Mar. Ecol. Prog. Ser. 1990, 66, 81–94. [Google Scholar] [CrossRef]
  64. Cohen, A.N.; Carlton, J.T. Nonindigenous Aquatic Species in a United States Estuary: A case study of the Biological Invasions of the San Francisco Bay and Delta; U.S. Fish & Wildlife Service: Washington, DC, USA, 1995. [Google Scholar]
  65. Cohen, A.N.; Carlton, J.T. Accelerating invasion rate in a highly invaded estuary. Science 1998, 279, 555–558. [Google Scholar] [CrossRef] [Green Version]
  66. Brown, L.R.; Baxter, R.; Castillo, G.; Conrad, L.; Culberson, S.; Erickson, G.; Feyrer, F.; Fong, S.; Gehrts, K.; Grimaldo, L.; et al. Synthesis of Studies in the Fall Low-Salinity Zone of the San Francisco Estuary, September–December 2011: U.S. Geological Survey Scientific Investigations Report 2014–5041; U.S. Geological Survey: Reston, VA, USA, 2014. [Google Scholar]
  67. Ruben, A.V.; Lavaud, J.; Rousseau, B.; Guglielmi, G.; Horton, P.; Etienne, A.L. The super-excess energy dissipation in diatom algae: Comparative analysis with higher plants. Photosyn. Res. 2004, 82, 165–175. [Google Scholar] [CrossRef] [PubMed] [Green Version]
  68. Raven, J.A.; Wollenweber, B.; Handley, L.L. A comparison of ammonium and nitrate as nitrogen sources for photolithotrophs. New Phytol. 1992, 121, 19–32. [Google Scholar] [CrossRef]
  69. Flynn, K.J.; Fasham, M.J.R.; Hipkin, C.R. Modelling the interactions between ammonium and nitrate uptake in marine phytoplankton. Phil. Trans. R Soc. Ser. B 1997, 352, 1625–1645. [Google Scholar] [CrossRef]
  70. Vergera, J.; Berges, J.; Falkowski, P. Diel periodicity of nitrate reductase activity and protein levels in the marine diatom Thalassiosira weissflogii (Bacillariophyceae). J. Phycol. 1998, 34, 952–961. [Google Scholar] [CrossRef]
  71. Flynn, K.J.; Dickson, D.M.J.; Al-Amoundi, O.A. The ratio of glutamine:glutamate in microalgae: A biomarker for N-status suitable for use at natural densities. J. Plankt. Res. 1989, 11, 165–170. [Google Scholar] [CrossRef]
  72. Flynn, K.J.; Jones, K.J.; Raine, R.; Richard, J.; Flynn, K. Use of intracellular amino acids as an indicator of the physiological status of natural dinoflagellate populations. Mar. Ecol. Prog. Ser. 1994, 103, 175–186. [Google Scholar] [CrossRef]
  73. Lomas, M.W.; Glibert, P.M. Temperature regulation of nitrate uptake: A novel hypothesis about nitrate uptake and reduction in cool-water diatoms. Limnol. Oceanogr. 1999, 44, 556–572. [Google Scholar] [CrossRef]
  74. Lomas, M.W.; Glibert, P.M. Interactions between NH4+ and NO3 uptake and assimilation: Comparison of diatoms and dinoflagellates at several growth temperatures. Mar. Biol. 1999, 133, 541–551. [Google Scholar] [CrossRef]
  75. Parker, M.S.; Armbrust, E.V. Synergistic effects of light, temperature and nitrogen source on transcription of genes for carbon and nitrogen metabolism in the centric diatom Thalassiosira pseudonana (Bacillariophyceae). J. Phycol. 2005, 41, 1142–1153. [Google Scholar] [CrossRef]
  76. Kamp, A.; de Beer, D.; Nitsch, J.L.; Lavik, G.; Stief, P. Diatoms respire nitrate to survive dark and anoxic conditions. Proc. Natl. Acad. Sci. USA 2011, 108, 5649–5654. [Google Scholar] [CrossRef] [PubMed] [Green Version]
  77. Collos, Y.; Harrison, P.J. Acclimation and toxicity of high ammonium concentrations to unicellular algae. Mar. Poll. Bull. 2014, 80, 8–23. [Google Scholar] [CrossRef] [PubMed]
  78. Finlay, K.; Patoine, A.; Donald, D.B.; Bogard, M.; Leavitt, P.R. Experimental evidence that pollution with urea can degrade water quality in phosphorus-rich lakes of the Northern Great Plains. Limnol. Oceanogr. 2010, 55, 1213–1230. [Google Scholar] [CrossRef] [Green Version]
  79. Donald, D.B.; Bogard, M.J.; Finlay, K.; Bunting, L.; Leavitt, P.R. Phytoplankton-specific response to enrichment of phosphorus-rich surface waters with ammonium, nitrate, and urea. PLoS ONE 2013, 8, e53277. [Google Scholar] [CrossRef] [Green Version]
  80. Jensen, J.P.; Jeppesen, E.; Olrik, K.; Kristensen, P. Impact of nutrients and physical factors on the shift from cyanobacteria to chlorophyte dominance in shallow Danish lakes. Can. J. Fish. Aquat. Sci. 1994, 51, 1692–1699. [Google Scholar] [CrossRef]
  81. Glibert, P.M.; Berg, G.M.B. Nitrogen form, fate and phytoplankton composition. In Experimental Ecosystems and Scale: Tools for Understanding and Managing Coastal Ecosystems; Kennedy, V.S., Kemp, W.M., Peterson, J.E., Dennison, W.C., Eds.; Springer: New York, NY, USA, 2009; pp. 183–189. [Google Scholar]
  82. Domingues, R.B.; Barbosa, A.B.; Sommer, U.; Galvão, H.M. Ammonium, nitrate and phytoplankton interactions in a freshwater tidal estuarine zone: Potential effects of cultural eutrophication. Aquat. Sci. 2011, 73, 331–343. [Google Scholar] [CrossRef]
  83. Shangguan, Y.; Glibert, P.M.; Alexander, J.A.; Madden, C.J.; Murasko, S. Nutrients and phytoplankton in semi-enclosed lagoon systems in Florida Bay and their responses to changes in flow from Everglades restoration. Limnol Oceanogr. 2017, 62, S327–S347. [Google Scholar] [CrossRef] [Green Version]
  84. Shangguan, Y.; Glibert, P.M.; Alexander, J.A.; Madden, C.J.; Murasko, S. Phytoplankton community response to changing nutrients in Florida Bay: Results of mesocosm studies. J. Exp. Mar. Biol. Ecol. 2017, 494, 38–53. [Google Scholar] [CrossRef]
  85. Fawcett, S.E.; Ward, B.B. Phytoplankton succession and nitrogen utilization during the development of an upwelling bloom. Mar. Ecol. Progr. Ser. 2011, 428, 13–31. [Google Scholar] [CrossRef] [Green Version]
  86. Donald, D.B.; Bogard, M.J.; Finlay, K.; Leavitt, P.R. Comparative effects of urea, ammonium, and nitrate on phytoplankton abundance, community composition, and toxicity in hypereutrophic freshwaters. Limnol. Oceanogr. 2011, 56, 2161–2175. [Google Scholar] [CrossRef]
  87. Dai, G.-Z.; Shang, J.-L.; Qiu, B.-S. Ammonia may play an important role in the succession of cyanobacterial blooms and the distribution of common algal species in shallow freshwater lakes. Glob. Change Biol. 2012, 18, 1571–1581. [Google Scholar] [CrossRef]
  88. Vogt, R.J.; Rusak, J.A.; Patoine, A.; Leavitt, P.R. Differential effects of energy and mass influx on the landscape synchrony of lake ecosystems. Ecology 2011, 92, 1104–1114. [Google Scholar] [CrossRef] [PubMed]
  89. Leavitt, P.R.; Brock, C.S.; Ebel, C.; Patoine, A. Landscape-scale effects of urban nitrogen on a chain of freshwater lakes in central North America. Limnol. Oceanogr. 2006, 51, 2262–2277. [Google Scholar] [CrossRef]
  90. Patoine, A.; Graham, M.D.; Leavitt, P.R. Spatial variation of nitrogen fixation in lakes of the northern Great Plains. Limnol. Oceanogr. 2006, 51, 1665–1677. [Google Scholar] [CrossRef]
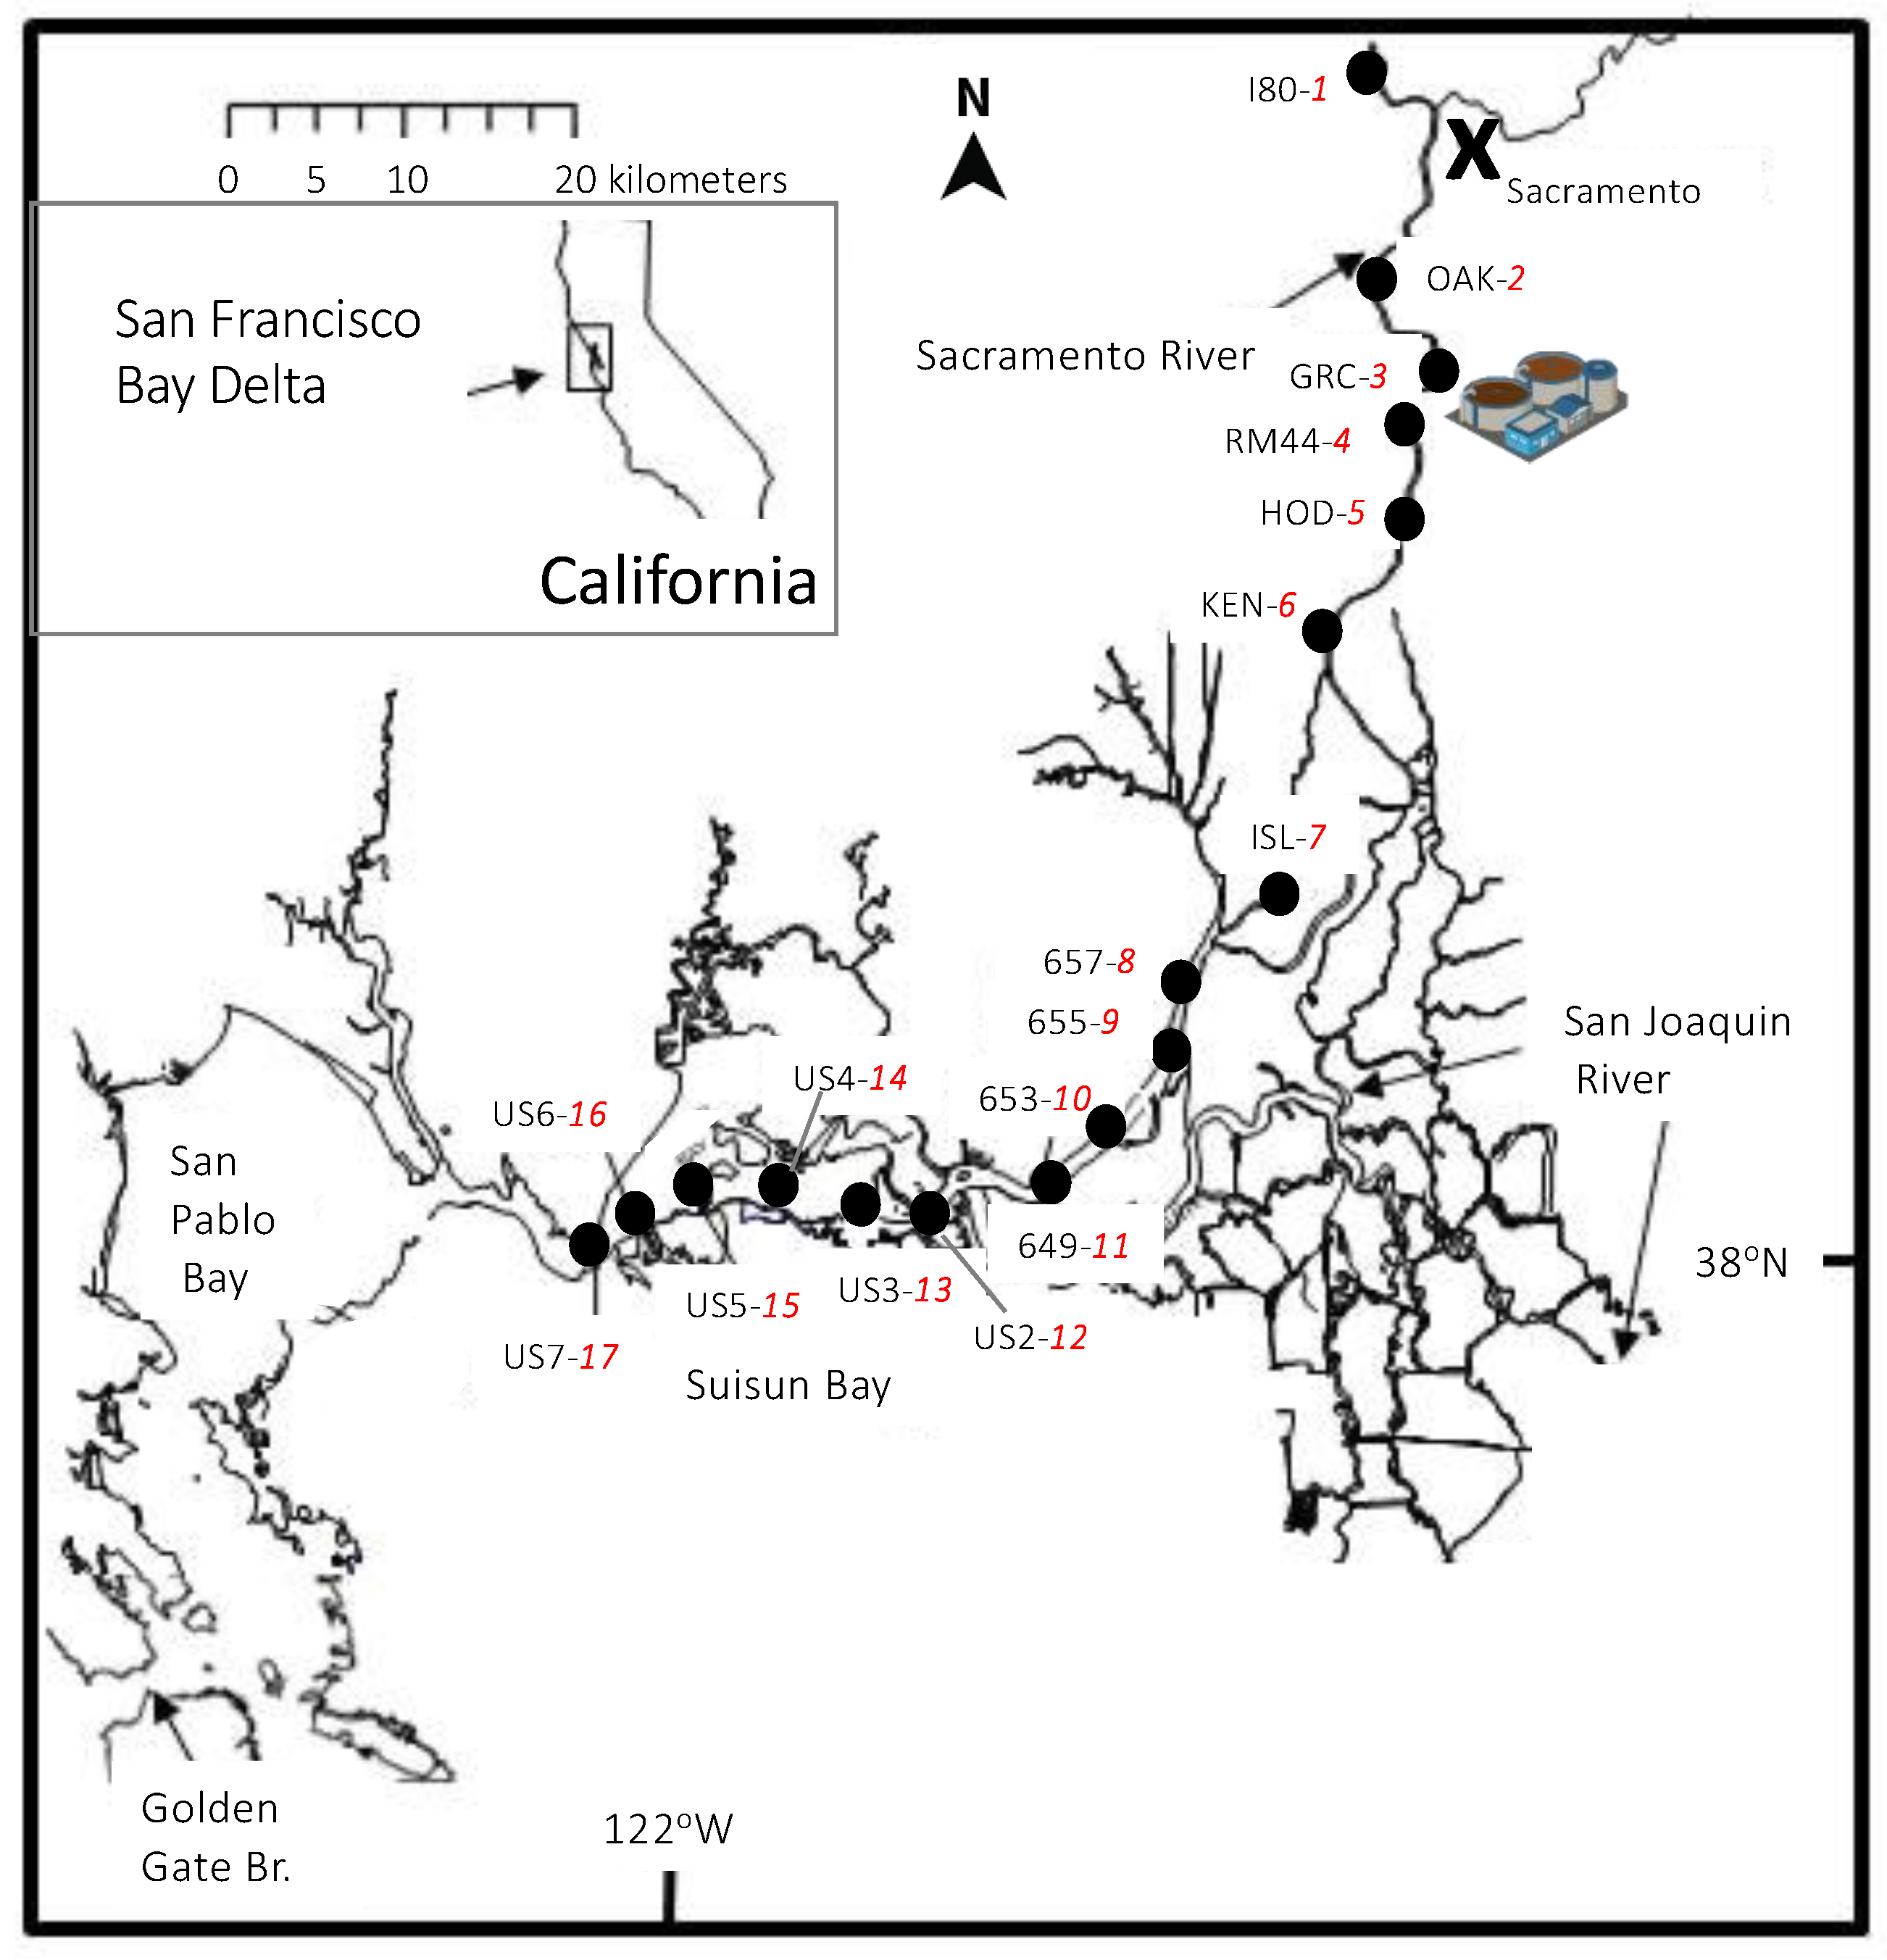
Figure 1. Map of the San Francisco Bay Delta showing the sites sampled over the study years. Each station is identified by a number (in red) and by a regional name. The WWTP that underwent an upgrade and reduction in nitrogen effluent in 2021 is shown with the WWTP icon near Station 3 (GRC). The WWTP icon is from the University of Maryland Integration and Application Network image library.
Nitrogen 03 00037 g001
Figure 2. Average discharge at USGS site 11,455,420 at Rio Vista (657, station 8) for the 30-days prior to the date of sampling for each year indicated. Note the clear trend for drier conditions over time.
Nitrogen 03 00037 g002
Figure 3. Transects of temperature (panel a), salinity (panel c) and Secchi depth (panel e) for the six years of sampling undertaken in the Bay Delta during September/October. Sampling in 2021 was 5 months after full implementation of the upgraded WWTP. Vertical dashed lines separate the major segments of the river/estuary. The WWTP icon shows location of discharge. Relationships between temperature and flow at Station 5, salinity with flow at Station 11 and Secchi depth with flow at Station 5 are shown in (panels b,d,f), respectively. Note the stations for which relationships with discharge are shown are highlighted by black arrows in (panels a,c,e), and 2021 data in (panels b,d,f) are highlighted by triangles.
Nitrogen 03 00037 g003
Figure 4. Transects of NH4+ (panel a), and NO3 (panel c) for the six years of sampling undertaken in the Bay Delta during September/October. Sampling in 2021 was 5 months after full implementation of the upgraded WWTP. Vertical dashed lines separate the major segments of the river/estuary. The WWTP icon shows location of discharge. Correlations of average monthly discharge and NH4+ concentrations at station 5 (HOD), and NO3 concentrations at station 11 (649), are shown in (panels b,d), respectively. Note the stations for which relationships with discharge are shown are highlighted by black arrows in (panels a,c). The 2021 data (highlighted as triangles) are not included in the regressions.
Nitrogen 03 00037 g004
Figure 5. Transects of PO43− (panel a) and Si(OH)4 (panel c) for the six years of sampling undertaken in the Bay Delta during September/October. Sampling in 2021 was 5 months after full implementation of the upgraded WWTP. Vertical dashed lines separate the major segments of the river/estuary. The WWTP icon shows location of discharge. Correlations of average monthly discharge and PO43− concentrations at station 5 (HOD), and Si(OH)4 concentrations at station 11 (649) are shown in (panels b,d), respectively. Note the stations for which relationships with discharge are shown are highlighted by black arrows in (panels a,c). The 2021 data (highlighted as triangles) were not included in the PO43− regression.
Nitrogen 03 00037 g005
Figure 6. Transects of chlorophyll a (panel a) for the six years of sampling undertaken in the Bay Delta during September/October. Sampling in 2021 was 5 months after full implementation of the upgraded WWTP. Vertical dashed lines separate the major segments of the river/estuary. The WWTP icon shows location of discharge. Note the sustained increase in chl a after station 7 in 2021, a trend not seen in the other years. The correlations of average monthly discharge and chlorophyll a concentrations at station 5 (HOD), at station 11 (649), and at Station 14 (US4) are shown in (panels bd), respectively. Note the stations for which relationships with discharge are shown are highlighted by black arrows in (panel a).
Nitrogen 03 00037 g006
Figure 7. Chlorophyll a concentrations for all stations all years as a function of ambient NH4+ (panel a; expanded scale for 2021, panel b), as a function of the ambient dissolved inorganic nitrogen:phosphorus ratio (panel c, with the line for 2021 data only), and as a function of secchi depth (panel d). Note the inverse relationships between NH4+ concentration (panel a) and light availability (panel d) and chlorophyll a. Table 1 summarizes the statistics for (panel d).
Nitrogen 03 00037 g007
Figure 8. Transects of fucoxanthin/chlorophyll a (indicative of diatoms, panel a), chlorophyll b/chlorophyll a (indication of green algae, panel b) and zeaxanthin/chlorophyll a (indicative of cyanobacteria, panel c) for the years of sampling undertaken in the Bay Delta during September/October prior to WWTP upgrade. Vertical dashed lines separate the major segments of the river/estuary. The WWTP icon shows location of discharge.
Nitrogen 03 00037 g008
Figure 9. Transects of Fv/Fm for the years of sampling undertaken in the Bay Delta during September/October prior to WWTP upgrade (panel a) and for the brown and green algal groups for 2021 post WWTP upgrade (panel b). Vertical dashed lines separate the major segments of the river/estuary. The WWTP icon shows location of discharge. Note the consistent downward trend for all years pre-upgrade and the upward trend for brown algae for 2021 post-upgrade.
Nitrogen 03 00037 g009
Figure 10. Rapid Light Curves for stations Station 5 (HOD; panel a) and Station 17 (US7; panel b) and the effects of pre-treatment (6 h) with 30 mM NH4+ (panels c,d). Curves were generated using Walz WinControl software according to Platt et al. [60]. The algal groups are differentiated as brown (B, diatoms), green (G, chlorophytes) and as phycoerythrin-containing cells (PE). Parameters are summarized in Table 3.
Nitrogen 03 00037 g010
Figure 11. Comparison of the two low-flow years, 2015 (panels a,b) and 2021 (panels c,d), pre- and post-WWTP upgrade. In 2015, there was very high NH4+ in the effluent (blue end of arrow in panel a) and nitrification (transition to red in arrow in panel a) occurred by station 8. A peak in chlorophyll a developed and was dominated by chlorophytes which were readily able to access the NH4+ (panel b) but which could not sustain growth. In 2021, the effluent was in the form of NO3, which remained available through the transect (red arrow in panel c) and was accessible to diatoms (panel d) which were then able to sustain growth through the remainder of the transect. See text for details.
Nitrogen 03 00037 g011
Table 1. Correlations between chlorophyll a and Secchi depth. Relationships for 2012, 2014 and 2021 were significant at p < 0.05 (as indicated by bold font).
YearCorrelationR2
2011Y = −0.18x + 2.440.11
2012Y = −0.54x + 2.490.36
2013Y = −0.28x + 2.660.08
2014Y = −0.88x + 3.450.71
2015Y = −0.23x + 2.800.05
2021Y = −0.90x + 4.990.77
Table 2. Correlations between Si(OH)4 and station position, from Stations 11–17. See Figure 5c.
YearCorrelationR2
2011Y = −8.82x + 3640.98
2012Y = −16.95x + 4530.84
2013Y = −9.99x + 4260.39
2014Y = −10.76x +3080.84
2015Y = −10.27x +3010.79
2021Y = −16.26x + 3670.93
Table 3. Parameters from Rapid Light Curves measured at stations and under conditions indicated. Ambient samples were dark adapted for 20 min. NH4+ enriched samples were measured approximately 6 h after enrichment and a 20 min dark acclimation. Algal groups were differentiated by the PhytoPAM II. Ambient concentrations of NH4+ are listed for reference.
StationTreatmentα
Brown Algae
ETRmax
Brown Algae
(μM e m−2 s−1)
α
Green Algae
ETRmax
Green Algae
(μM e m−2 s−1)
Ambient NH4+
(μM)
1 (I80)ambient0.16026.41.76118.30.59
3 (GRC)ambient0.15817.50.14113.41.06
4 (RM44)ambient0.22225.00.12418.41.14
+15 μM NH4+0.19823.90.17519.7
+30 μM NH4+0.19722.10.27018.1
+60 μM NH4+0.18521.50.15517.4
5 (HOD)ambient0.12923.00.0849.71.15
+30 μM NH4+0.11119.40.1608.0
6 (KEN)ambient0.19221.40.10713.51.27
7 (ISL)ambient0.11515.50.13811.51.16
8 (657)ambient0.19929.70.17720.00.91
+30 μM NH4+0.18430.40.16318.4
9 (655)ambient0.18327.80.13617.21.48
10 (653)ambient0.17522.60.12314.31.62
11 (649)ambient0.14218.40.10711.23.52
12 (US 2)ambient0.14217.70.10513.31.65
+30 μM NH4+0.08513.50.14810.5
13 (US 3)ambient0.11415.40.14614.41.20
14 (US 4)ambient0.11115.60.16613.61.03
15 (US 5)ambient0.11614.80.17510.81.24
16 (US 6)ambient0.14520.80.09910.92.23
17 (US 7)ambient0.13428.10.11211.14.17
+30 μM NH4+0.14220.90.09012.0
Publisher’s Note: MDPI stays neutral with regard to jurisdictional claims in published maps and institutional affiliations.