Article

Thawing Permafrost as a Nitrogen Fertiliser: Implications for Climate Feedbacks

1
Met Office Hadley Centre, Exeter EX1 3PB, UK
2
College of Engineering, Mathematics, and Physical Sciences, University of Exeter, Exeter EX4 4QE, UK
3
UK Centre for Ecology and Hydrology, Wallingford OX10 8BB, UK
*
Author to whom correspondence should be addressed.
Nitrogen 2022, 3(2), 353-375; https://doi.org/10.3390/nitrogen3020023
Submission received: 22 March 2022 / Revised: 16 May 2022 / Accepted: 26 May 2022 / Published: 3 June 2022
(This article belongs to the Special Issue Nitrogen Cycling in Permafrost Soils)

Abstract

:
Studies for the northern high latitudes suggest that, in the near term, increased vegetation uptake may offset permafrost carbon losses, but over longer time periods, permafrost carbon decomposition causes a net loss of carbon. Here, we assess the impact of a coupled carbon and nitrogen cycle on the simulations of these carbon fluxes. We present results from JULES-IMOGEN—a global land surface model coupled to an intermediate complexity climate model with vertically resolved soil biogeochemistry. We quantify the impact of nitrogen fertilisation from thawing permafrost on the carbon cycle and compare it with the loss of permafrost carbon. Projections show that the additional fertilisation reduces the high latitude vegetation nitrogen limitation and causes an overall increase in vegetation carbon uptake. This is a few Petagrams of carbon (Pg C) by year 2100, increasing to up to 40 Pg C by year 2300 for the RCP8.5 concentration scenario and adds around 50% to the projected overall increase in vegetation carbon in that region. This nitrogen fertilisation results in a negative (stabilising) feedback on the global mean temperature, which could be equivalent in magnitude to the positive (destabilising) temperature feedback from the loss of permafrost carbon. This balance depends on the future scenario and initial permafrost carbon. JULES-IMOGEN describes one representation of the changes in Arctic carbon and nitrogen cycling in response to climate change. However there are uncertainties in the modelling framework, model parameterisation and missing processes which, when assessed, will provide a more complete picture of the balance between stabilising and destabilising feedbacks.

1. Introduction

Permafrost is defined as ground that has been frozen for a period of two years or more. It underlies about 22% of the northern hemisphere land surface [1,2]. There is evidence that permafrost temperatures have been increasing in recent years [3,4] by as much as 0.39 ± 0.15   ° C in the continuous permafrost zone (2007–2016). This is projected to continue to increase in the future, in response to increases in atmospheric greenhouse gas concentrations caused by the human burning of fossil fuels. For example, Ref. [5] project a loss of permafrost area of 4 . 0 1.1 + 1.0 × 10 6 km 2   ° C in conditions where the soil temperatures are in equilibrium with the air temperatures. This unprecedented thawing will have implications for both hydrological and biogeochemical cycles in the permafrost region, as noted by many recent research studies [6,7,8,9,10,11,12,13].
We present new model simulations showing the impact of permafrost thaw on the northern high latitude carbon terrestrial carbon (C) and nitrogen (N) cycle and how this feeds back onto global climate change. This work expands on the estimate of the positive (destabilising) permafrost carbon feedback by [6] who used the JULES land surface model with an interactive representation of the global C cycle coupled with the IMOGEN intermediate climate model. They projected that the additional warming caused by thawing of permafrost C contributed between 0.2 and 12% of the change in the global mean temperature (GSAT) by year 2100 and 0.5 and 17% by 2300. The latest modelling results presented here additionally quantify the impact on future climate change of including an explicit representation of an interactive C and N cycle within JULES [14]. Here, we focus specifically on the increase in vegetation in response to additional nitrogen fertilisation from thawing permafrost—a negative (stabilising) feedback. Additional processes which may also feedback onto the climate are not discussed here but are highlighted in the Conclusions at the end of the paper.
Permafrost systems are typically nitrogen limited [15]. Under future climate change, substantial permafrost thaw is expected (e.g., [5]), and this is expected to increase mineral N available to plants and potentially reduce their nitrogen limitation [16]. This extra N availability could happen through two routes. The first is that newly thawed mineral N, which is currently locked within the permafrost [17,18,19], may become available. The second route is potentially via increased net mobilisation of the organic N in the deeper soils [16,20]. Vegetation is expected to respond to this increase in nitrogen availability and thaw via deeper root profiles, increased growth and changes in species composition [16,21,22]. This response will enhance the vegetation C uptake in the permafrost region and modify the overall permafrost C feedback [6,13]. One modelling study by [23] used the Community Land Model (CLM) with a coupled carbon–nitrogen model that includes permafrost processes to show that under future climate change, increased soil N mineralization in the surface soil reduces plant nutrient limitation. CLM simulations also show that N deeper in the soil only has a small impact on the overall C budget. However, ref. [23] did not include the response of the mineral N pool currently locked within the permafrost to climate change [24].
Earth System Models (ESMs) are designed to project the future evolution of the Earth’s climate in response, amongst others, to changes in atmospheric greenhouse gas concentrations. In addition to modelling the physical climate, ESMs also include climate interactions with biogeochemical cycles. Although an interactive N cycle is now included within many of the ESMs participating in the Sixth Phase of the Coupled Model Intercomparison Project (CMIP6), very few include permafrost C. Hence, ESMs are unable to capture the interactions between permafrost thaw and the nitrogen cycle. This paper adopts an intermediate complexity climate model tuned to represent a range of climate sensitivities and regional climate change features. This climate model is coupled with the JULES land surface model to quantify the impact of an interactive C and N cycle in the permafrost region. Specifically we explore the vegetation C response under a warming climate to increased available mineral N in the soil (minNfert) and its feedback onto global climate (minNfert-feed). We compare this response with the permafrost C loss (pfCloss) and its feedback onto global climate (pfCloss-feed) in the presence of an interactive C and N cycle, to determine the balance of their impact on the global carbon cycle.

2. Materials and Methods

2.1. JULES Land Surface Scheme

The Joint UK Land Environment Simulator (JULES) forms the land-surface component of the UK Earth System Model (UKESM) [25,26,27]. JULES simulates fluxes of energy, water, carbon and more recently nitrogen [14]. It has a dynamic vegetation model, namely, the Top-down Representation of Interactive Foliage and Flora Including Dynamics (TRIFFID) where different plant functional types (PFTs) compete for space based on their height [28]. Recent developments within JULES include the addition of a terrestrial nitrogen cycle which has a representation of all of the key terrestrial N processes and that integrate tightly with the structure of the C cycle [14]. Inputs of N to the land surface are via biological fixation, fertilisation and N deposition, while losses of N from the land surface occur via leaching and gas loss. JULES simulates a N-limited ecosystem by reducing the net primary productivity if there is insufficient available N to accommodate the demand from the vegetation.
Ref. [14] describe in detail the vertically resolved soil biogeochemistry which is the focus of this paper. Below we briefly describe the model and highlight the relevant processes when assessing the permafrost-nitrogen feedbacks. A key requirement is to quantify the amount of inorganic nitrogen in the soil. In addition, the model needs to be able to divide the soil inorganic nitrogen pool into the fraction available for the plants to take up and the fraction not available either because there are no roots present or because the soil is frozen.
The soil biogeochemistry is represented using a vertically resolved version of the standard four-pool RothC soil carbon model [14,29]. In each soil layer there is a soil carbon pool, that in turn disaggregates in to decomposable plant material (DPM), resistant plant material (RPM), microbial biomass (BIO), and humus (HUM), plus an equivalent soil organic nitrogen pool. There is a vertical mixing term representing either bioturbation (i.e., the soil mixing by, for example, animals and plant roots), or, in permafrost regions, cryoturbation (soil mixing is from frost heave and freeze-thaw processes). Each soil layer also has a mineral (or inorganic) N pool. N transfers between the organic and mineral N pools depending on respiration losses and the C-to-N ratio of the organic pool. Changes to the mineral N pool and at a given depth, z ( N i n ( z ) in kg [N]m 2 ) are modelled as follows:
d N i n ( z ) d t = i v i F i f R , i ( z ) i v i Φ i f U , i ( z ) + M n e t ( z ) + N a d d ( z ) N f l u x ( z ) N g a s ( z )
where N i n is the inorganic N in kg [N] m 2 , z is the depth in m and t is the time in seconds. The first right-hand term in Equation (1) is the biological N fixation, where v i is the PFT fraction for PFT i. Quantity F i (kg [N] m 2 s 1 ) is the overall availability of biological N fixation for each PFT. The inputs from biological N fixation for each PFT are distributed vertically according to the normalised fraction of roots in each soil layer ( f R , i ( z ) , dimensionless), that modulates the availability via F i . The second term in Equation (1) is the plant N uptake where Φ i (kg [N] m 2 s 1 ) is the plant N uptake for PFT i, and f U , i ( z ) is the fraction of available inorganic N in each soil layer for each PFT (described in more detail in the next paragraph). This is dependent on both the rooting depth and the freeze/thaw status of the soil. Specifically, if the soil layer is frozen or there are no roots present, there is no plant available nitrogen in that layer. The further terms are M n e t ( z ) (kg [N] m 2 s 1 ) which is the net mineralisation; N a d d ( z ) (kg [N] m 2 s 1 ) represents external inputs via surface deposition and (when applied) fertilisation; N f l u x ( z ) (kg [N] m 2 s 1 ) is the transfer of dissolved inorganic N between layers and N g a s ( z ) (kg [N]m 2 s 1 ) is the total gaseous emission.
In order to calculate the plant uptake we assume that plants cannot access all the inorganic N ( N i n ( z ) )—it can only access the plant available nitrogen ( N a v a i l ( z ) in kg [N] m 2 ) which is dependent on soil depth (z):
N a v a i l , i ( z ) = f r o o t , i ( z ) N i n ( z ) ) T ( z )
If a soil layer is frozen then there is no plant-available nitrogen in the layer and plants cannot uptake any of the N in that layer and T ( z ) is zero, otherwise T ( z ) is one. Secondly, we assume that the plants only have direct access to a certain fraction of the soil, according to their root fraction, f r o o t , i ( z ) (which reduces with depth). Plant uptake is extracted entirely from the available N pool, and the dependence on depth is according to the same profile as the available N, i.e.,
f U , i ( z ) = N a v a i l , i ( z ) z = 0 z m a x N a v a i l , i ( z ) d z
where z m a x is the maximum depth of the soil in m.
JULES calculates the N demand based on the N required for spreading and growth [14]. If the plant N demand is less than the available nitrogen the plant is not N limited and all of the carbon can be used for growth and spreading. However, if the plant N demand is greater than the available nitrogen there is excess carbon that cannot be assimilated by the plants and is considered to be an additional plant respiration term. This is used to reduce the Net Primary Productivity from its non N-limited value to its actual value.
We assess the impact of this vertically resolved soil biogeochemistry on the terrestrial carbon stores and their response to climate change. We also compare the impact on the terrestrial carbon cycle with the permafrost carbon loss from thawing permafrost and its feedback onto global mean temperature (pfCloss and pfCloss-feed). In the paragraph below, we briefly summarise the methodology used to quantify the permafrost carbon loss and feedback and describe it in full in the Appendix A.
In JULES we separate the permafrost carbon, defined as carbon below the maximum summer thaw depth, from the non-permafrost carbon using a numerical tracer which labels the permafrost carbon [6,29]. However, JULES simulates an on-going small exchange between the carbon above and that below the permafrost table caused both by mixing processes and slow simulated decomposition in the permafrost in response to global warming. Hence in the simulations and over very many thousands of modelled years, all the labelled permafrost carbon will eventually turn over and be replaced by non-labelled carbon from above the permafrost table. This is an acknowledged artefact of the modelling framework. In this paper, unlike previous assessments with JULES-IMOGEN [6,30], this is now quantified using a stable climate (Figure A1). The permafrost carbon lost (pfCloss) is the difference between this drift and the loss of permafrost carbon under the future scenarios (Figure A2). The permafrost carbon feedback temperature is calculated by comparing the GSAT for model simulations with and without the permafrost carbon loss included in the land carbon exchange with the atmosphere.

2.2. IMOGEN

The Integrated Model Of Global Effects of climatic aNomalies (IMOGEN) is an intermediate complexity climate model that can be fully coupled with any land surface model. In this case, IMOGEN supplies the meteorological data to drive JULES which simulates changes in the carbon stores of the land surface that feedback onto changes in the IMOGEN-simulated atmospheric CO 2 concentration [31]. We denote this model JULES-IMOGEN. IMOGEN consists of a simple energy balance model (EBM; [32]) that relates changes in concentrations of different atmospheric greenhouse gases to the global mean land temperature response, via changes in their combined radiative forcing. IMOGEN uses a “pattern-scaling” approach [32] to then relate, linearly, the amount of annual global average warming over land (via the EBM) to monthly changes in local meteorology. This local meteorology is disaggregated to hourly timesteps, and then used to drive JULES. At the end of each year, the net annual global land–atmosphere carbon flux calculated by JULES is passed back to modulate calculated atmospheric CO 2 . The land–ocean CO 2 flux is calculated using a single “box” model, and is a function of global temperature increase and atmospheric CO 2 level [31]. Hence IMOGEN characterises both land– and ocean–atmosphere climate-carbon cycle feedbacks. With these feedbacks switched on in the JULES-IMOGEN simulation framework, the global carbon cycle is therefore interactive and the model system is forced with anthropogenic CO 2 emissions. From the combination of emissions and feedbacks, IMOGEN determines evolving atmospheric CO 2 concentrations, which in turn then influence the EBM by altering atmospheric radiative forcing. Both the EBM and the spatial patterns of IMOGEN are calibrated to emulate the climate change patterns for 34 of the ESMs from CMIP5 described by [33,34]. Here, we assess results from three of those ensemble members which were selected to span the range of climate. Hence, this modelling framework spans the full range of uncertainty in both overall climate sensitivity (i.e., thermal sensitivity to rising atmospheric GHGs), and a set of potential regional and seasonal distributions of climate change in response to background global warming.

2.3. Experimental Design

The standard version of JULES-IMOGEN was first “spun-up” using pre-industrial atmospheric CO 2 and repeating climatology of the Water and Global Change forcing data for the period of 1961–1990 [35]. Although this period is not for pre-industrial times, it does contain three decades where there are a substantial number of weather stations available and with a large geographical spread. Hence, this is assumed to be representative of pre-industrial conditions (for details see [6]). The initial simulations are designed to generate a stable time-invariant starting state, to initialise subsequent calculations with a changing climate. In particular, for the analysis here, there is an emphasis on ensuring that both the soil carbon and vegetation distributions are stable at all locations.
The global spun-up states were used to initialise an ensemble of transient simulations assumed to start in 1850 with pre-industrial atmospheric CO 2 , onto which anomalies calculated by IMOGEN (based on the climate change from the CMIP5 ESMs) were added. This ensemble describes the effects of historical climate change, followed by three future scenarios with changing atmospheric greenhouse gases. The historical ensemble was forced with known historical fossil fuel burning and cement production CO 2 emissions. These were then followed using the CO 2 emissions that correspond to three of the Representative Concentration Pathways (RCP) used in the fifth assessment report of the Intergovernmental Panel on Climate Change [6,36]. These scenarios are the RCP2.6 high mitigation scenario, the RCP4.5 intermediate scenario and the RCP8.5 high emissions scenario. Simulations were carried out until year 2300 using the RCP extensions [37] to examine the long-term relationship between permafrost and climate. Neither non-CO 2 greenhouse gases, aerosols nor land use change emissions were included in this set of simulations. However, the impact of these extra emissions will be relatively minor for our analysis. Instead, we focus on the feedbacks caused by including the interactive carbon and nitrogen cycle within JULES, and in particular for regions of thawing permafrost.
The labelled permafrost C was initialised at the start of the simulation as the soil C that was below the top of the simulated permafrost table at that time. The standard carbon and nitrogen (CN) configuration ( C N s p u n : Table 1) uses the amount and distribution of soil carbon that was calculated by JULES-IMOGEN at the end of the spin-up. There are two additional CN configurations ( C N 1.5 s p u n and C N 2 s p u n ) where the labelled permafrost carbon was prescribed to be equivalent to 1.5 or 2 times (respectively) that in the spun up state of C N s p u n . These three configurations span the uncertainty in the observed permafrost carbon. In particular, they have different initial conditions for assessing the impact of uncertainty in the initial permafrost carbon content on the projected permafrost carbon loss under climate change (pfCloss). Table 1 summarises the initial permafrost C contents of the named C N simulations by JULES-IMOGEN.
An ensemble of transient simulations was run for each of the named configurations in Table 1. In addition, a set of diagnostic experiments were developed to assess the impact of the interactive carbon and nitrogen cycle with the layered soil biogeochemistry on both the northern high latitudes and on global climate feedbacks (Table 2). For each diagnostic experiment an ensemble of simulations was carried out where each member is equivalent to a member of the standard transient simulations.
The following sections use the ensembles defined in Table 2 to quantify the impact of climate change on the northern high latitude C cycle in the presence of an interactive C and N cycle, which includes the mineral N pool locked within the present-day permafrost soils.

3. Results and Discussion

3.1. Model Evaluation

The region over which the C N s p u n model simulates permafrost, for the period 2000–2009, is shown in Figure 1a. JULES-IMOGEN simulations are at a relatively coarse resolution and have no representation of sub-grid scale variability, so they only show either presence or absence of permafrost in any particular grid cell. The observations ([1]; our Figure 1b) are provided at a much a higher resolution and give the proportion of permafrost in each grid cell. In the observations, most of the regions where the annual mean air temperature is less than 0   ° C (MAAT a r e a < 0   ° C) have a non-zero probability of permafrost. We would prefer the model to represent permafrost in all of the cells where the observations have a probability of permafrost presence greater than 50%. Figure 1 suggests that the model over-estimates the permafrost extent in eastern Russia and underestimates it in eastern Canada. Table 3 compares the modelled permafrost extent of 15.2 million km 2 with the observed area of permafrost of 14.3 and 16.2 million km 2 [1,38]. (These observed areas are derived from the area of each grid cell weighted by the proportion of the grid cell containing permafrost.) Another relevant metric shown in Table 3 is the permafrost extent as a percentage of the land surface area where MAAT a r e a < 0   ° C. This is again comparable between the model and the observations, with the modelled value (67%) falling between the two observed values of 62% to 71%.
Additional to metrics of permafrost extent, a brief summary of the ability of C N s p u n to recreate the present day carbon and nitrogen cycle is also shown in Table 3. The dynamic vegetation model component of JULES-IMOGEN calculates the proportion of the different types of land cover in the permafrost region. In general, C N s p u n represents the correct proportions of vegetation cover and bare soil with only slightly lower tree cover than expected. However, the model represents too much grass cover and insufficient shrub cover compared with the observed data. The modelled carbon and nitrogen stocks and fluxes broadly match the selected observations. The plant productivity is slightly higher in the model than in the observations, causing an associated higher vegetation carbon content. However, given the uncertainties in the observations, we assume the model and observations are broadly comparable. Both the model and observation-based assessments have a slightly positive net ecosystem exchange, meaning that the northern high latitudes are expected to be a sink of CO 2 from the atmosphere and in the present day.
A major recent advance for the JULES land model is the addition of a nitrogen cycle (“JULES-CN”; [14]). In this CN model configuration, the N-cycle affects vegetation by acting to limit the simulated NPP. This limitation can be quantified using the response ratio which is defined as the ratio of the potential amount of C that can be allocated to growth and spreading of the vegetation when nitrogen is assumed to be freely available (NPP p o t ) compared with the actual amount achieved in the natural state when the nitrogen may be limiting (NPP). A comparison with the observations [50,51] for the tundra and boreal biomes (both regions with permafrost) suggests C N s p u n has a response ratio which falls at or below the lower end of the observations. This suggests that C N s p u n has a relatively small nitrogen limitation compared with the plausible range.
Residence times quantify how long carbon remains in the land system and can provide an extra check of whether the combined simulated carbon stocks and fluxes are correct. Whilst residence times do provide a good constraint on land models, their observation remains highly uncertain. For soils in particular, residence times are derived using the observed soil carbon stocks, which are themselves highly uncertain. Here, ecosystem residence time was estimated from a multi-annual mean on a grid cell by grid cell basis and then averaged spatially for both observations [48] and model. It is noted that the soil carbon used in the [48] data set is lower than that estimated by [49]. The ecosystem residence time for the permafrost region is 154 years in the model, but 97 years in the data set of [48]. Encouragingly for this assessment of the permafrost carbon feedback, the soil carbon residence time shown in Table 3 is very similar between model and observations.
Changes in the N fluxes and stocks are key to the response of the permafrost in biogeochemistry in a changing climate. Firstly, we examine the present-day behaviour. Figure 2 shows the seasonal cycle of the net mineralisation, plant demand and plant uptake under present-day conditions. The plant N demand and N uptake reaches a peak slightly earlier in the summer than the net mineralisation, suggesting that the plants can become more N-limited early in the summer if there is not enough available mineral N in the soil. The mean modelled net mineralisation for April to October averaged over the permafrost region is 5.2 g N/m 2 /year and plant uptake is 6.2 g N/m 2 /year. This is less than the mean demand for April to October of 8.4 g N/m 2 /year, suggesting that plants are not able to acquire all the mineral N they could potentially utilise. These model-based estimates are difficult to verify in full, as observations of N fluxes in the permafrost regions are limited and highly localised. The net mineralisation for April to October is higher than the field-based observations of ~1 g N/m 2 /year by [24,53]. Ref. [54] suggest that the maximum daily plant N uptake during the growing season is 8.3 mg N/m 2 /day compared with our estimate of around 20 mg N/m 2 /day. These limited results suggest that nitrogen cycling in JULES in the permafrost regions may be faster than observed. This may well be related to the low N limitation compared with the observations (Table 3).

Permafrost Soils

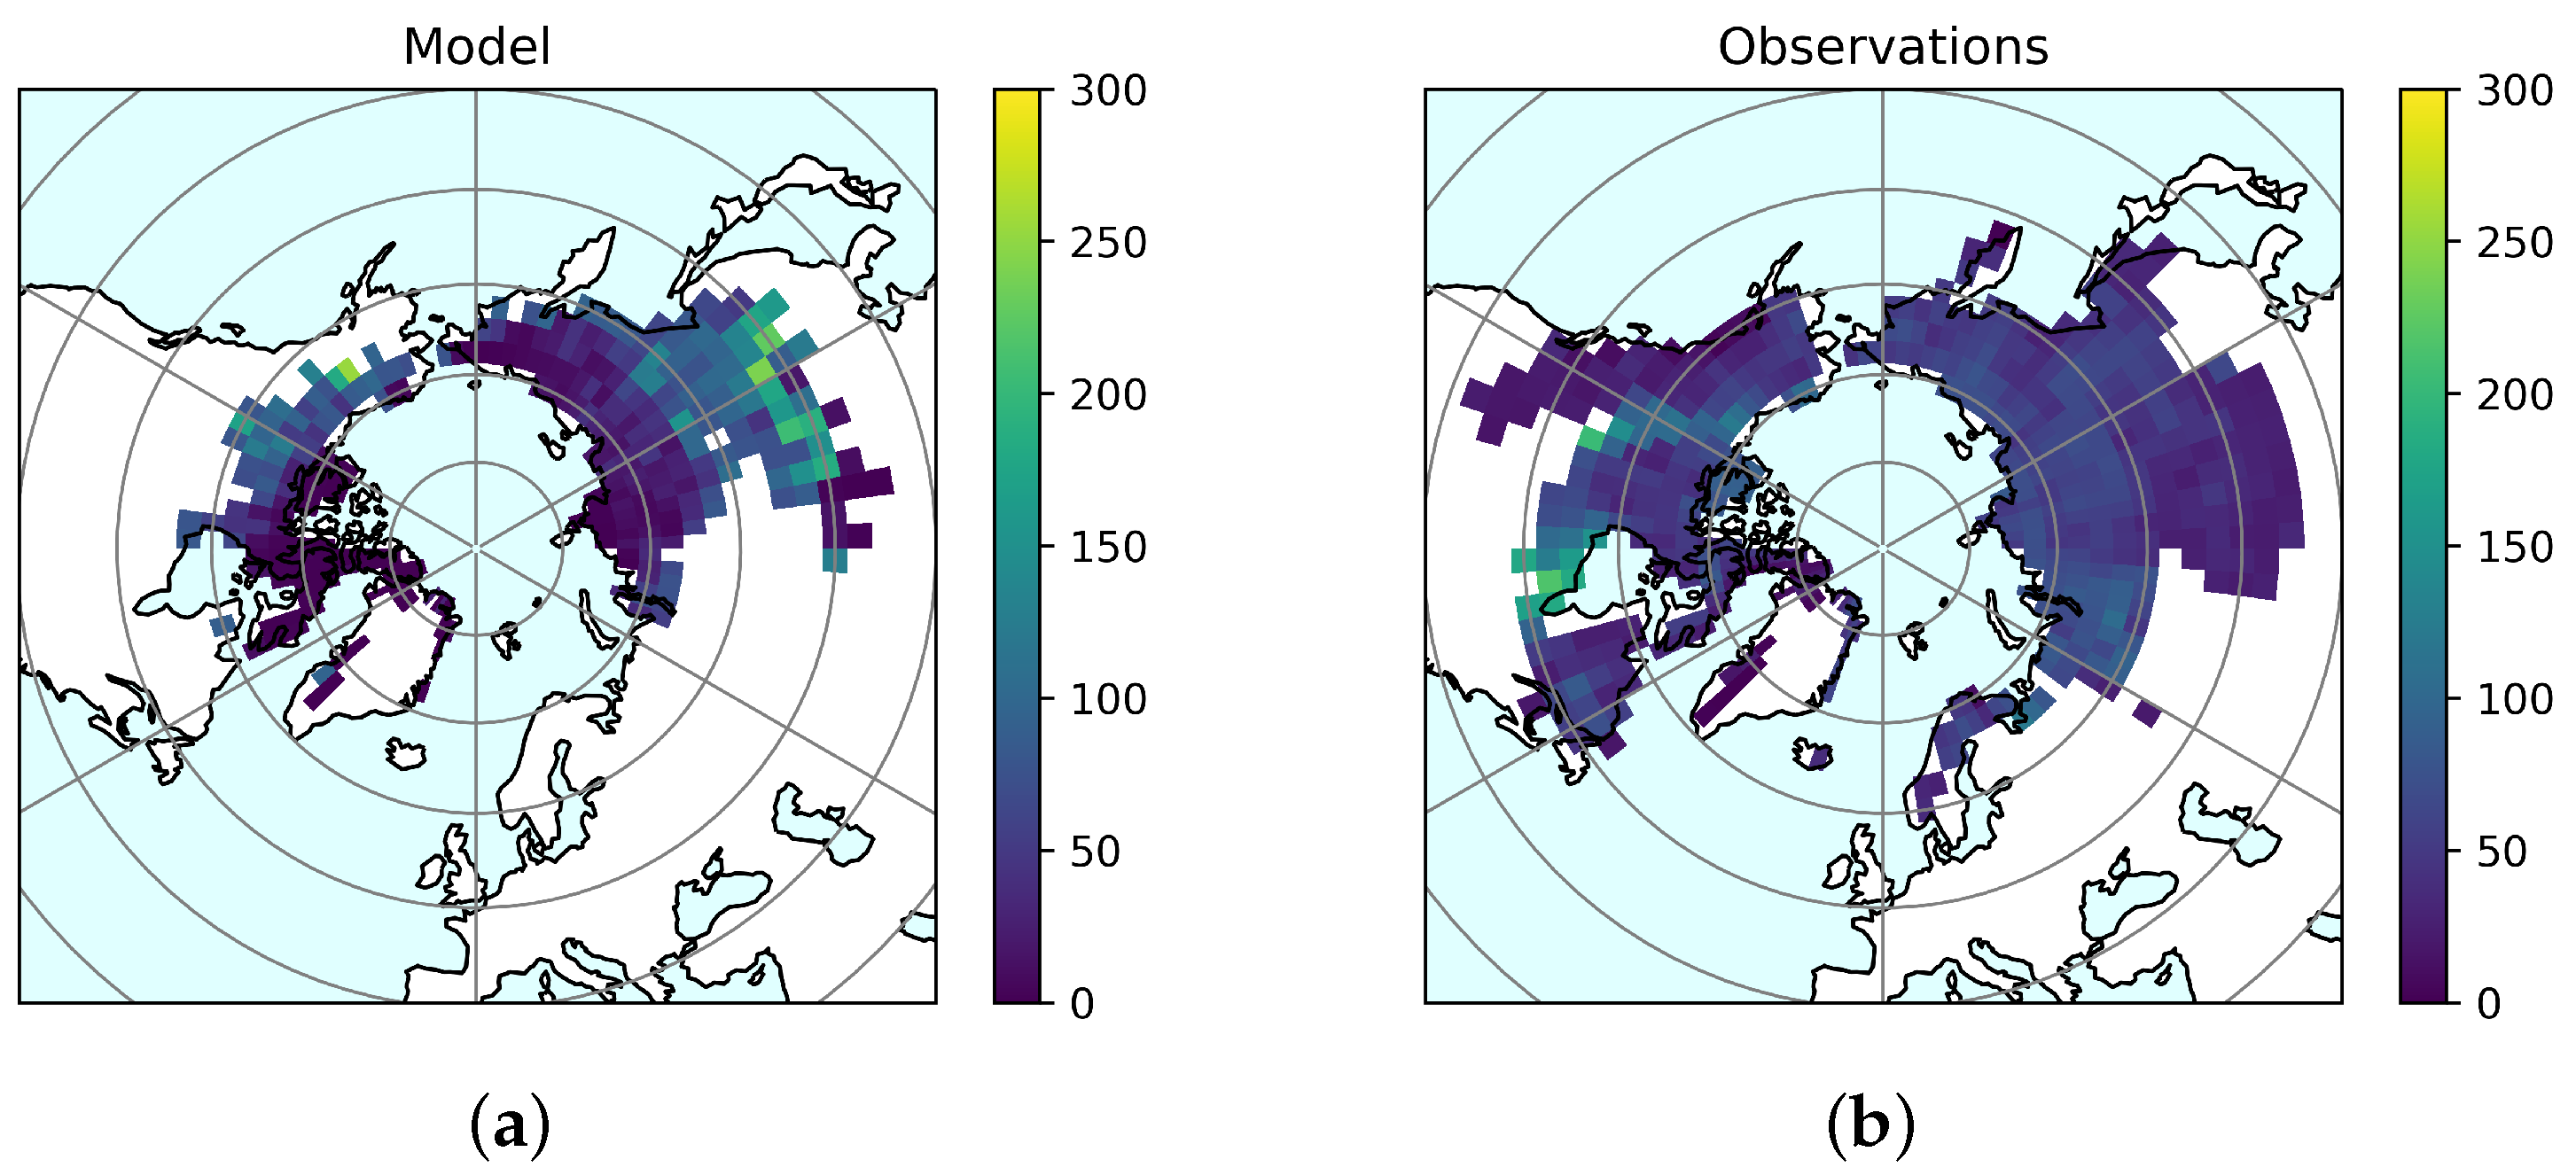
Figure 3 shows the spatial distribution of soil carbon in the top 3 m of soil, in simulation C N s p u n compared with the NCSCD observations [49]. In general, the model has less soil carbon in the northern permafrost regions and more in the southern permafrost regions compared with the observations. At present, JULES is missing processes such as peat soil formation, the deposition of wind-blown soil carbon, and the warmer paleo-climate conditions that may have been more favourable for carbon accumulation, so it is not expected to obtain the initial distribution of permafrost carbon accurately.
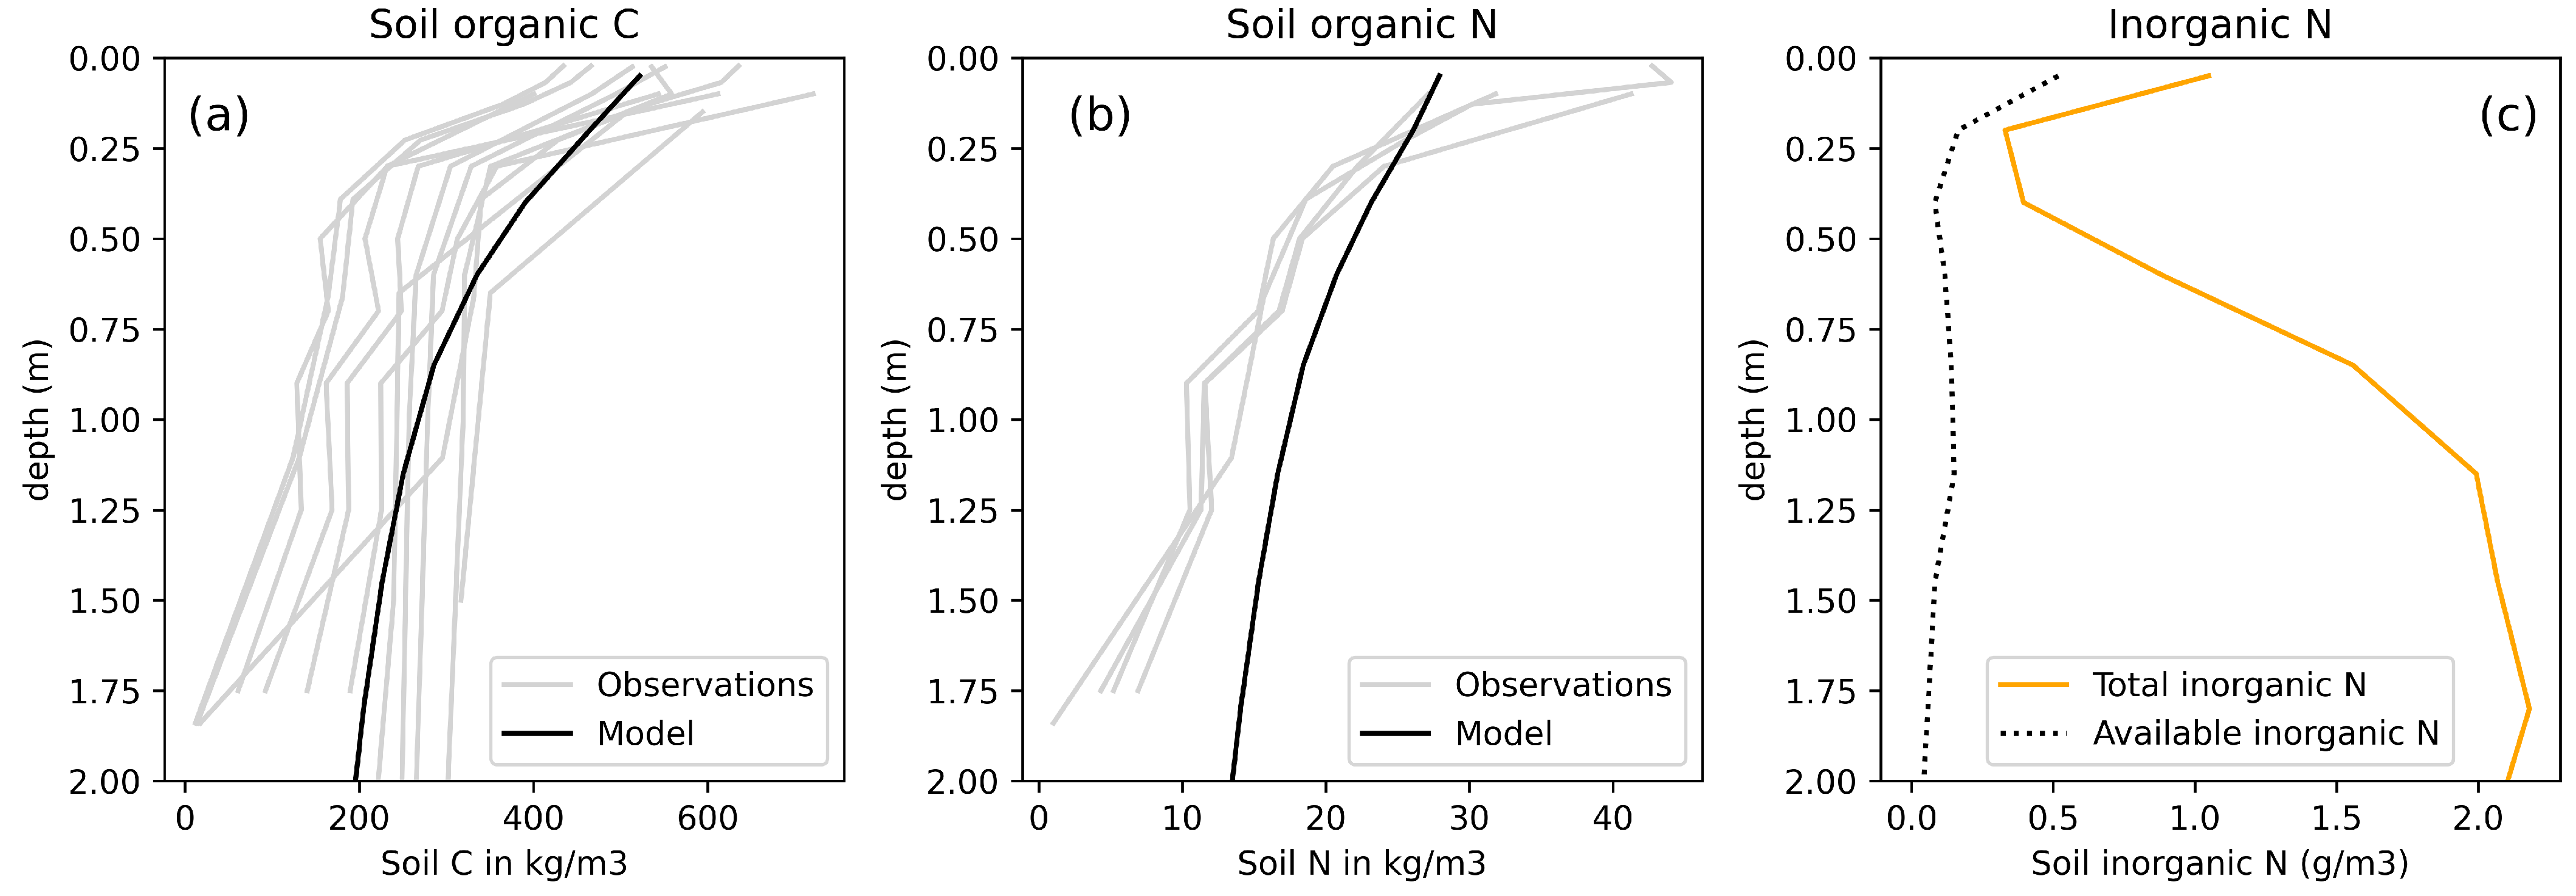
Figure 4a shows the present-day profile of soil C density in the permafrost region compared with the observations (the observations are discussed in more detail in the Supplement). Although the observations of organic C have a wide uncertainty (Figure 4; panel a, grey curves), the model falls within the spread of the observed values. At the large pan-Arctic scale, the profiles (model and data) all have generally higher values at the surface which decrease with increasing depth. It is noted that the model simulates very little soil organic carbon at depths of 3 m and greater. Moreover, shown in Figure 4 are the profiles of organic (b) and inorganic (c) N density. As with the organic C density the organic N density decreases with increasing depth. Although, Figure 4b does suggest the model organic N content decreases more slowly than the observations. The simulated organic N density is comparable with the observations—slightly lower near the surface and higher at depth.
The simulated present-day profile of inorganic N is shown in yellow in Figure 4c and the plant available inorganic N is shown in black. The profile of total inorganic N has a different shape to the organic C or N densities. There are higher values at the surface, which reduce just below the surface then increase to a maximum at between 1 and 2 m depth (typically just below the top of the permafrost table). These then decrease again deeper in the profile. At the surface, the higher concentrations are caused by the nitrogen deposition and fixation. A net mineralisation flux which decreases with increasing depth adds to the inorganic N deeper in the soil. This inorganic N is reduced by a temperature dependent turnover. The inorganic nitrogen below the top of the permafrost table is relatively inert at these cold temperatures and not part of the active nitrogen cycling. In addition, the plants have very limited access to this deeper inorganic N because of a combination of soil freezing and lack of roots. Figure 4c shows the plant-accessible inorganic N with the black dotted line. This is a very small fraction of the total inorganic N and indicates that the model can simulate a supply of inorganic N that is locked within the permafrost under the current climate. As the temperature warms the available inorganic nitrogen will increase when some of the additional, but unavailable inorganic nitrogen becomes active in the nitrogen cycling.
Measurements of the inorganic N profile have been made at selected sites in the Arctic. For example, Ref. [19] measured ammonium content from cores in eastern Siberia and found that ammonium was significantly higher in the permafrost than in the active layer—between 2 and 40 times depending on location. Additionally, Ref. [53] found, for a site in Alaska, that extractable dissolved inorganic nitrogen was 35 times higher in the permafrost than in the active layer. This is larger than the seven-fold increase found by [24]. Figure 4c suggests that the permanently frozen soils have about four times as much inorganic nitrogen than the active layer. This falls towards the lower limit of the range of available site observations.

3.2. Projections over the Permafrost Region

3.2.1. Soil Nitrogen

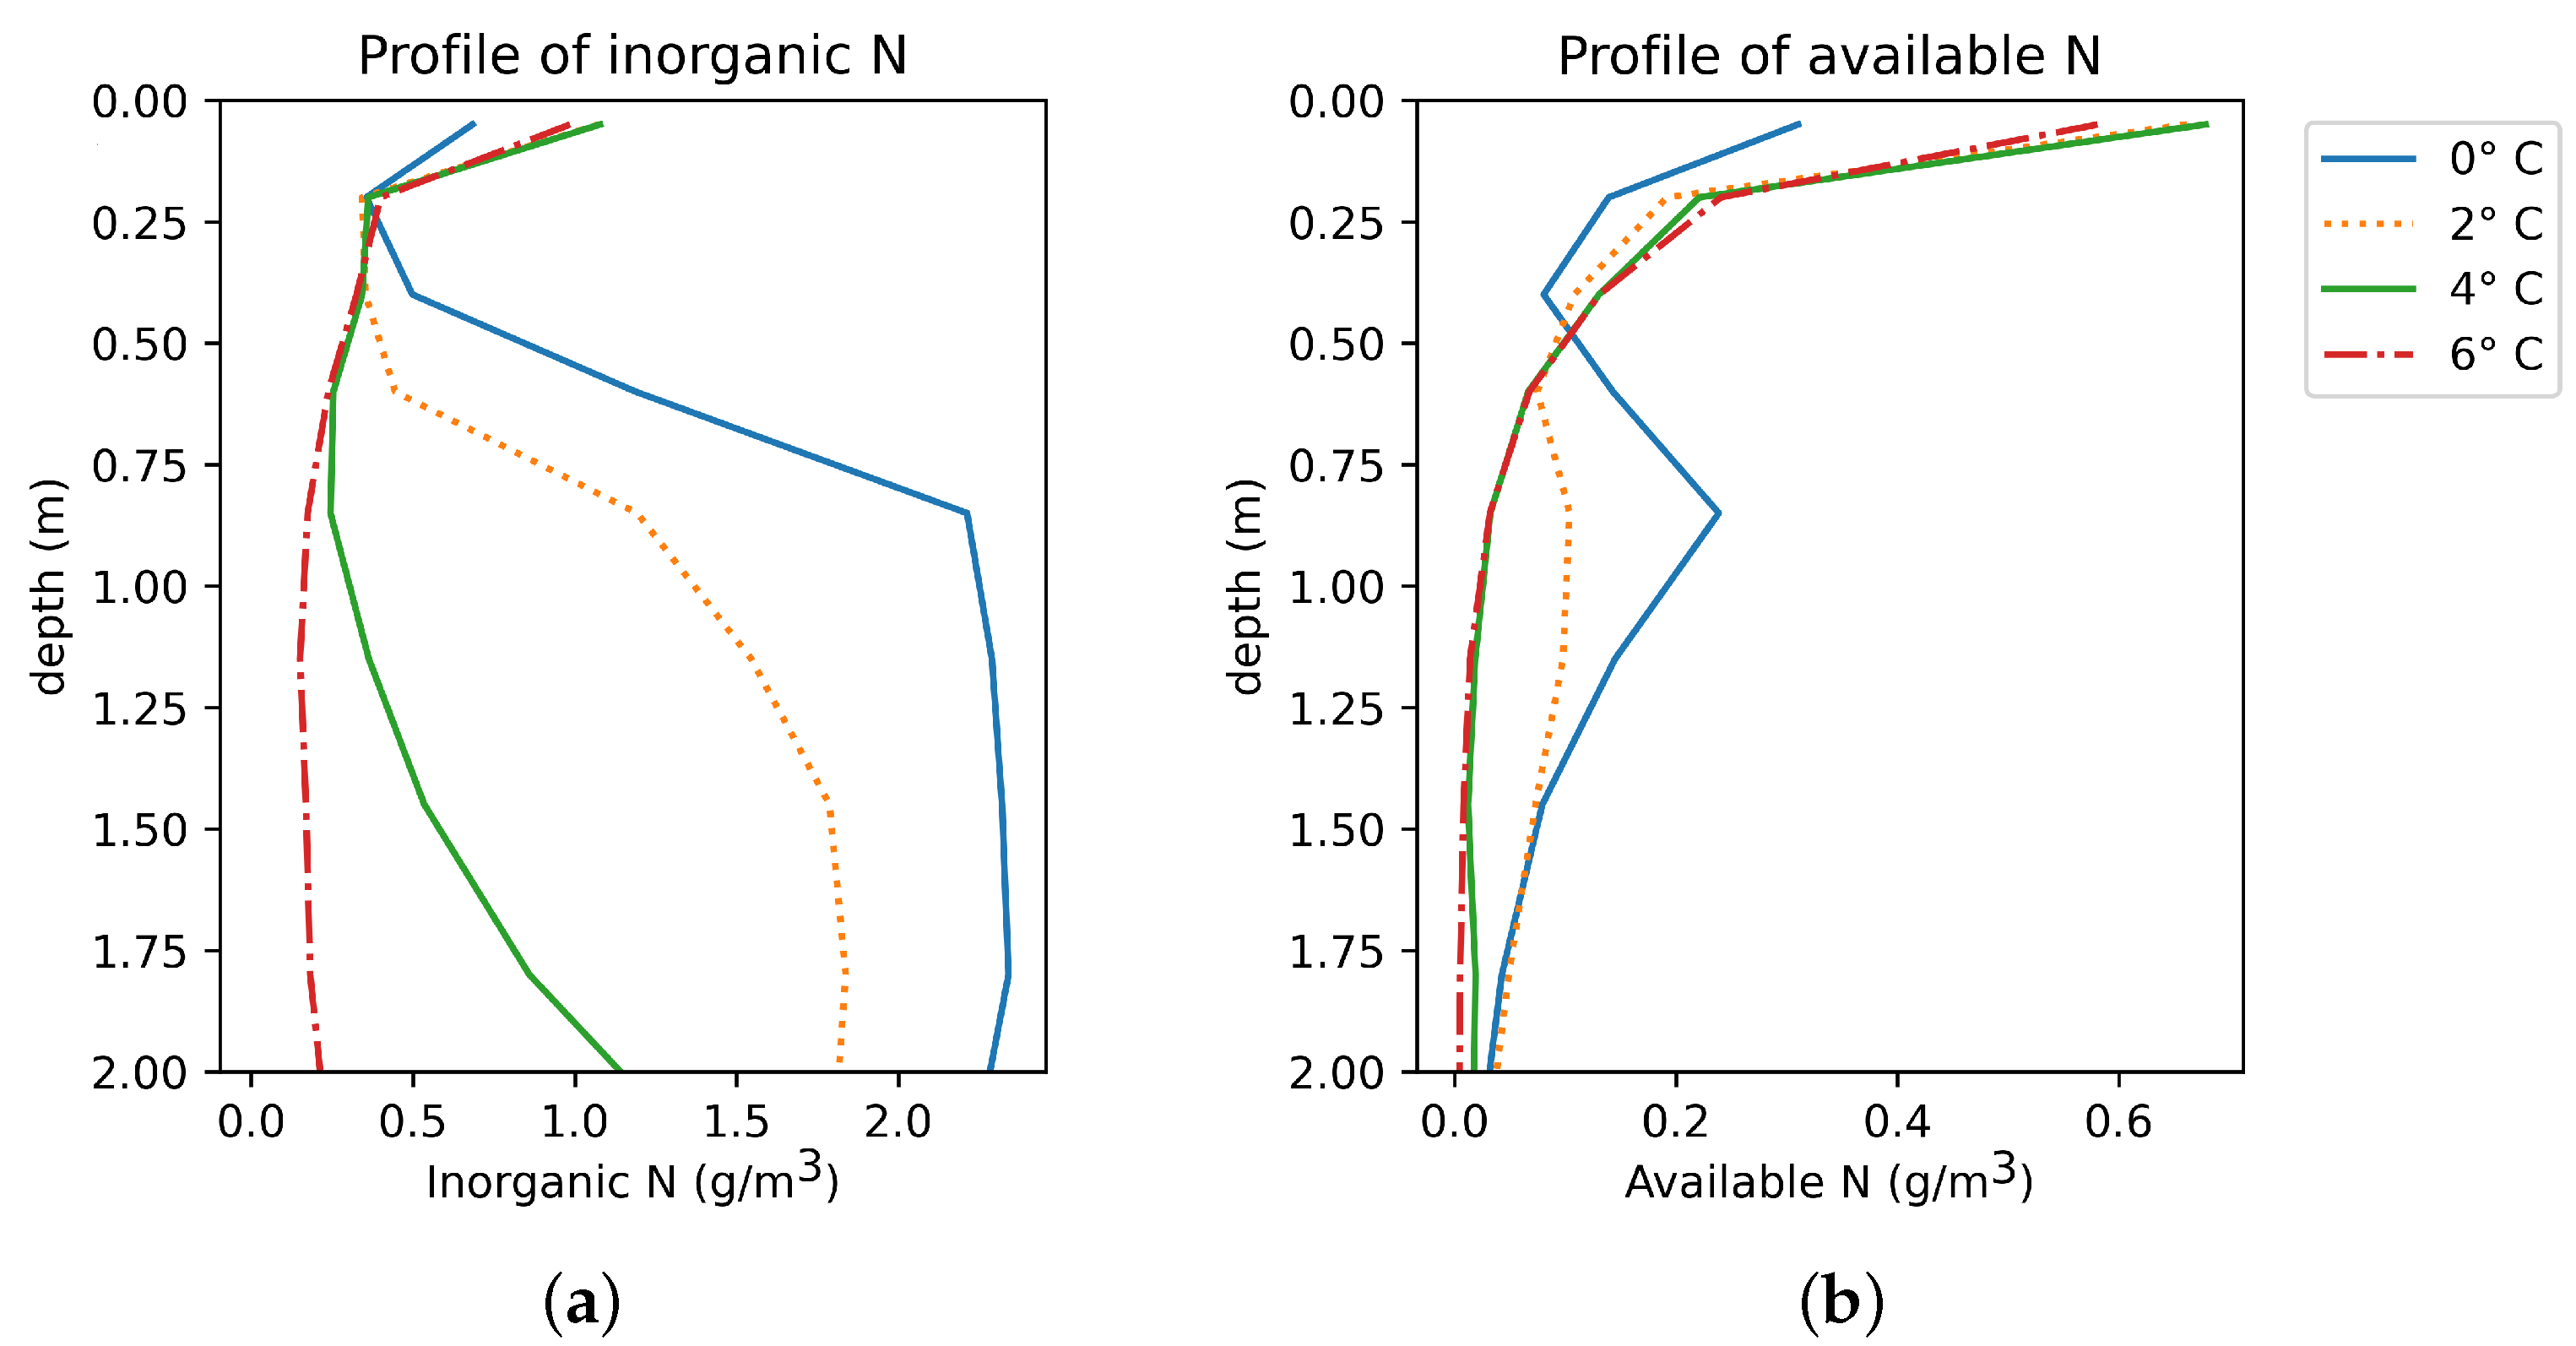
In a changing climate, both the net mineralisation flux and the plant N uptake increase with increasing temperature. However, there is asymmetry in time between the increase in net N mineralisation which occurs later in the year and increase in plant N uptake which occurs earlier in the year leading to a build up of the inorganic N pool in the autumn and a depletion in the spring. This also results in more inorganic N nearer the surface and less deeper in the profile (Figure 5a). In the future, any thawing of permafrost or change in vegetation distribution will change the proportion of the inorganic N available for plant uptake. This response is shown in Figure 5 for the permafrost region at a range of global mean temperature changes. As the temperature increases, the soil thaws and more of the inorganic N becomes available for the plants to uptake. Figure 5a shows a reduction in the total inorganic N pool at depths greater than 30 cm with increased temperature alongside an increase in the inorganic N pool at the surface. It should be noted that the availability of mineral N to the plants is highly dependent on the root distribution relative to the frozen soil. In general, below-ground plant traits are modelled less comprehensively than their above-ground characteristics, yet in high latitudes, these features will impact simulated ecosystem response to permafrost thaw [22,55].

3.2.2. Nitrogen Limitation

The simulated change in N limitation over the permafrost region and over time is shown via the response ratio in Figure 6a. A higher response ratio reflects more N limitation and a lower response ratio means less N limitation with a response ratio of 1 meaning no N limitation. Figure 6a shows that during the 20th century when there is a relatively small amount of climate change, N limitation is relatively stable. Over this period, despite the increase in atmospheric CO 2 , the vegetation is unable to take up as much CO 2 as it could potentially use because it does not have enough N available in the soil. However, as the permafrost begins to thaw and there is an increase in plant available N from the soil which fertilises the vegetation and increases the amount of carbon it can take up. This reduces the response ratio. Figure 6a shows that reduction in nitrogen limitation in the Arctic is greatest in the high emissions scenario, RCP8.5. The spatial distribution of the response ratio is shown in Figure 6b,c. The model suggests that the vegetation is more N limited in the tundra regions than in the boreal regions in the present day (see also Table 3). By 2200 for the RCP8.5 scenario, only the very high Arctic tundra show notable amounts of N limitation.

3.2.3. Implications for the Carbon Cycle

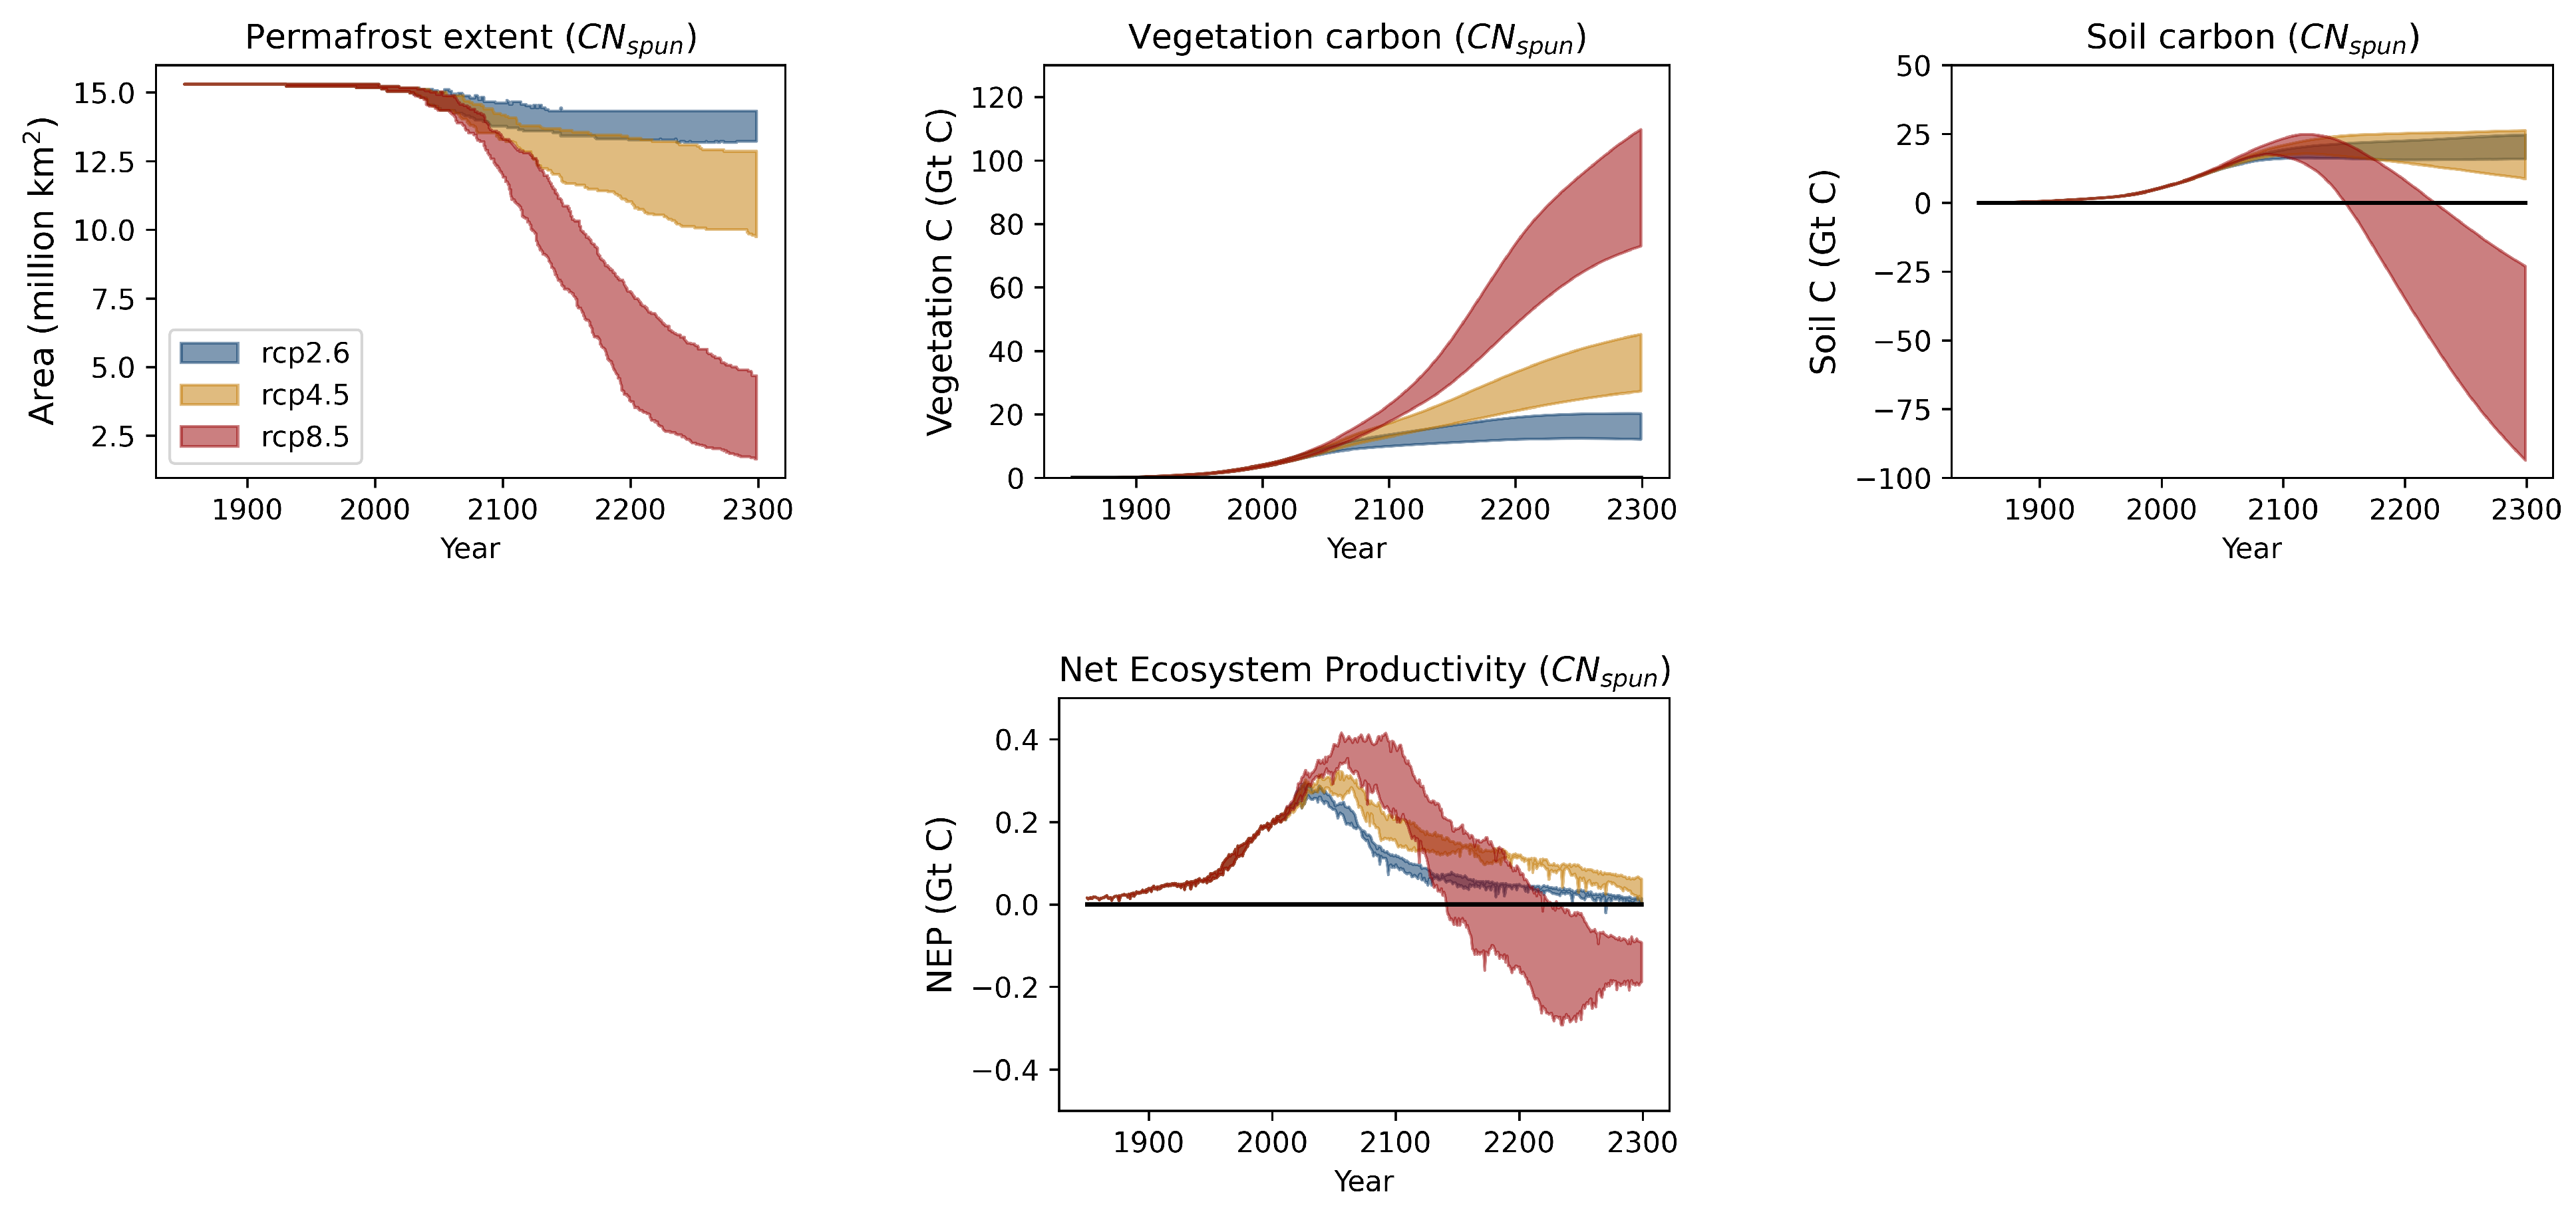
Figure 7 shows the transient response to the applied climate change of the permafrost extent along with the vegetation and soil carbon and net ecosystem productivity for the different scenarios. There is a gradual loss of permafrost from ~15 million km 2 in the present day to between 12 and 14 million km 2 depending on scenario by 2100. The vegetation carbon increases in the northern high latitudes because conditions become more favourable for plant growth. This increase is 10–20 Gt C by 2100 and 10–120 Gt C by 2300. This large increase in vegetation carbon in the model is related to a poleward expansion of trees. Table 3 shows the model has 2 million km 2 of trees at the beginning of the 21 century. This increases to 3.2 million km 2 by 2100 under RCP8.5 up to as much as 10 million km 2 by 2300 with an associated reduction in grass and bare soil. The soil carbon increases slightly between the start of the simulation and 2100 and then levels off and decreases slightly (or decreases more significantly in the case of RCP8.5).
During the historical period, the net effect of changes in soil and vegetation carbon on the net ecosystem productivity is an increase in carbon uptake, i.e., the permafrost region is a net sink as in [56]. Future projections using our model suggest that this net uptake reduces after ~2050 and, depending on scenario and model initialisation, the permafrost region may become a source of carbon. The permafrost region remains a sink for both RCP2.6 and RCP4.5 scenarios. For the RCP8.5 scenario C N s p u n shows the permafrost region becoming a small source of carbon of around 0.2 Gt C per year after 2100.

3.3. Mineral Nitrogen Vegetation Fertilisation (minNfert) and Feedback (minNfert-Feed)

Approximately half of the increase in vegetation C seen in the C N s p u n simulation is caused by the reduction in N limitation as the permafrost thaws (Figure 8a). Figure 8 shows this response of the vegetation in C N s p u n to the mineral N vegetation fertilisation. This extra uptake of carbon by the land surface can be translated to a negative feedback onto the global surface air temperature (Figure 8b). Figure 8b shows that the impact of increased mineral N reduces the global surface air temperature by up to 0.05   ° C depending on scenario. It should be noted that this feedback is independent of the amount of permafrost soil carbon at the start of the simulation. The uncertainties shown as plumes in Figure 8 represent the difference in climate sensitivities and Arctic amplification between the driving climate models. Figure 9 shows that the mineral N vegetation fertilisation is independent of the initial permafrost carbon. This is in contrast to the permafrost carbon lost, which increases with increased initial permafrost carbon (See also the Appendix A).

3.4. Comparison with the Permafrost Carbon Feedback (pfCloss-Feed)

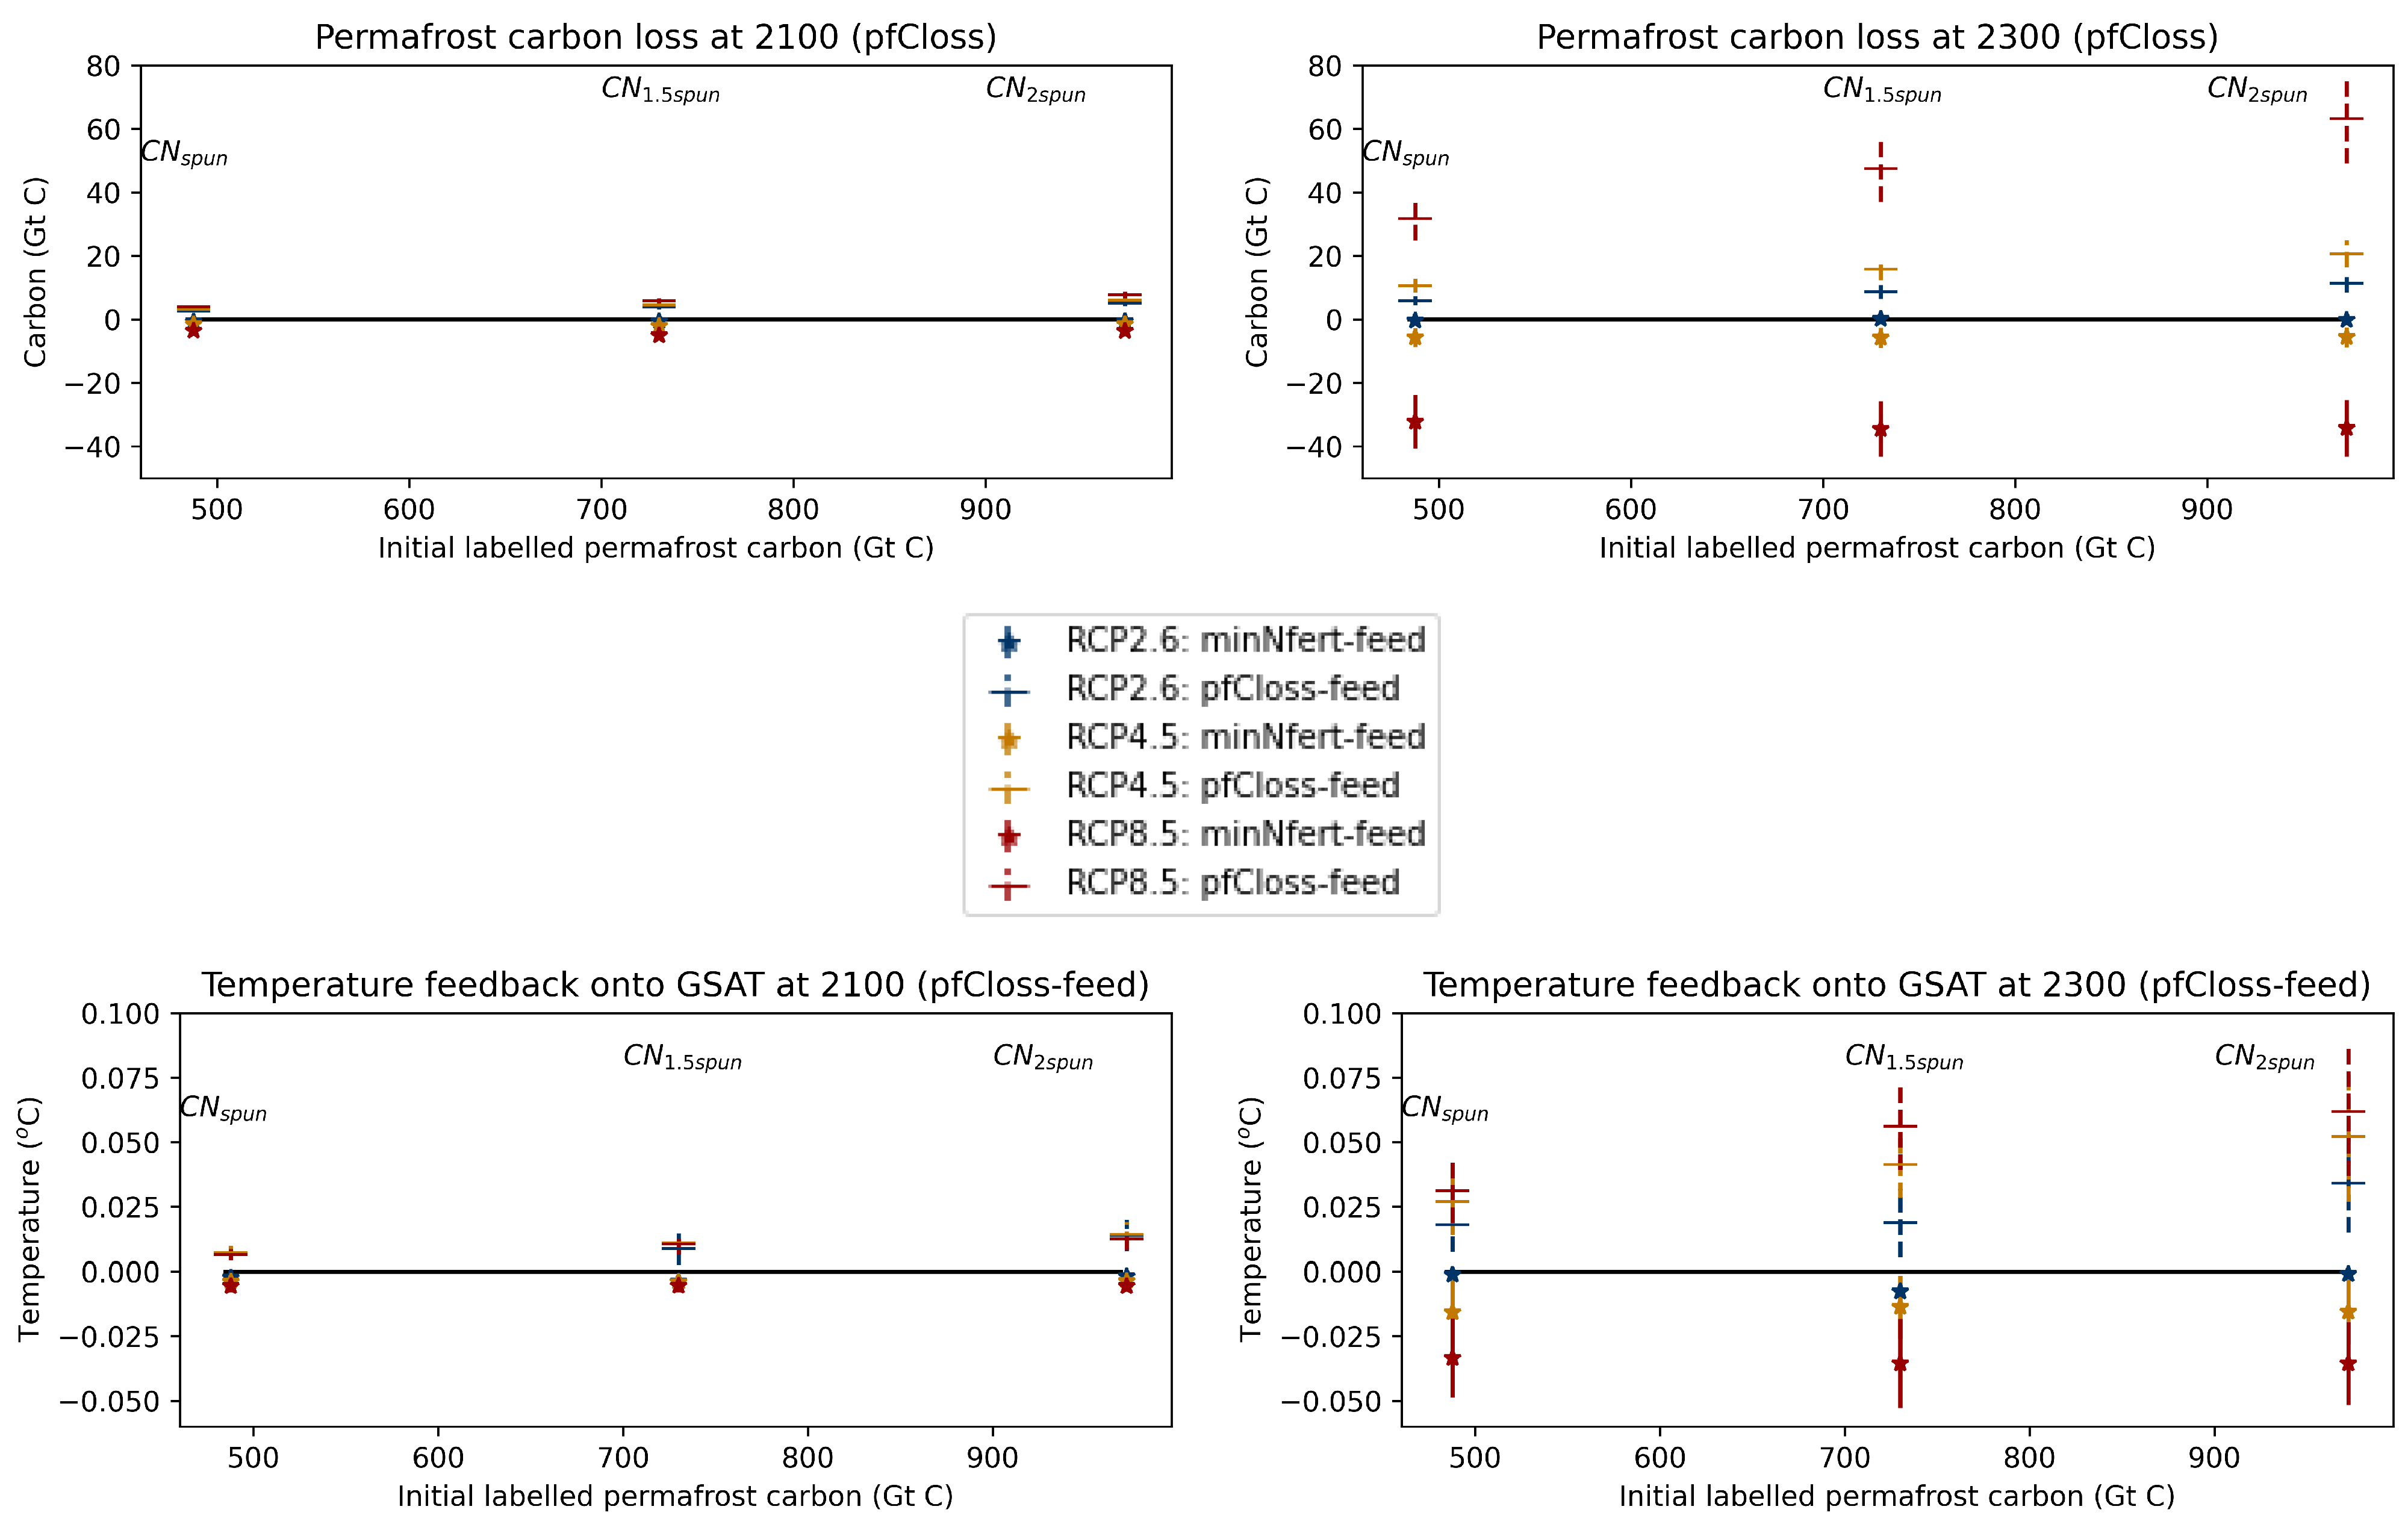
The permafrost carbon loss (pfCloss) and feedback (pfCloss-feed) for the different future scenarios were quantified using the method summarised above and discussed in detail in the Appendix. The three different versions of the CN model each with a different plausible initial labelled permafrost carbon content are shown. The top row of Figure 9 shows the loss of labelled permafrost carbon as a function of the initial labelled permafrost carbon content for 2100 (top left figure) and 2300 (top right figure). For comparison purposes, also included on these figures are the impacts of increasing available mineral nitrogen in the soil on the carbon emissions via an increase in vegetation carbon (minNfert). Moreover, pfCloss and minNfert have opposing signs and their combined interaction gives the net effect of the impact of thawing permafrost on the northern high latitudes biogeochemical cycling simulated within JULES. The bottom row shows the temperature feedbacks onto GSAT representing pfCloss-feed and minNfert-feed for the same time periods.
As might be expected, pfCloss and pfCloss-feed are dependent on the initial labelled permafrost carbon content—the higher the initial labelled permafrost carbon the larger the C loss and the feedback temperature. This loss is between 2 and 8 Gt C by 2100. By 2300, this loss is between 5 and 75 Gt C with RCP8.5 releasing notably more labelled permafrost carbon than the other two scenarios. At the lower initial permafrost carbon contents the pfCloss is generally offset by minNfert. Whereas at the higher values of the initial carbon content the pfCloss is greater than minNfert. The net effect on global surface air temperature of pfCloss-feed (warming effect) and minNfert-feed (cooling) is relatively small by 2100—up to 1 hundredth of a °C. This increases slightly by 2300 up to about 0.1 °C. These two processes offset each other and the net effect of the two feedbacks (not shown) can vary in sign depending on the initial permafrost carbon content.

4. Discussion and Conclusions

This paper uses the JULES-IMOGEN framework to assess the effect of including a mineral nitrogen store in permafrost regions on the vegetation carbon. Such nitrogen is preserved within the present-day permafrost, but is projected to act as a fertiliser causing increased vegetation carbon uptake as the soil thaws. We find that the uptake of this mineral nitrogen by the plants reduces the N limitation of vegetation resulting in a negative feedback onto the climate by slowing the rate of increase of atmospheric CO 2 . Using our JULES-IMOGEN framework, we find this extra N fertilisation causes a negative (stabilising) climate feedback potentially equal in magnitude to the positive (destabilising) permafrost carbon climate feedback. It should be noted that the permafrost carbon feedback is strongly dependent on estimates of the soil carbon initial conditions. That is, the more permafrost carbon present at the start of the simulation, the greater the positive feedback and the more likely the net effect of including both permafrost carbon and nitrogen biogeochemistry in JULES is a positive feedback onto the global surface air temperature.
The C and N cycle used within the JULES model [14] may well have less N limitation in the Arctic compared to the observations. In addition, the model may not have quite as much frozen mineral N as is observed. Moreover, JULES does not include processes such as invasive pests, pathogens, or altered herbivory regimes which could impact the relative importance of N availability. These factors mean that JULES-IMOGEN may well under-estimate the negative mineral N feedback on vegetation carbon. There are additional nitrogen cycling processes not discussed here which will also feedback onto the climate. For example, the response of the N cycle to changes in hydrology will impact the balance of nitrogen loss between leaching and denitrification. Any subsequent change in nitrous oxide emissions will feedback onto the global climate [57].
There remain two major missing processes within the JULES model that could significantly modify the permafrost physics and biogeochemistry and potentially lead to a greater (destabilising) permafrost feedback onto the global climate. These are disturbance from fire [58] and abrupt thaw processes [12,59]. Abrupt thaw will probably occur in <20% of the permafrost zone but could affect half of permafrost carbon through collapsing ground, rapid erosion and landslides, exposing this carbon to degradation processes [12].
JULES provides one structural representation of carbon and nitrogen cycling in the permafrost region. However, we believe it will be valuable for other terrestrial modelling groups to include this feedback in their land models. This will enable a fuller assessment of the range of plausible uncertainties associated with carbon and nitrogen cycling in the northern high latitudes and any feedbacks onto the global climate.

Supplementary Materials

The following are available online at https://www.mdpi.com/article/10.3390/nitrogen3020023/s1. References [60,61,62,63,64,65,66] are cited in the Supplementary Materials.

Author Contributions

Conceptualization, methodology and analysis, E.B. and S.C.; writing—review and editing, E.B., S.C. and C.H. All authors have read and agreed to the published version of the manuscript.

Funding

This project has received funding from the European Union’s Horizon 2020 research and innovation programme under Grant Agreement No. 101003536 (ESM2025—Earth System Models for the Future). E.B. was supported by the Joint UK BEIS/Defra Met Office Hadley Centre Climate Programme (GA01101). S.C. was supported by a Natural Environment Research Council independent research fellowship (grant no. NE/R015791/1).

Institutional Review Board Statement

Not applicable.

Informed Consent Statement

Not applicable.

Data Availability Statement

Both the model code and the files for running it are available from the Met Office Science Repository Service: https://code.metoffice.gov.uk/ (accessed on 20 March 2022). Registration is required and code is freely available subject to completion of a software license. The results presented in this paper were obtained from running JULES branch: https://code.metoffice.gov.uk/trac/jules/browser/main/branches/dev/eleanorburke/vn5.1_permafrost (accessed on 20 March 2022) which is a branch of JULESv5.1. The runs were completed with the Rose suite https://code.metoffice.gov.uk/trac/roses-u/browser/a/j/2/5/7/ (accessed on 20 March 2022) and branches there of. All data are available on request from the author.

Conflicts of Interest

The authors declare no conflict of interest.

Appendix A. The Permafrost Carbon Feedback

Appendix A.1. Revised Methodology for Estimating the Permafrost Carbon Feedback Temperature
Ref. [6] quantified the permafrost carbon feedback using the JULES-IMOGEN framework and a carbon cycle only configuration (JULES-C). Here, we update those estimates using a modified methodology and results from simulations using the more recently developed interactive carbon and nitrogen configuration (JULES-CN). Three different distributions of initial soil carbon amounts are represented as defined in Table 1 ( C N s p u n , C N 15 s p u n , C N 2 s p u n ). Another difference between this work and [6] is the pattern scaling data and energy balance model in IMOGEN, which are now derived from the CMIP5 model ensemble compared with the CMIP3 model ensemble used in [6].
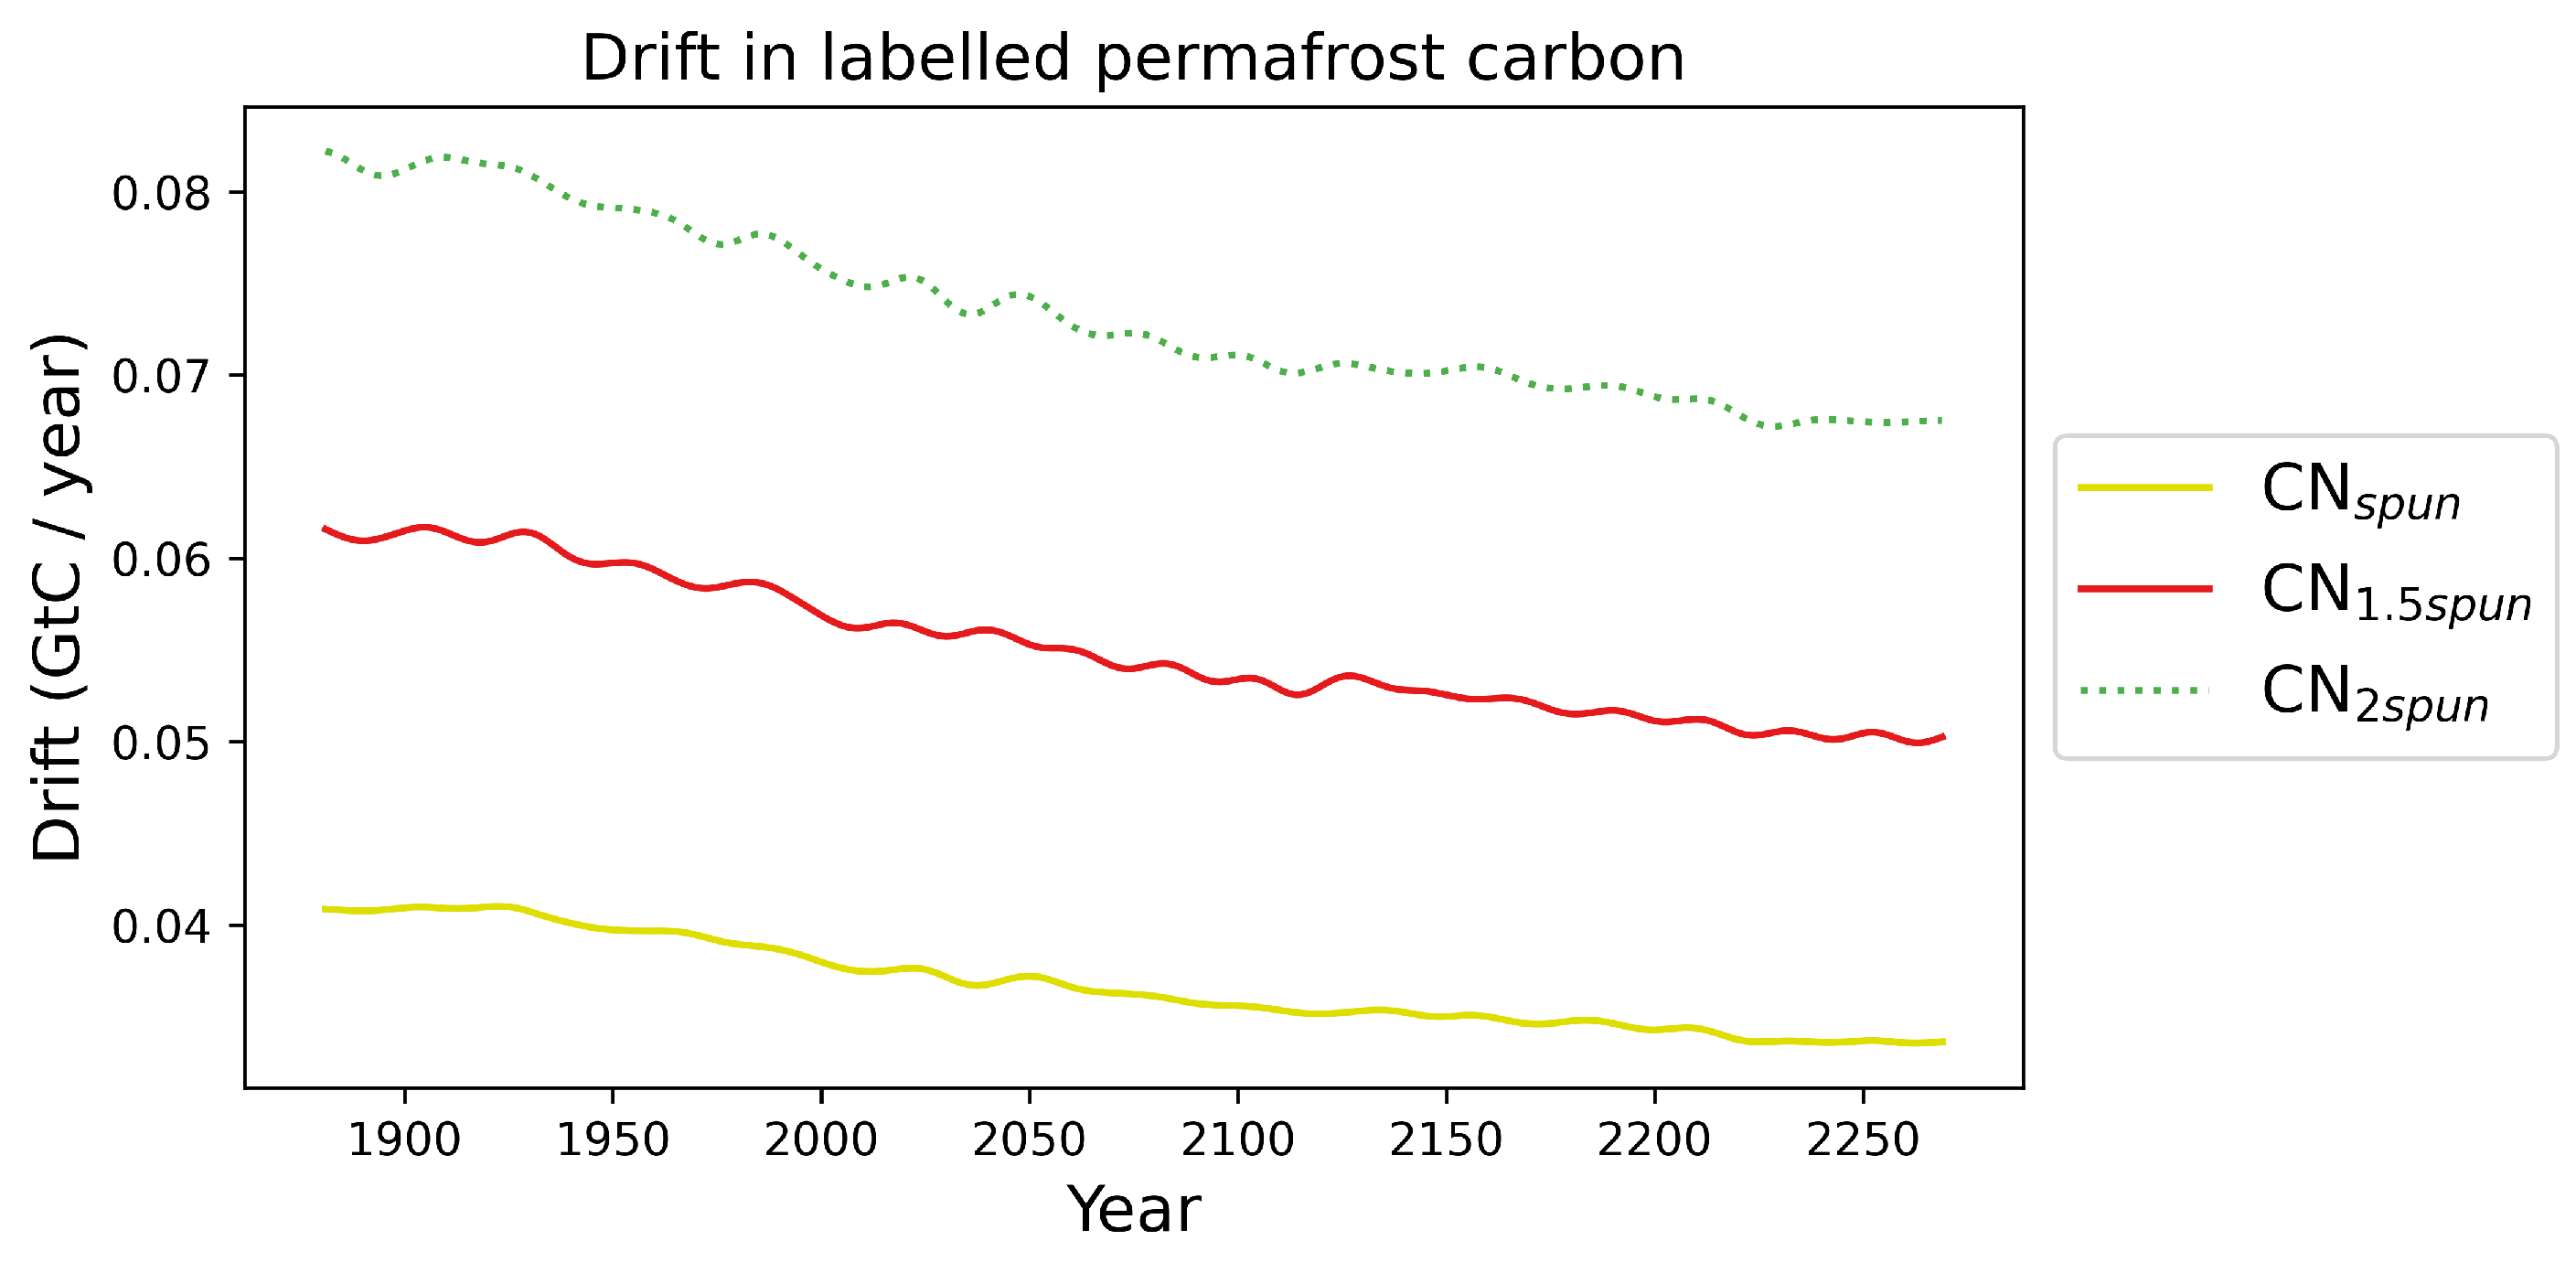
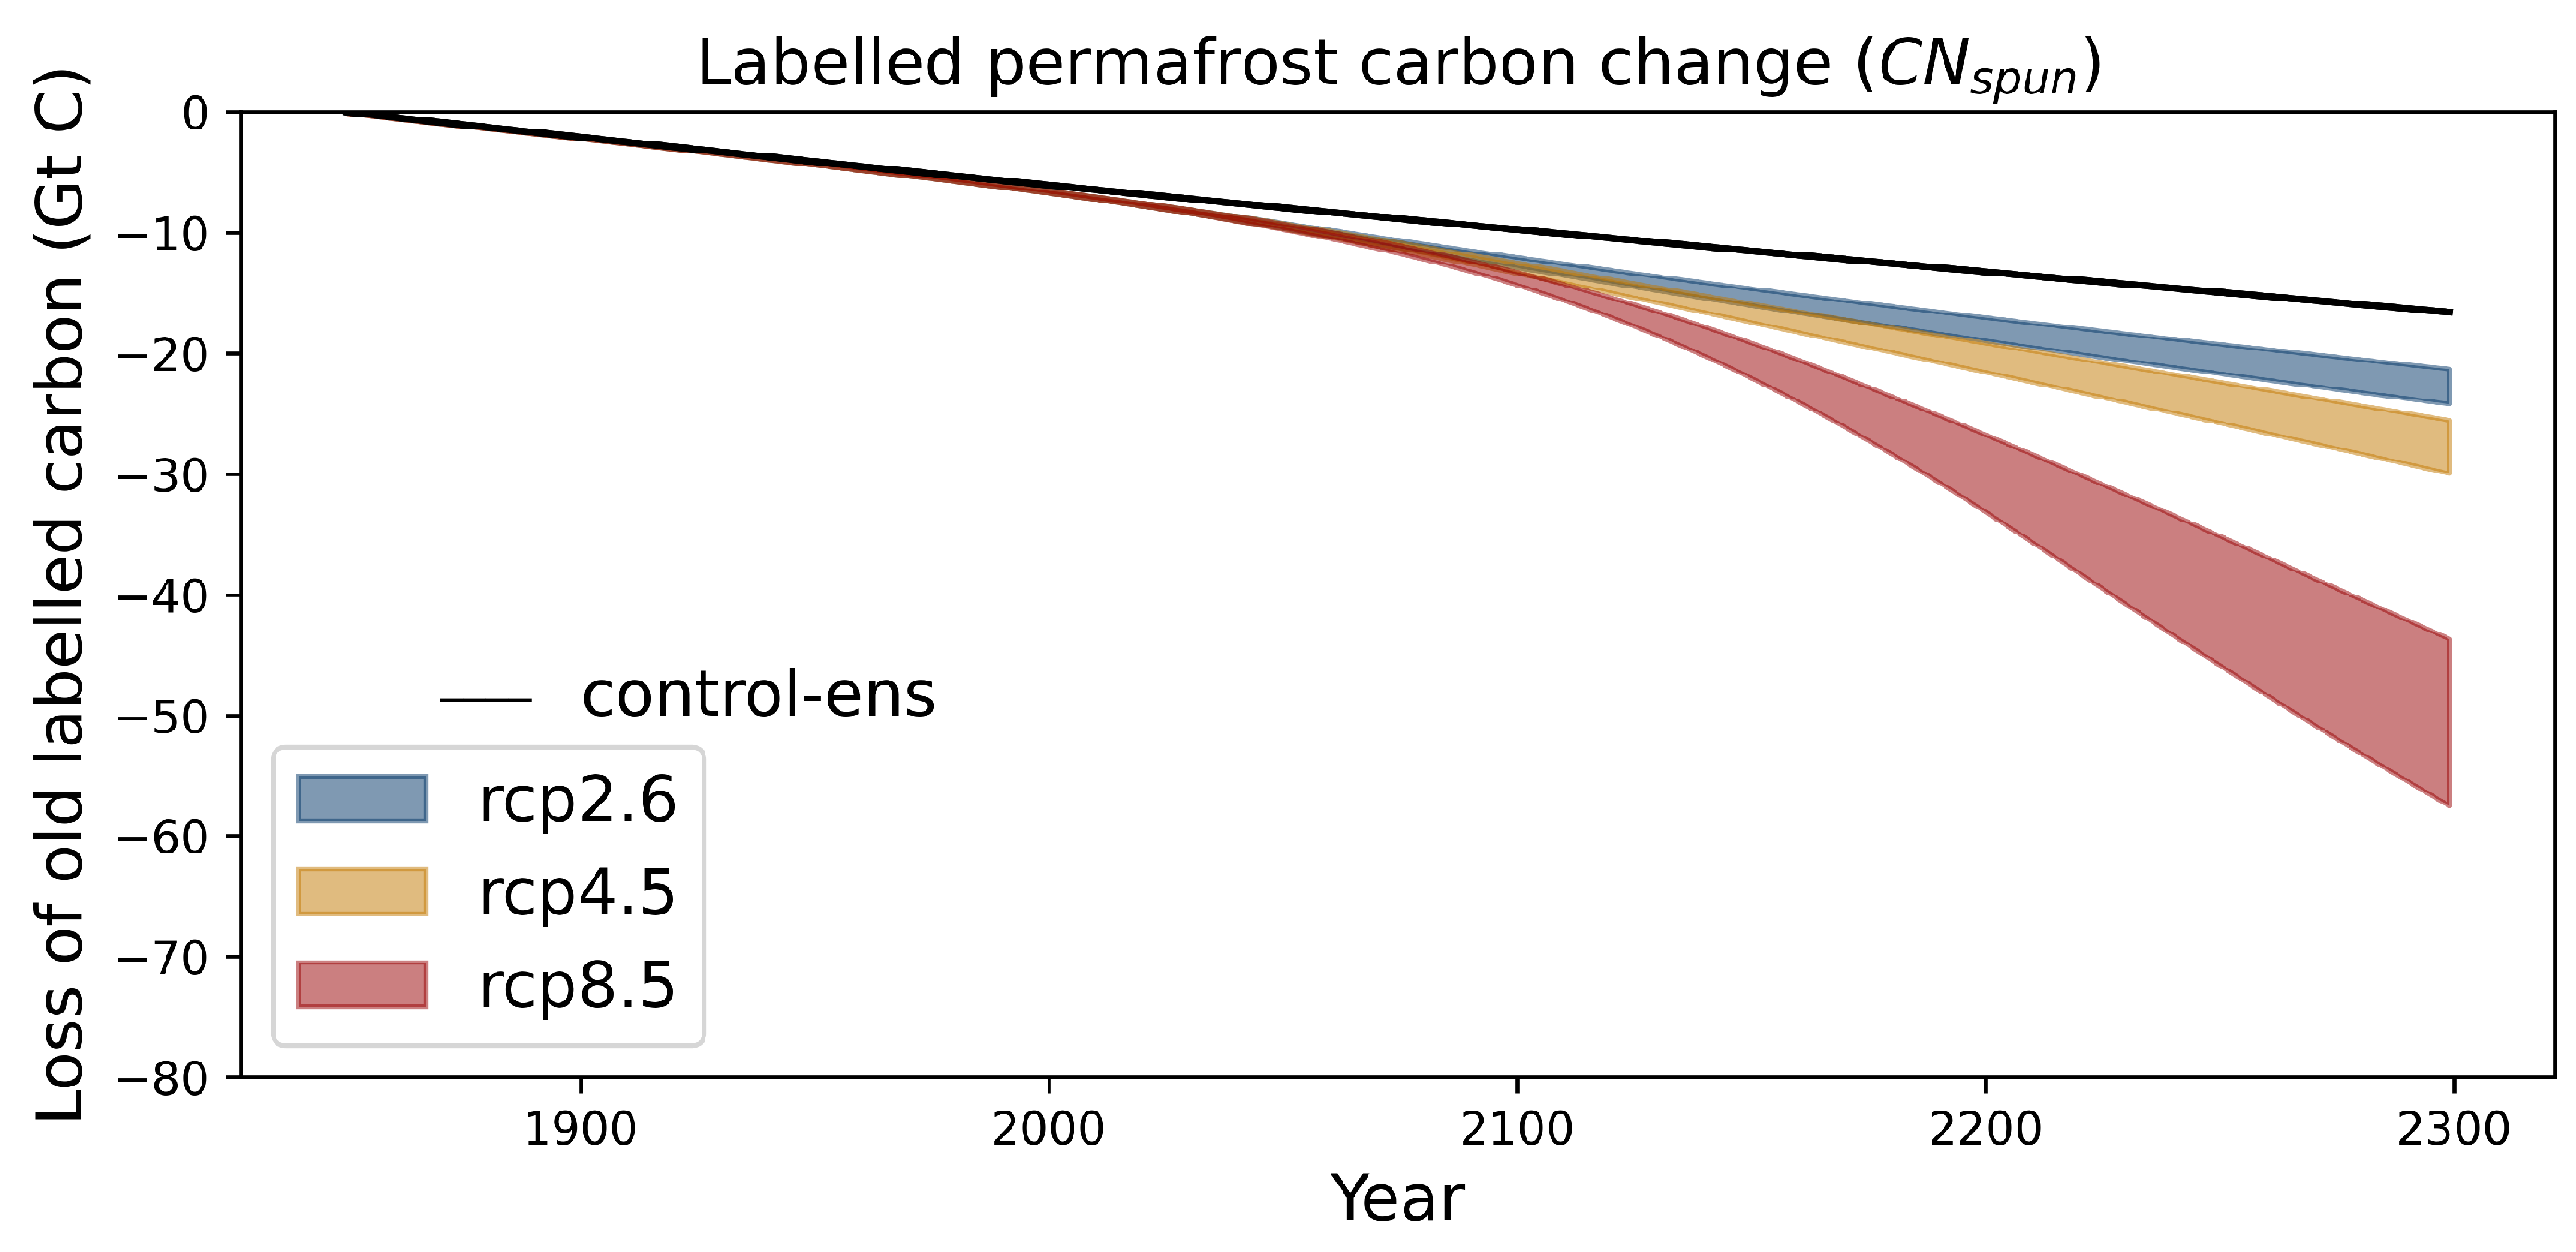
In a stable climate, JULES simulates an on-going small exchange between the carbon above the permafrost table and labelled permafrost carbon below the permafrost table [6] caused by a combination of mixing processes and some very slow simulated decomposition in the permafrost. This artificially increases the estimate of the permafrost carbon feedback when it is derived using the methodology discussed in [6]. The new methodology proposed here uses additional runs, namely the control-ens (Table 2) to diagnose these annual emissions, which are then taken into account when quantifying the permafrost carbon feedback. Each transient-ens member has an equivalent control-ens member (Table 2) where the climate, CO 2 emissions and nitrogen deposition are set to that at the start of the simulation, i.e., there is no change in climate drivers. Therefore, in the simulations of the control-ens any loss or drift in the labelled permafrost carbon is not related to external forcing. Figure A1 shows the loss in labelled permafrost carbon in a stable climate for the three different simulations with varying initial permafrost carbon amounts shown in Table 1. This loss is dependent on both the initial permafrost carbon and the time after the initialisation of the simulation. In general, the more labelled permafrost carbon present at the start of the simulation the greater the loss with the annual loss decreasing slowly over time. At the beginning of the simulation, the loss is around 0.008% of the labelled permafrost carbon each year and falls to around 0.007% per year after 350 years. This gives a total loss of 6 Gt C by 2000, reaching around 16.5 Gt C by 2300 for CN s p u n (black line; Figure A2).
Figure A1. The annual loss of labelled permafrost carbon (in Gt C per year) caused by the on-going small exchange between the carbon above the permafrost table and permafrost carbon below the permafrost table (denoted labelled permafrost carbon in this paper) in a stable climate using the control-ens of the JULES-CN configuration.
Nitrogen 03 00023 g0a1
Figure A2. The cumulative loss of labelled permafrost carbon caused by the on-going small exchange between the carbon above and the labelled carbon below the permafrost table in a stable climate for C N s p u n . The black line is for the control-ens and the shaded areas show the range of the transient-ens and the differences between the black line and shaded area represent the loss of permafrost carbon.
Nitrogen 03 00023 g0a2
Figure A2 shows the control-ens for C N s p u n (black line) alongside the equivalent transient-ens. Ref [6] used a set of simulations equivalent to the transient-ens but used JULES-C and did not remove the drift. They ([6]) found a loss of labelled permafrost carbon of 40 Gt C by 2100 (independent of scenario) and an ensemble mean of 70 Gt C for RCP2.6/ 200 Gt C for RCP8.5 by 2300. In this latest version using the C N model 13 Gt C are lost by 2100 increasing to between 20 and 60 Gt C by 2300 depending on scenario. If the drifts were comparable in JULES-C [6], the impact of adding the interactive N cycle is to reduce the loss of permafrost carbon. This is likely related to differences in the soil carbon dynamics in JULES-C compared with the interactive CN configuration, in particular the depth distribution of the carbon. The loss of labelled permafrost carbon caused by the external forcing is the difference between the control-ens and transient-ens and is around 5 Gt C in 2100 and 8 Gt C for RCP2.6/ 44 Gt C for RCP8.5 by 2300.
The permafrost carbon feedback temperature is quantified by comparing equivalent simulations where only the non-permafrost carbon is visible to IMOGEN (pfCloss-feed-ens) with those where all of the soil carbon is visible to IMOGEN (transient-ens). In this paper, the drift in the labelled permafrost carbon is accounted for in the prescribed CO 2 emissions in the pfCloss-feed-ens (see Table 2). Figure A3 shows the additional change in the global mean temperature caused by the loss of labelled permafrost carbon caused by the external forcing is 0.005 to 0.012 °C by 2100 and 0.01–0.04 °C by 2300. As expected, this is lower than the additional increase of 0.01–0.1 °C (5th–95th percentile) by 2100 and 0.02–0.28 °C by 2300 found by [6].
Figure A3. The permafrost carbon feedback temperature for the three different future scenarios for C N s p u n .
Nitrogen 03 00023 g0a3

Appendix A.2. Impact of the Initial Conditions the Permafrost Carbon Feedback Temperature
Here, we assess the permafrost carbon and loss for the simulations highlighted in Table 1. This enables us to evaluate the sensitivity to initial conditions. The three different C N simulations— C N s p u n , C N 1.5 s p u n and C N 2 s p u n have increasing amounts of permafrost carbon in the pre-industrial which fall within the range of the observed permafrost carbon quantified in the Supplement. In C N s p u n , the permafrost carbon reaches its spun up state with a total of 484 Gt C (Figure A4). This is at the low end of the permafrost carbon found from the observation constraint (Supplement Figure). In C N 1.5 s p u n and C N 2 s p u n the labelled permafrost carbon was prescribed at the start of the simulation to be equivalent to 1.5 and 2 times the spun up state of C N s p u n . These both fall within the range suggested by the observational constraint with C N 2 s p u n at around the upper limit (Supplement Figure).
Figure A4. Spatial distribution of soil carbon in kg m 2 for the top 3 m of the soil and the three different versions of JULES C N s p u n , C N 1.5 s p u n , and C N 2 s p u n . Additionally shown are the NCSCD observed soil carbon data for the top 3 m [49].
Nitrogen 03 00023 g0a4
Figure A4 shows the spatial distribution of the total soil carbon in the top 3 m for the three different versions of JULES C N . Additionally shown are the NCSCD soil carbon data for the top 3 m [49]. There are some differences in the spatial distribution with more soil carbon in southern Asia in the model than in the observations and less in southern Canada but the overall amount is very similar.
Figure A5 shows the sensitivity of the loss of permafrost carbon to the initial conditions after the drift in the labelled carbon has been removed. In general, by 2100 less than 10 Gt C of permafrost carbon is lost from any of the simulations. This increases after 2100 and by 2300 to between 10 and 120 Gt C depending on initial condition. Overall, as might be expected, the scenarios with the greater increase in global mean temperature have a greater loss of permafrost carbon. The width of the plumes in Figure A5 give an indication of the impact of the differences in climate sensitivities between the driving models on the permafrost carbon lost. By 2300, this is between 15 and 30 Gt C. However, the difference between the permafrost carbon lost for C N s p u n and C N 2 s p u n is around 40 Gt C. Therefore the uncertainties caused by differences in the initial permafrost carbon content are larger than the uncertainties caused by differences in the climate sensitivities of the driving climate models This suggests that, in order to reduce projection uncertainty, the initial permafrost carbon needs to be suitable defined.
Figure A5. Permafrost carbon lost for the different model initialisation shown in Table 2.
Nitrogen 03 00023 g0a5
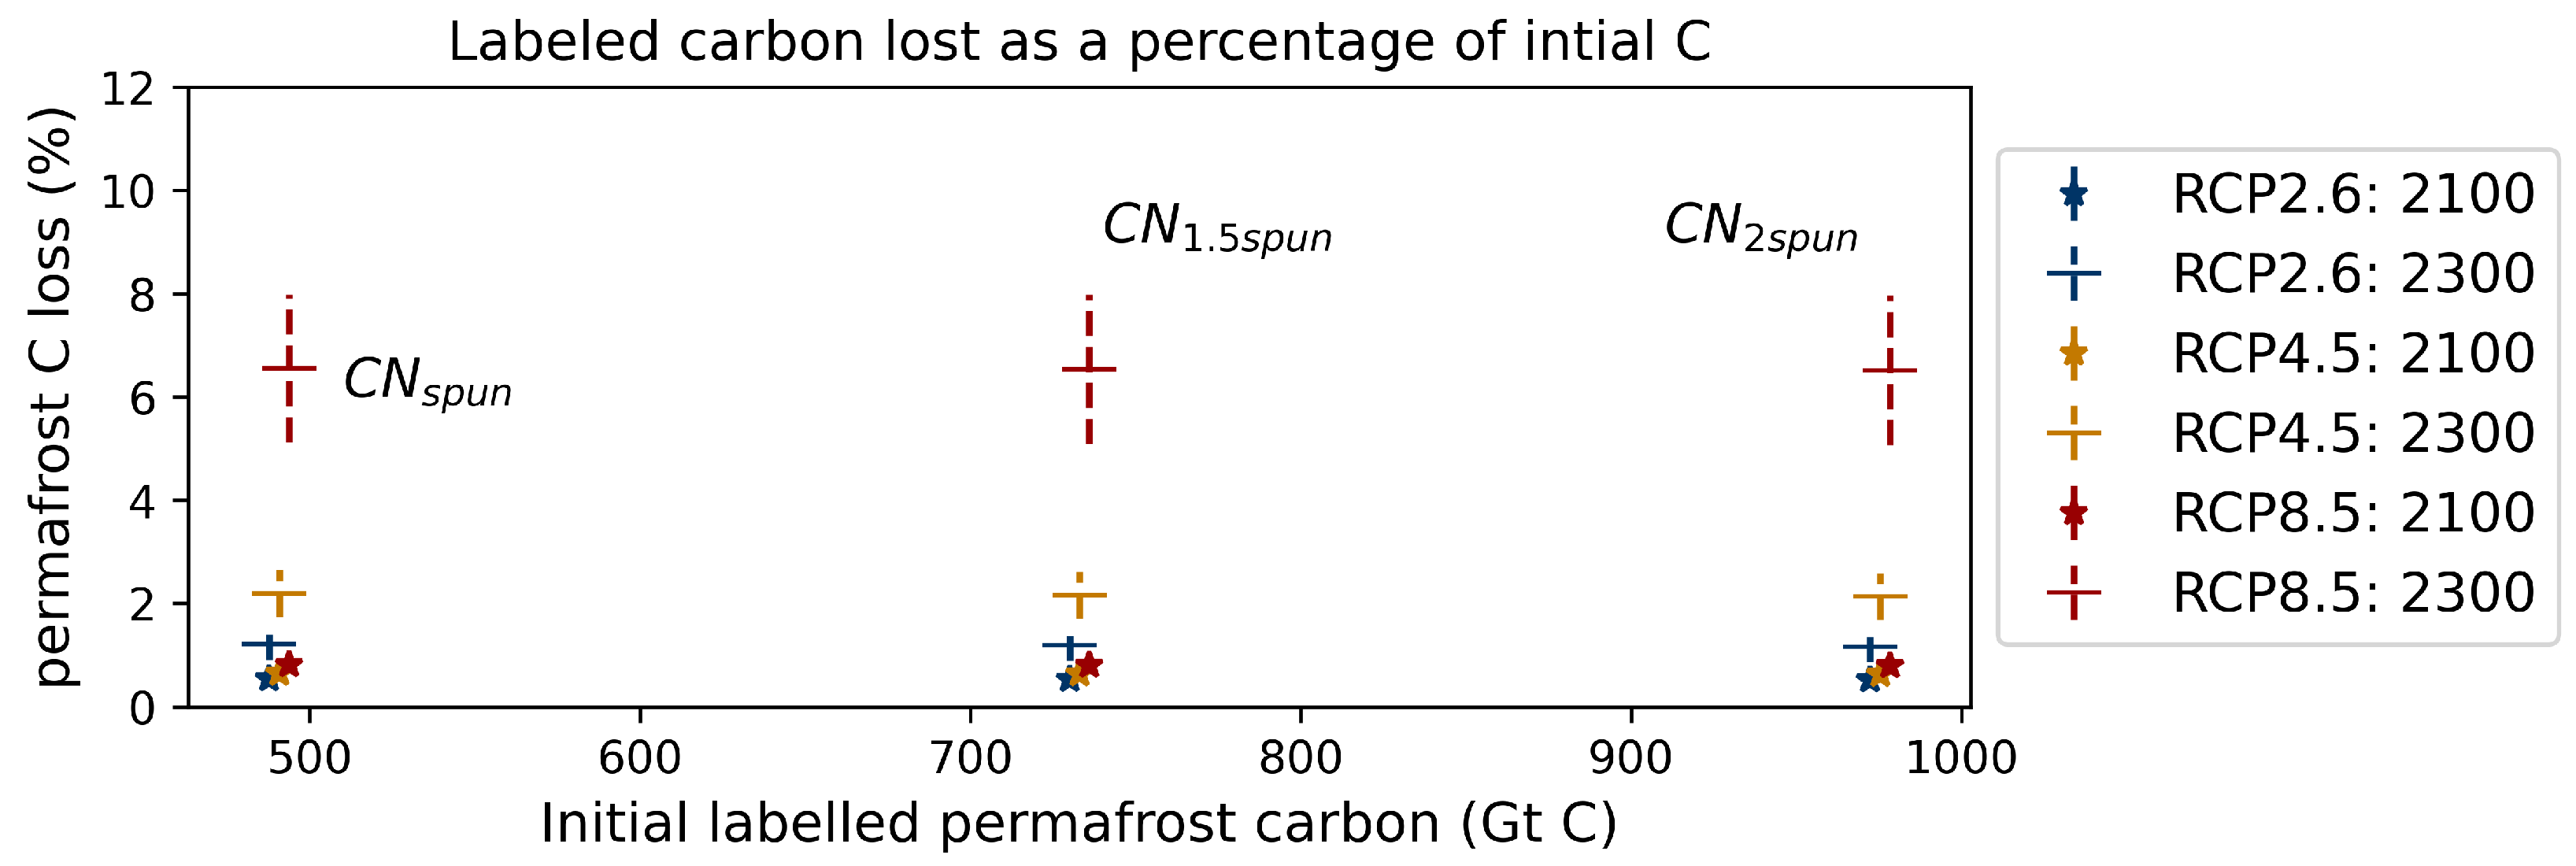
As the initial carbon content increases the total amount of labelled permafrost carbon lost increases. However, Figure A6 shows this loss as a percentage of the initial permafrost carbon is relatively independent of the initial conditions for the CN configurations. For example, C N 2 s p u n loses more than twice as much permafrost carbon than C N s p u n (Figure A5) but C N 2 s p u n also has approximately twice as much permafrost carbon present initially compared with C N s p u n . Therefore, as a percentage of initial permafrost carbon, both C N s p u n and C N 2 s p u n lose approximately the same amount as is shown in (Figure A6). They lose about 1% of the initial permafrost carbon by 2100 and this is relatively independent of scenario. This percentage loss rises by 2300 to 2% for RCP4.5 and 7% for RCP8.5. All three CN versions have plausible amounts of initial carbon and hence plausible losses of labelled permafrost carbon.
Figure A6. Loss of permafrost carbon as a percent of the initial labelled permafrost carbon and plotted as a function of initial permafrost carbon.
Nitrogen 03 00023 g0a6
The positive permafrost carbon feedback onto G S A T is shown in Figure A7 as a function of time. As expected, it is dependent on the initial carbon content and ranges between 0.001 and 0.03 °C by 2100 and 0.002 and 0.09 °C by 2300, with the higher the initial carbon content the higher the feedback.
Figure A7. Permafrost carbon feedback temperature onto G S A T for the different JULES configurations and scenarios.
Nitrogen 03 00023 g0a7
In summary, Figure A5, Figure A6 and Figure A7 demonstrate that it is important to quantify the amount of permafrost carbon present at the start of the simulation in order to reduce uncertainties in the global temperature response to permafrost carbon loss (Figure A7) in a changing climate.

References

  1. Obu, J.; Westermann, S.; Bartsch, A.; Berdnikov, N.; Christiansen, H.H.; Dashtseren, A.; Delaloye, R.; Elberling, B.; Etzelmüller, B.; Kholodov, A.; et al. Northern Hemisphere permafrost map based on TTOP modelling for 2000–2016 at 1 km2 scale. Earth-Sci. Rev. 2019, 193, 299–316. [Google Scholar] [CrossRef]
  2. Zhang, T.; Heginbottom, J.A.; Barry, R.G.; Brown, J. Further statistics on the distribution of permafrost and ground ice in the Northern Hemisphere. Polar Geogr. 2000, 24, 126–131. [Google Scholar] [CrossRef]
  3. Biskaborn, B.; Smith, S.; Noetzli, J.; Matthes, H.; Vieira, G.; Streletskiy, D.; Schoeneich, P.; Romanovsky, V.; Lewkowicz, A.; Abramov, A.; et al. Permafrost is warming at a global scale. Nat. Commun. 2019, 10, 264. [Google Scholar] [CrossRef] [PubMed] [Green Version]
  4. Pörtner, H.O.; Roberts, D.; Masson-Delmotte, V.; Zhai, P.; Tignor, M.; Poloczanska, E.; Mintenbeck, K.; Nicolai, M.; Okem, A.; Petzold, J.; et al. IPCC, 2019: Summary for Policymaker. In Special Report on the Ocean and Cryosphere in a Changing Climate; IPCC: Geneva, Switzerland, 2019. [Google Scholar]
  5. Chadburn, S.E.; Burke, E.; Cox, P.; Friedlingstein, P.; Hugelius, G.; Westermann, S. An observation-based constraint on permafrost loss as a function of global warming. Nat. Clim. Chang. 2017, 7, 340–344. [Google Scholar] [CrossRef]
  6. Burke, E.J.; Ekici, A.; Huang, Y.; Chadburn, S.E.; Huntingford, C.; Ciais, P.; Friedlingstein, P.; Peng, S.; Krinner, G. Quantifying uncertainties of permafrost carbon–climate feedbacks. Biogeosciences 2017, 14, 3051–3066. [Google Scholar] [CrossRef] [Green Version]
  7. Vonk, J.E.; Tank, S.E.; Bowden, W.B.; Laurion, I.; Vincent, W.F.; Alekseychik, P.; Amyot, M.; Billet, M.; Canario, J.; Cory, R.M.; et al. Reviews and syntheses: Effects of permafrost thaw on Arctic aquatic ecosystems. Biogeosciences 2015, 12, 7129–7167. [Google Scholar] [CrossRef] [Green Version]
  8. Wotton, B.; Flannigan, M.; Marshall, G. Potential climate change impacts on fire intensity and key wildfire suppression thresholds in Canada. Environ. Res. Lett. 2017, 12, 095003. [Google Scholar] [CrossRef]
  9. Melvin, A.M.; Larsen, P.; Boehlert, B.; Neumann, J.E.; Chinowsky, P.; Espinet, X.; Martinich, J.; Baumann, M.S.; Rennels, L.; Alexandra, B.; et al. Climate change damages to Alaska public infrastructure and the economics of proactive adaptation. Proc. Natl. Acad. Sci. USA 2017, 114, E122–E131. [Google Scholar] [CrossRef] [Green Version]
  10. Hjort, J.; Karjalainen, O.; Aalto, J.; Westermann, S.; Romanovsky, V.E.; Nelson, F.E.; Etzelmüller, B.; Luoto, M. Degrading permafrost puts Arctic infrastructure at risk by mid-century. Nat. Commun. 2018, 9, 5147. [Google Scholar] [CrossRef]
  11. Larsen, J.; Anisimov, O.; Constable, A.; Hollowed, A.; Maynard, N.; Prestrud, P.; Prowse, T.; Stone, J. Climate Change 2014: Impacts, Adaptation, and Vulnerability Part B: Regional Aspects; Contribution of Working Group II to the Fifth Assessment Report of the Intergovernmental Panel of Climate Change; Barros, V.R., Field, C.B., Dokken, D.J., Mastrandrea, M.D., Mach, K.J., Bilir, T.E., Chatterjee, M., Ebi, K.L., Estrada, Y.O., Genova, R.C., et al., Eds.; Cambridge University Press: Cambridge, UK, 2014. [Google Scholar]
  12. Turetsky, M.R.; Abbott, B.W.; Jones, M.C.; Anthony, K.W.; Olefeldt, D.; Schuur, E.A.; Grosse, G.; Kuhry, P.; Hugelius, G.; Koven, C.; et al. Carbon release through abrupt permafrost thaw. Nat. Geosci. 2020, 13, 138–143. [Google Scholar] [CrossRef]
  13. Schuur, E.A.; McGuire, A.D.; Schädel, C.; Grosse, G.; Harden, J.; Hayes, D.J.; Hugelius, G.; Koven, C.D.; Kuhry, P.; Lawrence, D.M.; et al. Climate change and the permafrost carbon feedback. Nature 2015, 520, 171–179. [Google Scholar] [CrossRef]
  14. Wiltshire, A.J.; Burke, E.J.; Chadburn, S.E.; Jones, C.D.; Cox, P.M.; Davies-Barnard, T.; Friedlingstein, P.; Harper, A.B.; Liddicoat, S.; Sitch, S.; et al. JULES-CN: A coupled terrestrial carbon–nitrogen scheme (JULES vn5.1). Geosci. Model Dev. 2021, 14, 2161–2186. [Google Scholar] [CrossRef]
  15. Chapin, F.S., III; Shaver, G.R.; Giblin, A.E.; Nadelhoffer, K.J.; Laundre, J.A. Responses of arctic tundra to experimental and observed changes in climate. Ecology 1995, 76, 694–711. [Google Scholar] [CrossRef]
  16. Finger, R.A.; Turetsky, M.R.; Kielland, K.; Ruess, R.W.; Mack, M.C.; Euskirchen, E.S. Effects of permafrost thaw on nitrogen availability and plant–soil interactions in a boreal Alaskan lowland. J. Ecol. 2016, 104, 1542–1554. [Google Scholar] [CrossRef]
  17. Keuper, F.; Dorrepaal, E.; van Bodegom, P.M.; van Logtestijn, R.; Venhuizen, G.; van Hal, J.; Aerts, R. Experimentally increased nutrient availability at the permafrost thaw front selectively enhances biomass production of deep-rooting subarctic peatland species. Glob. Chang. Biol. 2017, 23, 4257–4266. [Google Scholar] [CrossRef]
  18. Salmon, V.G.; Soucy, P.; Mauritz, M.; Celis, G.; Natali, S.M.; Mack, M.C.; Schuur, E.A. Nitrogen availability increases in a tundra ecosystem during five years of experimental permafrost thaw. Glob. Chang. Biol. 2016, 22, 1927–1941. [Google Scholar] [CrossRef] [PubMed]
  19. Beermann, F.; Langer, M.; Wetterich, S.; Strauss, J.; Boike, J.; Fiencke, C.; Schirrmeister, L.; Pfeiffer, E.M.; Kutzbach, L. Permafrost Thaw and Liberation of Inorganic Nitrogen in Eastern Siberia. Permafr. Periglac. Process. 2017, 28, 605–618. [Google Scholar] [CrossRef] [Green Version]
  20. Harden, J.W.; Koven, C.D.; Ping, C.L.; Hugelius, G.; McGuire, A.D.; Camill, P.; Jorgenson, T.; Kuhry, P.; Michaelson, G.J.; O’Donnell, J.A.; et al. Field information links permafrost carbon to physical vulnerabilities of thawing. Geophys. Res. Lett. 2012, 39, L15704. [Google Scholar] [CrossRef] [Green Version]
  21. Wang, P.; Limpens, J.; Mommer, L.; van Ruijven, J.; Nauta, A.L.; Berendse, F.; Schaepman-Strub, G.; Blok, D.; Maximov, T.C.; Heijmans, M.M. Above-and below-ground responses of four tundra plant functional types to deep soil heating and surface soil fertilization. J. Ecol. 2017, 105, 947–957. [Google Scholar] [CrossRef] [Green Version]
  22. Hewitt, R.E.; Taylor, D.L.; Genet, H.; McGuire, A.D.; Mack, M.C. Below-ground plant traits influence tundra plant acquisition of newly thawed permafrost nitrogen. J. Ecol. 2019, 107, 950–962. [Google Scholar] [CrossRef]
  23. Koven, C.D.; Lawrence, D.M.; Riley, W.J. Permafrost carbon-climate feedback is sensitive to deep soil carbon decomposability but not deep soil nitrogen dynamics. Proc. Natl. Acad. Sci. USA 2015, 112, 3752–3757. [Google Scholar] [CrossRef] [PubMed] [Green Version]
  24. Keuper, F.; Bodegom, P.M.; Dorrepaal, E.; Weedon, J.T.; Hal, J.; Logtestijn, R.S.; Aerts, R. A frozen feast: Thawing permafrost increases plant-available nitrogen in subarctic peatlands. Glob. Chang. Biol. 2012, 18, 1998–2007. [Google Scholar] [CrossRef]
  25. Sellar, A.A.; Jones, C.G.; Mulcahy, J.; Tang, Y.; Yool, A.; Wiltshire, A.; O’connor, F.M.; Stringer, M.; Hill, R.; Palmieri, J.; et al. UKESM1: Description and evaluation of the UK Earth System Model. J. Adv. Model. Earth Syst. 2019, 11, 4513–4558. [Google Scholar] [CrossRef] [Green Version]
  26. Best, M.; Pryor, M.; Clark, D.; Rooney, G.; Essery, R.; Ménard, C.; Edwards, J.; Hendry, M.; Porson, A.; Gedney, N.; et al. The Joint UK Land Environment Simulator (JULES), model description–Part 1: Energy and water fluxes. Geosci. Model Dev. 2011, 4, 677–699. [Google Scholar] [CrossRef] [Green Version]
  27. Clark, D.; Mercado, L.; Sitch, S.; Jones, C.; Gedney, N.; Best, M.; Pryor, M.; Rooney, G.; Essery, R.; Blyth, E.; et al. The Joint UK Land Environment Simulator (JULES), model description–Part 2: Carbon fluxes and vegetation dynamics. Geosci. Model Dev. 2011, 4, 701–722. [Google Scholar] [CrossRef] [Green Version]
  28. Harper, A.B.; Cox, P.M.; Friedlingstein, P.; Wiltshire, A.J.; Jones, C.D.; Sitch, S.; Mercado, L.M.; Groenendijk, M.; Robertson, E.; Kattge, K.; et al. Improved representation of plant functional types and physiology in the Joint UK Land Environment Simulator (JULES v4.2) using plant trait information. Geosci. Model Dev. 2016, 9, 2415–2440. [Google Scholar] [CrossRef] [Green Version]
  29. Burke, E.J.; Chadburn, S.E.; Ekici, A. A vertical representation of soil carbon in the JULES land surface scheme (vn4.3_permafrost) with a focus on permafrost regions. Geosci. Model Dev. 2017, 10, 959–975. [Google Scholar] [CrossRef] [Green Version]
  30. Burke, E.J.; Chadburn, S.E.; Huntingford, C.; Jones, C.D. CO2 loss by permafrost thawing implies additional emissions reductions to limit warming to 1.5 or 2 °C. Environ. Res. Lett. 2018, 13, 024024. [Google Scholar] [CrossRef]
  31. Huntingford, C.; Booth, B.; Sitch, S.; Gedney, N.; Lowe, J.; Liddicoat, S.; Mercado, L.; Best, M.; Weedon, G.; Fisher, R.; et al. IMOGEN: An intermediate complexity model to evaluate terrestrial impacts of a changing climate. Geosci. Model Dev. 2010, 3, 679–687. [Google Scholar] [CrossRef] [Green Version]
  32. Huntingford, C.; Cox, P. An analogue model to derive additional climate change scenarios from existing GCM simulations. Clim. Dyn. 2000, 16, 575–586. [Google Scholar] [CrossRef]
  33. Comyn-Platt, E.; Hayman, G.; Huntingford, C.; Chadburn, S.E.; Burke, E.J.; Harper, A.B.; Collins, W.J.; Webber, C.P.; Powell, T.; Cox, P.M.; et al. Carbon budgets for 1.5 and 2 °C targets lowered by natural wetland and permafrost feedbacks. Nat. Geosci. 2018, 11, 568–573. [Google Scholar] [CrossRef]
  34. Zelazowski, P.; Huntingford, C.; Mercado, L.M.; Schaller, N. Climate pattern-scaling set for an ensemble of 22 GCMs—Adding uncertainty to the IMOGEN version 2.0 impact system. Geosci. Model Dev. 2018, 11, 541–560. [Google Scholar] [CrossRef] [Green Version]
  35. Weedon, G.; Gomes, S.; Viterbo, P.; Shuttleworth, W.J.; Blyth, E.; Österle, H.; Adam, J.; Bellouin, N.; Boucher, O.; Best, M. Creation of the WATCH forcing data and its use to assess global and regional reference crop evaporation over land during the twentieth century. J. Hydrometeorol. 2011, 12, 823–848. [Google Scholar] [CrossRef] [Green Version]
  36. Moss, R.H.; Edmonds, J.A.; Hibbard, K.A.; Manning, M.R.; Rose, S.K.; Van Vuuren, D.P.; Carter, T.R.; Emori, S.; Kainuma, M.; Kram, T.; et al. The next generation of scenarios for climate change research and assessment. Nature 2010, 463, 747–756. [Google Scholar] [CrossRef]
  37. Meinshausen, M.; Smith, S.J.; Calvin, K.; Daniel, J.S.; Kainuma, M.; Lamarque, J.F.; Matsumoto, K.; Montzka, S.; Raper, S.; Riahi, K.; et al. The RCP greenhouse gas concentrations and their extensions from 1765 to 2300. Clim. Change 2011, 109, 213. [Google Scholar] [CrossRef] [Green Version]
  38. Brown, J.; Hinkel, K.M.; Nelson, F.E. Circumpolar Active Layer Monitoring (CALM) Program Network; National Snow and Ice Data Center: Boulder, CO, USA, 2003. [Google Scholar]
  39. Weedon, G.P.; Balsamo, G.; Bellouin, N.; Gomes, S.; Best, M.J.; Viterbo, P. The WFDEI meteorological forcing data set: WATCH Forcing Data methodology applied to ERA-Interim reanalysis data. Water Resour. Res. 2014, 50, 7505–7514. [Google Scholar] [CrossRef] [Green Version]
  40. Harper, A.B.; Wiltshire, A.J.; Cox, P.M.; Friedlingstein, P.; Jones, C.D.; Mercado, L.M.; Sitch, S.; Williams, K.; Duran-Rojas, C. Vegetation distribution and terrestrial carbon cycle in a carbon-cycle configuration of JULES4.6 with new plant functional types. Geosci. Model Dev. 2018, 11, 2857–2873. [Google Scholar] [CrossRef] [Green Version]
  41. Olson, D.M.; Dinerstein, E.; Wikramanayake, E.D.; Burgess, N.D.; Powell, G.V.; Underwood, E.C.; D’amico, J.A.; Itoua, I.; Strand, H.E.; Morrison, J.C.; et al. Terrestrial Ecoregions of the World: A New Map of Life on Earth A new global map of terrestrial ecoregions provides an innovative tool for conserving biodiversity. BioScience 2001, 51, 933–938. [Google Scholar] [CrossRef]
  42. Burke, E.J.; Zhang, Y.; Krinner, G. Evaluating permafrost physics in the Coupled Model Intercomparison Project 6 (CMIP6) models and their sensitivity to climate change. Cryosphere 2020, 14, 3155–3174. [Google Scholar] [CrossRef]
  43. Urban, M.; Hese, S.; Herold, M.; Pöcking, S.; Schmullius, C. Pan-Arctic Land Cover mapping and fire assessment for the ESA data user element Permafrost. PFG Photogramm. Fernerkund. Geoinf. 2010, 14, 283–293. [Google Scholar] [CrossRef]
  44. Ruesch, A.; Gibb, H. New IPCC Tier-1 Global Biomass Carbon Map For the Year 2000. 2000. Available online: https://data.ess-dive.lbl.gov/view/doi:10.15485/1463800 (accessed on 20 March 2022).
  45. Jung, M.; Reichstein, M.; Margolis, H.A.; Cescatti, A.; Richardson, A.D.; Arain, M.A.; Arneth, A.; Bernhofer, C.; Bonal, D.; Chen, J.; et al. Global patterns of land-atmosphere fluxes of carbon dioxide, latent heat, and sensible heat derived from eddy covariance, satellite, and meteorological observations. J. Geophys. Res. Biogeosci. 2011, 116, G00J07. [Google Scholar] [CrossRef] [Green Version]
  46. Zhao, M.; Running, S.W. Drought-induced reduction in global terrestrial net primary production from 2000 through 2009. Science 2010, 329, 940–943. [Google Scholar] [CrossRef] [PubMed] [Green Version]
  47. Bloom, A.A.; Exbrayat, J.F.; Van Der Velde, I.R.; Feng, L.; Williams, M. The decadal state of the terrestrial carbon cycle: Global retrievals of terrestrial carbon allocation, pools, and residence times. Proc. Natl. Acad. Sci. USA 2016, 113, 1285–1290. [Google Scholar] [CrossRef] [PubMed] [Green Version]
  48. Carvalhais, N.; Forkel, M.; Khomik, M.; Bellarby, J.; Jung, M.; Migliavacca, M.; Mu, M.; Saatchi, S.; Santoro, M.; Thurner, M.; et al. Global covariation of carbon turnover times with climate in terrestrial ecosystems. Nature 2014, 514, 213–217. [Google Scholar] [CrossRef] [PubMed] [Green Version]
  49. Hugelius, G.; Strauss, J.; Zubrzycki, S.; Harden, J.W.; Schuur, E.; Ping, C.L.; Schirrmeister, L.; Grosse, G.; Michaelson, G.J.; Koven, C.D.; et al. Estimated stocks of circumpolar permafrost carbon with quantified uncertainty ranges and identified data gaps. Biogeosciences 2014, 11, 6573–6593. [Google Scholar] [CrossRef] [Green Version]
  50. Schulte-Uebbing, L.; de Vries, W. Global-scale impacts of nitrogen deposition on tree carbon sequestration in tropical, temperate, and boreal forests: A meta-analysis. Glob. Chang. Biol. 2018, 24, e416–e431. [Google Scholar] [CrossRef]
  51. LeBauer, D.S.; Treseder, K.K. Nitrogen limitation of net primary productivity in terrestrial ecosystems is globally distributed. Ecology 2008, 89, 371–379. [Google Scholar] [CrossRef] [Green Version]
  52. Global Soil Data Task Group. Global Gridded Surfaces of Selected Soil Characteristics (IGBP-DIS); ORNL DAAC: Oak Ridge, TN, USA, 2000. [Google Scholar] [CrossRef]
  53. Salmon, V.G.; Schädel, C.; Bracho, R.; Pegoraro, E.; Celis, G.; Mauritz, M.; Mack, M.C.; Schuur, E.A. Adding depth to our understanding of nitrogen dynamics in permafrost soils. J. Geophys. Res. Biogeosci. 2018, 123, 2497–2512. [Google Scholar] [CrossRef]
  54. Wild, B.; Alves, R.J.E.; Bárta, J.; Čapek, P.; Gentsch, N.; Guggenberger, G.; Hugelius, G.; Knoltsch, A.; Kuhry, P.; Lashchinskiy, N.; et al. Amino acid production exceeds plant nitrogen demand in Siberian tundra. Environ. Res. Lett. 2018, 13, 034002. [Google Scholar] [CrossRef]
  55. Pedersen, E.P.; Elberling, B.; Michelsen, A. Foraging deeply: Depth-specific plant nitrogen uptake in response to climate-induced N-release and permafrost thaw in the High Arctic. Glob. Chang. Biol. 2020, 26, 6523–6536. [Google Scholar] [CrossRef]
  56. McGuire, A.D.; Lawrence, D.M.; Koven, C.; Clein, J.S.; Burke, E.; Chen, G.; Jafarov, E.; MacDougall, A.H.; Marchenko, S.; Nicolsky, D.; et al. Dependence of the evolution of carbon dynamics in the northern permafrost region on the trajectory of climate change. Proc. Natl. Acad. Sci. USA 2018, 115, 3882–3887. [Google Scholar] [CrossRef] [PubMed] [Green Version]
  57. Voigt, C.; Marushchak, M.E.; Abbott, B.W.; Biasi, C.; Elberling, B.; Siciliano, S.D.; Sonnentag, O.; Stewart, K.J.; Yang, Y.; Martikainen, P.J. Nitrous oxide emissions from permafrost-affected soils. Nat. Rev. Earth Environ. 2020, 1, 420–434. [Google Scholar] [CrossRef]
  58. Witze, A. The Arctic is burning like never before—And that’s bad news for climate change. Nature 2020, 585, 336–337. [Google Scholar] [CrossRef] [PubMed]
  59. Turetsky, M.R.; Abbott, B.W.; Jones, M.C.; Anthony, K.W.; Olefeldt, D.; Schuur, E.A.; Koven, C.; McGuire, A.D.; Grosse, G.; Kuhry, P.; et al. Permafrost collapse is accelerating carbon release. Nature 2019, 569, 32–34. [Google Scholar] [CrossRef] [Green Version]
  60. Sanderman, J.; Hengl, T.; Fiske, G.J. Soil carbon debt of 12,000 years of human land use. Proc. Natl. Acad. Sci. USA 2017, 114, 9575–9580. [Google Scholar] [CrossRef] [Green Version]
  61. Fan, N.; Koirala, S.; Reichstein, M.; Thurner, M.; Avitabile, V.; Santoro, M.; Ahrens, B.; Weber, U.; Carvalhais, N. Apparent ecosystem carbon turnover time: Uncertainties and robust features. Earth Syst. Sci. Data 2020, 12, 2517–2536. [Google Scholar] [CrossRef]
  62. Batjes, N.H. Harmonized soil property values for broad-scale modelling (WISE30sec) with estimates of global soil carbon stocks. Geoderma 2016, 269, 61–68. [Google Scholar] [CrossRef]
  63. Batjes, N. Harmonized soil profile data for applications at global and continental scales: Updates to the WISE database. Soil Use Manag. 2009, 25, 124–127. [Google Scholar] [CrossRef]
  64. Shangguan, W.; Dai, Y.; Duan, Q.; Liu, B.; Yuan, H. A global soil data set for earth system modeling. J. Adv. Model. Earth Syst. 2014, 6, 249–263. [Google Scholar] [CrossRef]
  65. Parsons, M.; Zhang, T. CAPS: The Circumpolar Active-Layer and Permafrost System, version 2.0; National Snow and Ice Data Center: Boulder, CO, USA, 2003. [Google Scholar]
  66. Biskaborn, B.K.; Lanckman, J.P.; Lantuit, H.; Elger, K.; Dmitry, S.; William, C.; Vladimir, R. The new database of the Global Terrestrial Network for Permafrost (GTN-P). Earth Syst. Sci. Data 2015, 7, 245–259. [Google Scholar] [CrossRef] [Green Version]
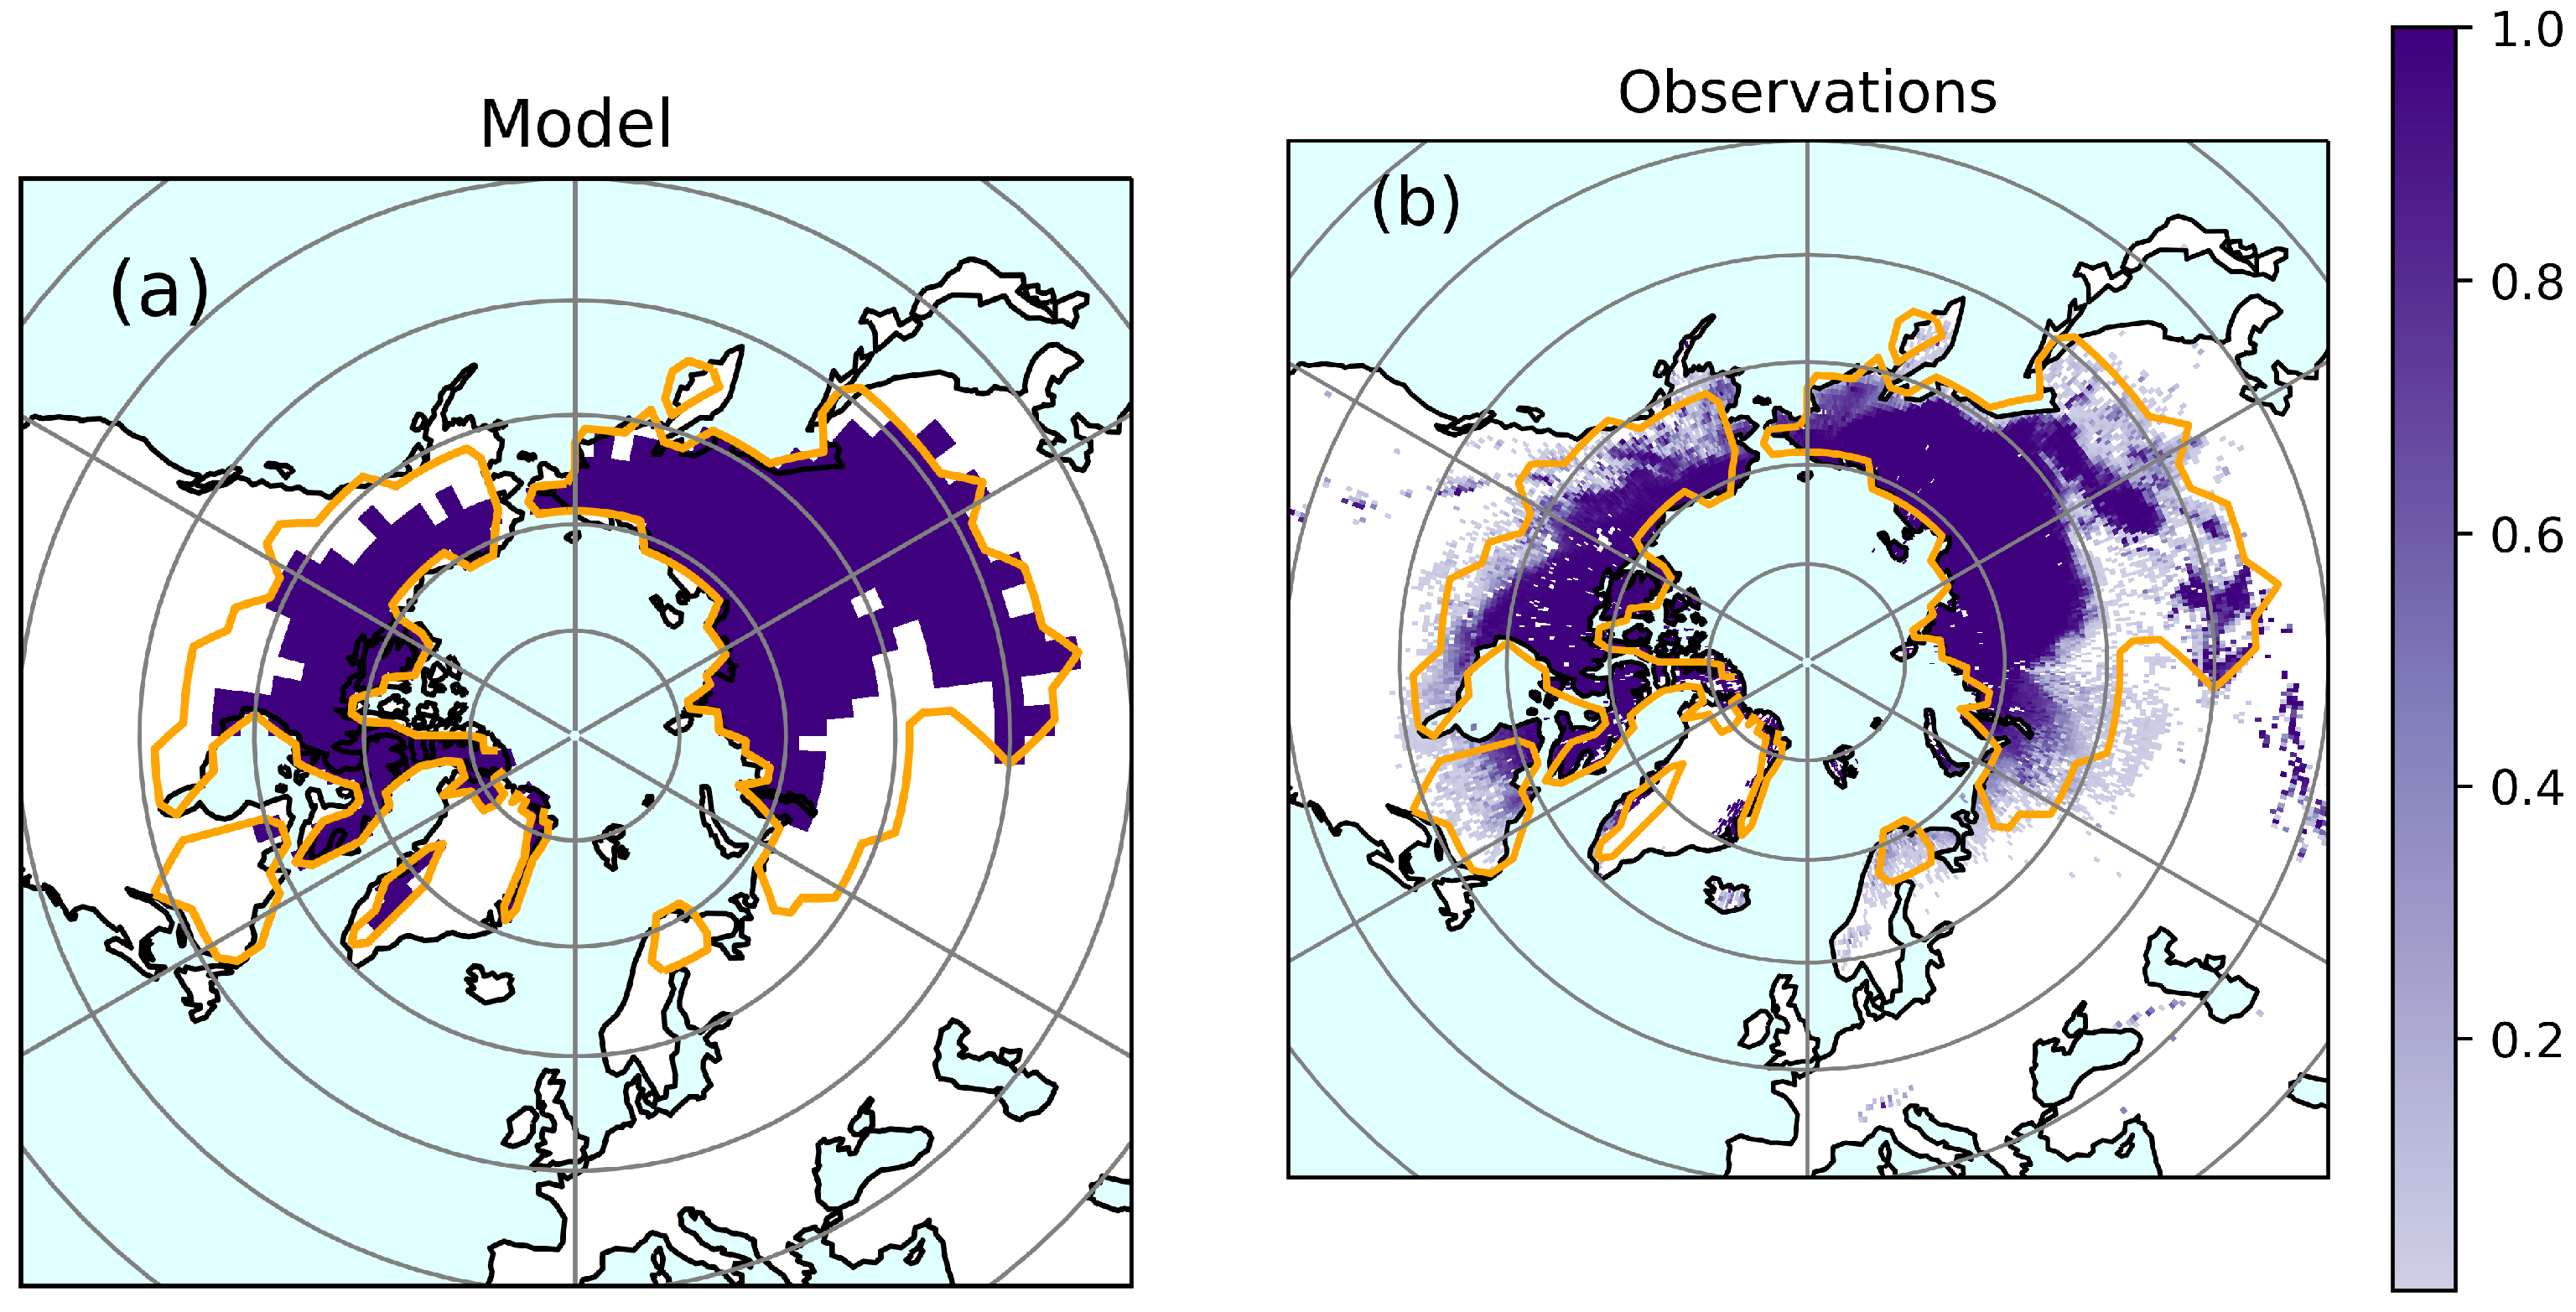
Figure 1. Permafrost extent (a) simulated by C N s p u n model configuration for the period 2000–2009 and (b) from the observations provided by [1]. The model assumes either no permafrost or 100% permafrost, whereas the observations capture subgrid scale heterogeneity and therefore give the proportion of permafrost in each grid cell. Superimposed in yellow on each plot is the zero °C annual mean isotherm from the WFDEI 2000–2009 2 m air temperature [39].
Nitrogen 03 00023 g001
Figure 2. Ensemble mean seasonal cycle of net N mineralisation, N demand and N uptake for the period 2000–2009 and spatially averaged over the simulated permafrost region shown in Figure 1a.
Nitrogen 03 00023 g002
Figure 3. Distribution of the total soil carbon in top 3 m (kg m 2 ) for C N s p u n (a). Shown in (b) is the total soil carbon for the top 3 m of the NCSCD observations [49].
Nitrogen 03 00023 g003
Figure 4. Profile of (a) organic C, (b) organic N and (c) inorganic (mineral) N within the permafrost—for the period 2000–2009 simulated using the C N s p u n configuration and the transient-ens. The observations are derived from a range of available data sets described in more detail in the Supplement.
Nitrogen 03 00023 g004
Figure 5. Profile of (a) total inorganic N and (b) plant available inorganic N along with its change over the future for the permafrost region using the C N s p u n configuration and the transient-ens for a range of GSAT changes in °C.
Nitrogen 03 00023 g005
Figure 6. (a) The time series of the annual and ensemble mean response ratio (the ratio of the potential amount of C that can be allocated to growth and spreading of the vegetation compared with the actual amount achieved in the natural state calculated from the area-total fluxes) for the C N s p u n configuration and transient-ens simulation over the permafrost region. The spatial distribution of the response ratio for (b) the year 2000 and (c) the year 2200. A higher response ratio reflects more N limitation and a lower response ratio means less N limitation. A response ratio of 1 means no N limitation.
Nitrogen 03 00023 g006
Figure 7. Output from the transient-ens simulations for the three RCP scenarios and C N s p u n . The changes in permafrost extent, vegetation carbon, soil carbon and net ecosystem productivity (NEP) are shown.
Nitrogen 03 00023 g007
Figure 8. (a) The time series of the extra vegetation C uptake after fertilisation by mineral N released from thawing permafrost (minNfert). (b) The time series of the global surface air temperature (GSAT) response caused by the mineral nitrogen vegetation fertilisation feedback (minNfert-feed). See Table 2 for more details on how these are estimated.
Nitrogen 03 00023 g008
Figure 9. Permafrost carbon loss (pfCloss) and permafrost carbon feedback (pfCloss-feed) for the different RCP scenarios. Additionally shown, for comparison purposes, are the impacts of increasing the available mineral nitrogen in the soil on the carbon emissions and the global temperature feedback (minNfert).
Nitrogen 03 00023 g009
Table 1. JULES-IMOGEN initialisation of the labelled permafrost carbon that is permanently frozen in the soil at the start of the simulation. Uncertainties in the initial labelled permafrost C pool are also represented, via 1.5× and 2× the spun up labelled permafrost carbon (second and third rows). Here the initial and labelled permafrost C pool excludes any carbon that is above the top of the permafrost table.
Simulation NamePermafrost C Initiation MethodLabelled Permafrost C (Gt C)
C N s p u n Spun up until stable484
C N 1.5 s p u n Prescribed (1.5 × C N s p u n )727
C N 2 s p u n Prescribed (2 × C N s p u n ) 969
Table 2. List of ensemble simulations assessed here—the transient simulation plus diagnostic experiments. These diagnostic experiments are required to quantify the mineral N fertilisation on vegetation C (minNfert) and its climate feedback (minNfert-feed) and the permafrost C loss (PfCloss) and permafrost climate feedback (PfCloss-feed).
Ensemble NameDescription
transient-ens
Main simulations
Transient runs for 3 scenarios (RCP8.5, 4.5 and 2.6) with prescribed CO 2 emissions and N deposition.
Each individual ensemble member is compared with the 4 additional diagnostic experiments described
below to quantify: 
• Vegetation fertilisation by mineral N released by thawing permafrost (minNfert)
• Temperature feedback of vegetation C response onto global climate (minNfert-feed)
• Permafrost carbon loss (pfCloss)
• Permafrost carbon feedback (pfCloss-feed) 
minNfert-ens
Diagnostic experiments
Quantifying the vegetation fertilisation by mineral N released from thawing permafrost. The vegetation
is only allowed access to the mineral N that is in the soil layers that are not permafrost at the start of the
simulation and cannot access mineral N in any subsequently thawed permafrost.
• minNfert is the difference in vegetation C (Gt C) between minNfert-ens and transient-ens.
minNfert-feed-ens
Diagnostic experiments
Quantifying the negative climate feedback onto global surface air temperature (GSAT) from fertilisation
of the vegetation by newly thawed mineral N. The prescribed CO 2 emissions are increased by the
increase in vegetation C diagnosed by the minNfert-ens.
• minNfert-feed is the difference in GSAT (°C) between minNfert-feed-ens and transient-ens.
control-ens
Stationary simulations
Quantifying the non-climate related drift in permafrost C emissions. The climate, prescribed CO 2
emissions and N deposition are set to the values at the start of the simulation (see Section 2.1).
• pfCloss is the difference in permafrost C (Gt C) between transient-ens and control-ens.
pfCloss-feed-ens
Diagnostic experiment
Quantifying the positive permafrost C feedback onto GSAT. The diagnosed permafrost C emissions
from control-ens are included in the CO 2 emissions file and only the non-permafrost C is visible to
IMOGEN.
• pfCloss-feed is the difference in GSAT (°C) between pfCloss-feed-ens and transient-ens.
Table 3. Evaluation metrics for C N s p u n using the transient-ens, based on model simulations of permafrost extent, and vegetation and soil attributes. The carbon and nitrogen cycle metrics (“Area of trees” and below) are derived only for the grid cells where the model simulates permafrost for the period 2000–2009. Soil organic C and inorganic N contents are defined over the top 3 m and the soil organic N is defined for the top 1 m of soil * . GPP stands for gross primary productivity, NPP for net primary productivity and NEE for net ecosystem exchange with positive reflecting net uptake at the land surface. Ecosystem turnover is defined as (vegetation C + soil C)/GPP and soil turnover is defined as soil C/NPP. The response ratio a is the ratio of the potential amount of C that can be allocated to growth and spreading of the vegetation when the nitrogen is freely available compared with the actual amount achieved in the natural state when N may be limited. It is calculated from the multi-annual means of all the grid cells in the respective biomes. The boreal and tundra biomes in the model were characterised by [40] based on the World Wildlife Fund terrestrial ecoregions [41].
MetricModel (2000–2009)ObservedReference for Observed
Permafrost extent (10 6 km 2 )15.214.3
16.2
[1]
[38]
Permafrost extent/
MAAT a r e a < 0   ° C (%)
6762
71
[1]
[38]
Hit rate of model (%)50
54
-[1]
[38]
Active layer thickness (m; −12 °C < MAAT < −10 °C) 0.49 (0.42–0.65)[42]
Active layer thickness (m; −6 °C < MAAT < −4 °C) 1.15 (0.64–1.98)[42]
Area of trees (10 6 km 2 )2.02.9[43]
Area of grasses (10 6 km 2 )7.13.2[43]
Area of shrubs (10 6 km 2 )1.13.8[43]
Area of bare ground (10 6 km 2 )4.44.5[43]
Vegetation C (Gt C)18.015.2[44]
Vegetation N (Gt N)0.1--
GPP (Gt C/year)6.65.2[45]
NPP (Gt C/year)3.63.0[46]
NEE (Gt C/year)0.200.24[47]
Ecosystem residence time (years)15497[48]
Soil residence time (years)279243[47,49]
Response ratio  a boreal1.051.20 (1.08–1.33)[50]
Response ratio  a tundra1.141.35 (1.12-1.64)[51]
Soil C in top 3 m of permafrost region (Gt C)1008767[49]
Soil N in top 1 m of permafrost region (Gt N)664  * 24  * [52]
Inorganic N in top 1 m of permafrost region (Gt N)0.34--
Publisher’s Note: MDPI stays neutral with regard to jurisdictional claims in published maps and institutional affiliations.