Article

Role of Tree Species, the Herb Layer and Watershed Characteristics in Nitrate Assimilation in a Central Appalachian Hardwood Forest

1
Division of Forestry and Natural Resources, West Virginia University, Morgantown, WV 26506, USA
2
Davis College of Agriculture, Natural Resources and Design, West Virginia University, Morgantown, WV 26506, USA
*
Author to whom correspondence should be addressed.
Nitrogen 2022, 3(2), 333-352; https://doi.org/10.3390/nitrogen3020022
Submission received: 13 April 2022 / Revised: 25 May 2022 / Accepted: 27 May 2022 / Published: 3 June 2022

Abstract

:
Forest plants that can assimilate nitrate may act as nitrate sink and, consequently, reduce nitrate losses from watershed ecosystems through leaching. This study, conducted at the Fernow Experimental Forest in West Virginia, quantified via nitrogen reductase activity (NRA) the nitrate assimilation of two tree species, red maple and sugar maple, and surrounding common herb-layer species at the tissue (foliage, roots) and plot level. NRA measurements were conducted in summer and spring. Furthermore, NRA was quantified under varying levels of soil nitrate availability due to fertilization, different stages in secondary forest succession, and watershed aspect. This study confirmed that NRA of mature maples does not respond to varying levels of soil nitrate availability. However, some herb-layer species’ NRA did increase with nitrogen fertilization, and it may be greater in spring than in summer. Combined with biomass, the herb layer’s NRA at the plot-level (NRAA) comprised 9 to 41% of the total (tree + herb-layer) foliar NRAA during the growing season. This demonstrates that the herb layer contributes to nitrate assimilation disproportionally to its small biomass in the forest and may provide a vernal dam to nitrate loss not only by its early presence but also by increased spring NRA relative to summer.

1. Introduction

Forest plants that can take up and assimilate nitrate may act as nitrate sink and, consequently, reduce nitrate losses from watershed ecosystems though leaching [1]. Studies to assess nitrate use often quantify the activity of the initial reducing enzyme in the process of nitrate assimilation, nitrate reductase (NR). However, existing studies are biased towards herbaceous species of economic importance and the Pinaceae [2]. Of the studies conducted on tree species, many were carried out on potted seedlings under greenhouse conditions [3,4,5]. A few studies have quantified nitrate reductase activity (NRA) of mature temperate deciduous trees [6,7,8], and even fewer quantified NRA of herb-layer species in these forests [8]. Findings from these temperate deciduous forests did not fit the generalized pattern of temperate perennial species carrying out most nitrate reduction in the root under low soil nitrate, or that high soil nitrate results in increased shoot NRA [2]. Despite low soil nitrate, five species of northeastern U.S. tree species had greater foliage than root NRA, with foliage NRA unresponsive to N fertilization [7]. Based on the scarce data available, rejecting or confirming the generalized pattern of root vs. shoot NRA or inducing shoot NRA under high external nitrate is currently not possible for northeastern U.S. forests.
Deciduous forests of the northeastern U.S. have been experiencing high levels of N deposition [9], prompting a body of research on N saturation and nitrate leakage, e.g., [10,11,12,13]. In addition, watershed tree species composition correlates with nitrate leaching measured as stream water nitrate [14]. This highlights the need to quantify the use of nitrate by mature forest trees, and to fill the knowledge gap on nitrate use by forest herb-layer species. Nitrate uptake and, thus, retention by herbaceous plants in deciduous forests has been documented after disturbance, when a reduction in post-disturbance nitrate leaching coincides with regrowth of herbaceous vegetation [15], and in the spring when the herb layer temporarily retains N before trees are active (“vernal dam” hypothesis [16,17]). However, herb-layer nitrate use likely plays a significant role in forests without recent disturbance and during the growing season. In a deciduous, oak-dominated forest in southern Sweden, the herb layer contributed 15 to 50% to total (herb-layer + tree) nitrate uptake (per unit area) during the summer months [8].
Furthermore, as trees modify the availability of soil nutrients through the quality of their litter, this may correlate with their level of NRA or impact the NRA of nearby herb-layer plants. For example, in the Catskill Mountains of New York, plots dominated by eastern hemlock (Tsuga canadensis (L.) Carriere) tended to have “slow” N cycling, as exemplified by low foliar and litter N content, high soil C:N ratios, low extractable N pools, and low rates of potential N mineralization and nitrification. In contrast, plots dominated by sugar maple (A. saccharum Marshall) or American beech (Fagus grandifolia Ehrh.) had the highest soil extractable nitrate and ammonium concentrations, high mineralization and nitrification rates, and the lowest C:N ratio [18]. Despite being similar taxa, both red maple (Acer rubrum L.) and sugar maple can be used as predictors of differing N dynamics in their surrounding microenvironments. While soil around sugar maple is often associated with high rates of nitrate production, soil around red maple is associated with low rates of nitrification and nitrate production [14,18,19].
Other factors that are conducive to increased concentrations of soil nitrate are the well-documented recent removal of vegetation [20,21,22,23], but also stand age and disturbance history (e.g., old growth vs. second growth) [24,25], fertilization [26,27], or a northerly (vs. southerly) slope [28,29]. Old-growth northern hardwood forest stands (i.e., virgin forests or forests very lightly logged prior to 1912) in the White Mountain National Forest (Campton, NH, USA) had greater stream water nitrate concentrations and fluxes in comparison to sites that had been disturbed, i.e., logged or logged and burned, 80–110 years prior to the study. In the organic layer, researchers found net nitrification rates to be twice as high at old-growth sites than disturbed sites. Differing nitrification rates were attributed to species composition, soil C:N ratios (low at old growth, high at disturbed sites) [24], and a positive feedback of increased N mineralization leading to increased N availability to which tree species respond with increased foliar N content [25]. Comparing among second-growth hardwood forests at the Fernow Experimental Forest (Parsons, WV, USA), two streams draining watersheds (WS) that revegetated after extensive logging ~110 years ago (WS10 and WS13) have lesser stream water nitrate concentrations (0.8 mg L−1 and 2.0 mg L−1, respectively) than a stream draining a nearby watershed with a stand regrown since clearcutting and subsequent 3-yr herbicide application ~50 years ago (WS7, 4.6 mg L−1) [30,31], indicating that second-growth forests of different stand ages may have different soil nitrate concentrations. Expectedly, forest N fertilization increases soil nitrate concentrations [26,27], as does slope aspect. At the Fernow Experimental Forest, greater rates of net N mineralization and net nitrification were found on northeast compared to southwest aspects [28,29].
We hypothesized that, in northeastern U.S. deciduous forests, an increased availability of soil nitrate is partially mitigated by increased nitrate uptake by plants, and that herb-layer plants play a significant role in nitrate retention in these forests. This study comprehensively investigates the nitrate reductase activity (NRA), an indicator of plant nitrate uptake and N assimilation, of mature red maple, sugar maple, and their surrounding herb-layer species under conditions conducive to variable levels of soil N availability. These conditions comprise fertilization, stand age of second-growth stands, and watershed aspect. Additionally, we compare tissue-level NRA of two maple species that are known to be associated with soils of differing N dynamics. We contrast maple tree NRA with that of herb-layer species, foliar with root NRA, and foliar NRA in spring with foliar NRA in summer. Finally, we quantify the respective role of trees and the herb layer in nitrate assimilation at the plot-level.

2. Materials and Methods

2.1. Study Site

This study took place at the Fernow Experimental Forest (FEF) located in West Virginia, USA (39.06280, −79.67917). In this temperate montane hardwood forest of the central Appalachian Mountains, the growing season extends from May to October [32]. Mean monthly temperature ranges from −2 °C in January to 20.6 °C in July [14,32]. Mean annual precipitation is 1430 mm, with precipitation falling uniformly throughout the year [14,32,33]. The most common soil at the FEF is Calvin channery silt loam (loamy-skeletal, mixed, active, mesic Typic Dystrudept) derived from the Upper Devonian Hampshire formation [32]. Common tree species on more mesic sites include yellow-poplar (Liriodendron tulipifera L.), sugar maple, black cherry (Prunus serotina Ehrh.), white oak (Quercus alba L.), American basswood (Tilia americana L.), and northern red oak (Quercus rubra L.). On more xeric sites, common tree species include white oak, chestnut oak (Quercus montana Willd.), hickory (Carya spp.), red maple, sourwood (Oxydendrum arboreum D.C.), American beech, and sassafras (Sassafras albidum Nees.) [32]. The study area comprised four adjacent watersheds (see Figure 1 of a companion study by Smith and Stephan [34]) that are similar with respect to size (14–34 ha), elevation (695–870 m), slope (mean 21–35%), dominant soil series, geology, climate, and historic disturbance. The forest of these watersheds naturally regenerated after heavy cutting around 1910 [35]. In the 1940s, American chestnut (Castanea dentata (Marsh.) Borkh.) was removed after succumbing to the chestnut blight fungus introduced to the area in 1930 [36]. Watersheds differ in aspect, fertilization treatment, stand age due to more recent disturbance history, and percent basal area of dominant tree species (Table 1). These differences are, at least in part, reflected in stream water nitrate concentrations (Table 1) indicating different soil nitrate availability.

2.2. Field Sample Collection

Sample collection for analysis of NRA was conducted in the same plots as established for a companion study by Smith and Stephan [34]. Briefly, in each of the four watersheds, nine plot pairs were established outside riparian influence and scattered throughout the watersheds. Each plot pair (site) consisted of one plot centered around a sugar maple tree and one around a red maple tree. Within a plot pair, the mean distance between the red maple and sugar maple plot centers was 33 m; the mean minimum distance between two sites (measured between the closest trees) was 113 m. Trees selected as plot center were randomly selected from a larger set of trees identified and mapped [34], had a DBH of at least 10 cm, were vigorous (i.e., without signs of disease or injury), and had either foliage that was in reach by hand or by a pole pruner (maximum length 4.3 m).
Plant tissue for quantifying NRA was collected from plot-center maples and common herb-layer species within a 5-m radius of the plot center. In the summers of 2018 and 2019, foliage was collected during a total of three campaigns (2018: 10 July–8 August; 2019: 26 June–4 July, 30 July–4 August); spring foliage (15 May) and roots (7–8 August) were collected once in 2019 from WS3 and WS7 only.
On all sampling dates, tissue samples were collected in the field between 12 PM and 4 PM to limit diurnal influence on NRA [42]. For analysis of foliar NRA, samples from each plot-center maple comprised six shade leaves in total, three from two different branches. Shade-leaf NRA was not expected to be different from sun-leaf NRA [7]. For ten plot-center trees (five red maples, five sugar maples) that did not have leaves in reach by either hand or pole pruner, foliage was substituted from a small, close-by (on average, 2.4 m distance) conspecific. For herb-layer species, a sample comprised one leaf from each of six different individuals per species.
Common herb-layer species collected for foliar NRA assays were identified from a concurrent study [34,43]. In summer, foliage of herb-layer plants collected from plots were striped maple (Acer pensylvanicum L.) seedlings, hay-scented fern (Dennstaedtia punctilobula (Michx.) T. Moore), intermediate wood fern (Dryopteris intermedia A. Gray), Christmas fern (Polystichum acrostichoides Schott), New York fern (Thelypteris noveboracensis (L.) Nieuwl.), common greenbrier (Smilax rotundifolia L.), star chickweed (Stellaria pubera Michx.), violets (Viola spp.), and Rubus spp. Most Rubus spp. was likely Allegheny blackberry (R. alleghaniensis Porter), but common red raspberry (R. idaeus L.) also occurs at the FEF; below, the common name blackberry is used to refer to Rubus spp. Foliage of thirty-one other herb-layer species was opportunistically collected and NRA was determined (Table S1); these species were not common enough to include in the analyses. The number of samples collected during the summer campaigns required sampling over multiple days. To avoid confounding environmental effects of the sampling day with watershed effects (i.e., fertilization, stand age, aspect) on NRA, sample collection for a given watershed was completed on two, generally non-consecutive days per watershed.
In spring, herb-layer foliage was collected from the spring ephemerals lady’s slipper (Cypripedium acaule Aiton), red trillium (Trillium erectum L.), wood anemone (Anemone spp.), Jack-in-the-pulpit (Arisaema triphyllum Schott), and other species present at that time (star chickweed, violets, blackberry, common greenbrier, fairy bells (Disporum lanuginosum D. Don), and tall white lettuce (Prenanthes altissima L.). Since spring herbs were not abundant, foliage for NRA determination was collected at site level, i.e., without being associated with a particular overstory maple species.
Roots of the plot-center maples were collected from five sites in fertilized WS3 and unfertilized WS7. Herb-layer roots of violets, common greenbrier, blackberry, and Christmas fern were collected from ten locations per watershed. The ten locations comprised the five sites from where tree roots were collected and five additional locations between sites; herb-layer roots for NRA were collected outside of plots to not disturb them and, thus, are not associated with a particular overstory maple. For analysis of root NRA, plot-center maple fine roots were collected from within 15 cm of the base of the tree. Tree fine roots were carefully dug out of the soil after confirming they originated from the plot-center tree by following them back to a larger tree root originating at the base of the tree. Roots of common herb-layer species were collected after excavating between one to five entire plants, as available. Root samples were collected from half of each of the two watersheds in one day, and sampling was completed over two consecutive days.

2.3. Analytical Methods

2.3.1. Nitrate Reductase Activity

Nitrate reductase activity (NRA) was quantified using the in vivo method [44,45], but the method was adapted for processing a large number of samples in the field or remote field laboratory by omitting vacuum infiltration [46]. Foliar tissue samples were prepared for NRA assays by stacking the six leaves collected for each sample. Then, two 1 × 1-cm squares were cut out, avoiding the mid-rib and large secondary veins. These 12 cm2 yielded approximately 10 mg dry weight of foliar tissue. Roots were washed with deionized or distilled water and cut into 1-cm segments before assaying. Root samples for NRA comprised about 15–20 segments with diameters < 2 mm, yielding approximately 100 mg dry weight.
During the sampling campaign of 2018, foliage samples were incubated in the field immediately after collection at a temperature between 25 and 35 °C [45]. This was accomplished by using a small box cooler containing a Hobo temperature logger (Model MX2304 HOBO, Onset Computer Corporation, Bourne, Massachusetts, USA) to record the temperature during incubation. Hand warmers were placed in the cooler if needed to reach the appropriate temperature range. Since enzymatic activity is temperature-sensitive, experiments were conducted in 2019 and 2020 to quantify the relationship between NRA and incubation temperature [47]. Based on simultaneously incubating foliage at ambient (~20 °C) and elevated temperature (23, 25, 27, 29, 31, and 33 °C) of sugar maple, red maple, common greenbrier, blackberry, violets, and hay-scented fern, a mean NRA correction of 0.0086 for each 1°C was applied to normalize all 2018 NRA values to 27 °C.
In 2019, intact leaves and root samples were transported to the nearby field laboratory after concluding sampling for the day. Spring samples were kept on ice, and summer samples were stored in sealable plastic bags with a DI-water-moistened towel between collection and arrival at the lab. There, leaves were refrigerated for approximately 5–8 h and roots for 4–16 h before tissue pieces were incubated at a constant temperature of 27 °C using a small, portable incubator. Preliminary analyses had shown that NRA for blackberry, violets, and common greenbrier was not different between freshly-processed samples and samples that had been refrigerated for 18 h before processing [47]. The methodology for NRA sampling was changed from 2018 to allow for multiple sampling campaigns in the 2019 field season, as samples could be more efficiently batch-processed in the laboratory than in the field. Sample incubation times and reagents are as described in [46]. NRA is expressed in μmol of nitrite produced per gram dry weight of tissue per hour of incubation time.

2.3.2. NRAA Calculation

To evaluate the relative importance of trees and herb-layer plants in nitrate uptake on a per-area basis (referred to as NRAA, in µmol m−2 h−1), NRA values (µmol g−1 h−1) were multiplied with tissue biomass per area of ground (g m−2) obtained for tree foliage, herb-layer foliage (including stems), and roots.
Biomass of plot-center maple foliage was obtained by multiplying specific leaf weight (SLW, g m−2) with leaf area index (LAI, m2 m−2). Specific leaf weight data was provided by Dr. Peterjohn at West Virginia University (Table S2). To calculate LAI, PAR (photosynthetically active radiation) was measured using an Accupar LP-80 PAR/LAI ceptometer (Meter Group, Inc., Pullman, WA, USA) on 6 August 2019 for WS3, WS7, and plots 5–9 of WS13, and on 5 September 2019 for WS10 and the remaining plots of WS13. Four PAR measurements were taken around each plot-center tree, standing 1.75 m from the tree and facing it from each cardinal direction; these values were averaged. One additional ceptometer was left out in an open area at the Timber and Watershed Laboratory in Parsons, WV, to concurrently measure PAR above the canopy. LAI was calculated based on the ratio of PAR above and below the canopy and adjusted for variables that relate to the canopy architecture and position of the sun (i.e., zenith angle, a fractional beam measurement value, and a leaf area distribution parameter) [48] (Figure S1).
Aboveground herb-layer biomass at the study sites was derived from a companion study that measured plant cover in 1-m2 plots in summer 2018 and spring 2019 [34]. Plant cover measurements were repeated in early summer 2019. Thus, cover data were available for most of the NRA sampling campaigns. Plant cover was converted to aboveground biomass based on biomass-cover relationships established for this site [43]. Relationships were species-specific for any species that had n >10 data points for creating the cover-biomass relationship; otherwise, biomass-cover relationships were developed for functional groups (i.e., woody seedlings, herb, fern, shrub/vine). Depending on the abundance of data points, NRA values (with which biomass-per-area was multiplied) were either species-specific and specific to each watershed/overstory maple/campaign, species-specific with a single value being used across watersheds/overstory maples/campaigns, or based on a functional group NRA value derived from averaging all species in that group (e.g., herbs). Based on these inputs (details in Supplementary Methods), NRAA of the herb-layer was estimated for each watershed and sampling campaign.
Root biomass of the herb-layer species and maple trees was collected directly by destructive sampling. Root biomass was collected at about the same time as when root tissue was collected for NRA determination. Root biomass was collected from within the top 10 cm of the soil from within two 30-cm circular templates located on opposite sides of, and 3 m from, the plot-center tree. Root biomass was collected from each plot in fertilized WS3 and unfertilized WS7. Roots were separated into tree roots and herb-layer roots, and roots from both templates per plot were combined. Tree roots found within the template were traced back to larger roots before collection to verify they originated from a tree (presumably the plot-center maple), and herb-layer roots were cut from excavated herb-layer plants. Fine roots were separated from larger roots, cleaned with deionized water, dried for 24 h at 70° C, and weighed (Figure S3). Overstory maple root NRAA values were calculated for each of the two overstory maple species (species-level biomass per area × species-level NRA) for each plot pair. Since maple root NRA was measured in every other plot pair (but biomass in every plot pair), NRA data gaps were filled with the mean of the measured root NRA for the respective maple species. Herb-layer root NRAA values were calculated for each herb-layer species (species-level biomass per area × functional group NRA) in the plot, and then summed across all species per plot. Since herb-layer root biomass was measured as a plot total, it was first converted into root biomass per species assuming that individual species’ root biomass related to total root biomass the same way as the available relationship of a species’ foliage cover to total cover. Herb-layer root NRA was available for three functional groups: shrub/vine (based on data from blackberry and common greenbrier), fern (based on Christmas fern), and herb (based on data from violets). Root NRA was not directly measured for herb-layer woody seedlings; for this group, the mean NRA of the overstory maple roots was used to estimate herb-layer woody seedling NRAA.

2.4. Statistical Analysis

Watersheds were paired for separate analyses of variance (ANOVA) to better detect the influences of N fertilization, stand age or disturbance history, and watershed aspect on the NRA of the overstory maples and common species of the herb-layer community. In addition, the analysis of watershed pairs reduced the potential for confounding the intended watershed-level treatment (e.g., fertilization) with other differences between watersheds (e.g., stand age). These watershed pairs are (i) fertilized WS3 and unfertilized WS7 with a similar stand age of approximately 50 years, (ii) WS7 and WS13 with differing stand ages (50 vs. 110 years, respectively) and cutting history, and (iii) WS13 and WS10 with a similar stand age of approximately 110 years but differing in watershed aspect (N vs. S, respectively). NRA of (1) summer overstory maple foliage, (2) summer herb-layer foliage, (3) maple and herb-layer roots, (4) maple and herb-layer roots vs. foliage, and (5) herb-layer foliage in spring vs. summer, respectively, was the dependent variable in individual ANOVAs (Table S3). Prior to analyses, dependent variables in planned statistical groups were tested for normal distribution (Shapiro–Wilk W test) and presence of outliers. Data were transformed if necessary and outliers removed. Watershed-level treatment (factor Watershed, WS), plot-center maple species (factor Maple, M), and their interaction (WS × M) were fixed effects in most of the models (Table S3). With respect to watershed-level treatment, the study is pseudo-replicated [49] due to the difficulty of replication at the watershed scale. Therefore, care should be taken when extrapolating the findings of this study to other areas. Temporal variation, applicable to data collected in multiple sampling campaigns, was assessed by including the time of the sampling campaign in the models as fixed effect (factor Time); these analyses were conducted with repeated measures ANOVA with uneven spacing. Following ANOVA, NRA means of groups were compared using Tukey–Kramer multiple comparisons with adjustment, when pertinent to hypotheses. Data were analyzed using SAS and JMP (SAS®, Version 9.4, JMP®, Version Pro 14, SAS Institute Inc, Cary, NC, USA). Significance criterion alpha for all tests was 0.05. Results presented in figures and tables present untransformed data.

3. Results

3.1. Summer Overstory Maple Foliage NRA

Foliar NRA differed significantly between sugar and red maple (factor Maple p = 0.001). The mean sugar maple foliar NRA was approximately 60% greater than mean red maple foliar NRA (Figure 1A). There was no effect of watershed-level treatment (factor Watershed) on maple NRA, i.e., there was no fertilization effect (fertilized WS3 vs. unfertilized WS7), stand age effect (50-y-old stand in WS7 vs. 110-y-old stand in WS13), or effect of watershed aspect (south-facing WS10 vs. north-facing WS13). Maple foliar NRA did not differ between the three summer sampling campaigns (Time p > 0.05). None of the interactions between Watershed or Time with Maple were statistically significant. The results were the same when analyzing overstory NRA by watershed pairs (i.e., three separate ANOVAs) and when all watersheds were simultaneously included in the analysis.
Figure 1. Mean summer foliar NRA in each watershed (WS) of overstory maple species (A) and common herb-layer species grouped by growth form: ferns (B), shrubs/vines and woody seedlings (C), and herbaceous species (D). Note the different scales of the y-axes; the horizontal reference lines show the mean of all red maple and sugar maple foliar NRA (0.06 µmol NO2 g−1 hr−1). Error bars represent 1 SE based on n = 27 for overstory maples (nine trees per maple species in each of three sampling campaigns in each watershed) and maximum n = 18 for herb-layer species (i.e., the number of plots per watershed; NRA was averaged across the three summer sampling campaigns prior to calculating the watershed mean). Data were collected at the Fernow Experimental Forest, West Virginia, USA, from fertilized WS3 (50-yr-old stand), and unfertilized WS7 (50-yr-old stand), WS13 (110-yr-old stand, north-facing), and WS10 (110-yr-old stand, south-facing).
Nitrogen 03 00022 g001

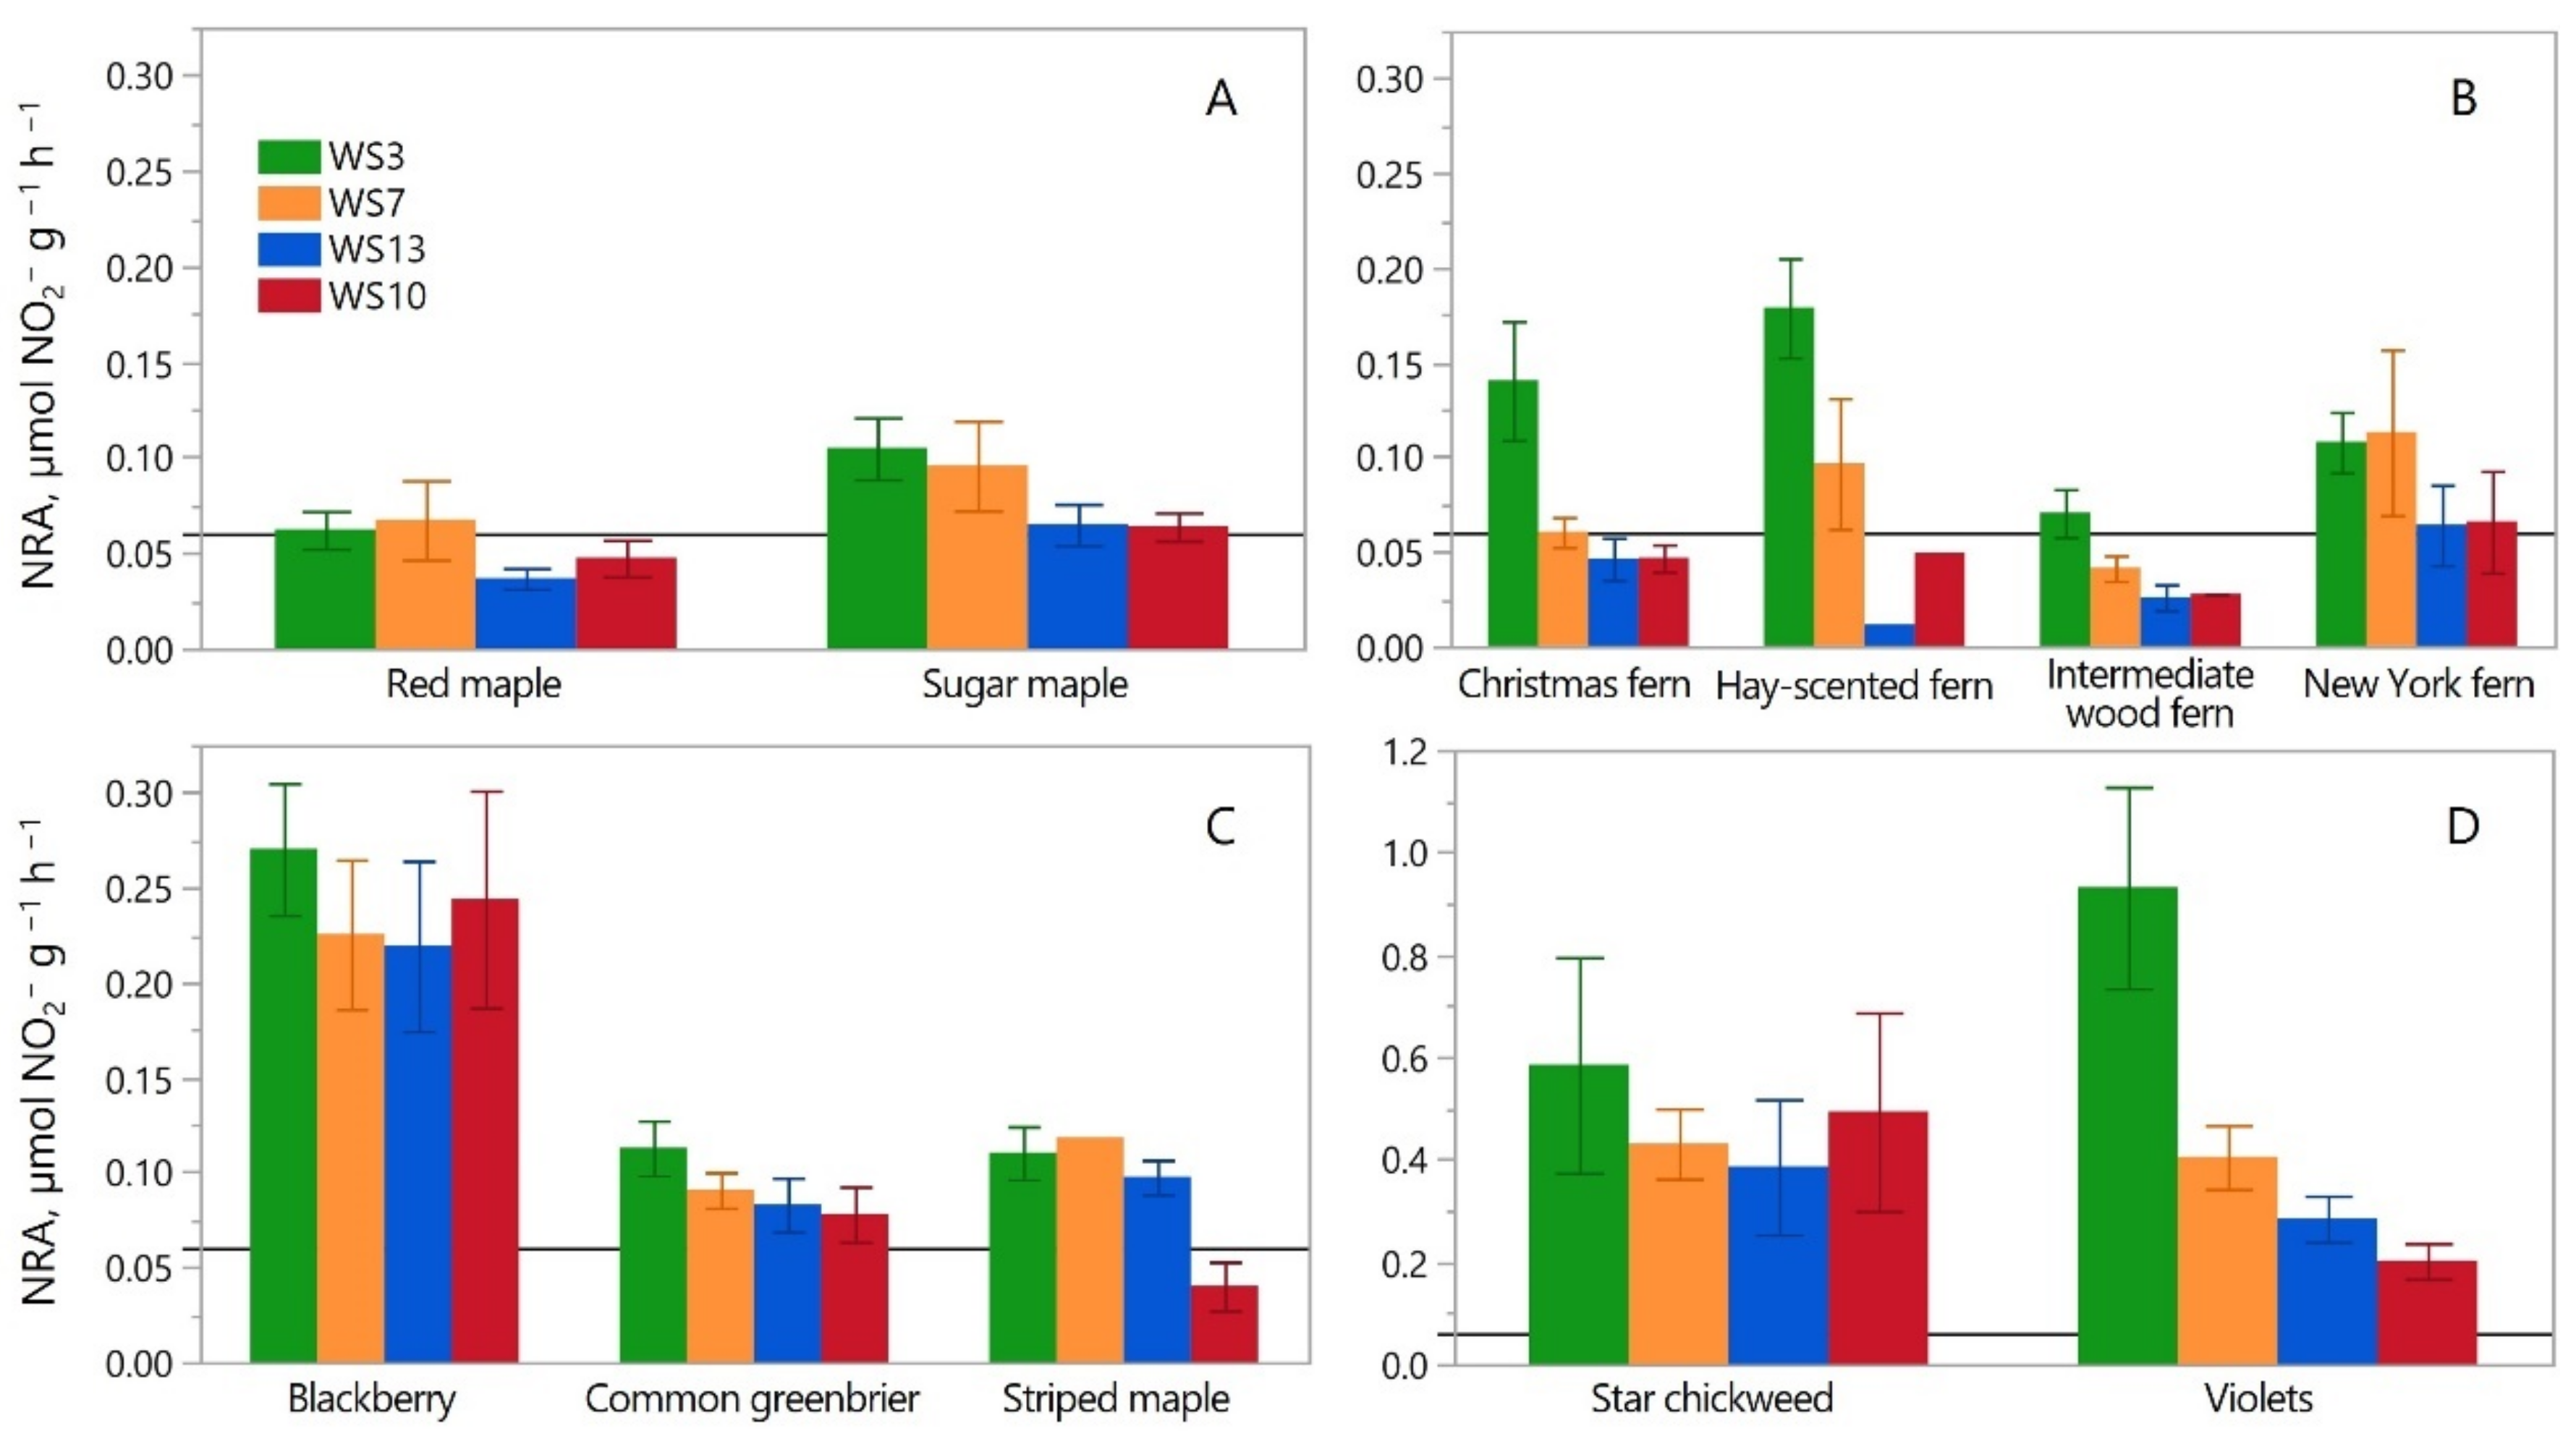
3.2. Summer Herb-Layer Foliage NRA

In the herb-layer, differences in summer foliar NRA between watersheds were detected for individual species but not for the herb layer as a whole. Violets, Christmas fern, and intermediate wood fern had greater NRA in the fertilized watershed (WS3) than in the other watersheds (p < 0.0001, p = 0.001, and p = 0.055, respectively) (Table 2, Figure 1A,C). Violet foliar NRA was, on average, 3.3 times greater (range 2.2–4.4), Christmas fern foliar NRA was 2.8 times greater (range 2.3–3.2), and intermediate wood fern NRA was 2.1 times greater (range 1.6–2.5) in fertilized WS3 than in all other watersheds (Figure 1A,C). A Watershed effect (p = 0.05) was also present for striped maple. This effect was not a fertilization effect, but striped maple foliar NRA in south-facing WS10 was approximately half that of the other three watersheds. This may be a spurious result due to low sample size for this species relative to the others which showed differences between watersheds (Table 2). No overstory maple effect was detected on herb-layer species NRA; only star chickweed had somewhat (38%) greater NRA under red maple than under sugar maple (M p = 0.07, Table 2). Blackberry, star chickweed, and violets had greater foliar NRA than the overstory maple species, but the fern species, common greenbrier, and striped maple did not (Figure 1).

3.3. Root NRA in Fertilized WS3 and Unfertilized WS7

When comparing overstory and herb-layer root NRA of fertilized WS3 and unfertilized WS7, across all six species, root NRA was greater in fertilized WS3 than in unfertilized WS7 (WS p = 0.0003), root NRA varied between species (Species p < 0.001), and the fertilization effect varied by species (interaction p = 0.004). For example, violet and Christmas fern root NRA was more than twice as high in fertilized WS3 than in unfertilized WS7, but root NRA of the other four species was on average 41% greater in WS3 than WS7 (Table 3). Comparing individual species between fertilized WS3 and unfertilized WS7, only blackberry and violets had statistically significantly greater root NRA in WS3 than WS7 (Table 3).

3.4. Root vs. Foliage NRA in Fertilized WS3 and Unfertilized WS7

Foliar NRA was significantly greater than root NRA for sugar maple and for each of the four herb-layer species. In contrast, red maple root NRA was about twice as high as its foliar NRA (Table 3, Organ p-Values in Table 4). Roots and foliage both responded to fertilization in ferns and violets (WS p-Values in Table 4). The fertilization response was stronger in violet roots than foliage (Table 3, interaction p-value in Table 4).

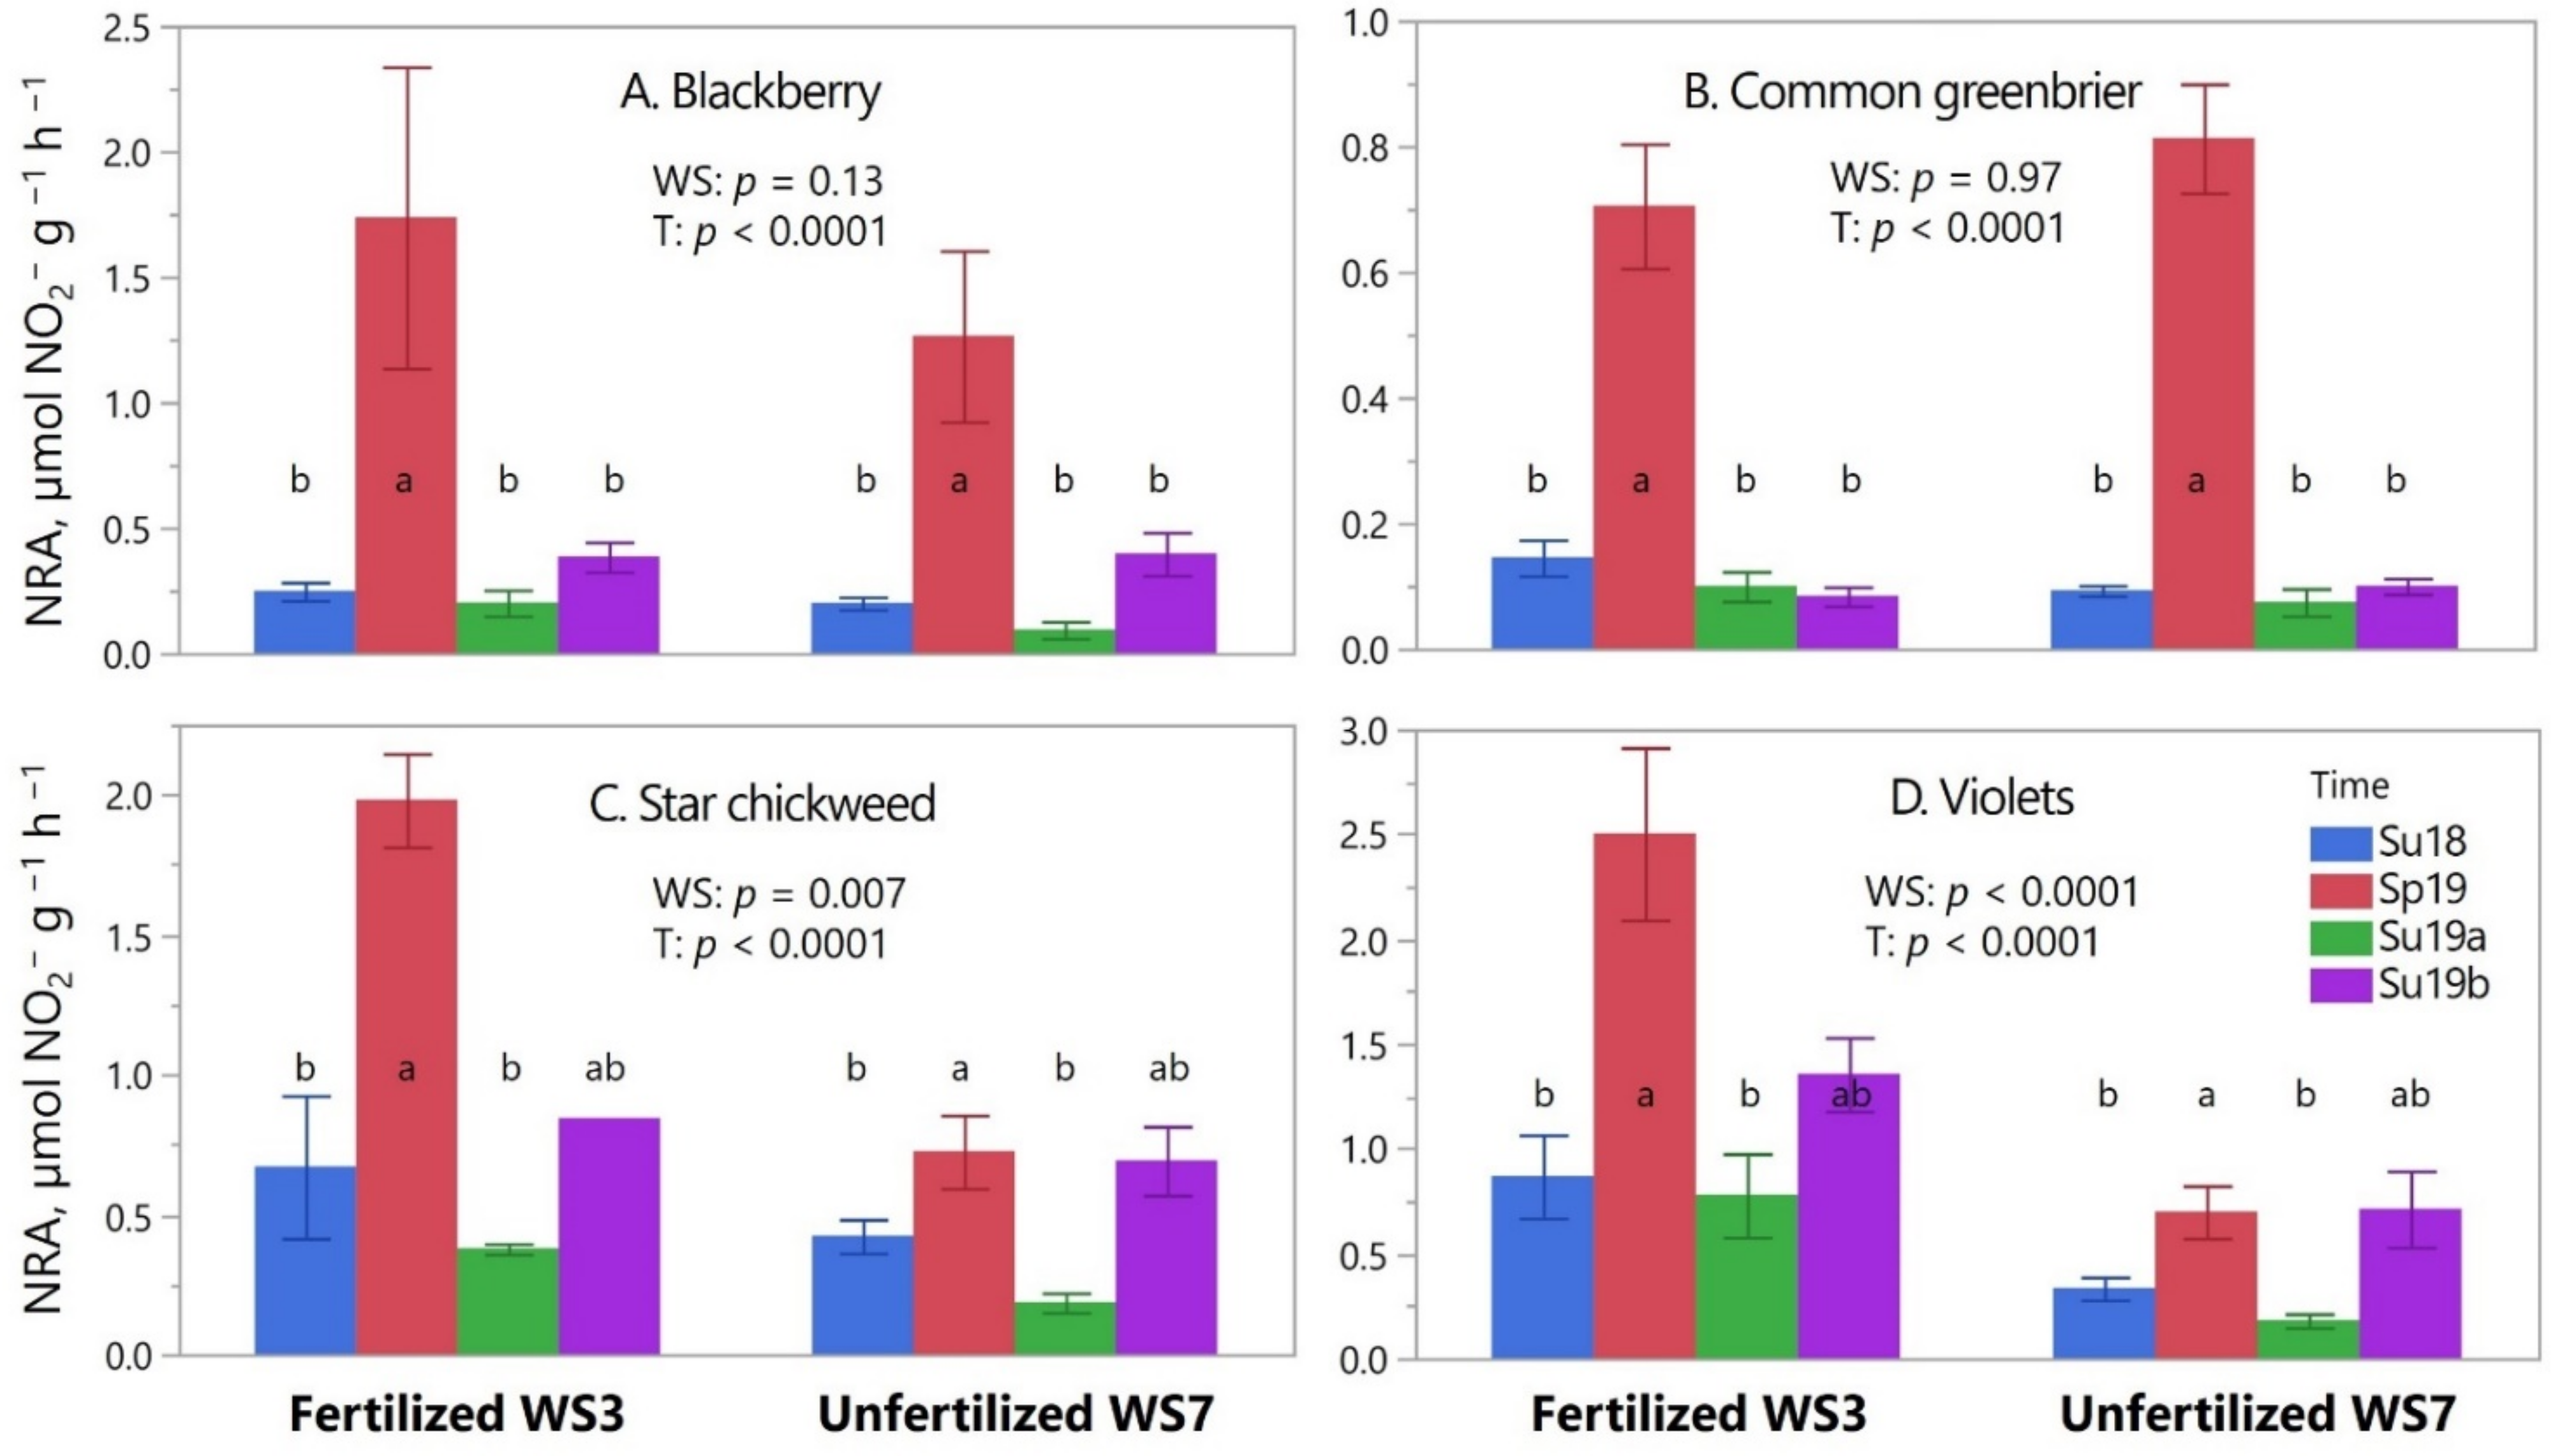
3.5. Spring vs. Summer Foliage NRA of the Herb-Layer in Fertilized WS3 and Unfertilized WS7

In the analysis of herb-layer foliar NRA across the four different sampling campaigns (one spring campaign, three summer campaigns) in fertilized WS3 and unfertilized WS7, time of sampling campaign was a significant predictor for foliage NRA in each of the four species that were available for sampling in both spring and summer (i.e., p < 0.001 for blackberry, common greenbrier, star chickweed, and violets, respectively) (Figure 2). Spring foliar NRA was significantly greater than all summer NRA campaigns for blackberry and common greenbrier (Figure 2A,B); foliar NRA of star chickweed and violets was greater in spring than in two of the summer campaigns, but spring foliar NRA of these species did not differ from the NRA in midsummer 2019 (Figure 2C,D).
The factor Watershed (i.e., fertilization effect) was only significant for star chickweed (p = 0.007) and violets (p < 0.001). The fertilization effect on violet foliar NRA (but not star chickweed NRA) had also been detected when analyzing the summer sampling campaigns (described above).
Spring ephemeral species were scarce in fertilized WS3. In unfertilized WS7, their NRA was similar to the spring NRA of blackberry, common greenbrier, star chickweed, and violets (Figure S2 in Supplementary Materials).

3.6. NRAA–Plot-Level Assimilation of Nitrate

3.6.1. Summer Overstory Foliage NRAA

Taking foliar biomass into account and expressing NRA per area of ground (i.e., NRAA), sugar maple foliar NRAA was greater than red maple foliar NRAA by, on average, 79% (Table 5) when analyzed across all four watersheds (M p = 0.02). This followed the pattern observed in NRA (Figure 1A). There was a statistical trend for differences in NRAA between different watersheds (WS p = 0.08). When conducting the same analysis per watershed pair, Watershed-level treatment had an effect in the comparison of fertilized WS3 and unfertilized WS7 (WS p = 0.04) but not in the other watershed pairs representing different stand ages or watershed aspect. Maple foliar NRAA in fertilized WS3 was greater than in unfertilized WS7 by 87% (Table 5, bottom row). This mirrored observed differences in LAI between these watersheds (Figure S1). Due to the lesser statistical power relative to including all four watersheds, the greater sugar than red maple NRAA was only present as a trend in watershed pair WS3 vs. WS7 (p = 0.07).

3.6.2. Summer Herb-Layer NRAA

In the analysis of herb-layer summer foliage NRAA in a model containing all four watersheds, the species of maple growing in the plot center (i.e., factor Maple) did not influence foliar NRAA of the surrounding herb-layer (p > 0.05). When analyzing watershed pairs and comparing fertilized WS3 and unfertilized WS7, there was a statistically significant Watershed × Maple interaction. That is, in WS3, herb-layer NRAA was greater by 63% under sugar maple than red maple, but it was the opposite in WS7: the herb-layer NRAA was greater by 34% under red maple than sugar maple (Table 5). This resembled the differences in herb-layer cover (and, thus, biomass) documented under red and sugar maple in these watersheds [34], although cover differences were not statistically significant. In the comparison of WS7 (with 50-year-old stand) and WS13 (with 110-year-old stand), herb-layer foliar NRAA in WS7 was greater than in WS13 by 78% (Table 5, bottom row; WS p = 0.001), regardless of overstory tree species; this was driven by statistically significant herb-layer biomass differences between these watersheds [34]. In the comparison of south-facing WS10 and north-facing WS13, the herb-layer NRAA of these 110-year-old stands were very similar (Table 5), driven by similar NRA (Figure 1B–D) and cover [34].
After adding maple and herb-layer foliar NRAA over a given plot to obtain total foliar NRAA, herb-layer NRAA comprised 9 to 41% (mean 16%) of the total foliar NRAA (Table 5). Contributions varied by watershed and sampling campaign due to variability of measured NRA and biomass estimates.

3.6.3. Root vs. Foliar NRAA in WS3 and WS7

Comparing foliage NRAA with fine root NRAA in the top 10 cm of soil, foliage NRAA was significantly greater than root NRAA for both overstory maples and the herb-layer (p < 0.001). Foliage NRAA was 2–3 times greater than fine root NRAA for red maple, but 8–26 times greater for sugar maple (Table 6). This resulted from the high fine root biomass of red maples relative to sugar maple (Figure S3) and high root NRA of red maple compared to red maple foliage NRA (Table 3). This contrast was especially pronounced in fertilized WS3, in which sugar maple root biomass was low (Figure S3). In the herb-layer, foliage NRAA was 3–4 times greater than fine root NRAA of the top 10 cm of soil (Table 6).
When root and foliar NRAA was summed, overstory maples had greater combined NRAA than the herb layer (p < 0.001), fertilized WS3 had a greater combined NRAA than unfertilized WS7 (WS p = 0.02) by 25%, and NRAA in sugar maple plots was greater than in red maple plots (M p = 0.02) (Table 6).

3.6.4. Spring vs. Summer Foliage NRAA of the Herb-Layer in WS3 and WS7

When comparing herb-layer foliage NRAA across four sampling campaigns (one spring campaign and three summer campaigns) in fertilized WS3 and unfertilized WS7, only Time (i.e., sampling campaign) was a statistically significant factor (p < 0.0001). That is, herb-layer NRAA was greatest in the spring (7.9 µmol NO2 m−2 h−1) relative to NRAA of the summer campaigns (3.2–6.5 µmol NO2 m2 h−1). A fertilization effect on NRAA was not detected (i.e., WS p > 0.05) even though some species had greater NRA in response to fertilization (Figure 2).

4. Discussion

4.1. Nitrate Assimilation and Soil Nitrogen Availability

Several studies indicate that temperate tree species may not respond to N fertilization via an increase in their rate of nitrate assimilation [1,7]. This study corroborates these findings. It is therefore not surprising that presumably more subtle differences in soil N availability due to stand age (or disturbance history) or watershed aspect in this study are not translating into discernable differences in NRA of mature red and sugar maples. The findings of this study, however, contradict those of Liu, et al. [50] showing that certain species of small tropical trees (e.g., Henry chestnut—Castanea henryi (Skan) Rehder & E.H.Wilson) responded to additional N fertilization with greater foliar NRA. While temperate trees may not respond to high N availability at the tissue level (i.e., NRA expressed per gram of tissue), they may respond at the plot level, as a fertilization effect on maple foliar NRAA (i.e., NRA expressed per area of ground) was indeed detected in this study (Table 5). This was driven by the greater mean LAI measured under maples in fertilized WS3 than under maples in unfertilized WS7 (Figure S1). Greater LAI in fertilized WS3 relative to the other, unfertilized watersheds is likely a direct consequence of N fertilization [51,52]. We recognize that LAI values measured in this study do not only stem from the target maples but may also include leaf area of often taller, neighboring trees. Interestingly, a different study in the same watersheds [53] did not detect differences in foliar biomass using litter traps or when using allometric equations based on DBH (diameter at breast height) of trees growing in permanent growth plots. The latter is likely due to trees growing taller without an increase in diameter in the fertilized watershed relative to the trees in the unfertilized watershed [54]. It is possible that fertilization increased SLA with a much larger impact on LAI than biomass [51], explaining similar litter mass in litter traps in both watersheds despite greater LAI in WS3 than WS7. We point out that we measured LAI directly under the red and sugar maple plot-center trees. Therefore, our LAI measurements may not apply to the watersheds as a whole; this may be especially the case in fertilized WS3 and unfertilized WS7 because maples make up a relatively small proportion of the total basal area (Table 1). Regardless, tissue-level rates of nitrate assimilation are only part of the story in forest tree nitrate uptake, and tissue biomass should be taken into account when assessing the potential for nitrate retention by plants.
In contrast to the overstory maples, some herb-layer species appeared to respond to fertilization with greater foliar NRA (Christmas fern, and intermediate wood fern), root NRA (blackberry), or both foliar and root NRA (violets). Similar results were reported from seedlings of some northeastern U.S. tree species; some had elevated NRA with fertilization while other species did not [3]. This points to genetic determination whether a species can respond with greater foliar NRA to greater soil N availability, as opposed to environmental induction across species [7]. As there was no replication at the watershed level, the presumed fertilization effect could also be due to some other, unmeasured feature of WS3 resulting in greater foliar NRA in some herb-layer species than in the unfertilized WS7. However, a similar but replicated, plot-level, long-term experiment at the FEF with the same fertilizer, dosage, and application schedule showed that soil water nitrate levels with fertilization were one to two orders of magnitude higher than without fertilization [55]. Therefore, it is plausible that fertilization of WS3 caused the observed differences in NRA to WS7.
As with overstory maples, we did not detect a response of any herb-layer species’ NRA to more subtle differences in soil N due to stand age or watershed aspect. As tree species have been shown to alter their environment via litter-soil feedback [14,18,19,56,57], we had expected the differences in local N cycling imparted by the species of overstory maple to be reflected in the NRA of the herb-layer underneath. Yet, a response in herb-layer foliar NRA to the species of overstory tree, which, to our knowledge, has not previously been assessed, could not be detected.
In a previous study at the FEF, herb-layer biomass increased due to fertilization in WS3 in comparison to a neighboring unfertilized watershed with stand age of ~110 years (WS4) during the first 25 years of fertilization [40]. However, when comparing fertilized WS3 and unfertilized WS7 in this current study, no consistent biomass response of the herb layer to fertilization was observed [34]. This may be due to the greater LAI (i.e., lesser light levels above the herb layer) in fertilized WS3 than unfertilized WS7, preventing the herb layer to respond to the increased availability of soil N. This is supported by Walter, et al. [58], reporting that the effect of N fertilization on Rubus spp. cover was dependent on the level of canopy openness in the fertilized WS3; in regions of high canopy openness, Rubus spp. cover was 84% greater in the fertilized WS3 compared to unfertilized WS7, but cover was equal in both watersheds under low canopy openness.
Interestingly, in the comparison of the younger stand of WS7 and the older stand of WS13, a significantly greater herb-layer biomass in the younger relative to the older stand [34] translated into a significantly greater herb-layer NRAA (Table 5). The greater availability of nutrients and increased spatial heterogeneity in younger stands can drive the difference in biomass between a younger stand and an older stand [59]. In this study, the watershed with the 50-yr-old stand (WS7) exports more nitrate (Table 1) and calcium [31] to streamwater than the watershed with the 110-yr-old stand (WS13). This suggests that these nutrients are more available to plants, and, at about equal LAI in these stands (Figure S1), conducive to greater herb-layer biomass in the younger stand of WS7 than in the older stand of WS13. In the comparison of the north-facing WS13 with south-facing WS10, similar herb-layer biomass [34] can explain the similar values of foliar NRAA (Table 5).

4.2. Red Maple vs. Sugar Maple

This study revealed that foliar NRA was greater in sugar maple than red maple, whereas belowground, patterns of fine-root NRA of these species were the opposite. As vicinity to sugar and red maple correlates with respective greater and lesser soil N availability at the FEF [14] and respective lesser and greater soil C:N ratio [60], the observed NRA patterns within each species fit the generalized pattern of a greater ratio of root:shoot NRA in soils of lesser N availability with an increase of the importance of shoot NRA in soils of greater N availability [2,61]. This supports a genetically-driven, species-specific response to the soil N environment the species is able to create, rather than a response to external soil nitrate. However, more data of foliar and root NRA from additional species, in combination with the species’ impact on soil N availability, is needed to support this hypothesis. A general low affinity of maple species for nitrate, as deduced from high nitrate leaching [19] or low uptake [62], is also evidenced by low NRA values of both foliage and roots of the red and sugar maples of this study. Still, due to the high leaf and root biomass of trees, nitrate uptake of these trees is likely ecologically relevant.

4.3. Root Nitrate Assimilation

Several studies have compared root and foliar NRA, under varying nitrate availability, in tree seedlings under greenhouse conditions [3,63,64]. However, there may be substantial differences in NRA between seedlings and mature trees [7]. While data on mature forest plant root NRA are sparse [65], this study complements Tang, et al. [7] who documented that foliar NRA was greater than fine root NRA for five eastern U.S. tree species; the foliar:root NRA ratio ranged from 4.6 for red maple to 27 for oak. In oak forests of southern Sweden, the ratio of mean tree foliage to root NRA ranged from approximately 2 to 10 depending on site and season, but data were not given for individual species. In this current study, foliar:root NRA was 1.6 for sugar maple, but 0.5 for red maple, indicating that more data is necessary to reliably characterize the role of fine roots in whole plant nitrate assimilation. In addition, while fine roots may be assumed to have the highest NRA compared to other root sizes, larger tree roots also reduce nitrate [66]. In the current study, nitrate assimilation per area (NRAA) of fine roots alone was 44% that of foliage in red maple (Table 6). Root contribution to nitrate assimilation might therefore surpass that of foliage if larger roots were included. The same might be true for forest herb-layer species for which fine root NRAA was about 30% of foliar NRAA.

4.4. Tree vs. Herb-Layer NRA

Few studies have documented forest herb-layer NRA (e.g., [8,46,67]) and—to our knowledge—none in eastern U.S. forests. Foliar NRA values measured in this study ranged from 0.003 to >2 µmol g−1 h−1 (Table S1) with some common species such as blackberry, star chickweed, and violets having foliar NRA exceeding that of overstory maples. It should be noted that omitting vacuum filtration reduced the values obtained for NRA. A preliminary study in the spring of 2019 compared NRA values of greenhouse-grown Idaho hybrid poplars (Populus x idahoensis) after vacuum infiltration (by purging the sample three times with argon) with NRA values of reference samples without vacuum infiltration. The use of vacuum infiltration yielded NRA values that were, on average, 3.4 times greater than without it [47]. While this may preclude direct comparison of NRA values of this study with other studies, differences detected between statistical groups in this study are valid.
Despite the small biomass footprint of the herb layer, it contributed between 9 and 41% of total (herb-layer + tree) foliar NRAA (Table 5) and between 21 and 29% of total (foliar + fine-root) NRAA (Table 6) during the growing season. Similar contributions of the herb-layer to nitrate uptake, and, thus, retention, were documented in Swedish oak forests [8], highlighting the outsize importance of the herb-layer in forest nutrient dynamics besides their recognized role as vernal dam. While spring ephemerals are generally considered as comprising the dam due to their high rates of nutrient uptake supporting high rates of photosynthesis and respiration [16,17,68], this study found that non-ephemeral herbs in the spring may also contribute to nitrate retention through greater NRA in spring than summer. However, further study is needed to support the influence of spring environmental conditions on NRA of non-ephemerals, since this study lacked temporal replication for spring NRA. If spring NRA was indeed higher than summer NRA in some species, one possible explanation may be the high-light environment in spring. High light levels at relatively low temperatures may result in photorespiration which has been shown to influence NRA [69,70]. Photorespiration stimulates the export of malate from chloroplasts to the cytoplasm, where it generates the NADH that powers the first step of nitrate assimilation: the reduction of nitrate to nitrite [70].
Tree seedlings are also part of the herb-layer. It has been suggested that NRA may be greater in seedlings than in mature trees [7,61]. This study measured NRA of five red maple seedlings (Table S1), and their mean NRA was similar to that of the mature overstory trees in our study. With the exception of cucumber tree (Magnolia acuminata L.), seedlings of other tree species had NRA values similar to those of red maple seedlings (Table S1), but we did not measure the NRA of mature trees of these species for comparison. A comprehensive inventory of foliage and root NRA of a wide range of eastern deciduous forest species in different phases of ontogeny is needed to answer this question. Currently, one such inventory exists in Japan [71].

5. Conclusions

This project provided new, quantitative knowledge about the contribution of trees and the herbaceous layer to nitrate uptake in a temperate mixed hardwood forest. While the trees and most herb-layer plants studied seem to prefer ammonium, all species had measurable NRA. When quantifying nitrate use at the plot level, the herb layer contributed to nitrate assimilation disproportionally to its biomass in the forest and may provide a vernal dam to nitrate loss not only by its early presence but potentially also by increased spring NRA relative to summer. As plot-level nitrate uptake in response to environmental conditions was primarily determined by biomass of assimilating tissues, and not by shifting NRA values, the impact on tree and herb-layer biomass should be considered in the planning of management activities or in the wake of, or recovery from, other perturbations [72]. Violets, ubiquitous in eastern deciduous forests, appear to have potential as indicator of changing soil nitrate concentrations through their responsiveness of root and foliar NRA. A comprehensive inventory of root and shoot NRA for North American tree and herb-layer species, using consistent methodology, would further the understanding of nitrate retention and leakage from watershed ecosystems.

Supplementary Materials

The following supporting information can be downloaded at: https://www.mdpi.com/article/10.3390/nitrogen3020022/s1, Table S1: Nitrate Reductase Activity (NRA, µmol g−1 h−1) of less common herb-layer species at the Fernow Experimental Forest, West Virginia, USA; Table S2: Specific Leaf Area (SLA, m2 g−1) of red and sugar maple collected at the Fernow Experimental Forest in August 1998; Table S3: Summary of statistical analyses of the effect of watershed-level treatment (WS) and species of overstory maple (M), their interaction, and other factors on NRA of plant tissues collected at the Fernow Experimental Forest, Parsons, WV, USA; Figure S1: LAI under plot-center red maple and sugar maples in each watershed at the Fernow Experimental Forest, West Virginia; Supplementary Methods: NRAA calculations for herb-layer shoots; Table S4: Biomass equation type and NRA value type used for calculating herb-layer foliar NRA per area (NRAA) for each of the three summer campaigns; Table S5: Biomass equation type and NRA value type used for calculating herb-layer foliar NRA per area (NRAA) for the spring campaign (May 2019) in fertilized watershed (WS) 3 and unfertilized WS7; Figure S2: Foliar NRA of spring herb species in fertilized watershed (WS) 3 and unfertilized WS7 in the 2019 spring campaign; Figure S3: Biomass of herb-layer fine roots under red maple and under sugar maple trees, and fine root biomass of the maples themselves.

Author Contributions

Conceptualization, K.S.; methodology, K.S. and S.E.E.; formal analysis, S.E.E. and I.H.; investigation, S.E.E.; writing—original draft preparation, S.E.E. and K.S.; writing—review and editing, K.S.; visualization, S.E.E.; supervision, K.S.; project administration, K.S.; funding acquisition, K.S. All authors have read and agreed to the published version of the manuscript.

Funding

This work was supported by the USDA National Institute of Food and Agriculture, McIntire Stennis Cooperative Research Program (accession # 1011951), the West Virginia Agricultural and Forestry Experiment Station, and a joint venture agreement (# 17-JV-11242303-065) with the USDA Forest Service, Northern Research Station.

Institutional Review Board Statement

Not applicable.

Informed Consent Statement

Not applicable.

Data Availability Statement

The data presented in this study are available on request from the corresponding author and at http://www.as.wvu.edu/fernow/data.html (accessed on 31 May 2022).

Acknowledgments

The authors thank Lacey Smith for field assistance, the personnel at the Fernow Experimental Forest for maintaining and making available this outstanding research site, and Mary Beth Adams and William Peterjohn for sharing their vast knowledge about the Fernow and the subject matter. Data on study site basal area information of watersheds 10 and 13 were provided by William T. Peterjohn; these data were gathered as part of the Fernow Experimental Forest NSF LTRB awards DEB-0417678 and DEB-1019522. The authors also thank the anonymous reviewers for improving the manuscript.

Conflicts of Interest

The authors do not have any conflict of interest pertaining to this study.

References

  1. Rothstein, D.E.; Zak, D.R.; Pregitzer, K.S. Nitrate deposition in northern hardwood forests and the nitrogen metabolism of Acer saccharum. Oecologia 1996, 108, 338–344. [Google Scholar] [CrossRef] [PubMed]
  2. Andrews, M.; Raven, J.A. Root or shoot nitrate assimilation in terrestrial vascular plants—Does it matter? Plant Soil 2022, 1–32. [Google Scholar] [CrossRef]
  3. Downs, M.R.; Nadelhoffer, K.J.; Melillo, J.M.; Aber, J.D. Foliar and fine root nitrate reductase activity in seedlings of four forest tree species in relation to nitrogen availability. Trees 1993, 7, 233–236. [Google Scholar] [CrossRef]
  4. Stadler, J.; Gebauer, G.; Schulze, E.-D. The influence of ammonium on nitrate uptake and assimilation in 2-year-old ash and oak trees—A tracer-study with 15N. Isot. Environ. Health Stud. 1993, 29, 85–92. [Google Scholar] [CrossRef]
  5. Truax, B.; Gagnon, D.; Chevrier, N. Nitrate reductase activity in relation to growth and soil N forms in red oak and red ash planted in three different environments: Forest, clear-cut and field. For. Ecol. Manag. 1994, 64, 71–82. [Google Scholar] [CrossRef]
  6. Eddy, W.C.; Zak, D.R.; Holmes, W.E.; Pregitzer, K.S. Chronic atmospheric NO3 deposition does not induce NO3 use by Acer saccharum Marsh. Ecosystems 2008, 11, 469–477. [Google Scholar] [CrossRef]
  7. Tang, M.H.; Porder, S.; Lovett, G.M. Species differences in nitrate reductase activity are unaffected by nitrogen enrichment in northeastern US forests. For. Ecol. Manag. 2012, 275, 52–59. [Google Scholar] [CrossRef]
  8. Olsson, M.; Falkengren-Grerup, U. Partitioning of nitrate uptake between trees and understory in oak forests. For. Ecol. Manag. 2003, 179, 311–320. [Google Scholar] [CrossRef]
  9. National Atmospheric Deposition Program (NRSP-3). Available online: https://nadp.slh.wisc.edu/maps-data/animated-maps/ (accessed on 1 April 2021).
  10. Aber, J.D.; Nadelhoffer, K.J.; Steudler, P.; Melillo, J.M. Nitrogen saturation in northern forest ecosystems. BioScience 1989, 39, 378–386. [Google Scholar] [CrossRef]
  11. Galloway, J.N.; Townsend, A.R.; Erisman, J.W.; Bekunda, M.; Cai, Z.; Freney, J.R.; Martinelli, L.A.; Seitzinger, S.P.; Sutton, M.A. Transformation of the nitrogen cycle: Recent trends, questions, and potential solutions. Science 2008, 320, 889–892. [Google Scholar] [CrossRef] [Green Version]
  12. Bobbink, R.; Hicks, K.; Galloway, J.; Spranger, T.; Alkemade, R.; Ashmore, M.; Bustamante, M.; Cinderby, S.; Davidson, E.; Dentener, F. Global assessment of nitrogen deposition effects on terrestrial plant diversity: A synthesis. Ecol. Appl. 2010, 20, 30–59. [Google Scholar] [CrossRef] [PubMed] [Green Version]
  13. Rose, L.A.; Elliott, E.M.; Adams, M.B. Triple nitrate isotopes indicate differing nitrate source contributions to streams across a nitrogen saturation gradient. Ecosystems 2015, 18, 1209–1223. [Google Scholar] [CrossRef]
  14. Peterjohn, W.T.; Harlacher, M.A.; Christ, M.J.; Adams, M.B. Testing associations between tree species and nitrate availability: Do consistent patterns exist across spatial scales? For. Ecol. Manag. 2015, 358, 335–343. [Google Scholar] [CrossRef]
  15. Hornbeck, J.W.; Martin, C.W.; Pierce, R.S.; Bormann, F.H.; Likens, G.E.; Eaton, J.S. The Northern Hardwood Forest Ecosystem: Ten Years of Recovery from Clearcutting; US Department of Agriculture, Forest Service, Northeastern Forest Experiment Station: Broomall, PA, USA, 1987. [Google Scholar]
  16. Muller, R.N.; Bormann, F.H. Role of Erythronium americanum Ker. in energy flow and nutrient dynamics of a northern hardwood forest ecosystem. Science 1976, 193, 1126–1128. [Google Scholar] [CrossRef]
  17. Blank, J.L.; Olson, R.K.; Vitousek, P.M. Nutrient uptake by a diverse spring ephemeral community. Oecologia 1980, 47, 96–98. [Google Scholar] [CrossRef]
  18. Lovett, G.M.; Weathers, K.C.; Arthur, M.A.; Schultz, J.C. Nitrogen cycling in a northern hardwood forest: Do species matter? Biogeochemistry 2004, 67, 289–308. [Google Scholar] [CrossRef]
  19. Lovett, G.M.; Mitchell, M.J. Sugar maple and nitrogen cycling in the forests of eastern North America. Front. Ecol. Environ. 2004, 2, 81–88. [Google Scholar] [CrossRef]
  20. Likens, G.E.; Bormann, F.H.; Johnson, N.M.; Fisher, D.; Pierce, R.S. Effects of forest cutting and herbicide treatment on nutrient budgets in the Hubbard Brook watershed-ecosystem. Ecol. Monogr. 1970, 40, 23–47. [Google Scholar] [CrossRef]
  21. Likens, G.; Bormann, F. Effects of forest clearing on the northern hardwood forest ecosystem and its biogeochemistry. In Proceedings of the first International Congress of Ecology, Hague, The Netherlands, 8–14 September 1974; pp. 330–335. [Google Scholar]
  22. Martin, C.W.; Pierce, R.S.; Likens, G.E.; Bormann, F.H. Clearcutting Affects Stream Chemistry in the White Mountains of New Hampshire; US Department of Agriculture, Forest Service, Northeastern Research Station: Broomall, PA, USA, 1986; Volume 579. [Google Scholar]
  23. Pardo, L.; Driscoll, C.; Likens, G. Patterns of nitrate loss from a chronosequence of clear-cut watersheds. Water Air Soil Pollut. 1995, 85, 1659–1664. [Google Scholar] [CrossRef]
  24. Goodale, C.L.; Aber, J.D. The long-term effects of land-use history on nitrogen cycling in northern hardwood forests. Ecol. Appl. 2001, 11, 253–267. [Google Scholar] [CrossRef]
  25. Ollinger, S.V.; Smith, M.-L.; Martin, M.E.; Hallett, R.A.; Goodale, C.L.; Aber, J.D. Regional variation in foliar chemistry and N cycling among forests of diverse history and composition. Ecology 2002, 83, 339–355. [Google Scholar]
  26. Binkley, D.; Burnham, H.; Allen, H.L. Water quality impacts of forest fertilization with nitrogen and phosphorus. For. Ecol. Manag. 1999, 121, 191–213. [Google Scholar] [CrossRef]
  27. Gundersen, P.; Schmidt, I.K.; Raulund-Rasmussen, K. Leaching of nitrate from temperate forests—Effects of air pollution and forest management. Environ. Rev. 2006, 14, 1–57. [Google Scholar] [CrossRef]
  28. Gilliam, F.S.; Galloway, J.E.; Sarmiento, J.S. Variation with slope aspect in effects of temperature on nitrogen mineralization and nitrification in mineral soil of mixed hardwood forests. Can. J. For. Res. 2015, 45, 958–962. [Google Scholar] [CrossRef]
  29. Gilliam, F. Spatial variability in soil microbial communities in a nitrogen-saturated hardwood forest watershed. Soil Sci. Soc. America J. 2010, 75, 280–286. [Google Scholar] [CrossRef] [Green Version]
  30. Fernow Experimental Forest Watersheds LTREB Tree Survey Data. Available online: http://www.as.wvu.edu/fernow/index.html (accessed on 10 June 2021).
  31. Edwards, P.J.; Wood, F. Fernow Experimental Forest Stream Chemistry; U.S. Department of Agriculture, Forest Service, Northern Research Station: Newtown Square, PA, USA, 2011. [Google Scholar] [CrossRef]
  32. Adams, M.B.; Kochenderfer, J.N.; Edwards, P.J. The Fernow Watershed Acidification Study: Ecosystem Acidification, Nitrogen Saturation and Base Cation Leaching. In Acid Rain-Deposition to Recovery; Springer: Berlin, Germany, 2007; pp. 267–273. [Google Scholar]
  33. Gilliam, F.S.; Billmyer, J.H.; Walter, C.A.; Peterjohn, W.T. Effects of excess nitrogen on biogeochemistry of a temperate hardwood forest: Evidence of nutrient redistribution by a forest understory species. Atmos. Environ. 2016, 146, 261–270. [Google Scholar] [CrossRef] [Green Version]
  34. Smith, L.J.; Stephan, K. Nitrogen fertilization, stand age, and overstory tree species impact the herbaceous layer in a Central Appalachian hardwood forest. Forests 2021, 12, 829. [Google Scholar] [CrossRef]
  35. Kochenderfer, J.N. Fernow and the Appalachian Hardwood Region. In The Fernow Watershed Acidification Study; Springer: Berlin, Germany, 2006; pp. 17–39. [Google Scholar]
  36. Trimble, G.R. Age and Stem Origin of Appalachian Hardwood Reproduction Following a Clearcut and Herbicide Treatment; U.S. Department of Agriculture, Forest Service, Northeastern Forest Experiment Station: Newtown Square, PA, USA, 1986; Volume 589. [Google Scholar]
  37. Aubertin, G.; Patric, J. Water quality after clearcutting a small watershed in West Virginia. J. Environ. Qual. 1974, 3, 243–249. [Google Scholar] [CrossRef] [Green Version]
  38. Patric, J.H.; Reinhart, K.G. Hydrologic effects of deforesting two mountain watersheds in West Virginia. Water Resour. Res. 1971, 7, 1182–1188. [Google Scholar] [CrossRef]
  39. Peterjohn, W.T.; Adams, M.B.; Gilliam, F.S. Symptoms of nitrogen saturation in two central Appalachian hardwood forest ecosystems. Biogeochemistry 1996, 35, 507–522. [Google Scholar] [CrossRef]
  40. Gilliam, F.S.; Welch, N.T.; Phillips, A.H.; Billmyer, J.H.; Peterjohn, W.T.; Fowler, Z.K.; Walter, C.A.; Burnham, M.B.; May, J.D.; Adams, M.B. Twenty-five-year response of the herbaceous layer of a temperate hardwood forest to elevated nitrogen deposition. Ecosphere 2016, 7, e01250. [Google Scholar] [CrossRef] [Green Version]
  41. DeWalle, D.R.; Kochenderfer, J.N.; Adams, M.B.; Miller, G.W.; Gilliam, F.S.; Wood, F.; Odenwald-Clemens, S.S.; Sharpe, W.E. Vegetation and Acidification. In The Fernow Watershed Acidification Study; Springer: Berlin, Germany, 2006; pp. 137–188. [Google Scholar]
  42. Gebauer, G.; Melzer, A.; Rehder, H. Nitrate content and nitrate reductase activity in Rumex obtusifolius L. Oecologia 1984, 63, 136–142. [Google Scholar] [CrossRef] [PubMed]
  43. Smith, L.J. The Impact of Tree Species, Elevated Nitrogen Deposition, Stand Age, and Environmental Factors on Herbaceous Plant Communities in a Central Appalachian Hardwood Forest; West Virginia University: Morgantown, WV, USA, 2019. [Google Scholar]
  44. Jaworski, E.G. Nitrate reductase assay in intact plant tissues. Biochem. Biophys. Res. Commun. 1971, 43, 1274–1279. [Google Scholar] [CrossRef]
  45. Stewart, G.; Lee, J.; Orebamjo, T. Nitrogen metabolism of halophytes II. Nitrate availability and utilization. New Phytol. 1973, 72, 539–546. [Google Scholar] [CrossRef]
  46. Stephan, K.; Kavanagh, K.L.; Koyama, A. Comparing the influence of wildfire and prescribed burns on watershed nitrogen biogeochemistry using 15N natural abundance in terrestrial and aquatic ecosystem components. PLoS ONE 2015, 10, e0119560. [Google Scholar] [CrossRef]
  47. Eisenhut, S.E.; Stephan, K. Adapting the in-vivo method for determining Nitrate Reductase Activity (NRA) for processing a large sample size in remote locations. Plant Physiol. 2022. in prep. [Google Scholar]
  48. LP-80; METER Group, Inc.: Pullman, WA, USA, 2020.
  49. Hurlbert, S.H. Pseudoreplication and the design of ecological field experiments. Ecol. Monogr. 1984, 54, 187–211. [Google Scholar] [CrossRef] [Green Version]
  50. Liu, N.; Wu, S.; Guo, Q.; Wang, J.; Cao, C.; Wang, J. Leaf nitrogen assimilation and partitioning differ among subtropical forest plants in response to canopy addition of nitrogen treatments. Sci. Total Environ. 2018, 637, 1026–1034. [Google Scholar] [CrossRef]
  51. Knops, J.M.; Reinhart, K. Specific leaf area along a nitrogen fertilization gradient. Am. Midl. Nat. 2000, 144, 265–272. [Google Scholar] [CrossRef]
  52. Vose, J.M.; Allen, H.L. Leaf area, stemwood growth, and nutrition relationships in loblolly pine. For. Sci. 1988, 34, 547–563. [Google Scholar]
  53. Eastman, B.A.; Adams, M.B.; Brzostek, E.R.; Burnham, M.B.; Carrara, J.E.; Kelly, C.; McNeil, B.E.; Walter, C.A.; Peterjohn, W.T. Altered plant carbon partitioning enhanced forest ecosystem carbon storage after 25 years of nitrogen additions. New Phytol. 2021, 230, 1435–1448. [Google Scholar] [CrossRef] [PubMed]
  54. Atkins, J.W.; Bond-Lamberty, B.; Fahey, R.T.; Haber, L.T.; Stuart-Haëntjens, E.; Hardiman, B.S.; LaRue, E.; McNeil, B.E.; Orwig, D.A.; Stovall, A.E. Application of multidimensional structural characterization to detect and describe moderate forest disturbance. Ecosphere 2020, 11, e03156. [Google Scholar] [CrossRef]
  55. Fernow Experimental Forest Long Term Soil Productivity (LTSP) Experiment—Lysimeter data (1996–2020). Available online: http://www.as.wvu.edu/fernow/data.html (accessed on 19 May 2022).
  56. Vitousek, P.M.; Gosz, J.R.; Grier, C.C.; Melillo, J.M.; Reiners, W.A. A comparative analysis of potential nitrification and nitrate mobility in forest ecosystems. Ecol. Monogr. 1982, 52, 155–177. [Google Scholar] [CrossRef] [Green Version]
  57. Finzi, A.C.; Van Breemen, N.; Canham, C.D. Canopy tree–soil interactions within temperate forests: Species effects on soil carbon and nitrogen. Ecol. Appl. 1998, 8, 440–446. [Google Scholar]
  58. Walter, C.A.; Raiff, D.T.; Burnham, M.B.; Gilliam, F.S.; Adams, M.B.; Peterjohn, W.T. Nitrogen fertilization interacts with light to increase Rubus spp. cover in a temperate forest. Plant Ecol. 2016, 217, 421–430. [Google Scholar] [CrossRef]
  59. Getzin, S.; Wiegand, T.; Wiegand, K.; He, F. Heterogeneity influences spatial patterns and demographics in forest stands. J. Ecol. 2008, 96, 807–820. [Google Scholar] [CrossRef]
  60. Lovett, G.M.; Weathers, K.C.; Arthur, M.A. Control of nitrogen loss from forested watersheds by soil carbon:nitrogen ratio and tree species composition. Ecosystems 2002, 5, 0712–0718. [Google Scholar] [CrossRef]
  61. Andrews, M. The partitioning of nitrate assimilation between root and shoot of higher plants. Plant Cell Environ. 1986, 9, 511–519. [Google Scholar]
  62. Templer, P.; Dawson, T. Nitrogen uptake by four tree species of the Catskill Mountains, New York: Implications for forest N dynamics. Plant Soil 2004, 262, 251–261. [Google Scholar] [CrossRef]
  63. Truax, B.; Lambert, F.; Gagnon, D.; Chevrier, N. Nitrate reductase and glutamine synthetase activities in relation to growth and nitrogen assimilation in red oak and red ash seedlings: Effects of N-forms, N concentration and light intensity. Trees 1994, 9, 12–18. [Google Scholar] [CrossRef]
  64. Sarjala, T.; Raitio, R.; Turkki, E.-M. Nitrate metabolism in Scots pine seedlings during their first growing season. Tree Physiol. 1987, 3, 285–293. [Google Scholar] [CrossRef]
  65. Black, B.L.; Fuchigami, L.H.; Coleman, G.D. Partitioning of nitrate assimilation among leaves, stems and roots of poplar. Tree Physiol. 2002, 22, 717–724. [Google Scholar] [CrossRef]
  66. Gebauer, G.; Stadler, J. Nitrate assimilation and nitrate content in different organs of ash trees (Fraxinus excelsior). In Plant Nutrition—Physiology and Applications; Springer: Berlin, Germany, 1990; pp. 101–106. [Google Scholar]
  67. Högbom, L.; Nilsson, U.; Örlander, G. Nitrate dynamics after clear felling monitored by in vivo nitrate reductase activity (NRA) and natural 15N abundance of Deschampsia flexuosa (L.) Trin. For. Ecol. Manag. 2002, 160, 273–280. [Google Scholar] [CrossRef]
  68. Tessier, J.T.; Raynal, D.J. Vernal nitrogen and phosphorus retention by forest understory vegetation and soil microbes. Plant Soil 2003, 256, 443–453. [Google Scholar] [CrossRef]
  69. Rachmilevitch, S.; Cousins, A.B.; Bloom, A.J. Nitrate assimilation in plant shoots depends on photorespiration. Proc. Natl. Acad. Sci. USA 2004, 101, 11506–11510. [Google Scholar] [CrossRef] [Green Version]
  70. Bloom, A.J. Photorespiration and nitrate assimilation: A major intersection between plant carbon and nitrogen. Photosynth. Res. 2015, 123, 117–128. [Google Scholar] [CrossRef] [PubMed] [Green Version]
  71. Koyama, L.A.; Terai, M.; Tokuchi, N. Nitrate reductase activities in plants from different ecological and taxonomic groups grown in Japan. Ecol. Res. 2020, 35, 708–712. [Google Scholar] [CrossRef]
  72. Gilliam, F.S.; Burns, D.A.; Driscoll, C.T.; Frey, S.D.; Lovett, G.M.; Watmough, S.A. Decreased atmospheric nitrogen deposition in eastern North America: Predicted responses of forest ecosystems. Environ. Pollut. 2019, 244, 560–574. [Google Scholar] [CrossRef] [PubMed]
Figure 2. Mean NRA of herb-layer species A) blackberry, B) common greenbrier, C) star chickweed, D) violets collected during one spring and three summer campaigns; summer 2018 (Su18), spring 2019 (Sp19), early summer 2019 (Su19a), and midsummer 2019 (Su19b), in fertilized watershed (WS) 3 and unfertilized WS7 at the Fernow Experimental Forest, West Virginia, USA. Values for model effects Watershed (WS) and Time (T) are displayed per species; WS × T interactions were not significant. Note the different scales of the y-axes. Error bars represent 1 SE based on a maximum of n = 9 for spring (i.e., the number of sites per watershed) and n = 18 (i.e., the number of plots per watershed). Letters (from Tukey–Kramer multiple comparisons) are showing the Time effect; means not connected by the same letter are significantly different.
Nitrogen 03 00022 g002
Table 1. Characteristics of the mixed-hardwoods watersheds (WS) from which tree and herb-layer tissue were collected for analysis of nitrate reductase activity. The watersheds are located in the Fernow Experimental Forest, Parsons, WV, USA.
Watershed
ID
Aspect Stand Age (yr) in 2020 and History 1 Treatment Basal Area (%) of Dominant Tree Species 3 Streamwater Nitrate (mg L−1) Pre/Post 1990 4
WS3 S~50
Partial cuts in 1958, ‘1963,‘1968; clearcut 1969–70; riparian buffer cut in 1970
Fertilization via aerial applications of 35 kg N ha−1 yr−1 granular ammonium sulfate ((NH4)2SO4) 1989–2019 2Black cherry, 51
Red+sugar maple, 12 + 1
Sweet birch, 5
Northern red oak, 5
2.8/8.5
WS7 E~50
Clearcut 1963–67; WS main-tained barren by annual herbicide application 1967–69
No
Fertilization
Tulip-poplar, 26
Black cherry, 21
Sweet birch, 21
Red+sugar maple, 8 + 5
5.4/4.6
WS10 S~110No
Fertilization
Chestnut oak, 24
Northern red oak, 22
Red+sugar maple, 19 + 2 Blackgum, 8
1.2/0.8
WS13 N~110No
Fertilization
Northern red oak, 30
Sugar maple, 22
Red maple, 13
Tulip-poplar, 7
2.3/2.0
1 Watershed disturbance history is detailed in [35,36,37,38]. 2 Fertilizer applications occurred three times a year (typically March, July, and November) [39,40]. The dates of fertilization during this study were 23 March 2018, 15 August 2018, 26 February 2019, 3 April 2019, 10 July 2019, and 4 November 2019. 3 Basal area was collected in 2000 for WS13 and WS10 [30] and in 2003 for WS3 and WS7 [41]. 4 Values represent mean annual concentrations for the periods of 1984–1988 and 1991–2015, respectively [30,31].
Table 2. Effects of overstory maple (M), watershed (WS), and their interaction (M × WS) on summer foliage NRA of individual, common herb-layer species at the Fernow Experimental Forest, West Virginia, USA. P-values shown resulted from an ANOVA on a dataset containing all four watersheds. The sample size (n) is given for each species; the maximum n is 72 (i.e., the number of study plots) since values had been averaged across all three summer sampling campaigns before analysis to minimize missing data points.
SpeciesSample SizeModel Effect p-Values
nMWSM × WS
Common greenbrier670.780.270.87
Blackberry570.760.780.34
Striped maple200.390.05 **0.61
Violets580.63<0.0001 **0.83
Star chickweed320.07 *0.730.62
Christmas fern400.600.001 **0.82
Hay-scented fern180.560.130.60
Intermediate Wood fern370.790.055 *0.73
New York fern230.780.730.63
** p ≤ 0.05 * p ≤ 0.1.
Table 3. Root and foliage NRA (μmol g−1 h−1) of overstory maple species and common herb-layer species collected in fertilized watershed (WS) 3 and unfertilized WS7 at the Fernow Experimental Forest, West Virginia, USA. Values for foliage NRA are from the sampling event closest to the root sampling event (i.e., midsummer 2019). Fern foliage n exceeds the number of plots per watershed (18) because multiple fern species were combined for the analyses. Across all species, root NRA was greater in fertilized WS3 than unfertilized WS7. Differences between foliage and root NRA were also statistically significant for each species (see Table 4).
Root NRAFoliage NRA
WS3 WS7 WS3 WS7
MeanSEnMeanSEnMeanSEnMeanSEn
Red maple0.090.0250.090.0350.040.0190.050.019
Sugar maple0.070.0140.050.0340.110.0290.090.029
Blackberry0.14 a0.02100.08 b0.01100.380.06160.400.0915
Common greenbrier0.070.01100.050.02100.080.02140.100.019
Ferns 10.090.01100.040.01100.190.03220.100.0127
Violets0.29 a0.04100.11 b0.04101.360.1820.710.1816
1 Ferns refer to Christmas fern for root NRA, but multiple fern species (see Figure 1B) for foliage NRA. a, b Lowercase letters indicate statistically significant (p ≤ 0.05) differences of individual species in root NRA between the two watersheds.
Table 4. p-Values from ANOVA testing the effects of Watershed (WS; fertilized WS3 vs. unfertilized WS7), Organ (O; root vs. foliage), and their interaction (WS × O) on root and foliar NRA of individual overstory maple species and four common herb-layer species at the Fernow Experimental Forest, Parsons, WV, USA.
Model Effect p-Values
SpeciesWSOWS × O
Red maple0.850.0001 **0.54
Sugar maple0.140.01 **0.47
Blackberry0.26<0.0001 **0.26
Common greenbrier0.950.03 **0.30
Ferns0.001 **0.0008 **0.50
Violets<0.0001 **<0.0001 **0.007 **
** p ≤ 0.05
Table 5. Absolute (Abs) and relative (%) values of foliage NRAA for the overstory maples and the herb layer in each watershed (WS) and summer sampling campaign. Absolute NRAA is in µmol NO2 m−2 hr−1, standard error is given in parentheses; n = 9. All is the sum of absolute maple NRAA and herb-layer NRAA per plot, and % = Abs/All. Data are from the Fernow Experimental Forest, West Virginia, USA.
WS3WS7WS13WS10
AllOverstoryHerb LayerAllOverstoryHerb LayerAllOverstoryHerb LayerAllOverstoryHerb Layer
Abs%Abs% Abs%Abs% Abs%Abs% Abs%Abs%
Summer 2018
Red maple31.327.6 (5.1)883.6 (0.6)1222.017 (5.1)775.0 (0.3)239.26.8 (2.0)74.02.3 (0.4)2610.78.2 (1.5)772.5 (0.3)23
Sugar maple51.146.2 (4.3)904.9 (0.8)1031.927.4 (5.1)864.5 (0.4)1421.919.2 (4.8)88.02.7 (0.5)1228.025.4 (9.6)912.6 (0.5)9
Total82.473.9 8.5 54.044.4 9.5 31.026.0 5.0 38.733.6 5.1
Early Summer 2019
Red maple22.419.9 (4.3)882.6 (0.4)1210.67.6 (2.7)713.0 (0.3)2923.821.5 (8.9)902.3 (0.3)1015.513.3 (4.5)862.2 (0.2)14
Sugar maple50.746.0 (10.4)914.7 (0.9)918.816.2 (6.0)862.6 (0.3)1418.615.6 (4.4)843.0 (0.4)1617.815.9 (6.2)901.8 (0.3)10
Total73.165.8 7.3 29.423.8 5.7 42.437.1 5.3 33.329.2 4.0
Midsummer 2019
Red maple20.516.1 (2.3)784.5 (0.9)2220.712.2 (1.5)598.5 (0.6)4118.215.6 (2.2)862.6 (0.4)1415.312.8 (2.3)842.5 (0.3)16
Sugar maple44.336.3 (7.0)828.0 (1.9)1828.123.0 (3.5)825.1 (0.5)1828.024.6 (2.8)883.4 (0.6)1226.623.8 (3.0)902.7 (0.4)10
Total64.852.4 12.4 48.835.2 13.6 46.240.2 6.0 41.836.6 5.2
Mean
Red maple 21.2 3.6 12.3 5.5 14.6 2.4 11.4 2.4
Sugar maple 42.8 5.9 22.2 4.1 19.8 3.0 21.7 2.4
Total * 64.0 a869.414 34.5 b779.6 A23 34.4855.4 B15 33.1864.814
* Superscript letters (lower case: overstory maple; upper case: herb-layer) indicate statistically significant differences between watersheds when analyzed in pairs for a fertilization effect (fertilized WS3 vs. unfertilized WS7), stand-age effect (WS7 with 50-yr-old stand vs. WS13 with 110-yr-old stand), and watershed aspect effect (north-facing WS13 vs. south-facing WS10).
Table 6. NRAA (µmol NO2 m−2 hr−1, standard error in parentheses) of foliage and fine roots (0–10 cm) for the overstory maples and herb layer in fertilized watershed (WS) 3 and unfertilized WS7. F:R refers to the ratio of foliage to root NRAA. Standard Error is based on a maximum of n = 9 (i.e., plots per watershed). Data are from the Fernow Experimental Forest, West Virginia, USA.
Overstory Maple NRAAHerb-Layer NRAATotal
FoliageRootsF:RF + RFoliageRootsF:RF + RF + R
Fertilized WS3
Red maple16.1 (2.3)8.0 (2.0)2.024.14.5 (0.9)1.3 (0.7)3.55.829.9
Sugar maple36.3 (7.0)1.4 (0.3)2637.78.0 (1.9)3.0 (0.9)2.71148.7
Mean 30.9 8.439.3
Unfertilized WS7
Red maple12.2 (1.5)4.5 (0.9)2.716.78.5 (0.6)2.7 (1.0)3.111.227.9
Sugar maple23 (3.3)2.7 (0.8)8.525.75.1 (0.5)1.2 (0.5)4.36.332
Mean 21.2 8.830
Publisher’s Note: MDPI stays neutral with regard to jurisdictional claims in published maps and institutional affiliations.

