1. Introduction
Biological neurons are well known to exhibit a wide variety of interesting dynamic behaviors, including nonchaotic and chaotic spiking and bursting [
1]. Since the pioneering work of Hodgkin and Huxley [
2], many continuous-time neuron models have been developed in an attempt to model the complex behavior of biological neurons [
3,
4,
5,
6]. In order to capture the dynamics of neurons with fast bursts of spikes on top of slow oscillations, many of these models are slow–fast dynamical systems [
5,
7,
8,
9,
10,
11]. However, these systems of nonlinear differential equations are often unwieldy to work with, posing a significant computational obstacle in modeling the behavior of many-neuron systems [
12]. As a result, some discrete-time neuron models have been proposed, including Rulkov’s simple two-dimensional slow–fast models [
13,
14].
These models, often called chaotic and nonchaotic Rulkov models [
15], are capable of modeling both chaotic and nonchaotic spiking and bursting behaviors, and they are computationally efficient, allowing for the study of neuron systems with a complex architecture. The chaotic Rulkov model has been well studied in the literature [
15,
16,
17,
18,
19,
20], but in this paper, we will focus on the nonchaotic Rulkov model, which also produces rich and interesting dynamics. As expected, the most direct application of the (nonchaotic) Rulkov map is in modeling neuronal dynamics [
13], but it has also shown application in stability analysis [
21], control of chaos [
22], symbolic analysis [
23], final-state sensitivity [
24], machine learning [
25], information patterns [
26], and digital watermarking [
27]. Therefore, it is a worthwhile system to study purely due to its dynamical and geometrical properties.
In this paper, we are interested in lattice systems of coupled nonchaotic Rulkov neurons. In existing research, networks of coupled chaotic Rulkov neurons have received much attention, especially regarding the synchronization of chaotic Rulkov neuron networks. For example, existing studies include two chaotic Rulkov neurons coupled with chemical synapses [
28], two chaotic Rulkov neurons with a chemical synaptic and inner linking coupling [
29], the complete synchronization of an electrically coupled chaotic Rulkov neuron network [
30], synchronization in a network of chaotic Rulkov neurons with a leader–follower structure [
31], and coupling a discrete memristor into a chaotic Rulkov neuron [
32,
33,
34,
35,
36]. However, coupled systems of nonchaotic Rulkov neurons have not received nearly as much attention due to the complexity of the piecewise function
f present in the nonchaotic Rulkov map (Equation (
2)).
In this paper, we investigate neurons arranged in a ring lattice, which is a common topology used when studying coupled dynamical systems [
37,
38,
39]. Specifically, we are interested in a ring of
electrically coupled nonchaotic Rulkov neurons
, each with a flow of current with its neighbors (see
Figure 1). Osipov et al. [
40] qualitatively describe the dynamics of a similar Rulkov ring lattice system, noting the emergence of complex dynamics from Rulkov neurons in the nonchaotic spiking regime. Building on this previous work, this paper involves a quantitative, numerical analysis of the chaotic dynamics emerging from three different regimes of the ring lattice system, each with different individual neuron behaviors. The piecewise function
f present in the iteration function of each neuron in the ring is found to yield an impressively complex Jacobian matrix. Using this, the dynamics of this system are explored with greater generality over a wide range of electrical coupling strength values through numerical simulation and computation of the system’s maximal Lyapunov exponents. The main focus of this work is to analyze the fractal geometry of the system’s high-dimensional chaotic attractors and how it changes as the electrical coupling strength varies. In particular, we explore the complex relationship between the chaotic trajectories that the system follows on these attractors and the geometric structure and complexity of the attractors themselves.
This paper is organized as follows.
Section 2 describes the model and the three regimes of interest, then presents the qualitative and quantitative analysis of their complex dynamics.
Section 3 overviews the Kaplan–Yorke conjecture and uses it to approximate the fractal dimensions of the system’s attractors in 60-dimensional state space. Finally,
Section 4 summarizes our results, discusses their implications, and provides suggestions for future research.
2. The Model and Its Dynamics
The nonchaotic Rulkov map is defined by the following iteration function:
where
f is the piecewise function
Here,
is the state of the system at time step
,
x is the fast variable representing the voltage of the neuron,
y is the slow variable, and
,
, and
are parameters. In the original paper that introduces the Rulkov map [
13], the parameter
is used, but we use the slightly modified form from Ref. [
15]. To make
y a slow variable,
is needed, so we choose the standard value of
. To understand the role of the parameters
and
, we first observe the effect of
y on the fast-variable map
f, namely, that increasing
y raises the height of
f, which results in a quicker increase in
x before the resetting mechanism (the third piece of
f) is reached. In other words, a higher
y results in faster spikes. From the slow-variable iteration function, it is clear that
controls the value of
x, which keeps
y constant, and if the average value of
x is less than
, then
y will increase until the average value of
x reaches
, and vice versa. Therefore,
is an “excitation parameter,” since a higher value of
will cause
y to increase, increasing the frequency of spikes. The role of the parameter
is more subtle, but its main purpose is to control the existence of a stable point and the bursting regime, or oscillations between spiking and silence. Specifically, for
, certain values of
will result in bursting behavior. For a more detailed explanation of the behavior of individual nonchaotic Rulkov neurons and the roles of the parameters
and
, see Refs. [
13,
41,
42].
In experiments, biologists can alter the behavior of biological neurons by injecting the cell with a direct electrical current through an electrode [
13]. Modeling an injection of current from a DC voltage source requires a slight modification to the Rulkov iteration function given in Equation (
1):
where the parameters
and
model a time-varying injected current. Here, we are interested in coupling Rulkov neurons with a flow of current. To model this, say we have some coupled Rulkov neurons with states
, where
i denotes the neuron index. Then, mirroring Equation (
3), the iteration function of the
ith coupled neuron is defined as
where
is the state of the neuron
at the time step
k. The coupling parameters
and
depend on the structural arrangement of the system’s neurons in physical space, as well as the electrical coupling strength (or coupling conductance)
g between the neurons.
In electrically coupled neuron systems, the difference in the voltages, or fast variables, of two adjacent neurons is what results in a flow of current between them. For this reason, we model the electrical coupling parameters
and
to be proportional to the difference between the voltage of a given neuron
and the voltages of its adjacent neurons
. Specifically, the electrical coupling parameters of the neuron
are defined as
where
is the set of neurons that are adjacent to
, and
is the electrical coupling strength from
to
[
15].
The model investigated in this paper is a ring lattice of
electrically coupled nonchaotic Rulkov neurons. This lattice structure is visualized in
Figure 1 for
, where neurons are represented by blue points and the electric coupling connections are shown in gold. To determine the coupling parameters for each of these neurons, let
for simplicity. We will also assume that all couplings are equivalent and symmetric:
for all
. Because of the circular nature of this lattice system,
can be written as
which accounts for the fact that
and
. Then, from Equations (
5) and (
6), the coupling parameters of this ring system are
The state vector of this entire ring system with all
neurons can be written as
where
is the
pth dimension of the state vector
. The state space of this ring lattice system is
-dimensional, since we have one slow variable and one fast variable for each of the
neurons in the ring. Plugging the coupling parameters (Equation (
8)) into the general iteration function for coupled Rulkov maps (Equation (
4)) for each neuron in the ring yields the
-dimensional iteration function for the system:
By using numerical simulations to systematically vary
(see
Appendix C), it can be found that for
, varying
has no effect on the qualitative behavior of the ring lattice system. Therefore, we choose to perform our computational analysis on a system with the architecture shown in
Figure 1: a ring of
electrically coupled Rulkov neurons. This network size strikes a balance between computational tractability and dynamical richness: it is large enough to support complex collective behaviors such as synchronization, chaotic spiking, and chaotic bursting while remaining small enough to allow efficient computation of full Lyapunov spectra and attractor dimensions. Importantly, we choose a number of neurons higher than, say, five neurons, because we require a high-dimensional state space to explore the relationship between the system’s chaotic dynamics and the fractal geometry of its high-dimensional attractors. With 30 two-dimensional neurons (see Equation (
9)), the system evolves in a 60-dimensional state space, which is sufficient to host high-dimensional chaotic attractors whose fractal dimensions can span a wide range, revealing clearer trends. In this paper, we explore three different regimes of the ring lattice system:
The homogeneous case, where all neurons have the same and values;
The partially heterogeneous case, where each neuron has its own value but the same values;
The fully heterogeneous case, where each neuron has its own and values.
In all three cases, each neuron has a different initial
x value but the same initial
y value. We do not consider the case where each neuron has its own
value because different evolutions of the slow variable are accounted for by different values of
[
13].
In
Appendix A, a sketch of the derivation of the Jacobian matrix of the ring system is shown (Equation (
A4)). Given some initial state
, an orbit
of length 1000 (which is sufficiently long for Lyapunov exponent convergence) is generated, and the Jacobian matrix of the system
is calculated at each
. Then, the QR factorization method detailed in Ref. [
43] and
Appendix B for calculating the Lyapunov spectrum is used to compute the 60 Lyapunov exponents of the orbit. The maximal Lyapunov exponent is used to gauge chaotic dynamics in this section, and the entire Lyapunov spectrum is used for the analysis in
Section 3. Specifically, in this paper, we adopt the definition of chaos from Ref. [
44], which characterizes a system as chaotic if its maximal Lyapunov exponent is greater than zero.
We will now present our results detailing the dynamics that emerge from the homogeneous regime of the ring system. We choose the parameters
and
for all of the neurons, which set the individual neurons in the nonchaotic spiking regime. Additionally, the initial slow-variable values for all of the neurons are set to
. However, setting the initial fast-variable values to be equal would be pointless because the neurons would have identical dynamics, resulting in no current flow between them. Instead,
variables are randomly chosen from the interval
. The specific random initial states and parameters used are listed in
Appendix D.
In
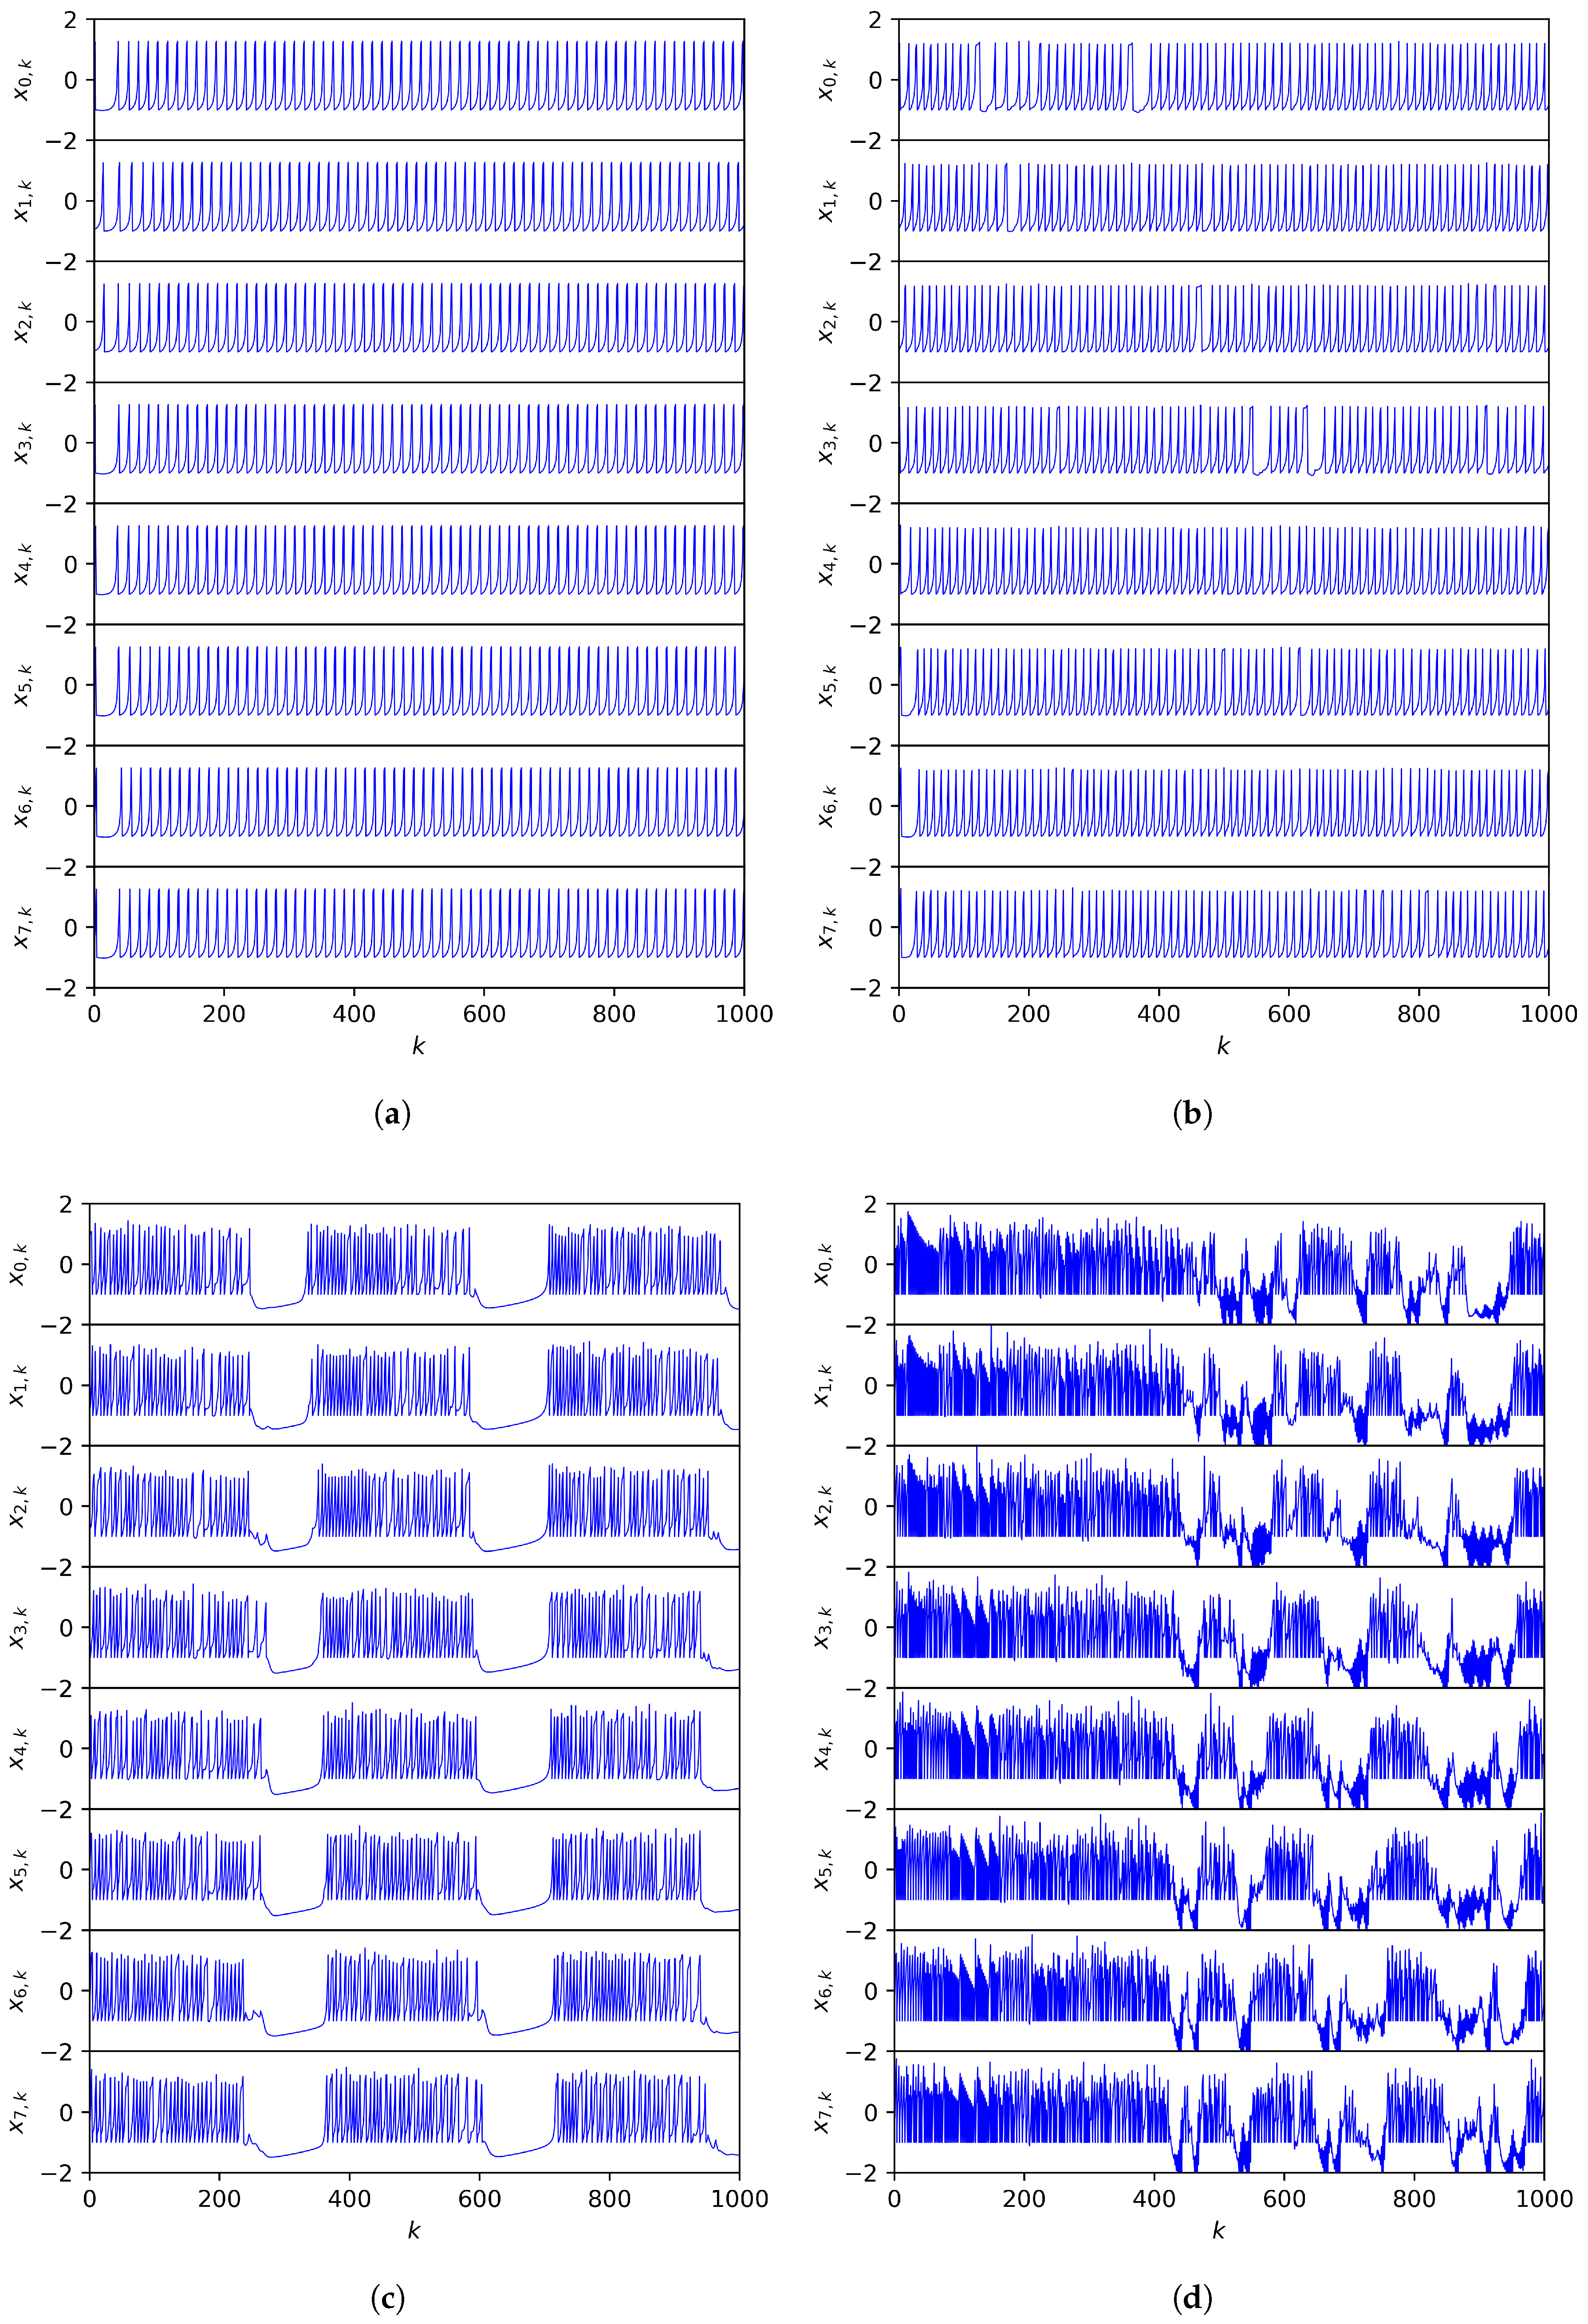
Figure 2, the first thousand iterations of the fast-variable orbits of the first eight Rulkov neurons in the ring are graphed. We start with uncoupled neurons
in
Figure 2a, where uncoupled neurons with identical parameters are all out of phase in the nonchaotic spiking domain. As expected, because there is no current flow and all of the individual Rulkov neurons are spiking regularly, the maximal Lyapunov exponent
is negative. When the electrical coupling strength is raised to
(
Figure 2b), the neurons still spike relatively periodically, but there are some irregularities when one voltage happens to catch onto another. This small
g is enough to make the system chaotic, with
. Next, the coupling strength is raised significantly to
, where the ring system now exhibits synchronized chaotic bursting (
Figure 2c). Here, synchronization refers to the oscillations between rapid spiking and silence happening in sync with each other. However, aligning with other computational neuron modelings, the individual spikes within the bursts are chaotic and unsynchronized [
13,
14]. Finally, the coupling strength is taken to the extreme with
in
Figure 2d, where synchronized hyperchaos ensues (
) due to each Rulkov neuron having an overwhelming influence on its nearest neighbors. The use of the term “hyperchaos,” generally defined to be chaotic dynamics with at least two positive Lyapunov exponents [
45], is justified here because the orbit in
Figure 2d has 11 positive Lyapunov exponents (out of 60).
A natural question to ask is how the maximal Lyapunov exponent changes as
g is varied, a graph of which is displayed in
Figure 3 for this homogeneous case. In the figure, 5000 evenly spaced values of
g between 0 and 1 are considered, and each point represents the maximal Lyapunov exponent of the system for one of these
g values. We notice that the maximal Lyapunov exponents are rather erratic for
, covering a wide range of values over a small domain of
g values. However, there do exist some general trends. Because the individual neurons in this system are nonchaotic,
values initially start below zero. As the current starts to flow, the range of chaotic spiking is reached (e.g.,
Figure 2b), where the
values quickly become positive and reach a maximum. Then, as the synchronized chaotic bursting regime is reached (e.g.,
Figure 2c), the
values become much more erratic but exhibit an overall downward trend, which can be attributed to the nonchaotic silence between bursts of spikes. As the extreme values of
g towards the right side of the graph are reached (e.g.,
Figure 2d),
shoots up to high and hyperchaotic values.
The partially and fully heterogeneous cases, in which different neurons in the ring have different parameters, will now be examined. The partially heterogeneous case keeps the same randomly distributed
values (Equation (
A12)), the same
values, and the same
values, but it has randomly chosen
values from the interval
(Equation (
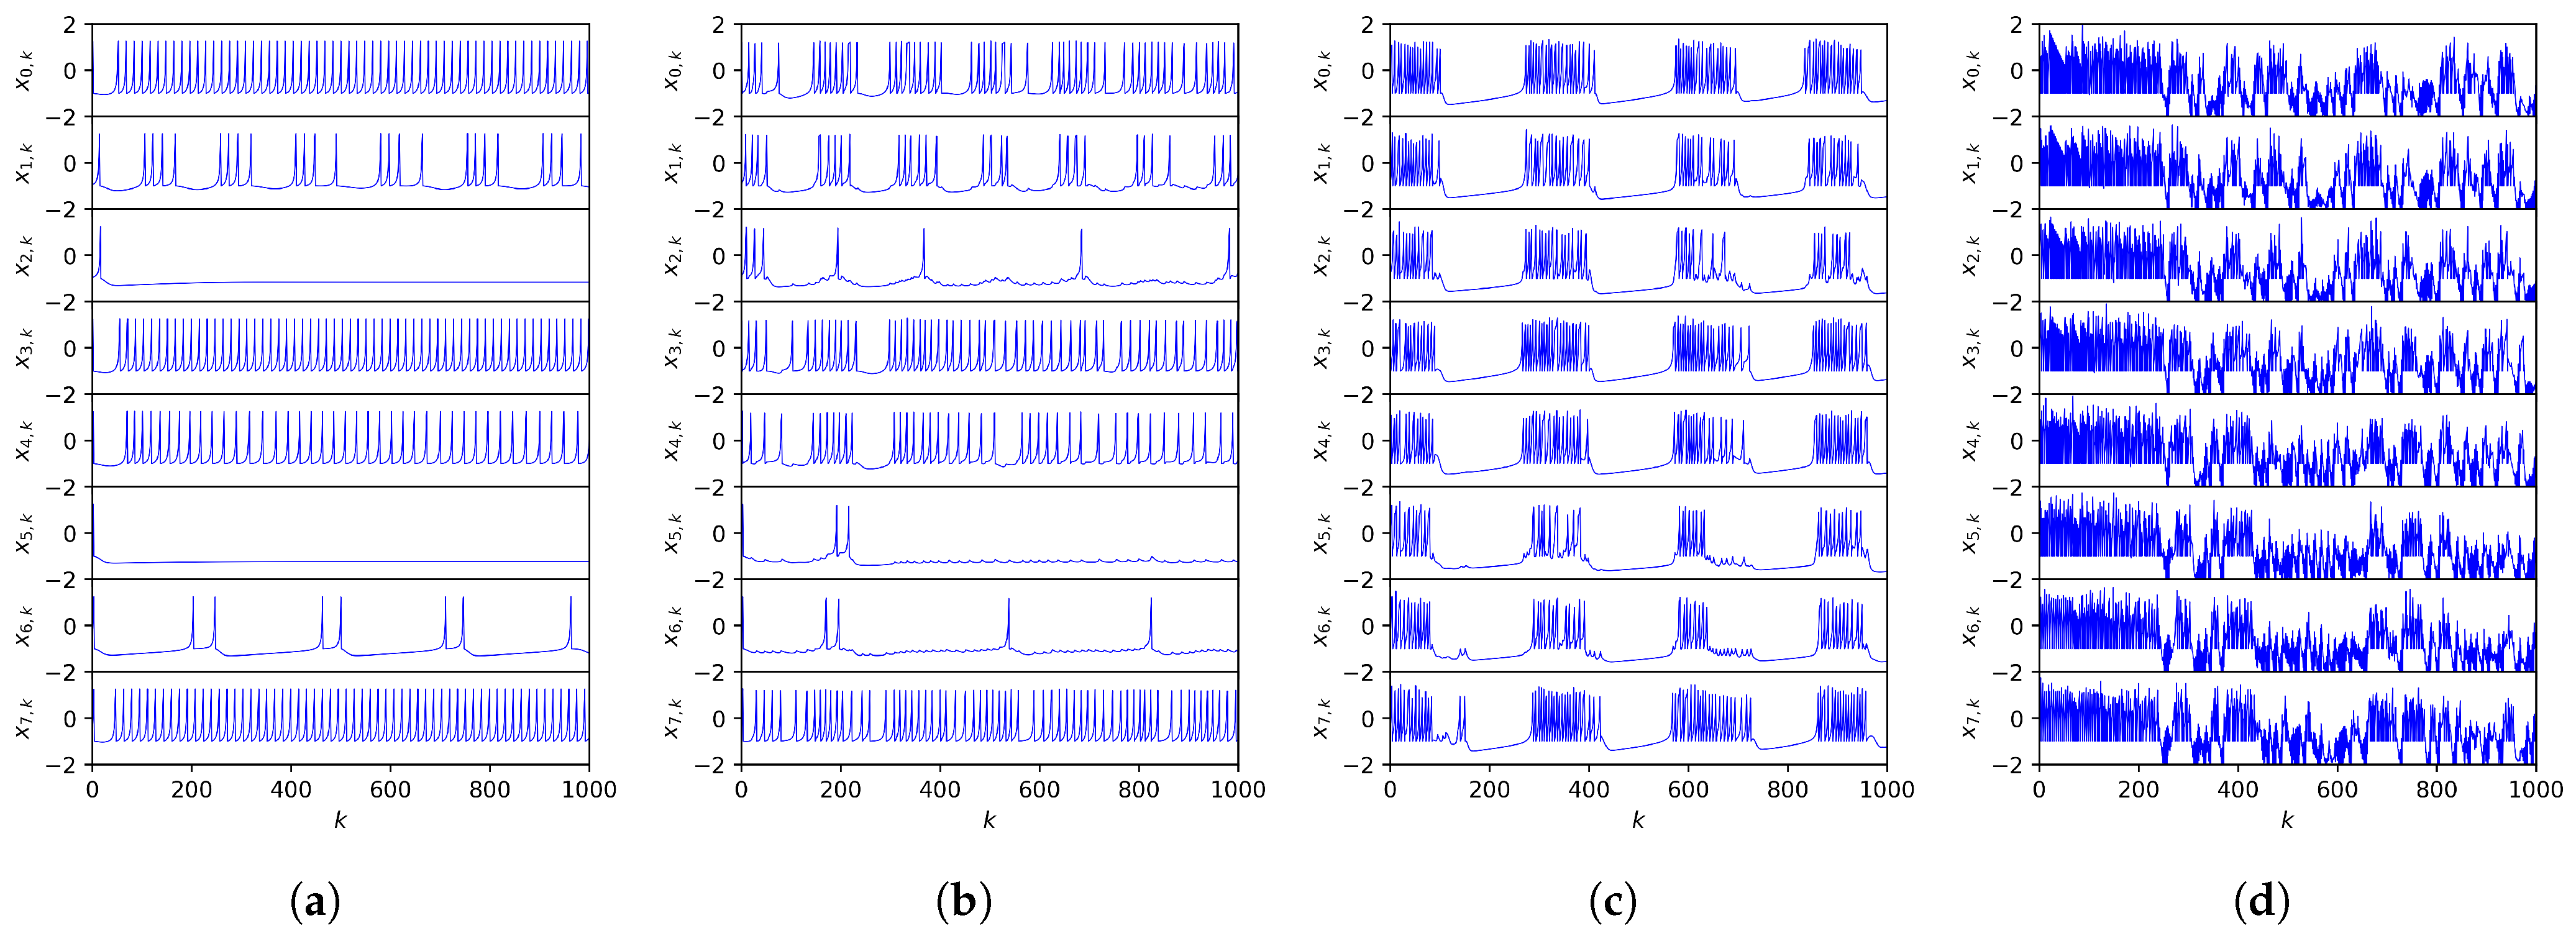
A13)). With these parameters, different individual neurons are in the silence, spiking, and bursting domains [
13], which can be seen in the visualization of the uncoupled neuron system’s dynamics (
Figure 4a).
Finally, the third regime we analyze is the fully heterogeneous case, where we keep the randomly distributed
and
values and keep
, but choose random
values from the interval
(Equation (
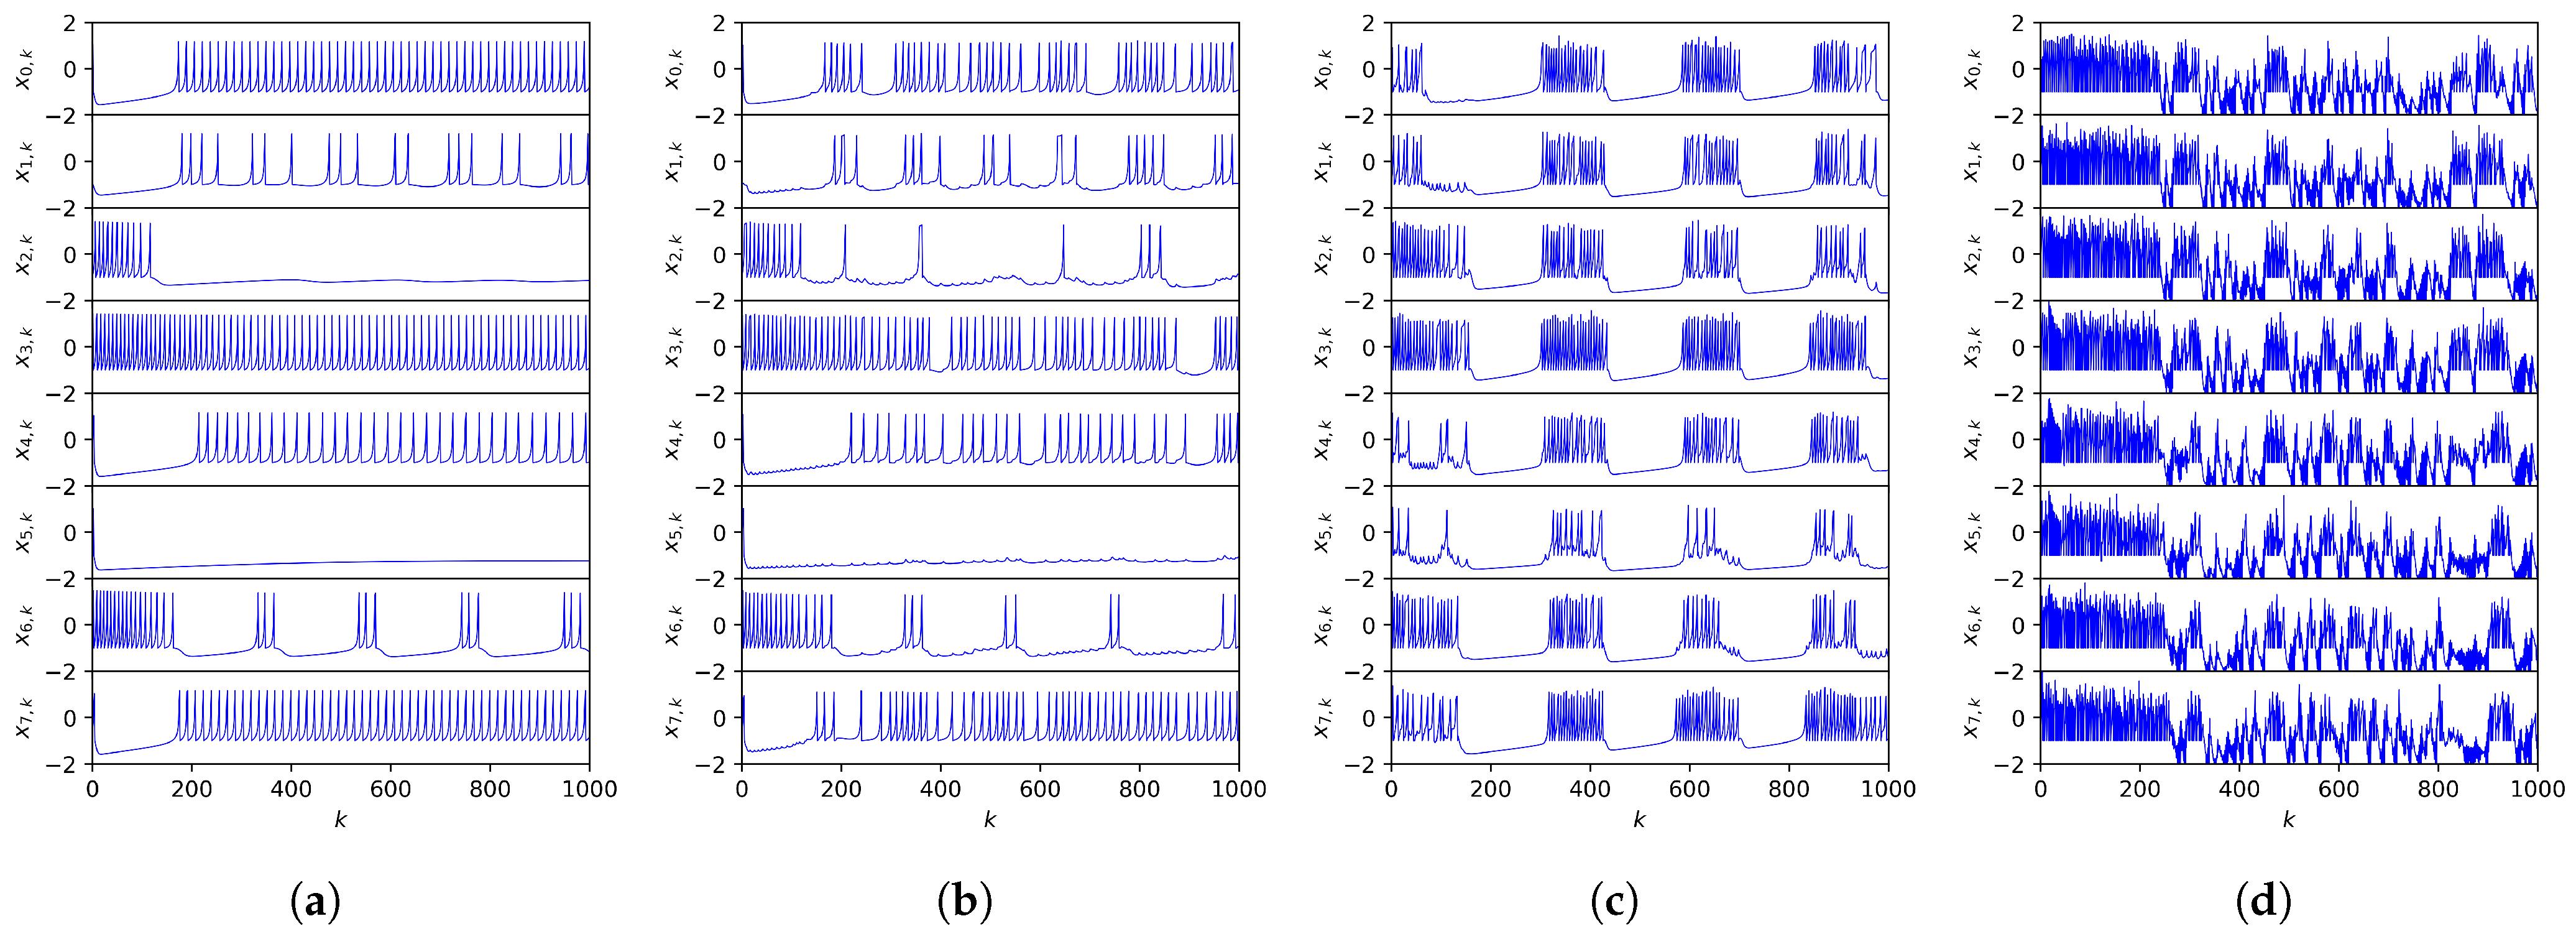
A14)). This further varies the distribution of possible behaviors between different neurons in the system. This can be seen in the dynamics of the uncoupled neuron system (
Figure 5a), where some neurons exhibit rapid spiking, some burst occasionally, and some are silent.
In
Figure 4 and
Figure 5, the fast-variable orbits of the first eight neurons in the ring are graphed using the same electrical coupling strength values as the homogeneous case:
. Comparing both of these regimes to the homogeneous case, similar patterns emerge among them. For
, the adjacent neurons start to have some effect on each other, but the overall dynamical picture remains the same. Upon raising the electrical coupling strength up to
, all the neurons undergo synchronized chaotic bursting, and upon going to the extreme
, synchronized hyperchaos ensues. An interesting observation that is even clearer in these visualizations is neurons’ direct influence on their adjacent partners. For instance, in
Figure 4b and
Figure 5c, spiking in one neuron is reflected in adjacent neurons with smaller spikes during a period of silence.
Figure 6 presents a visualization of the maximal Lyapunov exponents of these two regimes for many values of
g. An evident difference when comparing these graphs to the graph in
Figure 3 is that
for all the
g values. This is because even when the neurons are uncoupled, some of the individual neurons in the ring are chaotic. However, the graphs of the maximal Lyapunov exponents for all three cases have similar shapes, the major differences being when the neurons are weakly coupled and operating under their own parameters. Past this weak coupling domain, all three graphs in
Figure 3 and
Figure 6 follow the same increase up to chaotic spiking, followed by a swoop down as synchronized chaotic bursts occur, followed by a sharp increase as the extreme values of
g are approached. Therefore, despite making individual neurons exhibit drastically different dynamics from their neighbors, coupling makes the system exhibit similar dynamics. Although this behavior has been observed to a lesser extent before in a Rulkov neuron system (see Ref. [
40]), these distributions of Lyapunov exponents provide quantitative support for this phenomenon.
3. Fractal Geometry of Attractors
In
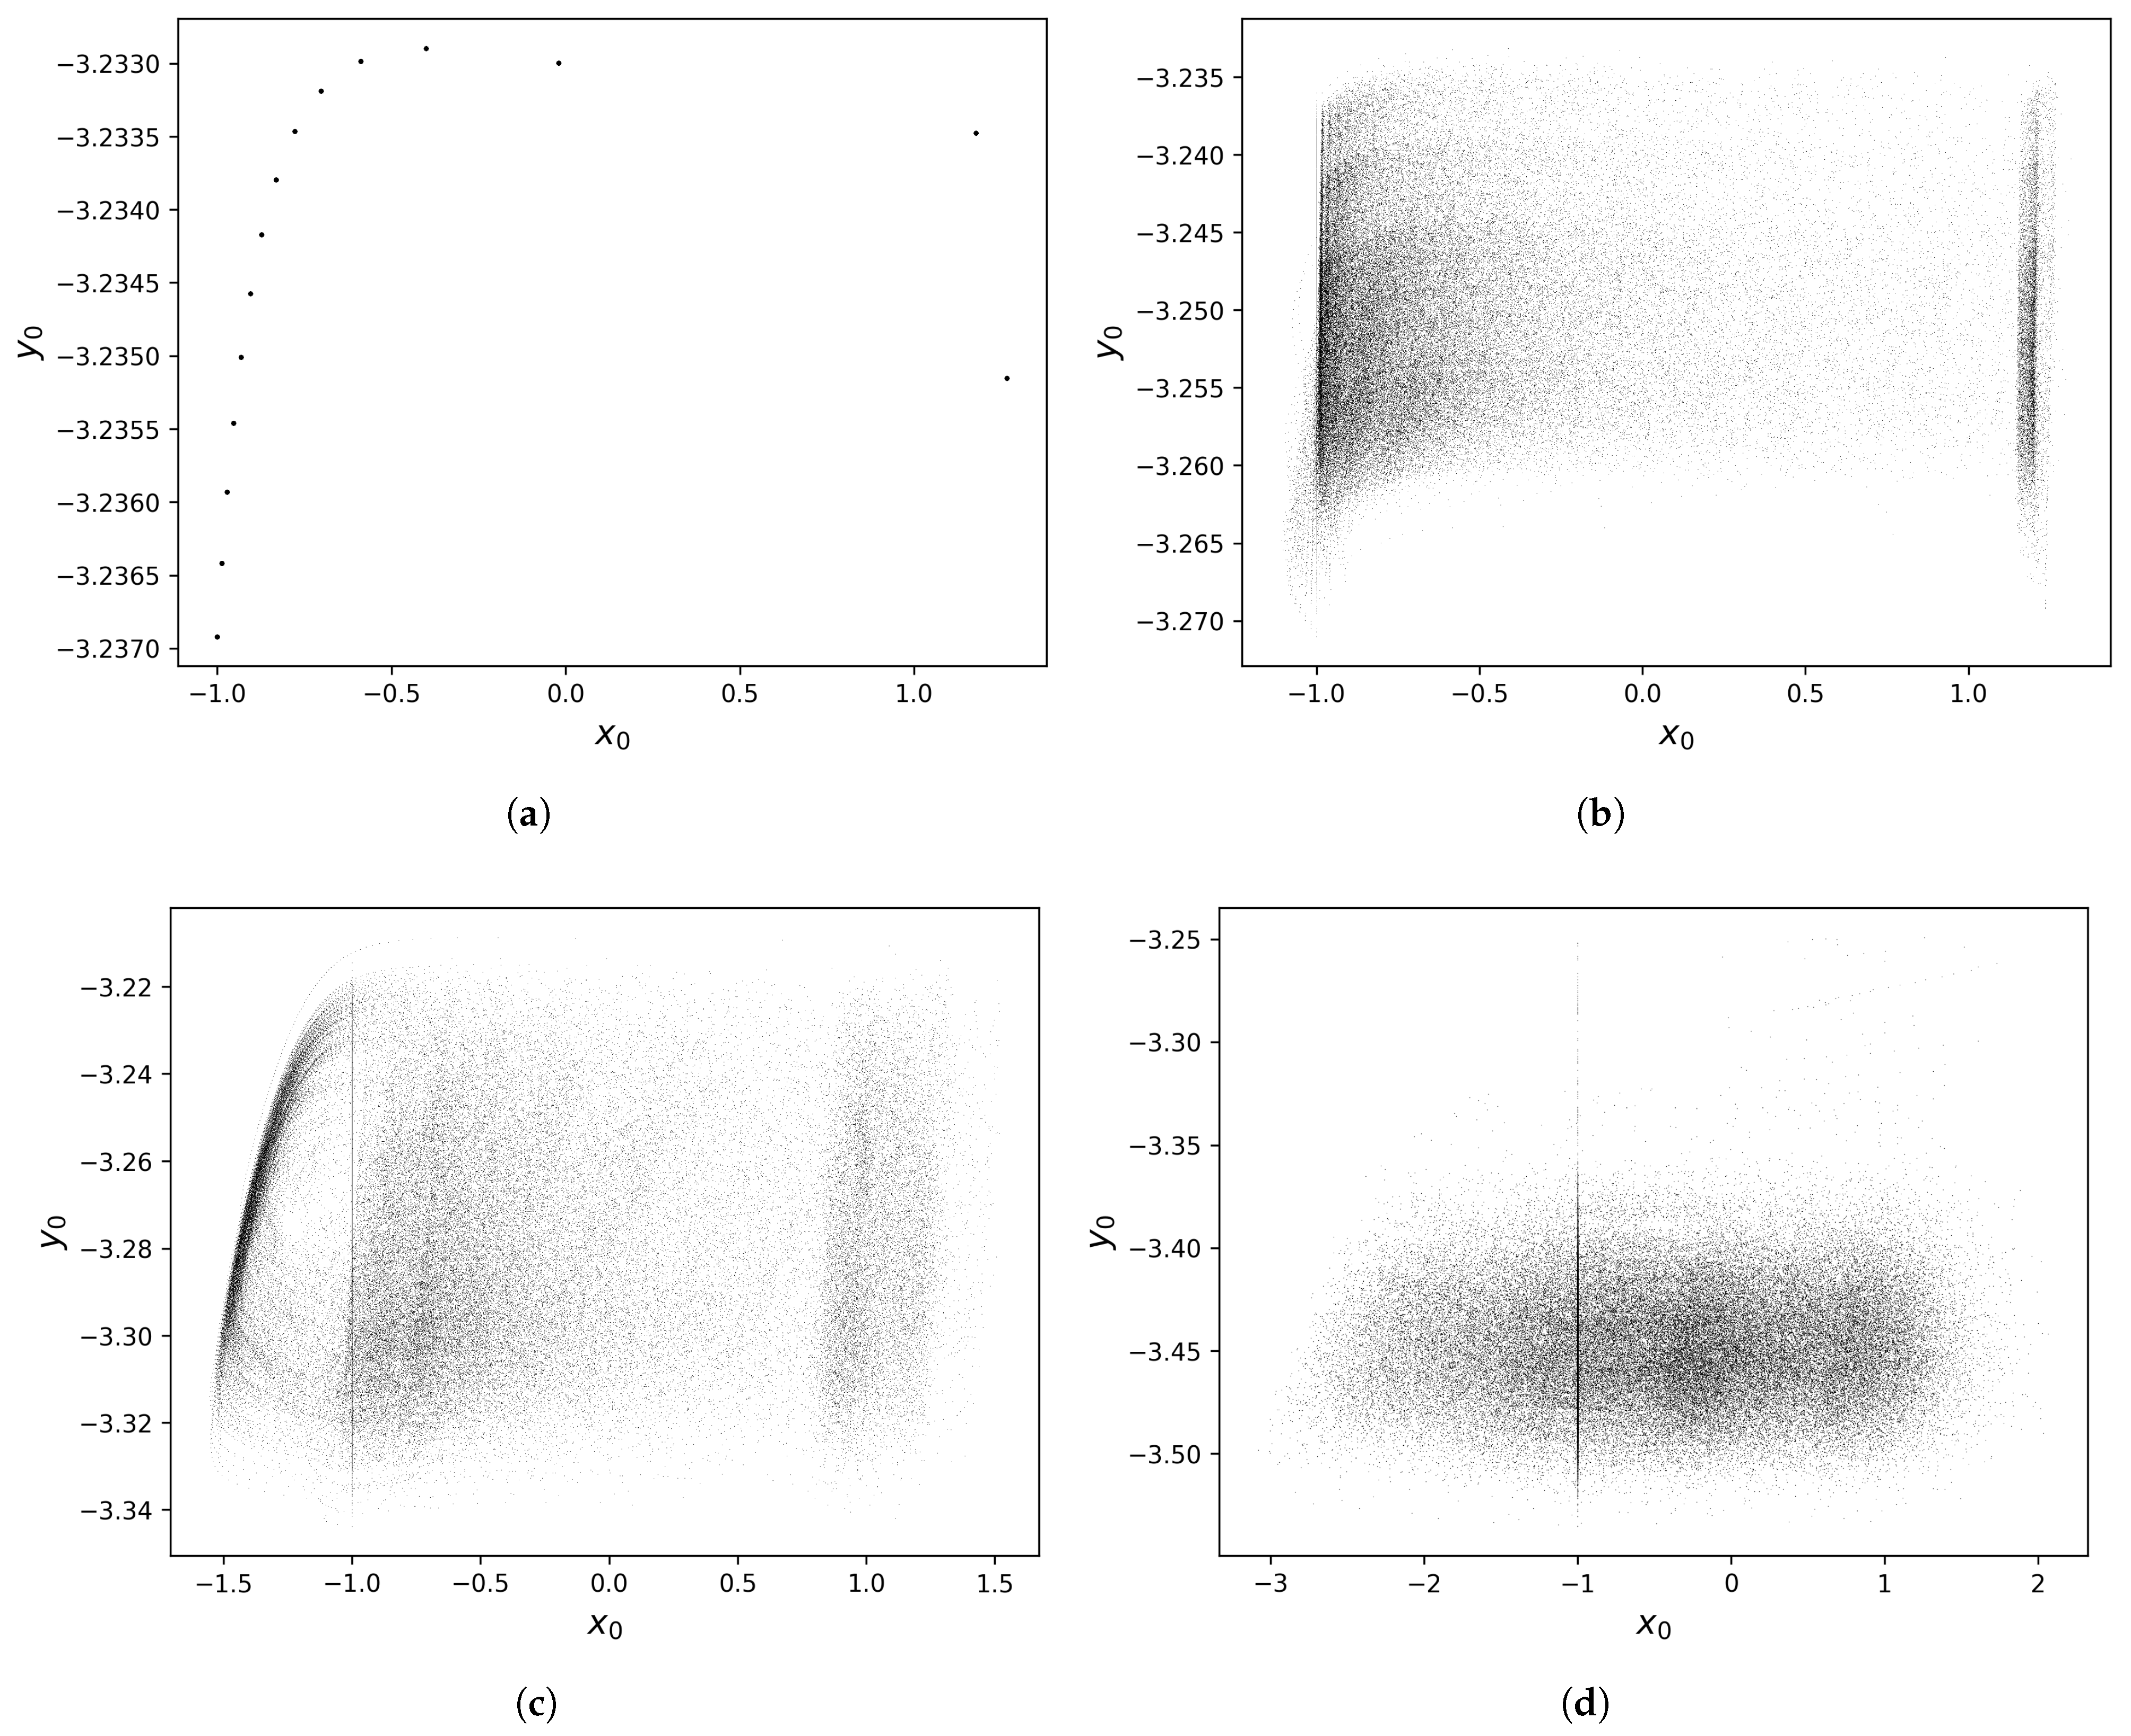
Section 2, it was found that the three regimes of the ring lattice system of nonchaotic Rulkov neurons nearly always exhibit chaotic dynamics with positive maximal Lyapunov exponents. Therefore, it can be concluded that this system usually evolves towards some chaotic attractor in 60-dimensional state space. In
Figure 7, we plot projections of four attractors representative of the four dynamical regimes of the homogeneous case onto the
plane. In the uncoupled regime (
Figure 7a), the orbit is nonchaotic and periodic, so the attractor is composed of a finite number of isolated points. However, in the coupled regimes (
Figure 7b–d), the chaotic orbits produce much more complex attractors that appear fractal and strange. Although these projections provide a simplified picture of the geometry of the attractors, they do not capture the full geometry of these objects embedded in 60-dimensional space. Thus, in this section, we will focus on analyzing the geometry of these strange attractors by approximating their fractal dimensions.
The fractal dimension serves as a critical tool for quantifying the geometric complexity of chaotic attractors. While Lyapunov exponents measure how sensitive the system is to initial conditions, the fractal dimension characterizes how much of the state space is effectively explored by the system over time. In particular, a higher fractal dimension implies that the dynamics occupy a larger portion of the state space, potentially corresponding to a greater number of active degrees of freedom. This is especially important in high-dimensional coupled systems like the one studied in this paper, where complex collective behavior can arise from interactions among individually simple units. Moreover, comparing fractal dimensions across different coupling strengths and heterogeneity regimes allows us to investigate how different dynamical effects, such as synchronization, influence the structure of the attractor.
To compute the basic box-counting dimension
d of a geometrical object,
n-dimensional state space is covered with
n-dimensional boxes of side length
. Then, the number of boxes that the object touches, denoted as
, is counted. Given this, the relation
is expected to hold [
46]. However, an issue immediately arises in the numerical computation of the fractal dimensions of attractors embedded in high-dimensional space. To illustrate this problem, consider a 60-dimensional cube (which has fractal dimension
) filling some region of 60-dimensional space. If we are to consider boxes with side length
and
, Equation (
11) indicates that
. Therefore, in the case of an attractor, it is necessary to sample at least in the order of
points to obtain an accurate result for the fractal dimension of the attractor in this simplified case. This is clearly not feasible, so we turn to the Kaplan–Yorke conjecture to provide a computationally efficient approximation for the fractal dimensions of the ring system’s attractors.
The Kaplan–Yorke conjecture asserts that the Lyapunov spectrum of the orbit on an attractor is directly related to the attractor’s dimension [
47]. Assuming that the Lyapunov spectrum is ordered from greatest to least, let
be the largest index such that
Then, the Lyapunov dimension
is defined as
The Kaplan–Yorke conjecture states that the Lyapunov dimension of an attractor is equal to its true fractal dimension
d [
48].
Although the Kaplan–Yorke conjecture remains unproven, it is well established that it holds in almost all cases [
49]. However, we would still like to check for its validity in this system. Using the full Lyapunov spectra we computed in
Section 2, the Lyapunov dimensions of the system can be calculated using Equations (
12) and (
13). Then, graphs similar to the ones in
Figure 3 and
Figure 6 can be made by plotting the values of
for many different values of
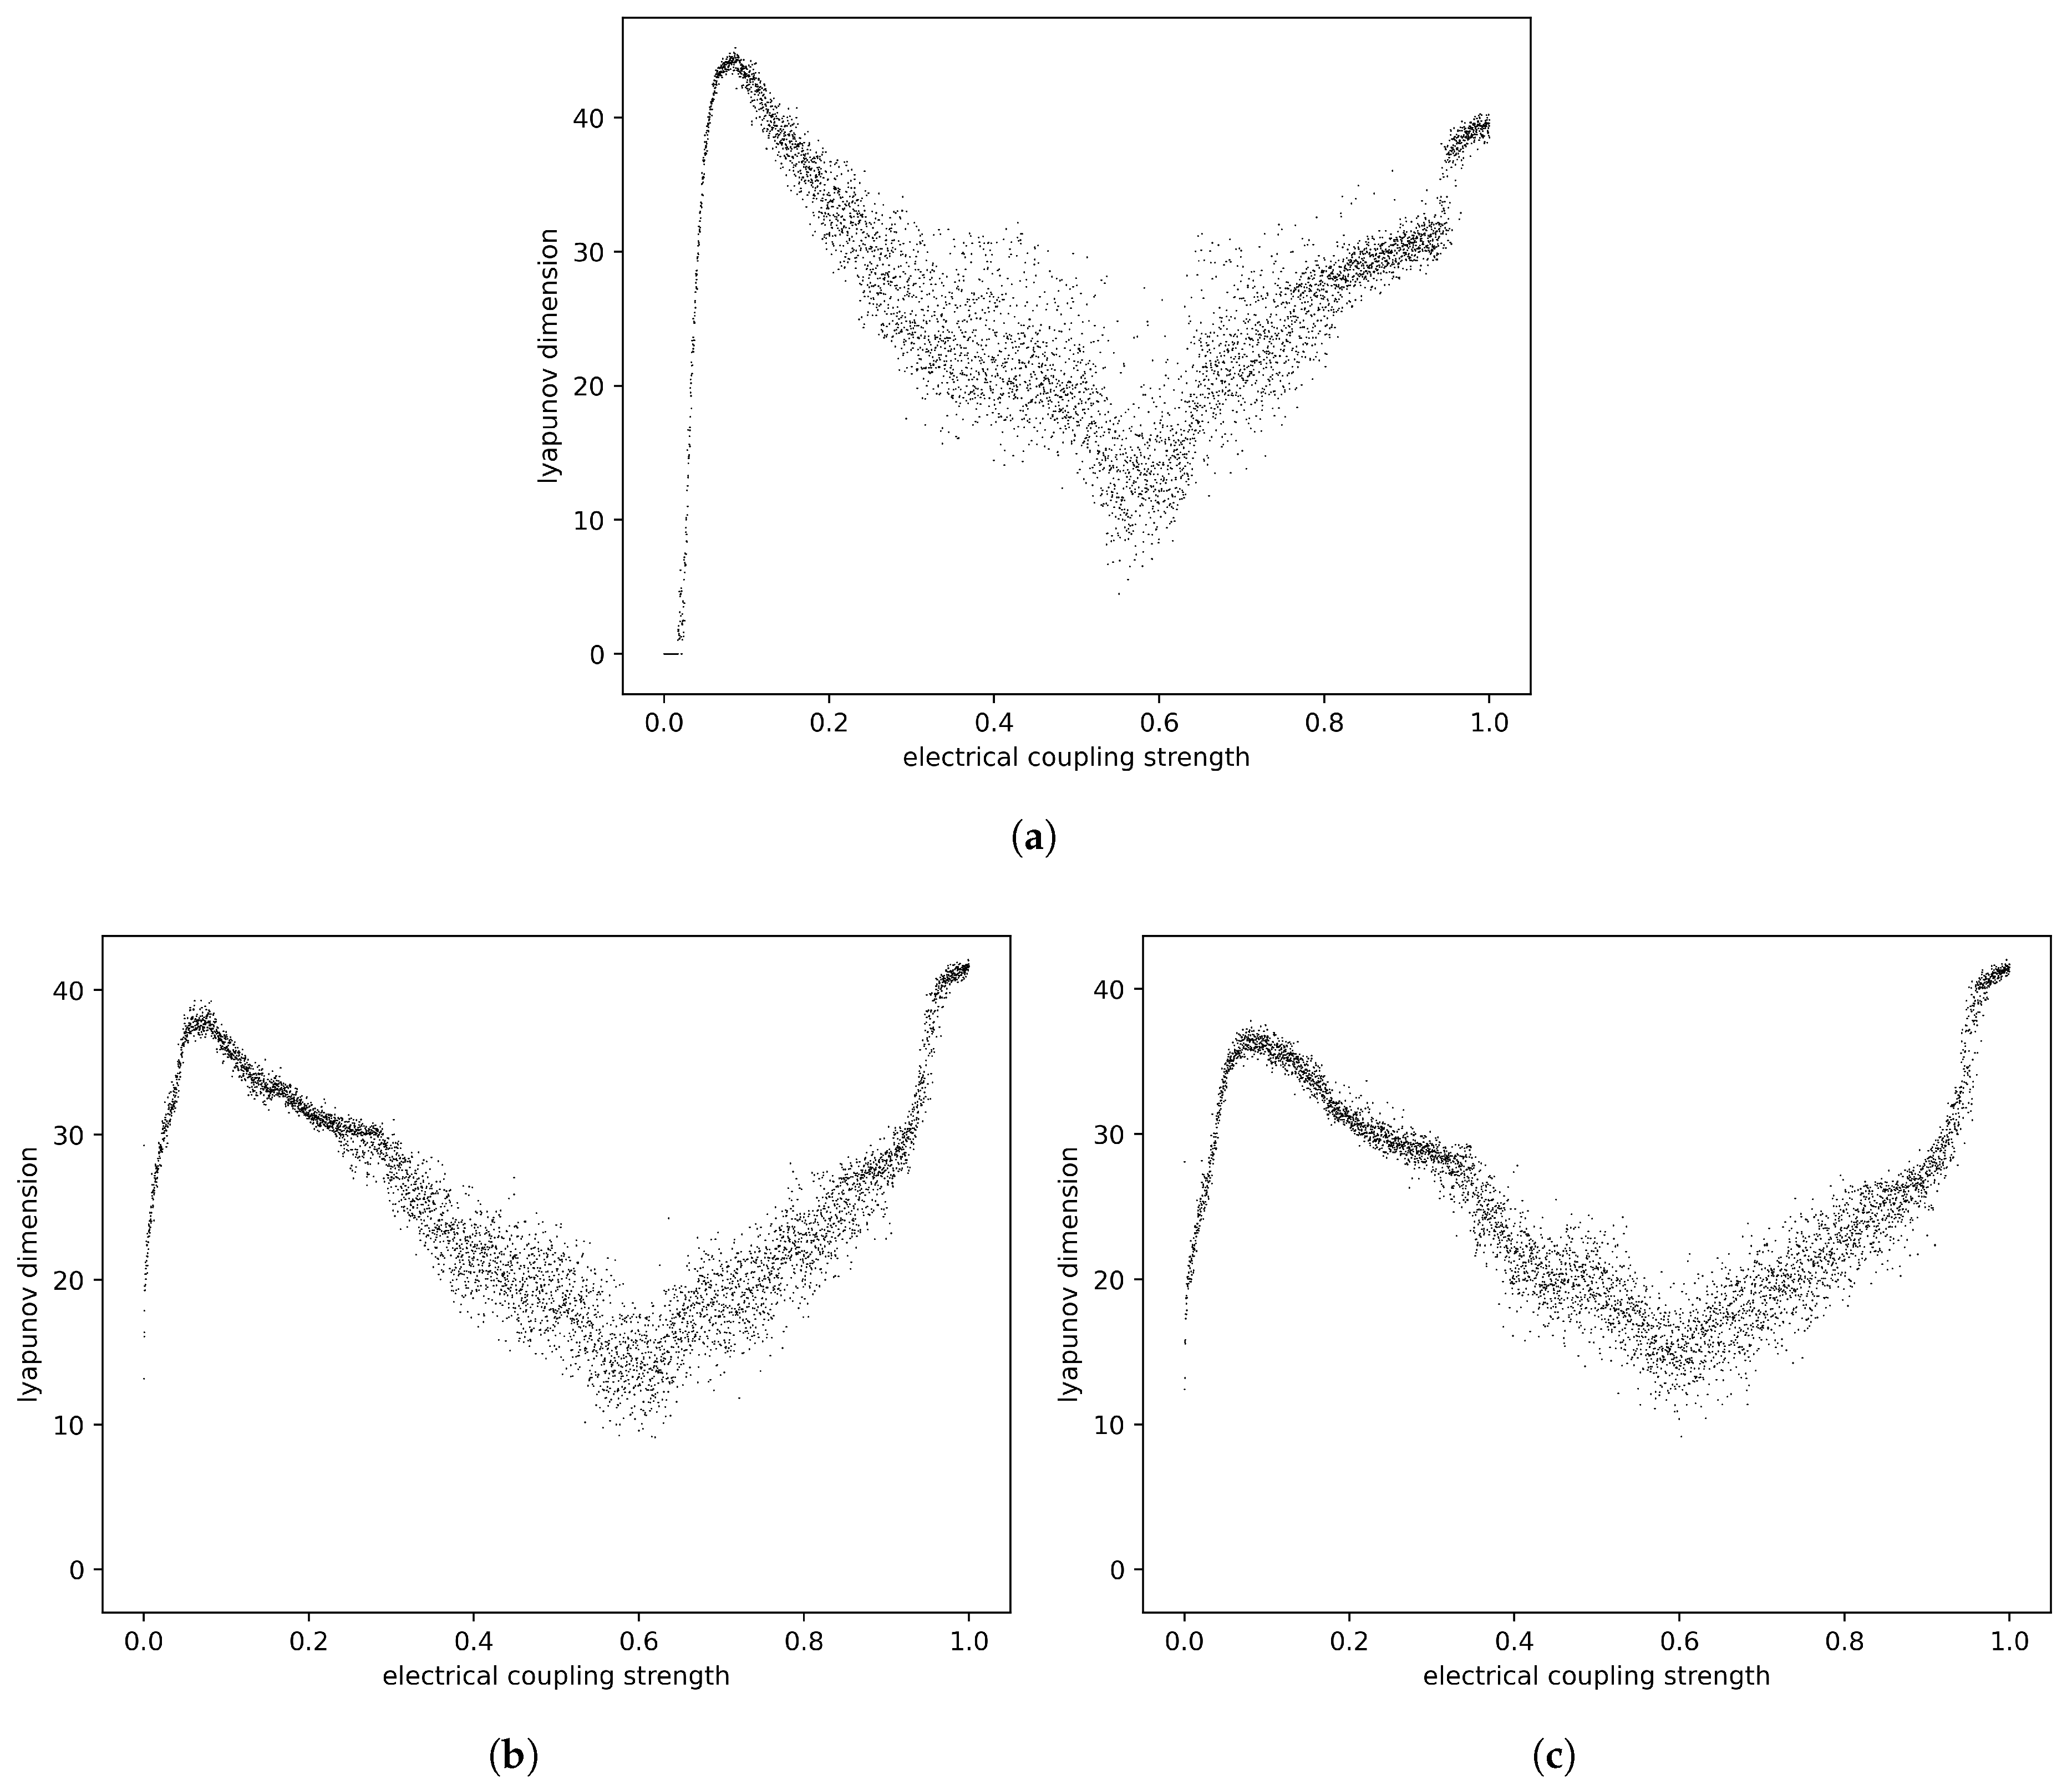
g, which is displayed in
Figure 8. For select values of
g in the homogeneous regime of the system, we also estimate the true fractal dimensions
d of the attractors with significant computation and careful application of Equation (
11). Specifically, points are sampled on the attractors by generating many orbits of length
for a given value of
g, and close values of
are chosen, where the sampled points scale according to their attractor. Then, a linear regression is performed on
vs.
and the slope is taken to be an approximation for
d. The results of this analysis are displayed in
Table 1, where it is clear that the Lyapunov dimension
falls well within a 5% error of the estimated box-counting dimension
d. Within the margin of error in computing the Lyapunov spectrum of orbits on the system’s attractors and box counting on the attractors, this indicates that the Kaplan–Yorke conjecture does hold for this system, so the Lyapunov dimensions will be used as an accurate approximation of the true fractal dimensions of the attractors. This enables us to investigate how the attractor dimensionality evolves with coupling strength across all three regimes of the ring lattice system without exponentially infeasible box counting in high-dimensional space, revealing deep connections between synchronization, chaos, and the underlying geometric complexity of the system’s dynamics.
In
Figure 8, it is immediately clear that all the chaotic attractors of the three regimes of the ring system are fractal, since their dimensions are spread out among different real values, not sticking to any defined integers. The only true integer dimensions in these graphs are on the very left of
Figure 8a, where there are some attractors that have dimension 0. These are associated with the nonchaotic periodic orbit attractors on the left of
Figure 3, which consist of a finite number of zero-dimensional points. One example of these orbits is displayed in the regular spiking of
Figure 2a. Another notable observation is that these attractors take up a large number of dimensions of state space. Because the state space of this system is so large, we might expect the attractors to take up only a small number of its dimensions, but instead, the strange attractors take up a substantial number of them for many values of
g, with some of the largest of these attractors taking up close to 45 of the 60 total dimensions.
Comparing
Figure 8 to the graphs of
vs.
g in
Figure 3 and
Figure 6, it can be seen that the Lyapunov dimension
follows a similar pattern of increasing through the chaotic spiking domain, decreasing as the neurons start to burst in sync with each other, and then increasing again as synchronized hyperchaos is reached. This is to be expected, because the Lyapunov dimension is calculated directly from the set of Lyapunov exponents. There is also a similarity in how the
and
values are distributed across the different regimes. Specifically, the
values are more erratic and spread out in the homogeneous case than they are in the partially and fully heterogeneous cases, which is also reflected in the
values to some degree. Namely, the values of
in
Figure 8a are more vertically spread out in the synchronized bursting domain. There are two main reasons for this difference in variability. The first has to do with the discrete-time nature of the Rulkov model and is similar to the reason for the existence of complex multistability in the homogeneous synchronized bursting regime [
13]. Specifically, because the system is governed by a discrete-time map, a small variation in
g can cause the individually nonchaotic spikes of the homogeneous neurons to lock onto each other with different frequency ratios, leading to more variability in the dynamics of the homogeneous regime and the geometry of its attractors. The second reason for this difference in variability has to do with the fact that the heterogeneous cases of the system contain individually silent and low-frequency bursting neurons (e.g.,
and
in
Figure 4a and
Figure 5a), which lead to more nonchaotic behavior in the synchronized bursting regime (see
and
in
Figure 4c and
Figure 5c). This nonchaotic behavior contributes to the smaller upper bounds of the fractal dimensions in the heterogeneous regime compared to the homogeneous regime and, hence, to lower variability.
In addition to this, there are some very clear differences between the trends of the maximal Lyapunov exponent
and the Lyapunov dimension
. The most apparent difference is in the peaks of the
vs.
g graphs and the
vs.
g graphs, with both peaks in both graphs being associated with chaotic spiking around
and synchronized hyperchaos around
. In the
vs.
g graphs, the peak in the region of synchronized hyperchaos is always higher than the peak in the region of chaotic spiking, a fact that is extremely apparent in
Figure 6 (the partially and fully heterogeneous cases), where the peaks on the right dwarf the peaks on the left. However, in the graphs of
vs.
g, the peaks are similar in height, and in
Figure 8a (the homogeneous case), the left peak is actually higher than the right peak. This means that, for this system, the chaotic spiking attractor that appears when the electrical coupling strength is relatively small has a higher fractal dimension than the attractor that appears when the electrical coupling strength is very large, which is a somewhat surprising result.
To explain these interesting phenomena, we will draw on the connection between dynamics and geometry posited by the Kaplan–Yorke conjecture. First, we address the dramatic difference in the heights of the left and right peaks when comparing the graphs of the maximal Lyapunov exponent and the fractal dimension (
Figure 3,
Figure 6, and
Figure 8). In the region of the right peak, the neurons are exhibiting synchronized, strong chaos, whereas in the region of the left peak, the neurons are exhibiting unsynchronized, weaker chaos. The strength of the chaotic dynamics as a whole is reflected in the maximal Lyapunov exponent, demonstrated in
Figure 3 with a higher right peak and
Figure 6 with significantly higher right peaks. However, when considering the attractor dimensions, the Kaplan–Yorke conjecture indicates that the entire Lyapunov spectrum must be considered. In the region of the right peak, the synchronized chaos is indicative of the strong chaotic dynamics being “connected,” or in the language of Lyapunov exponents, only a few eigenvectors of the Jacobian having positive eigenvalues. In other words, perturbing the system along one of these chaotic directions, indicative of perturbing all of the neurons in the same way, will result in this perturbation growing, but perturbing the system along any of the other directions will result in the perturbation shrinking due to the system falling back into synchronization. However, in the region of the left peak, the unsynchronized chaos is indicative of each neuron having its own “direction” of chaos, which results in many more positive Lyapunov exponents and, according to the Kaplan–Yorke conjecture, a higher fractal dimension. For example, in the homogeneous case, the system has 9 positive Lyapunov exponents for
and 18 positive Lyapunov exponents for
. This explains the dramatic increase in the left peaks compared to the right peaks when comparing
Figure 8 to
Figure 3 and
Figure 6. The differing number of positive Lyapunov exponents also provides a mathematical justification for referring to the various dynamical regimes as synchronized (low number) or unsynchronized (high number). This connection between the number of positive Lyapunov exponents and synchrony is well-established in the literature [
50,
51].
The reversed peak height difference in the homogeneous case’s fractal dimension graph (
Figure 8a) compared to the heterogeneous cases (
Figure 8b,c) can be explained in a similar manner to the aforementioned variability discrepancy between the homogeneous and heterogeneous cases. Specifically, the left peaks of the heterogeneous cases’ fractal dimension graphs are lowered due to the contribution from individual silent and low-frequency bursting neurons, resulting in nonchaotic behavior. However, in the region of the right peak, the effect of heterogeneity is reversed, namely, the right peak is raised because the variations in the individual neurons’ parameters results in greater sensitivity to perturbations and stronger chaotic dynamics in the synchronized hyperchaotic domain (see the right peaks of
Figure 6 vs.
Figure 3), increasing the magnitude of the positive Lyapunov exponents and the fractal dimension. This analysis makes it clear that although the maximal Lyapunov exponent quantifies how chaotic the dynamics on the ring lattice attractors are as a whole, it does not directly correlate to the attractors’ dimensionality or strangeness. To achieve this, as the Kaplan–Yorke conjecture indicates, we need the entire Lyapunov spectrum, which captures more information about the collective dynamics and individual behavior of the coupled neurons.

