Abstract
The Upper Lianggaoshan (LGS) Formation in the northeastern Sichuan Basin, composed of shale with interbedded siltstone, is a promising target layer for shale oil. Accurate evaluation of pore structures is essential for effective exploration of shale oil. This study investigated pore structures of siltstone and shale samples from the Upper LGS Formation using low-pressure CO2 adsorption (LTCA), low-temperature N2 adsorption (LTNA), high-pressure mercury intrusion (HPMI), and nuclear magnetic resonance (NMR) methods. The single-exponent and multifractal dimensions of samples were determined, and the relationships between fractal dimensions and pore structures were explored. Results show that the pore size distribution (PSD) of siltstone and shale samples exhibits multi-peak characteristics, with mesopores (2–50 nm) being dominant in the total pore volumes. The multi-scaled pores in shale and siltstone samples exhibit fractal characteristics. The average values of single-fractal dimensions (D1, D2) obtained by LTNA data are 2.39 and 2.62 for shale samples, and 2.24 and 2.59 for siltstone samples, respectively. Compared to siltstones, the pore structures of shale samples exhibit greater complexity, indicated by larger fractal dimensions. The samples from subsections Liang 2 and Liang 3 exhibit greater heterogeneity compared to subsection Liang 1. The single-fractal dimensions of micropores and mesopores show positive correlations with specific surface area (SSA) and pore volume (PV), while the fractal dimension of macropores shows a negative correlation with average pore diameter and median radius. The average values of single-fractal dimension D3 obtained from HPMI data are 2.9644 and 2.9471 for shale and siltstone samples, respectively, indicating more complex structures of macropores in shale samples compared to siltstone samples. The average value of and singularity strength range Δα obtained by a multifractal model for core samples from subsection Liang 1 are 1.868 and 2.155, respectively, which are the smallest among all of the three subsections, indicating that the heterogeneity of pore structures of subsection Liang 1 is the weakest. This research provides valuable guidance for shale oil development in the northeastern Sichuan Basin, China.
1. Introduction
Unconventional crude oil is crucial for stabilizing China’s oil production, especially in shale formations rich in organics. Unlike conventional siltstone reservoirs with predominantly micron-sized pores, shale reservoirs feature mainly submicron and nanometer-sized pores, leading to a more complex pore structure [1,2]. The evolution of these systems and changes in secondary structures due to stratigraphic processes significantly impact oil and gas generation, storage, and transport [3]. Therefore, developing shale oil requires precise evaluation of pore structure and suitable extraction techniques. Microscopic pore structures, including pore morphology, porosity, permeability, pore size distribution (PSD), and specific surface area (SSA), are crucial for assessing unconventional resources like shale oil [4,5].
Numerous laboratory techniques are adopted to characterize the complex pore structure of shales both qualitatively and quantitatively. Clarkson et al. pioneered the integrated application of LTCA, LTNA, and HPMI to characterize North American shale reservoirs, establishing the first comprehensive multi-technique framework for analyzing complex pore systems in unconventional formations [6]. Based on this framework, Liu et al. conducted a fractal dimension analysis of pore structures using low-pressure N2 adsorption data, further advancing the quantitative characterization of continental shale reservoirs [7]. Yan et al. analyzed the NMR T2 spectra for low-permeability sandstones with multifractal theory, and quantitatively evaluated the fractal characteristics of pore structures based on the α-f(α) relationships [8]. However, each method has its pros and cons [9]. Gas adsorption experiments are effective in characterizing nanopores smaller than 200 nm in diameter and can provide information on SSA, PV, and PSD [10,11]. HPMI can capture a wide range of PSDs, with the lower limit for pore–throat measurement depending on the maximum mercury injection pressure [12,13]. The integration of gas adsorption and HPMI can thus provide a thorough characterization of full-scale pore features of shales. Specifically, LTCA is used to characterize micropores, LTNA for mesopores, and HPMI for macropores [14,15]. The NMR, as an efficient and non-invasive technique, is widely employed for characterizing pores in diverse formations, including conventional sandstones, siltstones, and unconventional shales [16,17]. Relaxation times and peak positions in the T2 spectrum are adopted based on their ability to interpret the PSD in rock samples [5,18].
Fractal theory, which can offer insights into the complex pore structure of unconventional shale reservoirs with predominantly nanometer-sized pores, has gained increasing application in analyzing complex pore systems of shales [19,20,21,22]. Ji et al. found that for the Lower Silurian Longmaxi shale samples, the fractal dimension could be regarded as an indicator for methane adsorption capacity [23]. Tang et al. analyzed the fractal characteristics of shales at various evolutionary levels based on LTNA and FE-SEM data, and discussed the geological significance of the fractal dimension in describing the pore structure of terrestrial shales [24].
The Sichuan Basin, the largest natural gas reserve in China, is a petroliferous basin containing several hydrocarbon-bearing formations. The Triassic and underlying strata are potential natural gas targets, while the Jurassic strata are the only oil-producing systems [25]. Well Ping’an 1 in the Sichuan Basin achieved significant industrial oil production in 2020, with its daily production exceeding 110 m3 from the Jurassic LGS Formation, making a significant advancement in the development of Jurassic shale oil within the basin. Affected by tectonic movements in the Sichuan Basin during the Jurassic sedimentary period, the depositional environment of the LGS Formation is rather complex, with rapidly changing sedimentary facies. These phenomena result in the presence of sedimentary mud shale with interbedded layers of siltstone rocks, significantly increasing the heterogeneity of pore structures, the storage capacity of hydrocarbon, and variations in oil production across different wells [26]. Recent exploration and assessment have demonstrated the prospect for shale oil exploration in the LGS formation of the northeastern Sichuan Basin. However, compared to lacustrine shale strata in other basins in China, the pore structure characteristics and corresponding fractal characteristics reflecting pore complexity in the study area have not been clarified. Additionally, the differences between pore structures of shales and interbedded siltstones have not been made clear, hindering the efficient exploitation of shale oil in the Sichuan Basin.
This study collected and analyzed shale and siltstone samples from the LGS Formation in the northeastern Sichuan Basin. The NMR, HPMI, LTCA, and LTNA techniques were employed to conduct a systematic analysis of the pore structure characteristics of core samples from different subsections. PSD, SSA, and other pore structure parameters were quantified for each core sample, and the fractal characteristics of multi-scaled pore spaces in core samples of different lithologies were discussed. In addition, the full-scale PSD curves derived from a combination of LTNA, LTCA, and HPMI data were compared against NMR T2 spectra, and the conversion coefficients of NMR T2’s relaxation time and pore width for the study area were obtained. This research is helpful for storage capacity evaluation and the determination of favorable development sections of the LGS Formation, and thus can provide guidance for efficient exploration of shale oil in the Sichuan Basin.
2. Geological Background
The study area is in the transitional zone between the Northern Sichuan Gentle Structural Zone and the Eastern Sichuan Steep Structural Zone (Figure 1a). Due to the multi-stage tectonic activities of the Micang and Daba Mountains, the northeastern Sichuan area has experienced retrogradation and overturning, leading to the creation of the Micang-Daba Mountain Foreland Basin [9,27,28]. The Jurassic stratigraphy, the only oil-bearing stratigraphy in the Sichuan Basin, is classified into five formations, including the Lower Jurassic Ziliujing (ZLJ) Formation, the Middle Jurassic Liangaoshan (LGS) and Shaximiao (SXM) Formations, and the Upper Jurassic Suining (SN) and Penglaizhen (PLZ) Formations, from the bottom to the top [29,30].
This study focuses on the LGS Formation, which is predominantly composed of fine-grained sediments. Based on the rock assemblage and sedimentary cycle features, the LGS Formation is subdivided into the Upper and Lower LGS Formations. The Lower LGS Formation mainly consists of purple–red mudstone, gray–green siltstone, and fine sandstone, while the Upper LGS Formation is characterized by organic shales interbedded with siltstones (Figure 1b). Previous studies and the actual exploration show that organic shales are mainly found in the Upper LGS Formation, where significant breakthroughs in shale oil production have been achieved, making it the primary target for shale oil exploration. From bottom to top, the Upper LGS Formation is subdivided into the following subsections: Liang 1, Liang 2, and Liang 3 [27,31]. The lithology of these three subsections is predominantly shale, with varying thicknesses of interbedded siltstone.
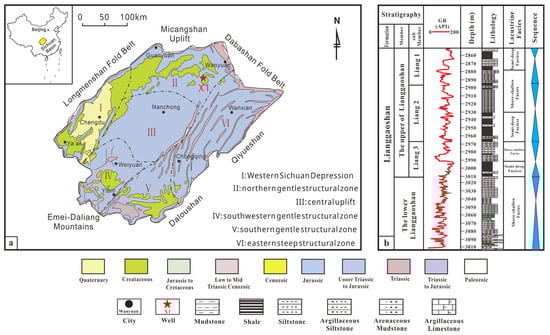
Figure 1.
(a) Tectonic plan of the Sichuan Basin. (b) Comprehensive histogram of the LGS Formation in X1 Well (modified after Wang et al., 2024 [32]).
Figure 1.
(a) Tectonic plan of the Sichuan Basin. (b) Comprehensive histogram of the LGS Formation in X1 Well (modified after Wang et al., 2024 [32]).
3. Methods
3.1. Experimental Samples
A total of 44 core samples were obtained from three subsections of the Middle Jurassic LGS Formation from well X1, with depths spanning from 3012.8 m to 3145.1 m, from well X1 (Figure 1a). To compare and reveal the pore structure differences between organic shale and siltstone samples, both shale samples and siltstone samples were collected from different subsections. In all, 22 of the 44 core samples are organic shale samples, and 22 core samples are siltstone samples. The samples underwent various experiments for quantitative pore structure characterization.
3.2. Gas Adsorption Experiments
LTNA and LTCA were performed on shale and siltstone samples using the QuantaChrome Autosorb IQ automatic surface analyzer (Microtrac, Haan, Germany) to determine their pore structure characteristics. Before the experiment, approximately 2–5 g of the crushed sample (60–80 mesh) were washed to extract organic fluids from the samples, and the crushed samples were subjected to vacuum drying at 105 °C for 24 h. The powdered samples were placed in the analyzer and subjected to outgassing at 300 °C for 24 h to eliminate water and volatile gases, then the nitrogen adsorption–desorption isotherms were measured at 77 K using liquid nitrogen. During the test, the nitrogen adsorption isotherm was measured as the relative pressure (P/P0) increased from 0.001 to 0.995, and the nitrogen desorption curve was then recorded by decreasing the relative pressure from 0.995 to 0.001. The Barrette–Joyner–Halenda (BJH) and Brunauer–Emmett–Teller (BET) models were applied to determine the PSD and SSA of the samples, respectively. Similar to LTNA, the CO2 adsorption measurement was conducted at 0 °C (273 K), with the P/P0 ranging from 0.0001 to 0.03. The density functional theory (DFT) was adopted to analyze the CO2 adsorption data in order to determine the micropore (<2 nm) structure parameters of the samples.
3.3. HPMI
Fourteen core samples were analyzed using the PoreMaster 60 GT Automatic Mercury Porosimeter (Anton Paar QuantaTec Inc., Boynton Beach, FL, USA). The cubic samples were prepared and dried at 105 °C for 48 h, subsequently cooled to room temperature, and tested with mercury, which has a surface tension of 480 mN/m and a contact angle of 140°. During the test, the maximum injection pressure is about 220 MPa. By applying mercury intrusion data and the Washburn equation, the PSD and relevant pore structure parameters of the tested samples can be obtained.
3.4. NMR
Twelve core samples were analyzed using an NMR analyzer (MesoMR23-040V) produced by Niumag Corporation, Suzhou, China. The instrument had a homogeneous permanent magnet with a 0.5 ± 0.08 T field strength and a 60 mm probe coil diameter. Cylindrical core samples, approximately 1 inch in diameter, were prepared for NMR tests. The samples were extracted with organic solvent and heating to fully remove oil and water in the samples, and the T2 spectra of the dried samples were measured. After that, the samples were placed in a vacuum for over 48 h and then saturated with diesel serving as the probe liquid under the pressure of 20 MPa. After 72 h of saturation, the core samples were weighed and tested to obtain NMR T2 spectra. In all of the NMR tests conducted in this study, the CPMG echo sequence was applied to obtain the distribution of the T2 relaxation time. Since the hydrogen in the rock skeleton and clay structure water affect the NMR signal, the NMR relaxation signal of the dry sample was subtracted from the saturated sample to obtain the true NMR signal of the saturated fluid in the core.
The T2 relaxation time in porous media is directly related to the pore–throat diameter (Equation (1)). Based on the NMR T2 spectral distribution, the full-scale PSD of the core samples can be obtained.
where d is pore diameter, nm; C is conversion coefficient of pore diameter, nm/ms.
Equation (1) indicates that once C is known, the NMR T2 relaxation time can be used to determine the PSD of the porous rock sample. This conversion factor C can be determined by comparing the T2 spectra to the PSD obtained by LTCA, LTNA, and HPMI for the same sample or samples from the same formation.
3.5. Single-Exponent Fractal Analysis Based on LTNA and HPMI
Fractal theory is commonly adopted to characterize the roughness and complexity of pore surfaces and structures [33]. It asserts that self-similar natural systems exhibit similar structural features across various scales, represented by the fractal dimension D [34,35]. Typically, the D of heterogeneous porous media (e.g., coal and shale reservoirs) is between 2 and 3. A fractal dimension near 2 indicates a relatively smooth surface and less complex pore structure, while the opposite is true for a dimension near 3 [20,36,37,38,39]. Considering the complexity and strong heterogeneity of multi-scaled pores in shales, LTNA data were adopted to characterize the fractal property of micropores and mesopores, while HPMI data were used for the fractal dimension analysis of macropores.
Primary methods for determining the D value of core samples through nitrogen adsorption isotherms include the Frenkel–Halsey–Hill (FHH) and Neimark–Kiselev (NK) models, with the FHH model often being preferred for its computational efficiency and effectiveness [40,41], which can be expressed as follows [42]:
where P is the equilibrium pressure during the LTNA experiment, MPa; P0 is the saturated vapor pressure of nitrogen, MPa; K is the slope of the plot, which helps determine the value of D; and C is the intercept.
Equation (2) indicates that the plot theoretically conforms to a straight line. When the nitrogen adsorption is controlled by multilayer adsorption and capillary condensation (i.e., P/P0 > 0.45), there exists the following relationship D1 = K + 3, and the D1 mainly reflects the complexity of pore structures. When the P/P0 < 0.45, nitrogen adsorption is primarily governed by van der Waals forces, resulting in a monolayer adsorbed film. The above correlation becomes D2 = 3K + 3, and D2 mainly reflects the roughness of pore surfaces [40,43].
HPMI data were adopted to analyze the fractal characteristics of macropores [44]. Previous studies have presented detailed derivation of the capillary pressure fractal model [45,46,47], and the fractal dimension is finally given by the following equation:
where D3 denotes the fractal dimension determined by HPMI data; Pm is the capillary pressure of a throat with radius r, MPa; Pmin represents the capillary pressure of the maximum throat, MPa; and SHg is the cumulative PV fraction for pore radii smaller than r, %.
For a given core sample, the Pmin in Equation (3) is a constant. As a result, D3 can be determined once the slope of the log (Pm) versus log (1 − SHg) plot is obtained.
3.6. Multifractal Analysis Based on NMR
The single-fractal dimension, obtained by LTNA or HPMI, reflects the overall heterogeneity of pores at different scales, and it has limitations in comprehensively characterizing the local scale properties of the multi-scaled pores in shales. In contrast, the multifractal model can provide more detailed quantitative information about complex pore structures. This study adopted the box-counting algorithm to quantitatively analyze the multifractal characteristics of micro- to macropores in samples from the Upper LGS Formation, based on the comprehensive PSD data obtained through NMR experiments [48,49]. According to the principle of the box-counting method, the comprehensive PSD data obtained from NMR are treated as the dataset length, H. The dataset was subsequently divided into N(ε) boxes, each having an equal size of ε. Based on the dichotomous division principle, the size of each box, ε, can be determined by (where k = 0, 1, 2, …, kmax, and ). Then, the probability density distribution of the ith box, Pi(ε), can be calculated by [50]
where Ni(ε) represents the cumulative PV of the ith box; refers the total PV of the sample, i.e., the cumulative PV of all of the N(ε) boxes.
For pore structures exhibiting multifractal characteristics, the probability density function Pi(ε) and the box size, ε, satisfy the following power–law relationship:
where αi is the singularity index, reflecting the singularity strength of the Pi(ε).
If we use Nα(ε) to denote the number of boxes for which the Pi(ε) of the ith box has the same value of α, then Nα(ε) increases with decreasing ε. The following relationship between Nα(ε) and ε holds:
where f(α) is the multifractal spectrum, which indicates the fractal dimension of a subset with an identical singularity index.
For a specific box size ε, the partition function of order q, , is expressed as
where q is the index representing the fractal characteristics at various scales, and it ranges from −∞ to +∞. In the actual calculation, the value of q is always selected within the range [−0, 10]. τ(q) represents the mass scaling function of order q and is given by the following Equation.
α(q) and f(α) are derived from the Legendre transformation, as follows:
The α~f(α) curve, i.e., the multifractal singular spectrum, can reflect the heterogeneity of PSD, and a larger value of Δα (αmax − αmin) always denotes a more heterogeneous pore structure.
Dq corresponding to the index q is expressed as follows:
With the above equations, the generalized dimension Dq corresponding to various values of q can be determined, and the corresponding Dq ~q spectrum can be plotted.
4. Results and Discussions
4.1. Pore Structure Characteristics
4.1.1. Pore Structure Characteristics Based on LTCA
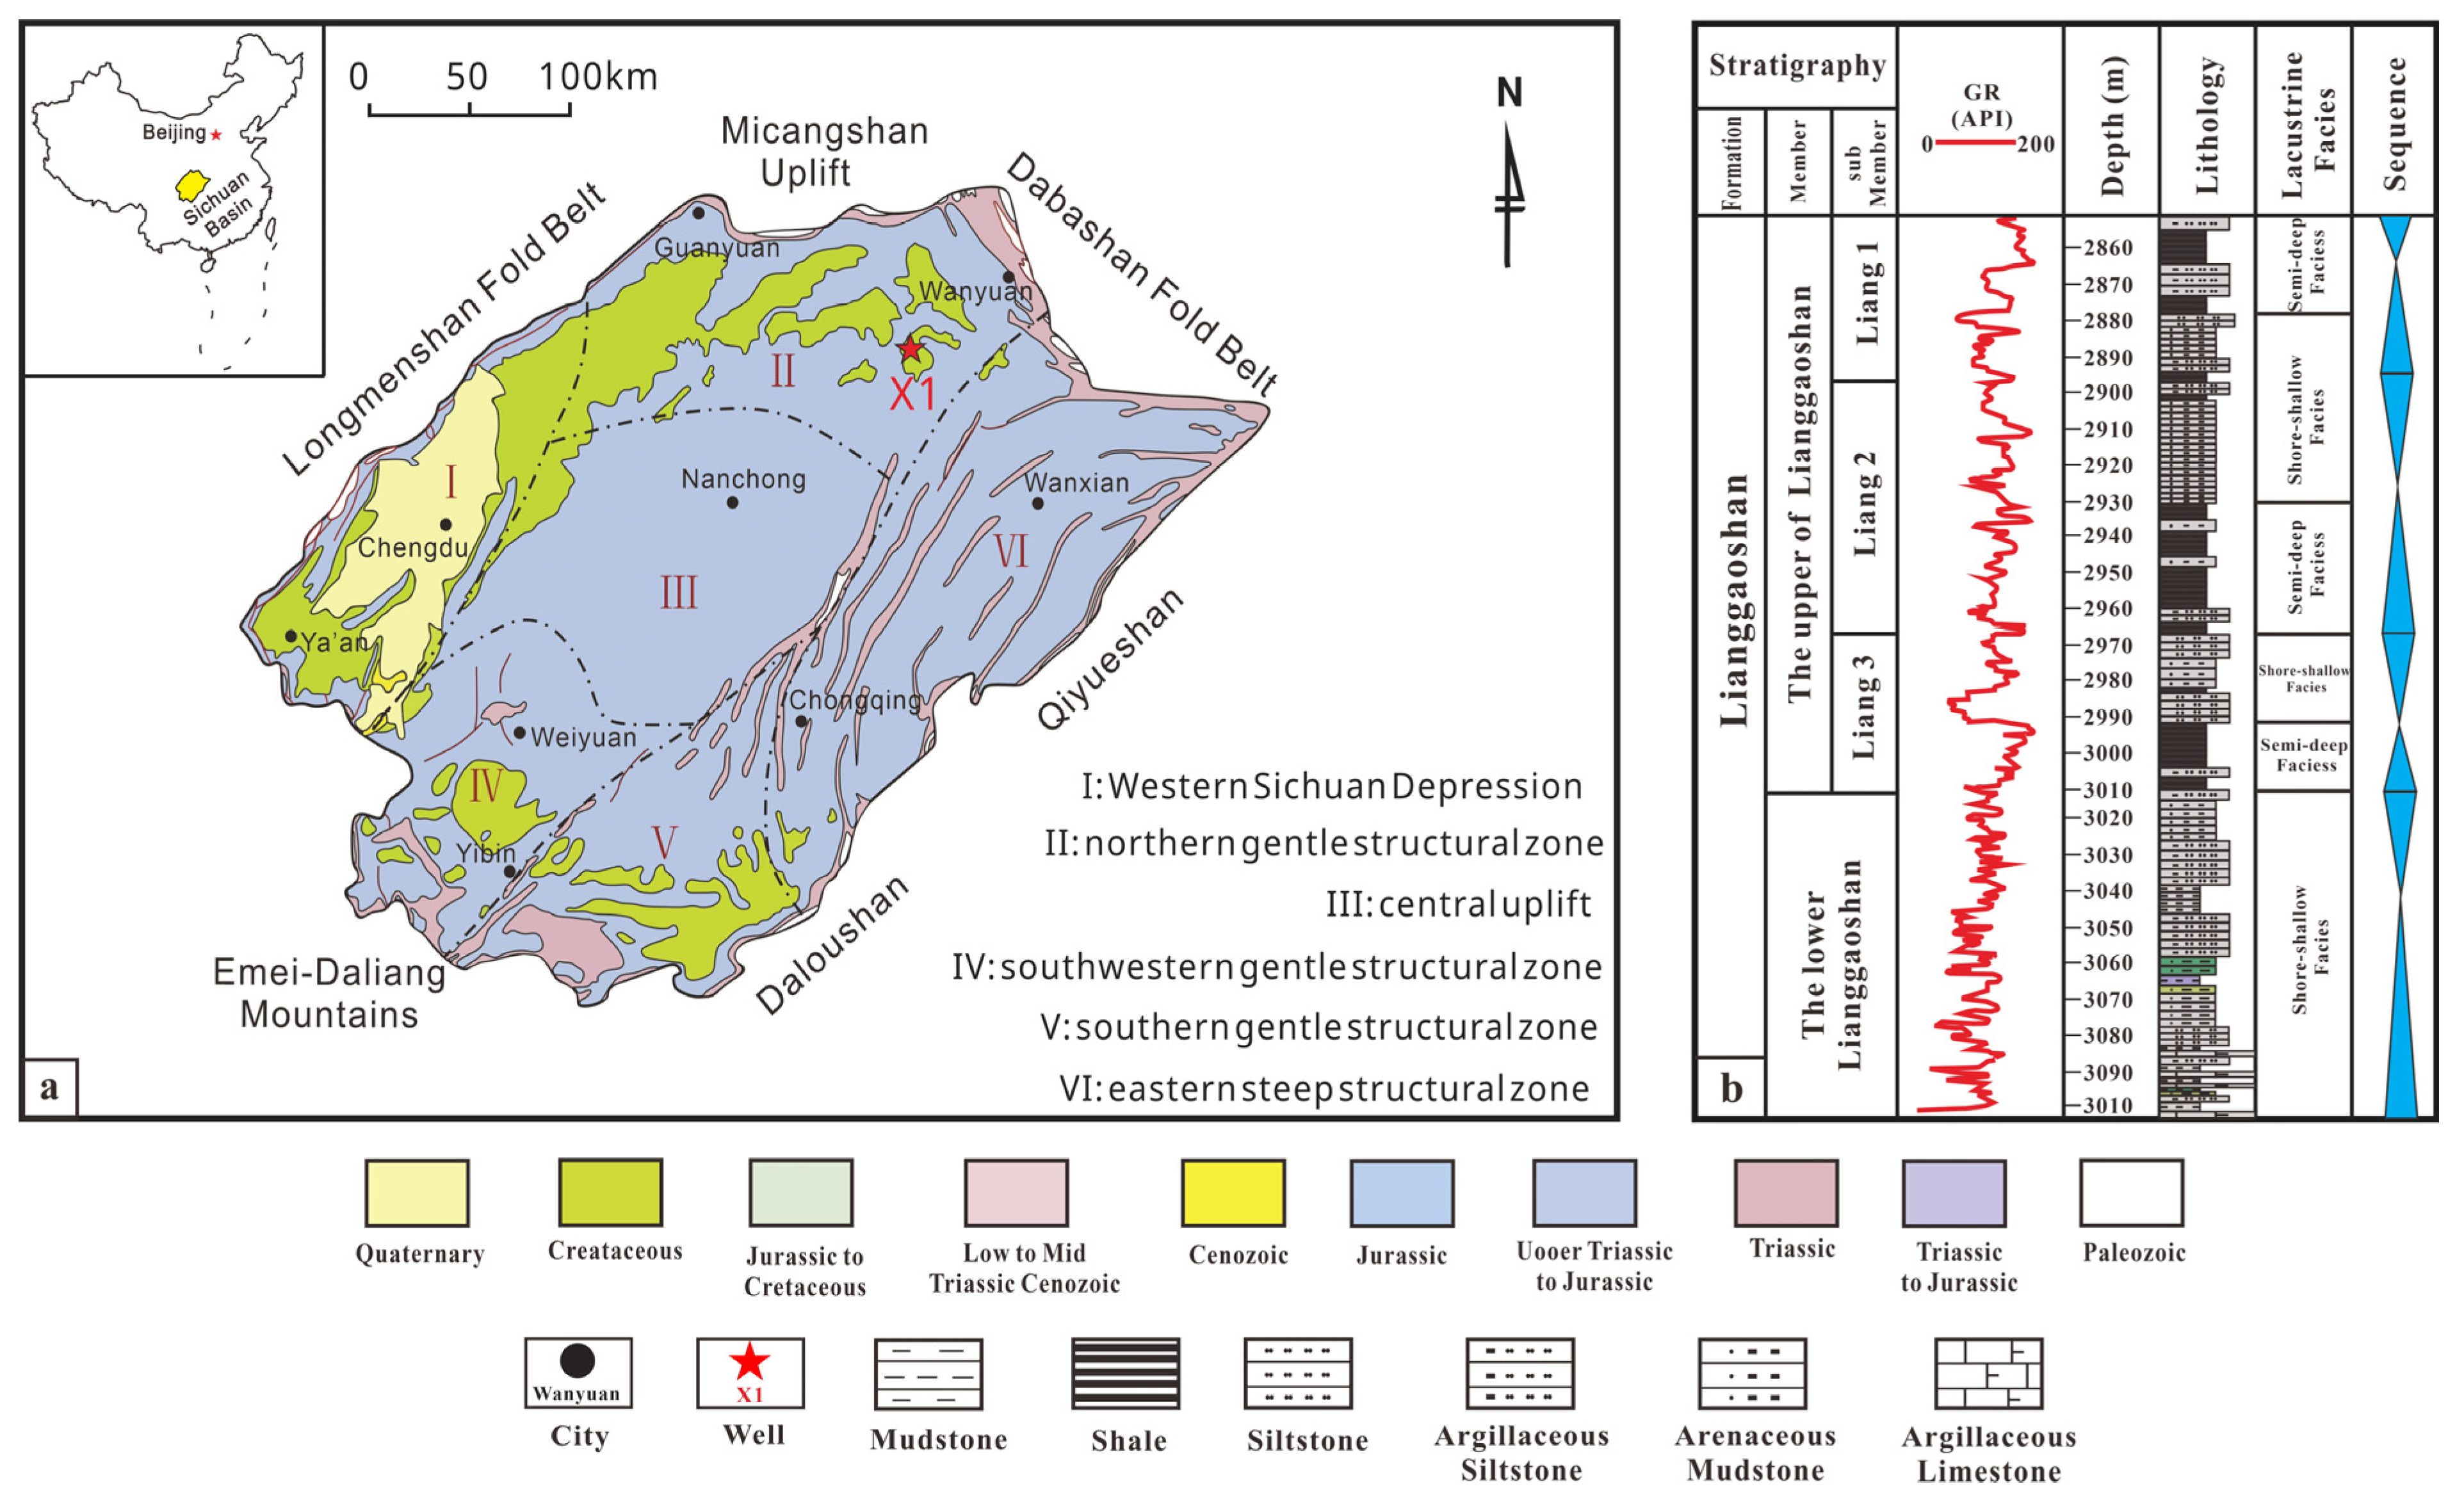
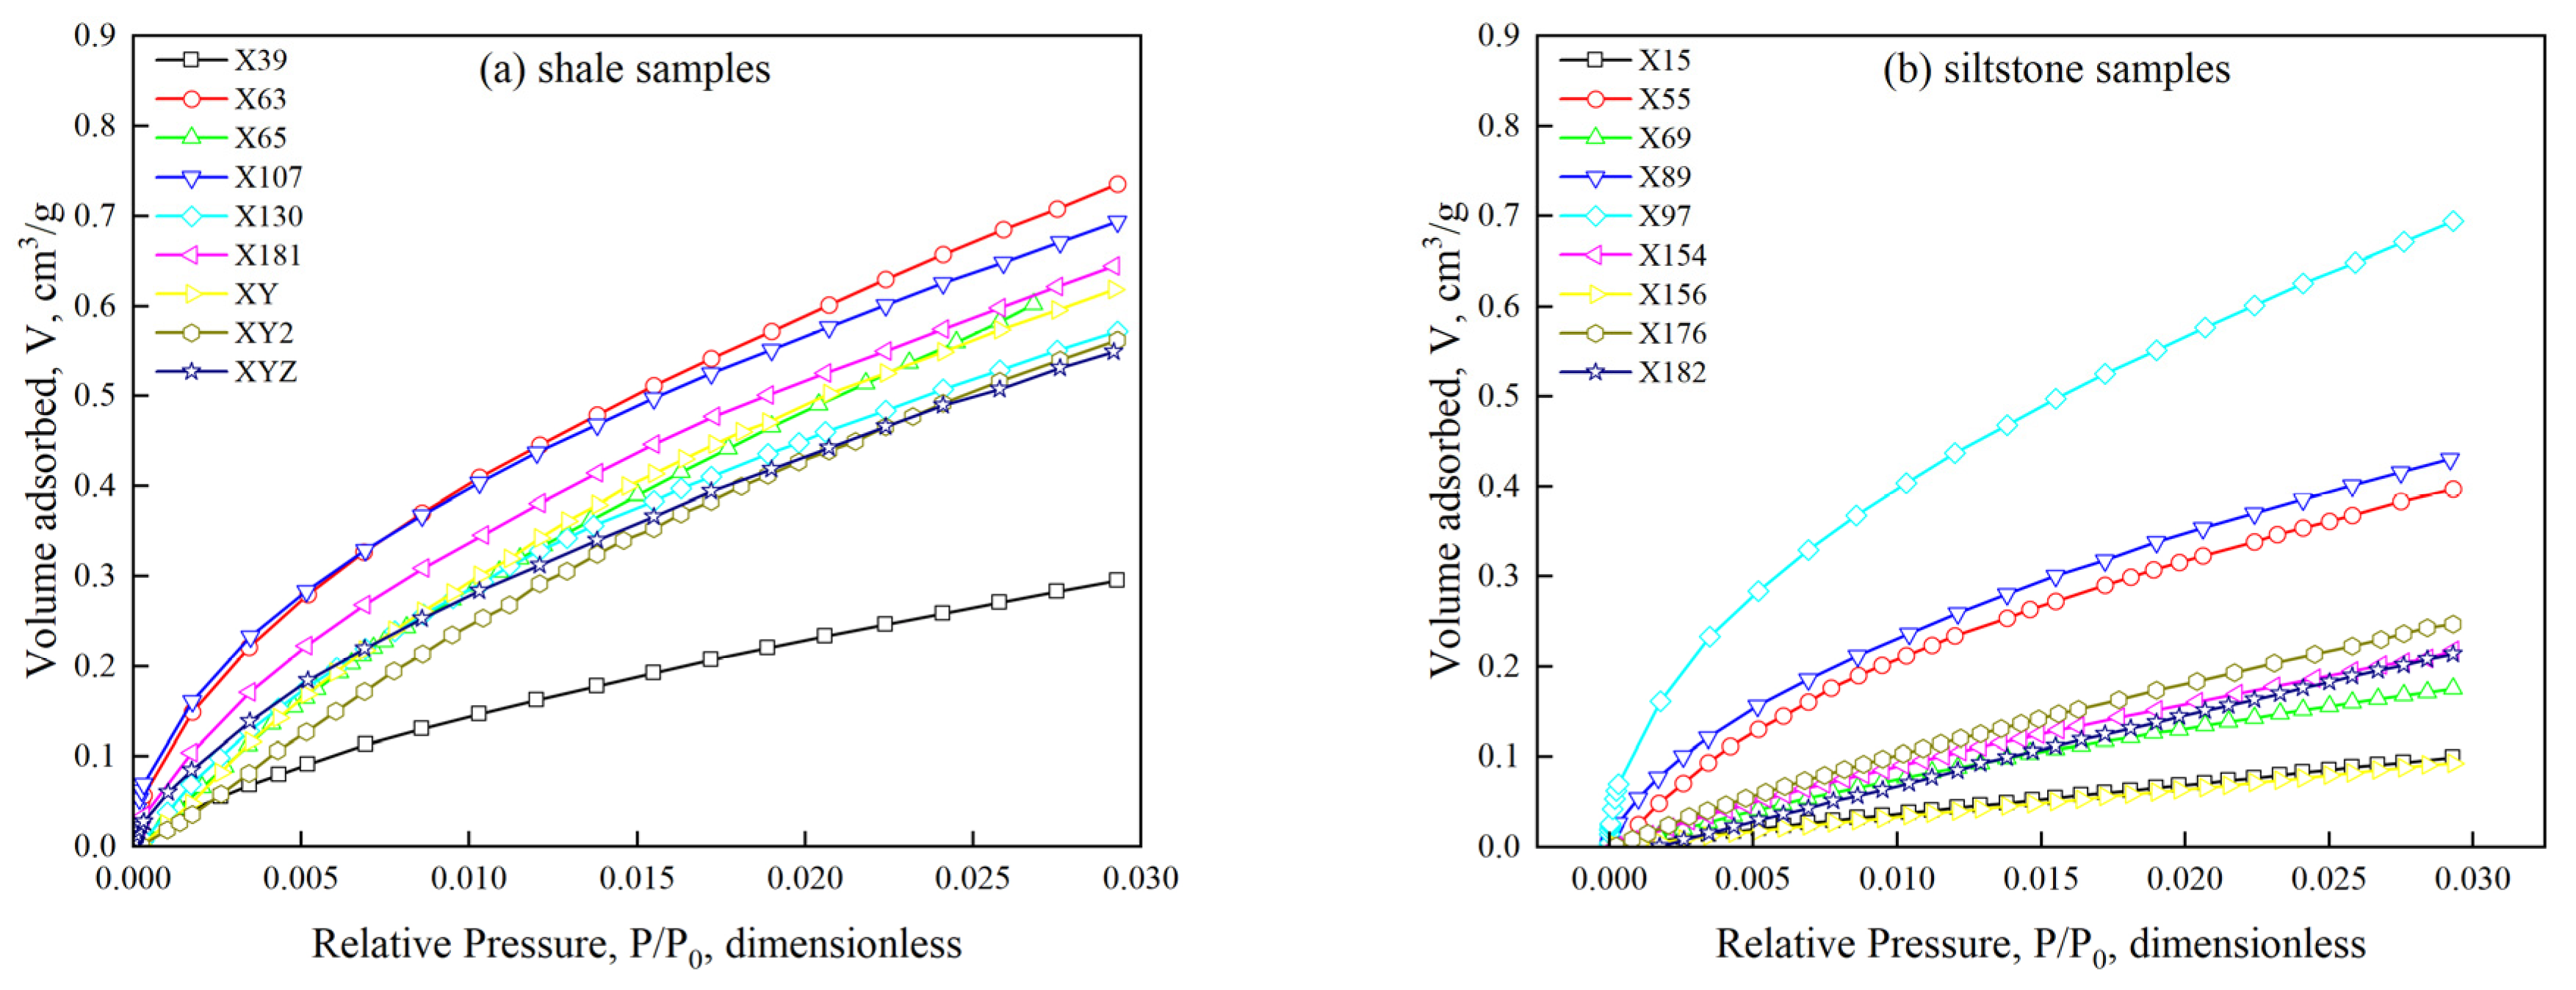
Figure 2 illustrates the LTCA adsorption isotherms of the tested samples from the Upper LGS Formation. According to the isotherm curve categories defined by IUPAC, these isotherms are predominantly type I, indicating that CO2 is primarily adsorbed in monomolecular layers. When P/P0 increases from 0 to approximately 0.03, the adsorbed volume of CO2 first increases rapidly, followed by a slow increase. The maximum adsorption capacities (at P/P0 about 0.03) for the various core samples varied between 0.0932 and 0.7359 cm3/g. Comparatively, the CO2 adsorption capacities (average maximum CO2 adsorption volume) of shale samples (0.5860 cm3/g) are higher than those of siltstone samples (0.2855 cm3/g).
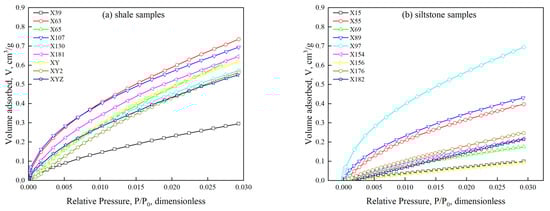
Figure 2.
CO2 adsorption isotherms of samples from the Upper LGS Formation. (a) Shale samples; (b) siltstone samples.
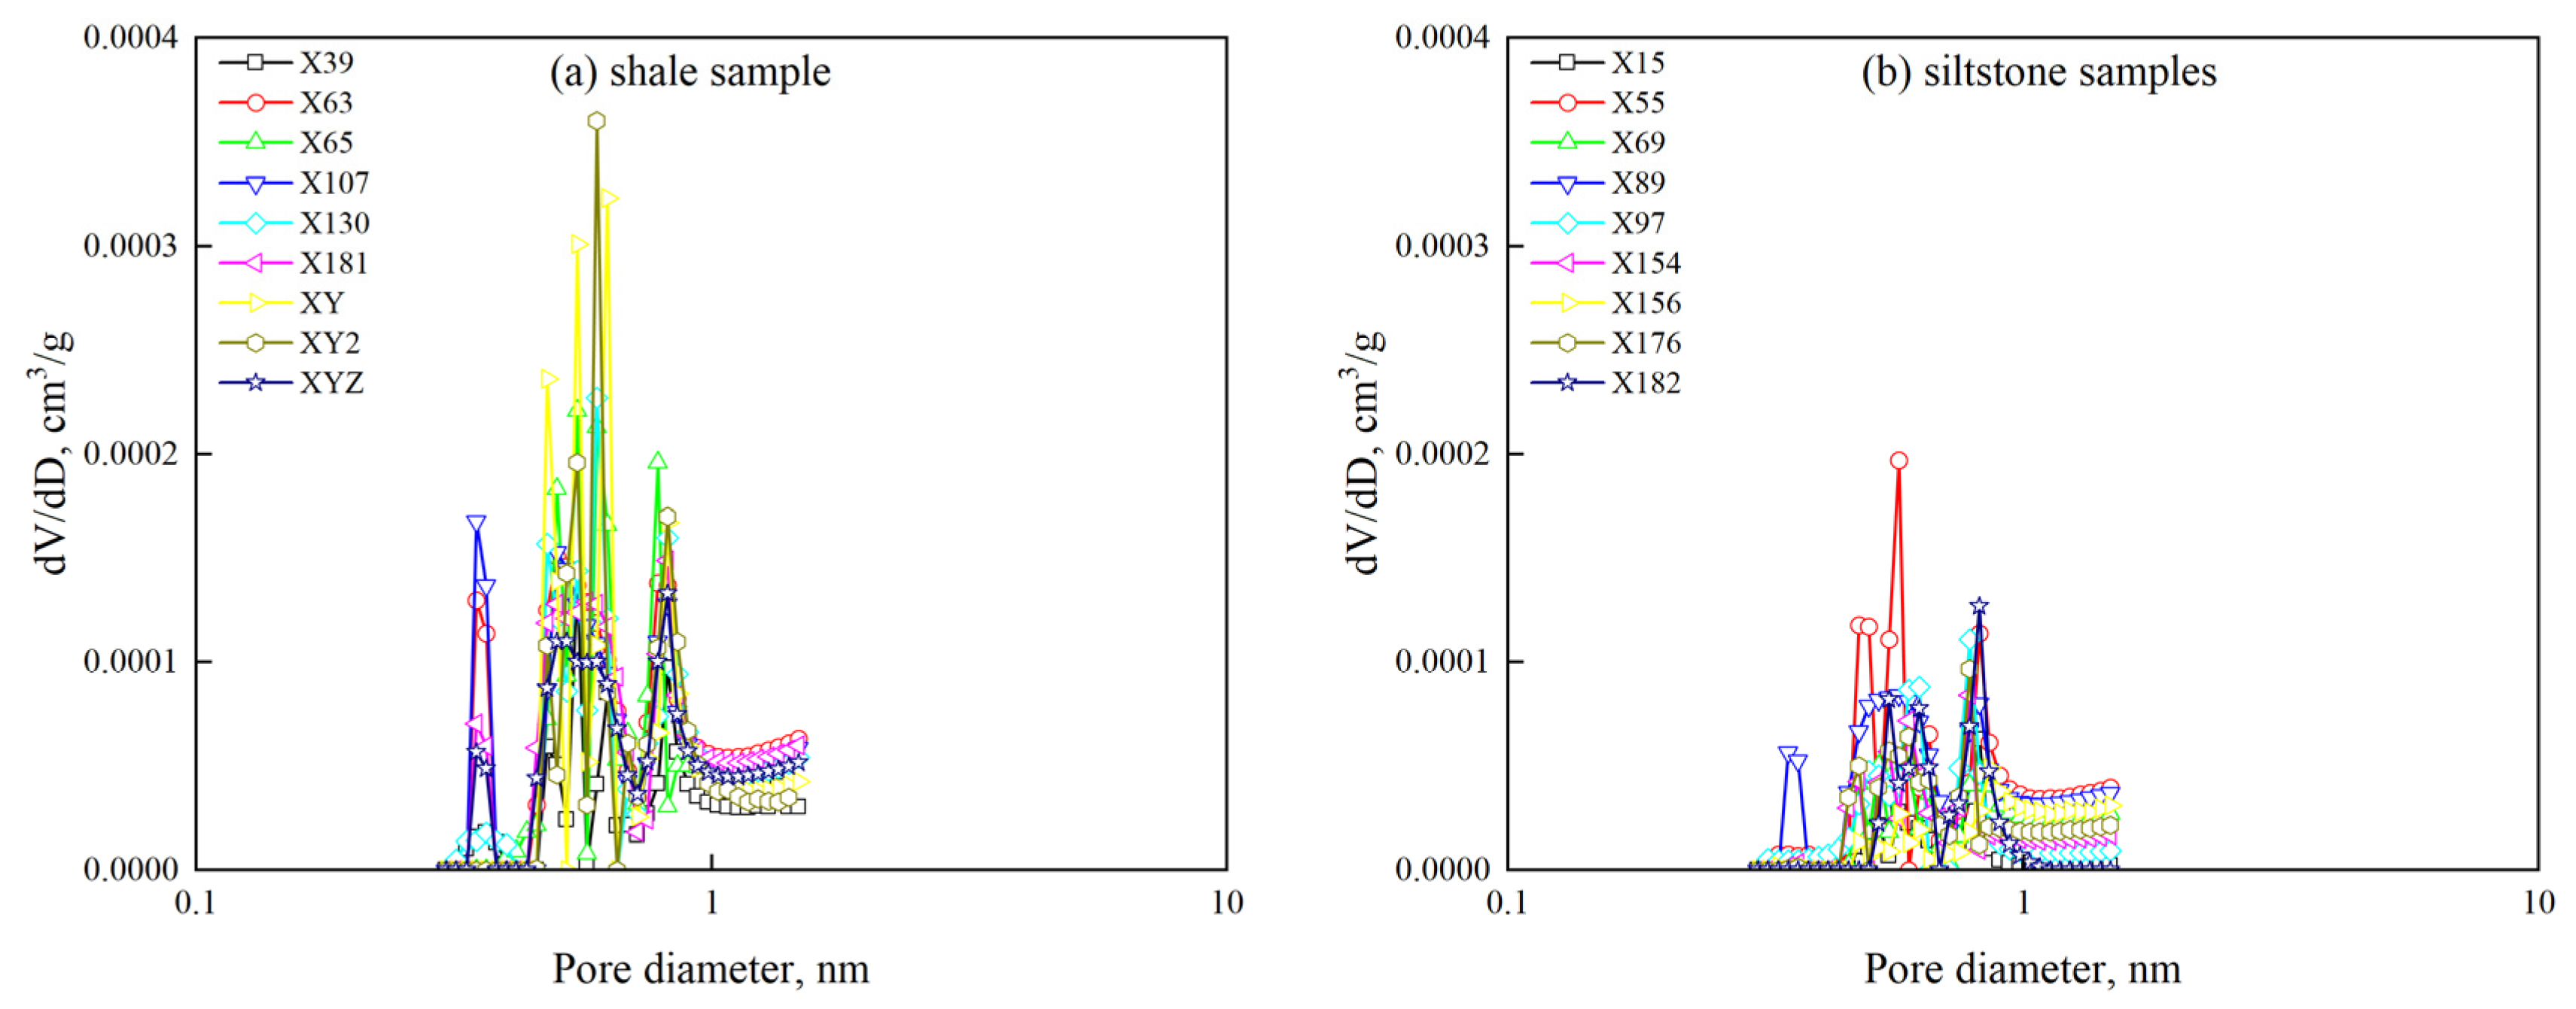
Figure 3 illustrates the PSD curves of micropores obtained by the DFT model based on LTCA data. It is evident that these PSD curves exhibit multi-peak distributions for all samples. In general, shale samples have greater micropore volumes compared to siltstone samples, but the dominant pores in the siltstone samples are larger than those in shale samples. The main peaks of PSD curves in the micropore range (<1.5 nm) of shale samples are around pore diameters of 0.5 nm to 0.6 nm, whereas, in siltstone samples, the main peaks correspond to pore diameters of about 0.8 nm, with the exception of sample X55.
Figure 3.
Pore size distribution (PSD) curves of samples from the Upper LGS Formation obtained from the LTCA data using the DFT method. (a) Shale samples; (b) siltstone samples.
4.1.2. Pore Structure Characteristics Based on LTNA
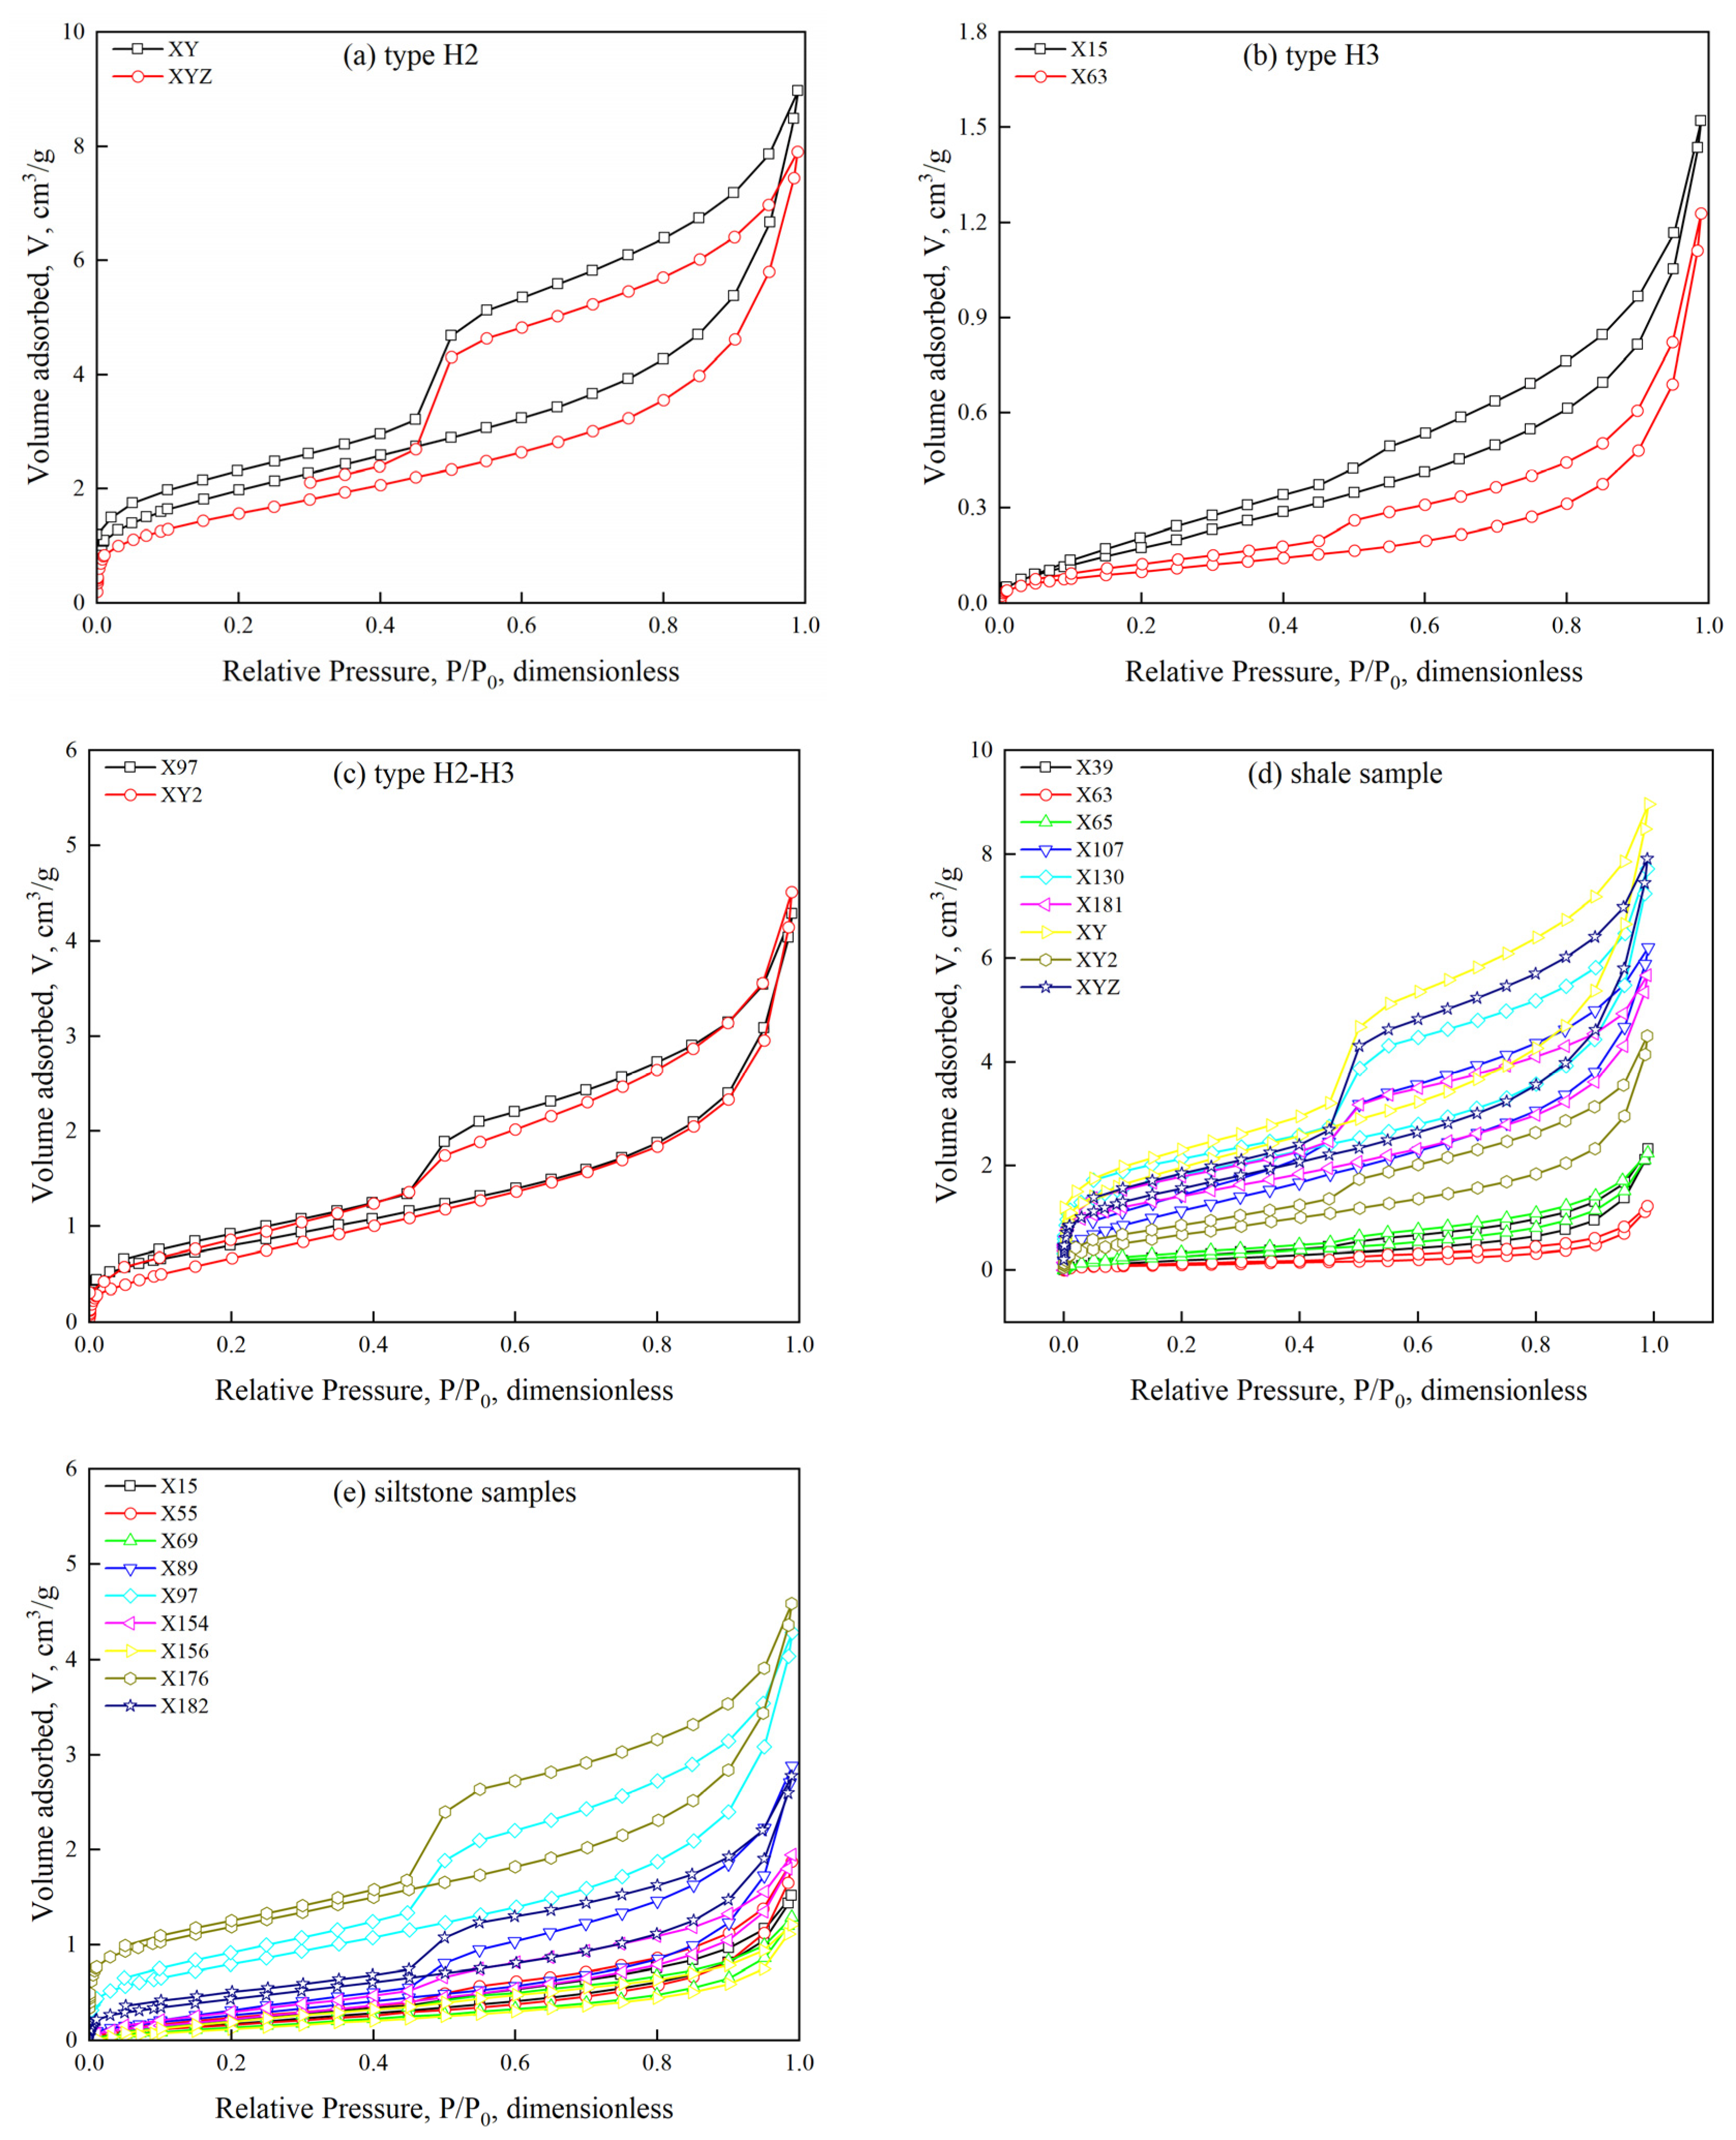
LTNA experiments can accurately characterize the PSD of mesopores (2–50 nm). Additionally, pore morphology can be evaluated by analyzing the type of N2 adsorption–desorption curves and the hysteresis loop shape. Figure 4 shows the isotherms obtained at 77 K for shale and siltstone samples. The isotherms exhibit a typical type IV pattern in the IUPAC classification, confirming the presence of mesopores. The adsorption capacities of different samples at the highest P/P0 (approximately 0.99) exhibit significant variations, ranging from 1.2149 cm3/g to 8.9663 cm3/g. The samples taken from the subsection Liang 1 have the largest average maximum N2 adsorption amount (the average value is 5.7346 cm3/g), and the samples from the subsection Liang 3 have the smallest average maximum N2 adsorption capacity (the average value is 1.7463 cm3/g).
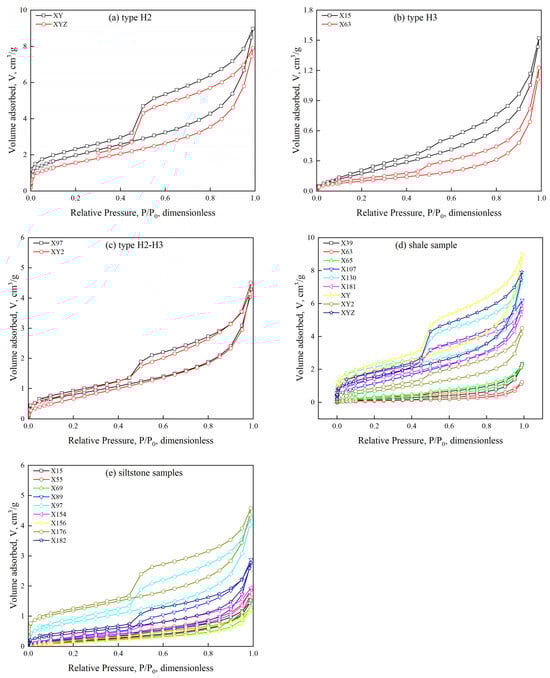
Figure 4.
N2 adsorption–desorption hysteresis loops of core samples taken from the Upper LGS Formation. (a) Core samples with H2-type N2 adsorption–desorption hysteresis loops; (b) core samples with H3-type N2 adsorption–desorption hysteresis loops; (c) core samples with H2–H3 transition type N2 adsorption–desorption hysteresis loops; (d) N2 adsorption–desorption hysteresis loops of shale samples; (e) N2 adsorption–desorption hysteresis loops of siltstone samples.
In addition, all of the nitrogen adsorption–desorption curves show significant hysteresis loops at P/P0, ranging from 0.45 to 0.995. According to the IUPAC classification criteria, the hysteresis loops of these core samples fall into the categories of H2-type, H2–H3 transition type, and H3-type. The H2-type hysteresis loops predominantly indicate the prevalence of “ink-bottle”-shaped pores in rocks, which have narrow necks and broader pore bodies. The H3-type adsorption–desorption hysteresis loops are narrower, indicating the existence of parallel-plate pores. In addition to the aforementioned hysteresis types, some samples also exhibit H2–H3 transitional hysteresis loops, indicating the coexistence of parallel slab and “ink-bottle”-shaped pores. In comparison, N2 adsorption–desorption hysteresis loops in siltstone samples are predominantly characterized by H2–H3 and H3 types, whereas those in shale samples exhibit H2, H2–H3 transition, and H3 types, indicating the development of diverse pore spaces and greater heterogeneity in shale samples.
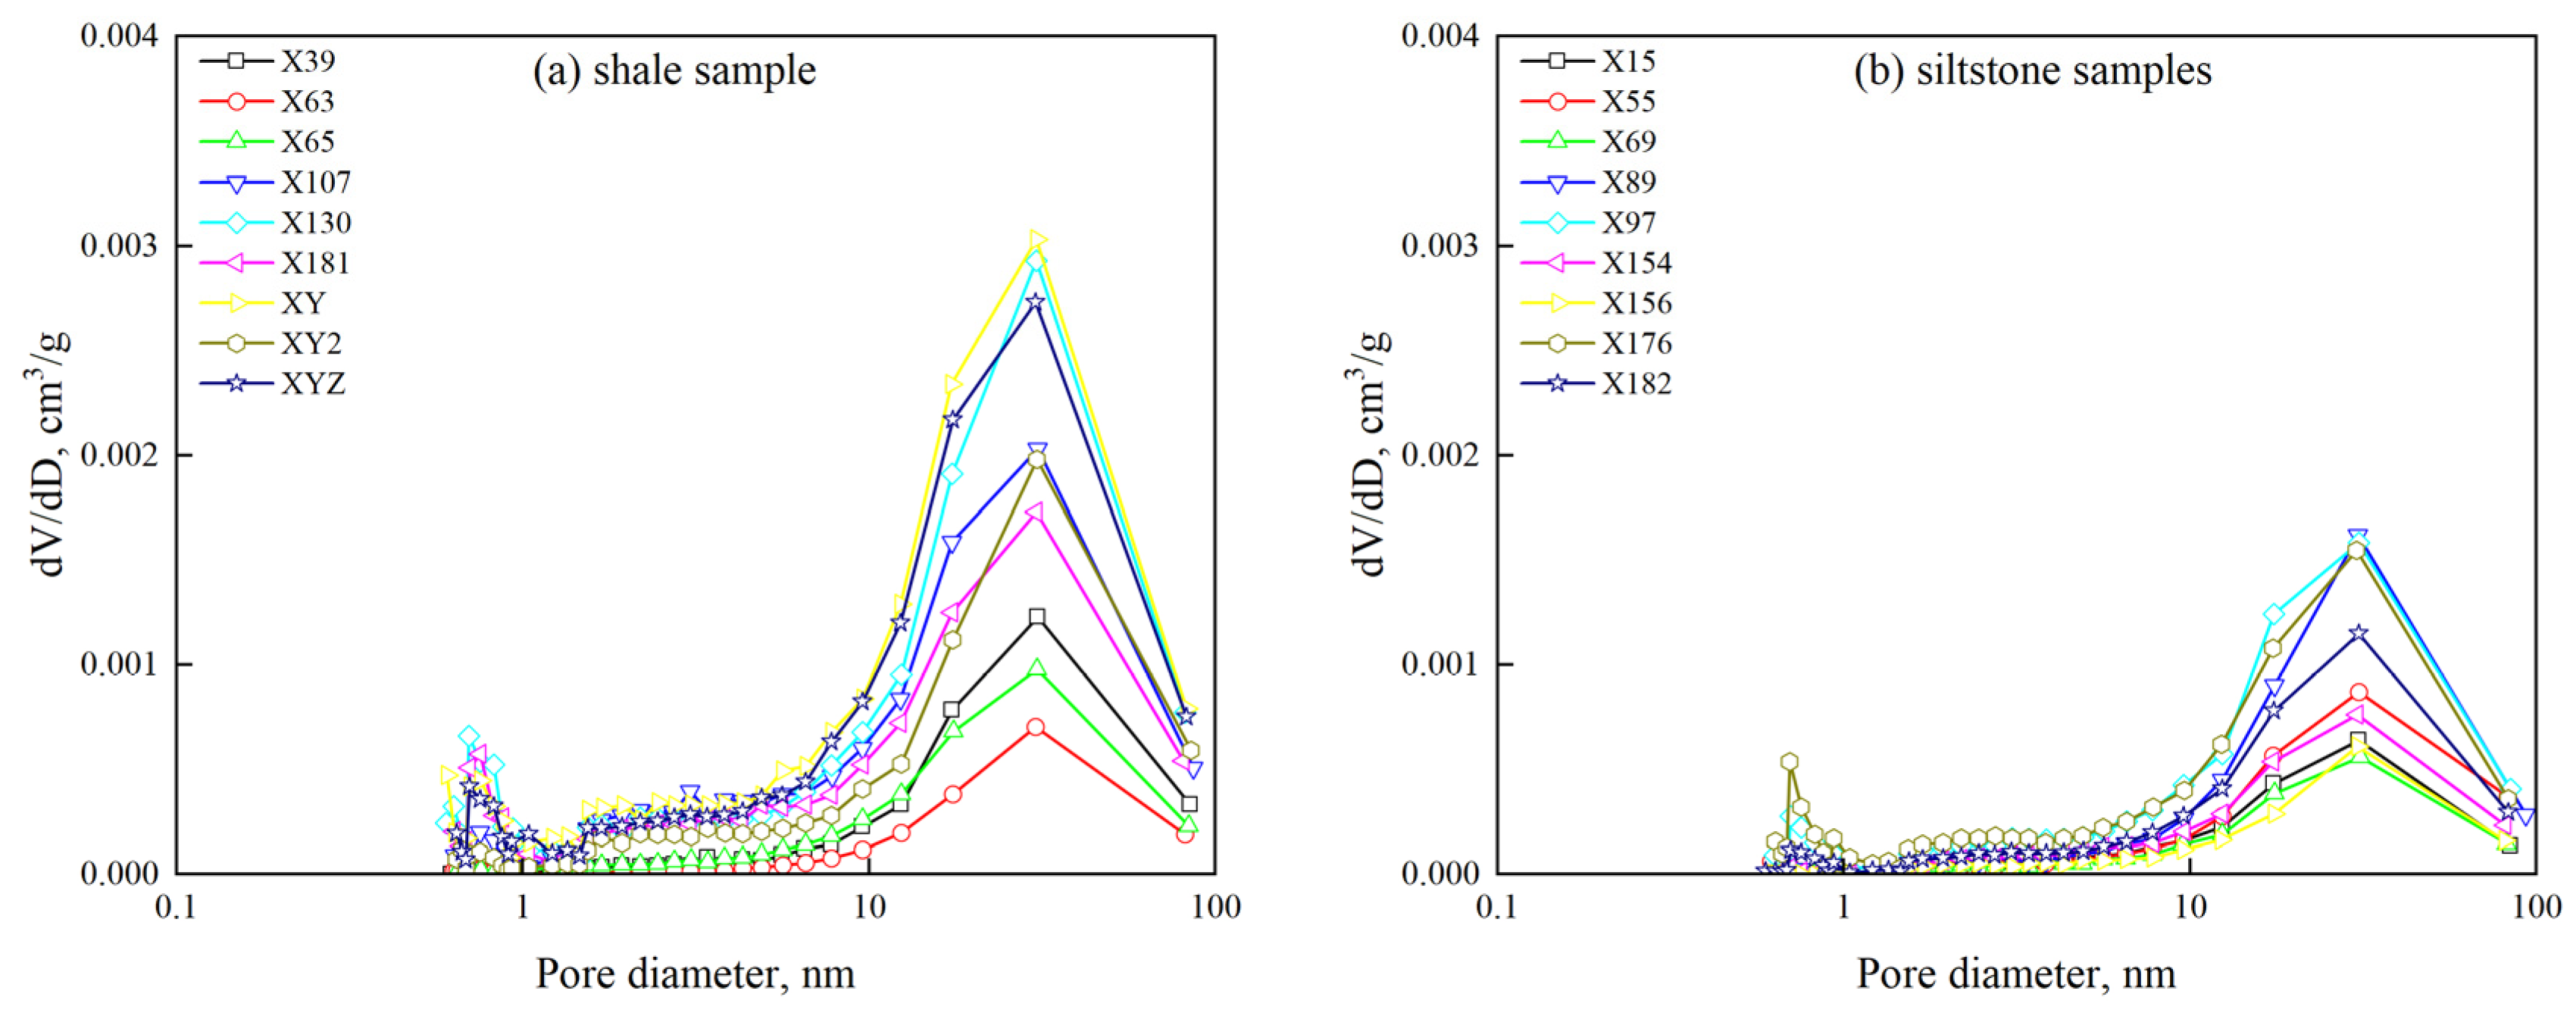
Figure 5 shows PSD curves of experimental samples, obtained from the adsorption branch of LTNA data with the BJH model. It can be observed that the PSD curves of micro- and mesopore in samples from different subsections and of different lighologies are somewhat different. All of the PSD curves exhibit two-modal or multi-modal distributions, with a dominant peak around 30 nm for siltstone samples and 20~30 nm for shale samples.
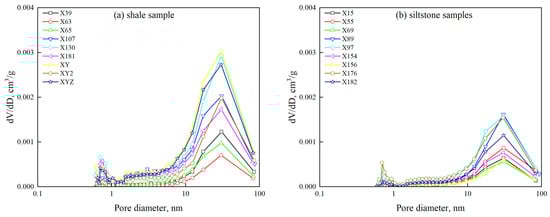
Figure 5.
Pore size distribution (PSD) curves of samples from the Upper LGS Formation obtained from the LTNA data using the BJH model. (a) Shale samples; (b) siltstone samples.
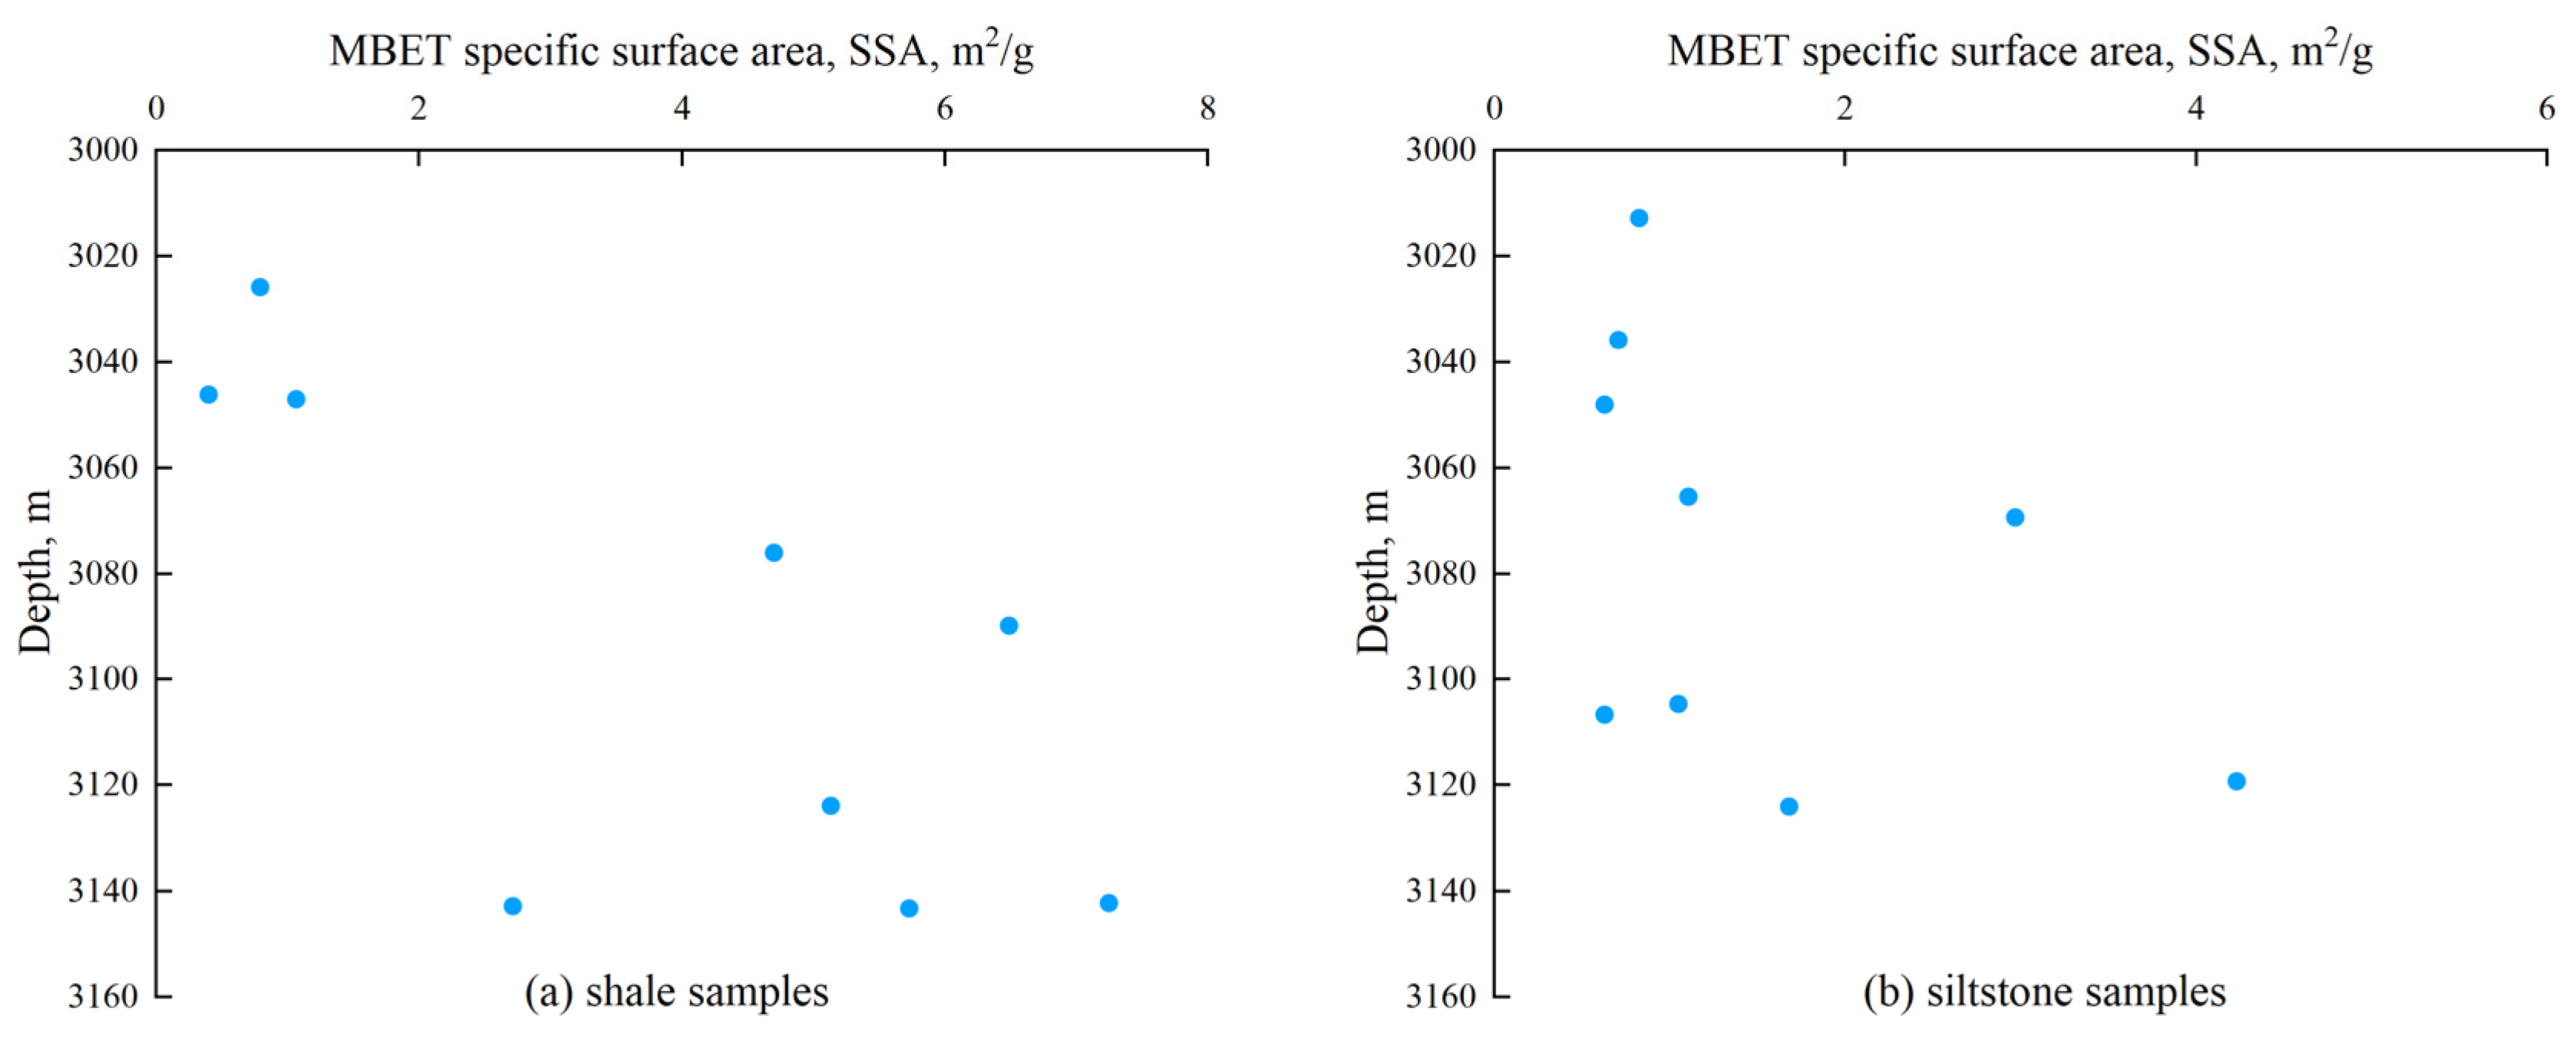
Furthermore, relevant parameters (PV and SSA) were also obtained based on the LTNA data analysis, as presented in Table 1. The total PV ranges from 0.002 cm3/g to 0.014 cm3/g, averaging 0.006 cm3/g. The SSA of the 18 tested samples varies between 0.396 m2/g and 7.247 m2/g, with an average value of 2.669 m2/g. Figure 6 shows that with increasing burial depth, the SSA of the samples generally increases. Specifically, the core samples taken from subsections Liang 1 and Liang 2 have larger SSAs than those from the subsection Liang 3. This could be ascribed to the fact that the over-burden pressure generally increases with increasing burial depth, and the compaction degree of rock particles becomes higher, leading to a decrease in the pore size. Since the SSA is inversely proportional to pore size, the SSA becomes larger as burial depth increases, which may further affect the content of absorbed shale oil.

Table 1.
Pore structure parameters obtained from LTNA.
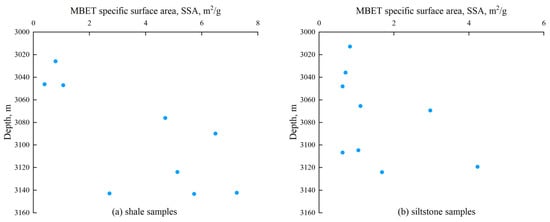
Figure 6.
Relationship between Specific Surface Area (SSA) obtained by BET model and burial depth of core samples taken from the Upper LGS Formation. (a) Shale samples; (b) siltstone samples.
4.1.3. Pore Structure Characteristics Based on HPMI
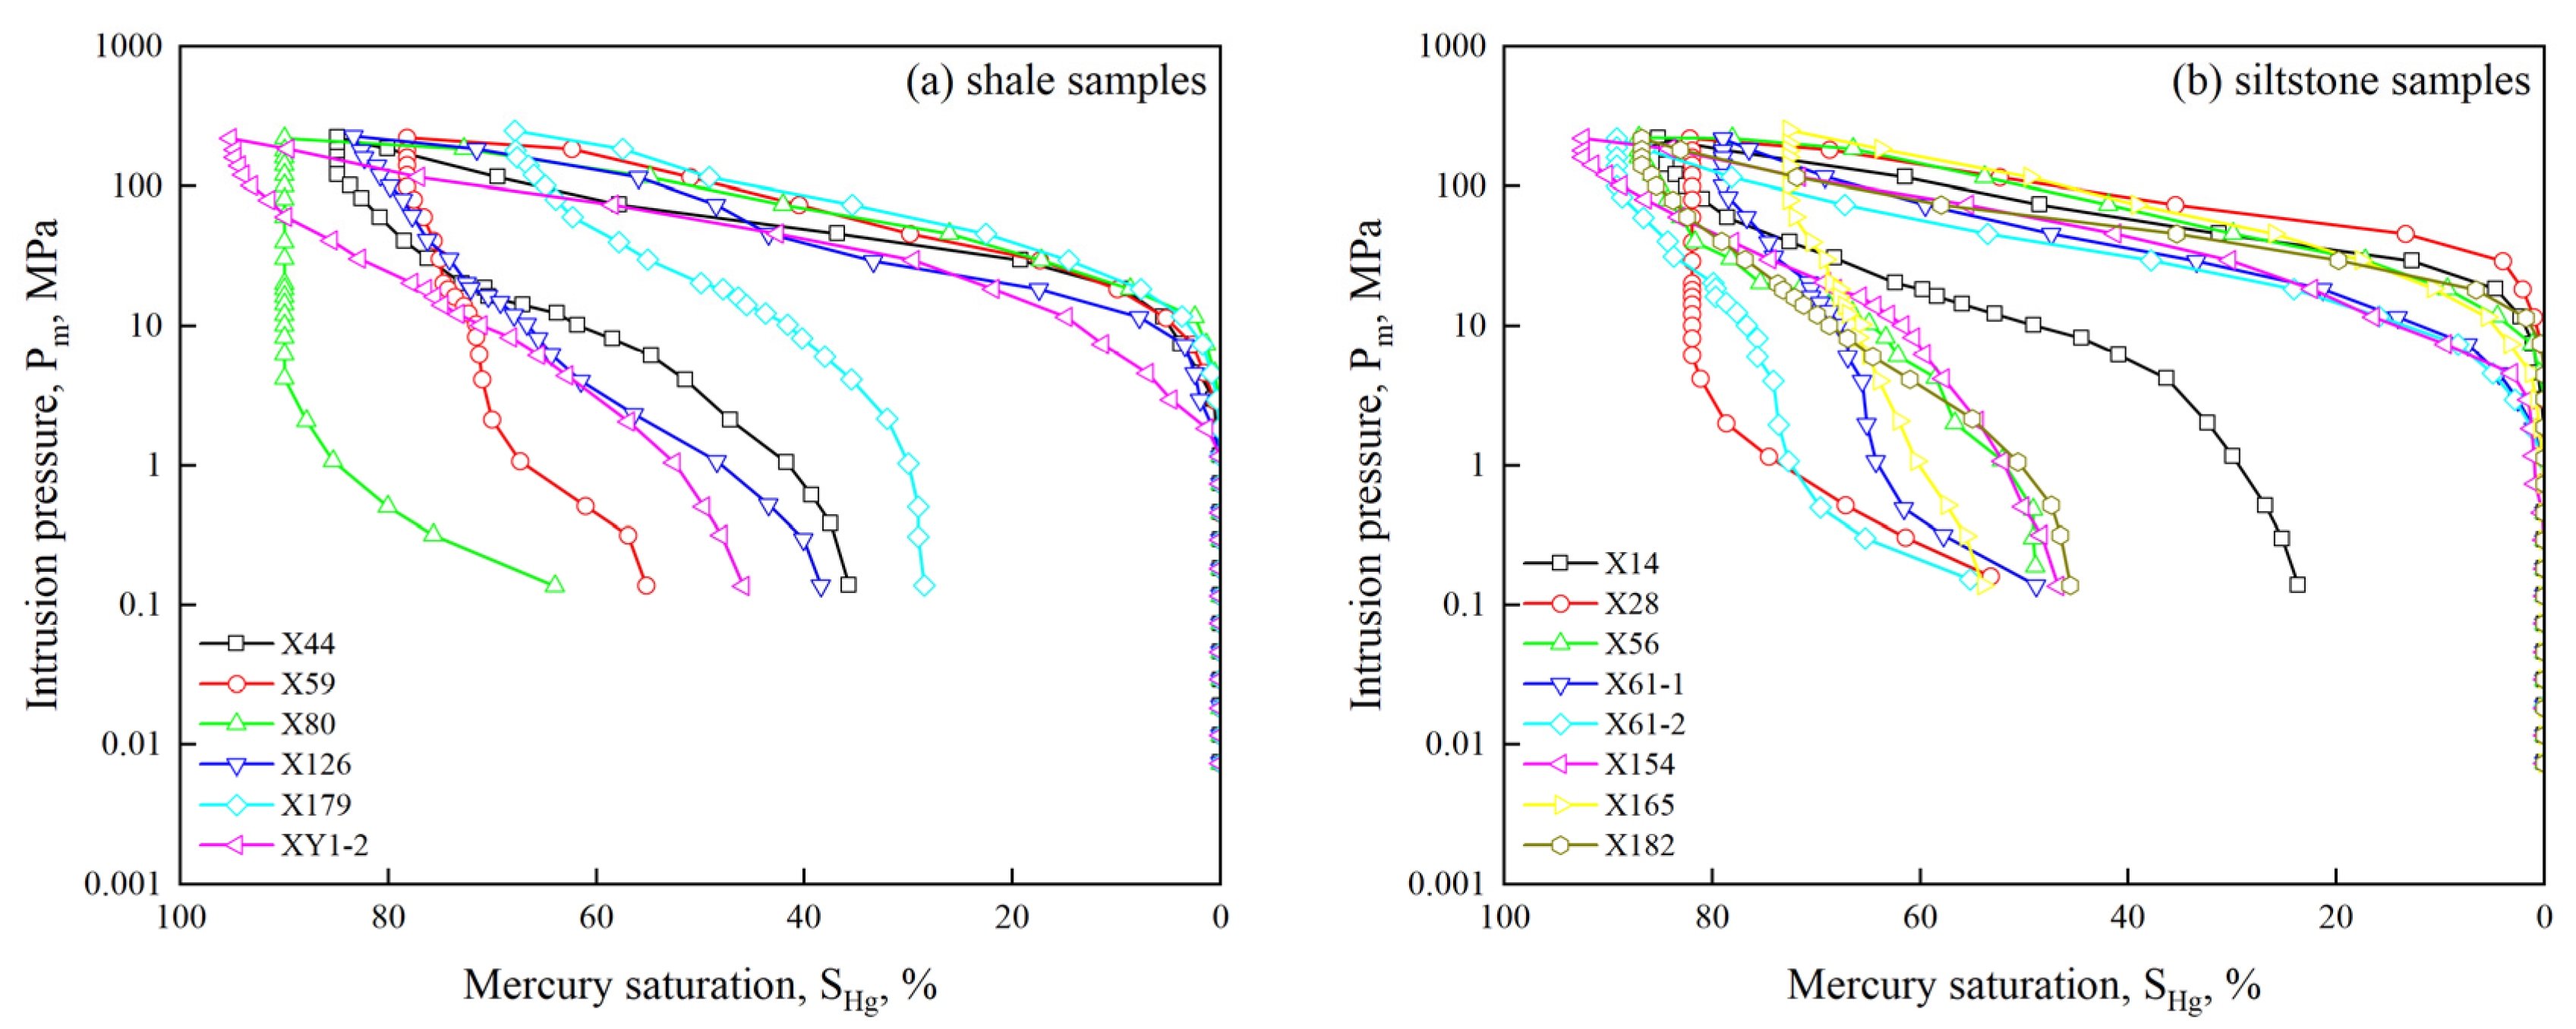
Figure 7 shows the mercury injection and withdrawal curves for the core samples taken from the Upper LGS Formation, in which similar characteristics can be observed for different samples. At lower pressures (<1 MPa), the volume of injected mercury is minimal, indicating poorly developed large pores (pore radii > 0.735 μm). As the mercury injection pressure increased gradually from 1 MPa to 10 MPa, the mercury volume in the core increased slowly. When the injection pressure exceeds 10 MPa, a notable increase in mercury intrusion volume can be observed, suggesting the presence of many nanometer-scale pores in the core samples, which aligns with the findings from the LTNA results.
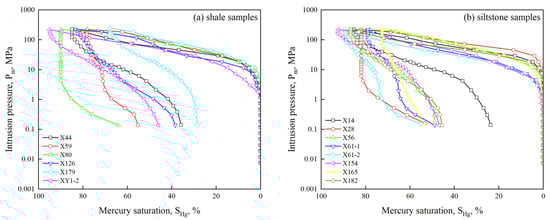
Figure 7.
Mercury intrusion and withdrawal curves of core samples taken from the Upper LGS Formation. (a) Shale samples; (b) siltstone samples.
According to the pore structure diameters obtained using HPMI data (Table 2), the samples from the Upper LGS Formation exhibit a predominantly small pore–throat radius, indicating significant development of nanoscale pores and throats. The average pore radii of shale and siltstone samples are 8.950 nm and 10.212 nm. Shale samples have a relatively smaller median pore–throat radius compared to siltstone samples, with average values of 8.800 nm and 11.050 nm, respectively. Specifically, the mercury withdrawal curves of samples X80 and X28 were initially nearly parallel to the Y-axis, indicating minimal mercury withdrawal until pressures were below 2 MPa. This observation reflects the very poor pore–throat connectivity of these two samples.
Table 2.
Pore structure parameters obtained from HPMI.
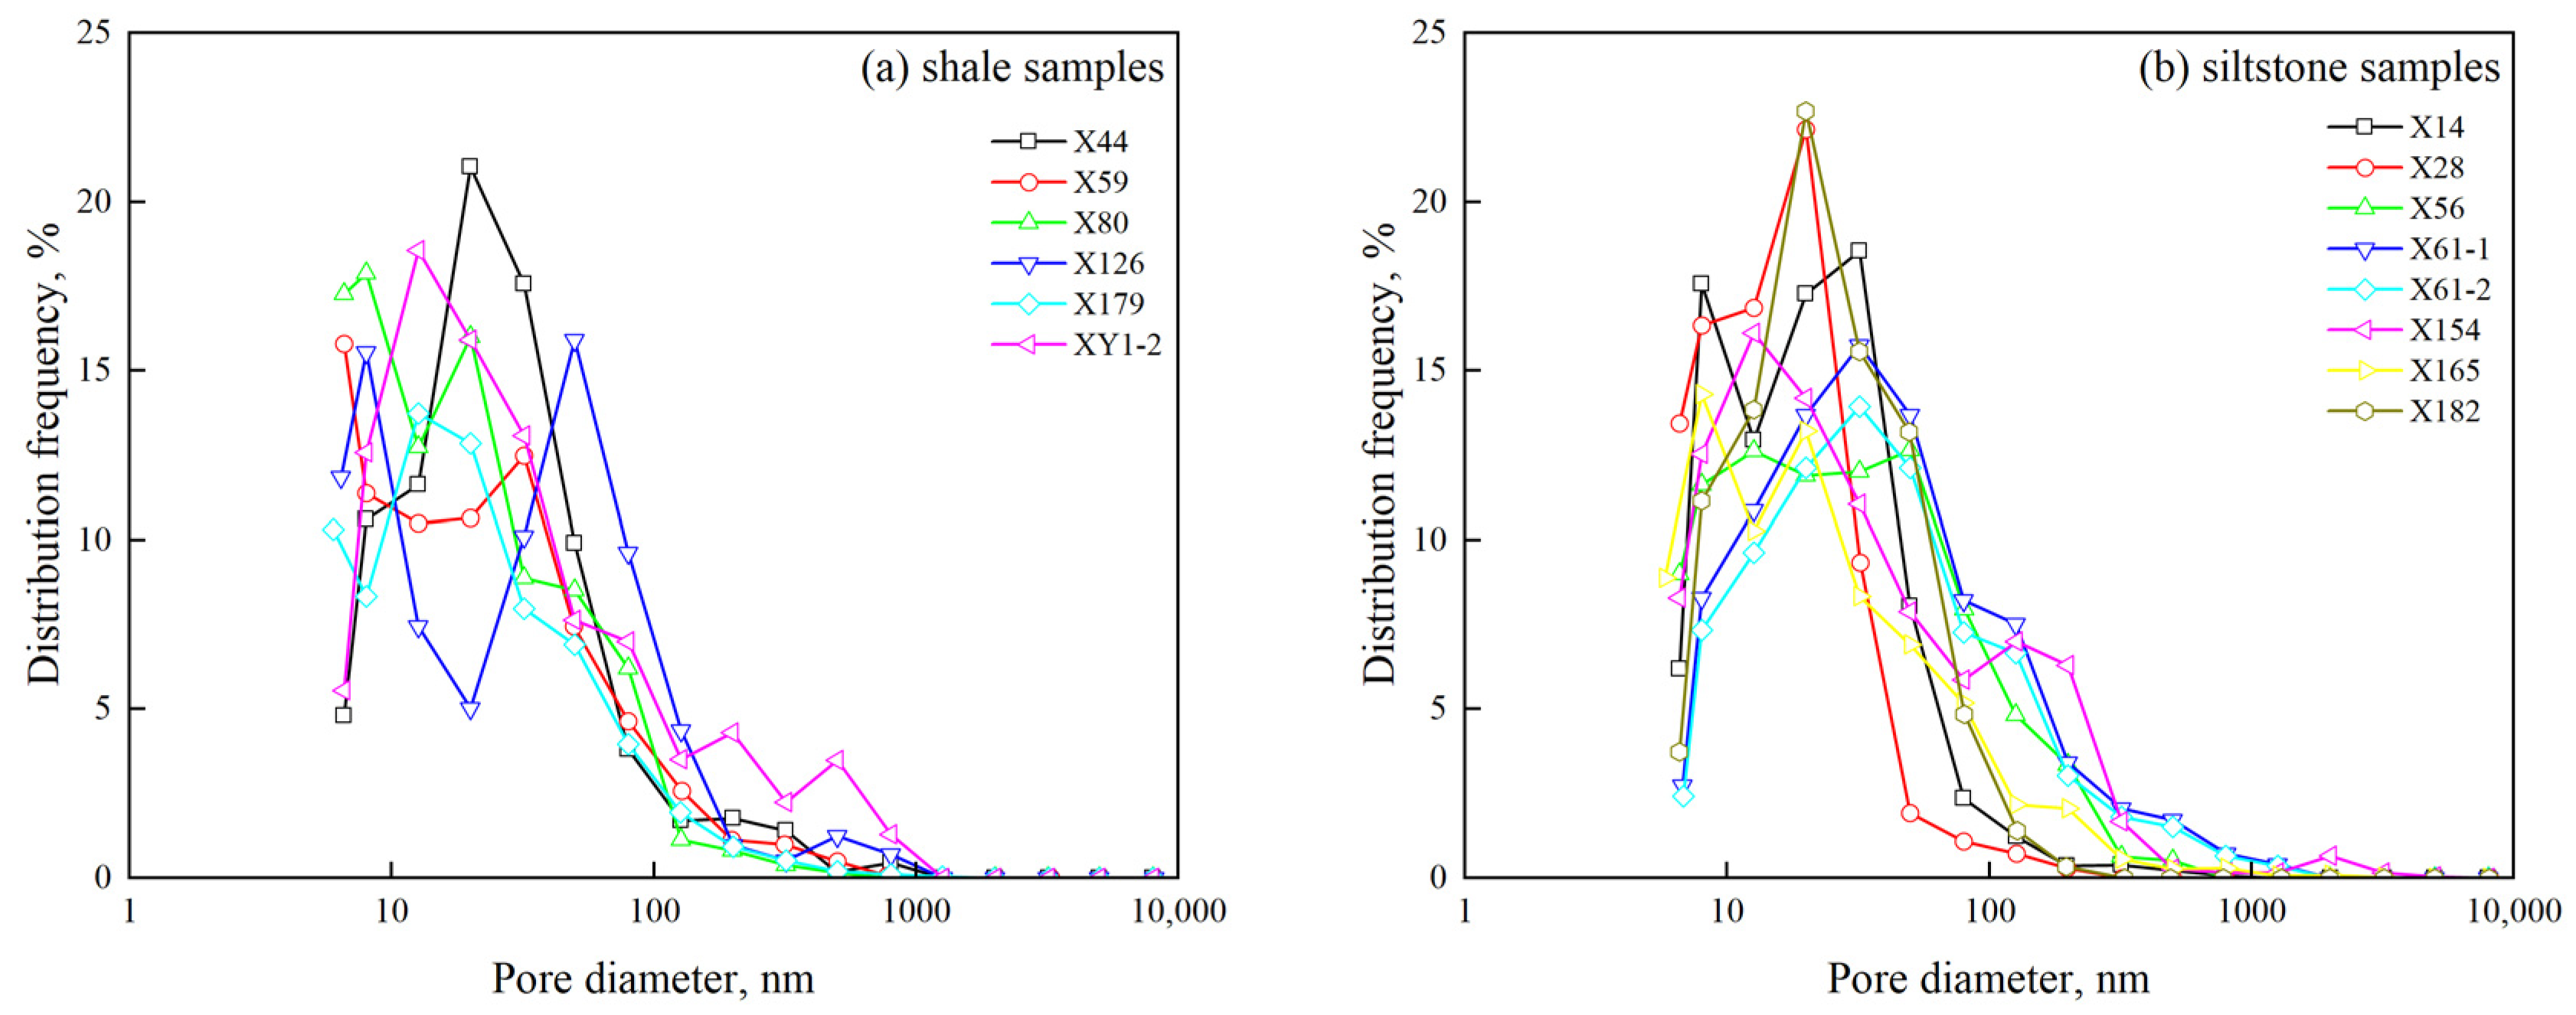
The PSD curves were calculated using the HPMI experimental data (Figure 8). Analysis reveals that except for the sample X126, samples from the Upper LGS Formation generally exhibit unimodal distribution or bimodal distribution, with one strong peak with a pore width of approximately 20 nm.
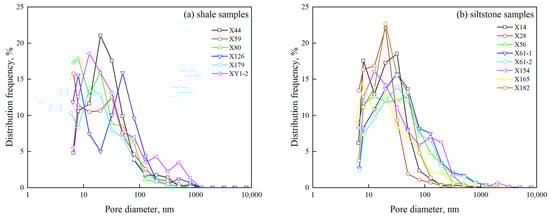
Figure 8.
Pore size distribution (PSD) curves of samples from the Upper LGS Formation obtained from the high-pressure mercury intrusion (HPMI) data. (a) Shale samples; (b) siltstone samples.
4.1.4. Pore Structure Characteristics Based on NMR
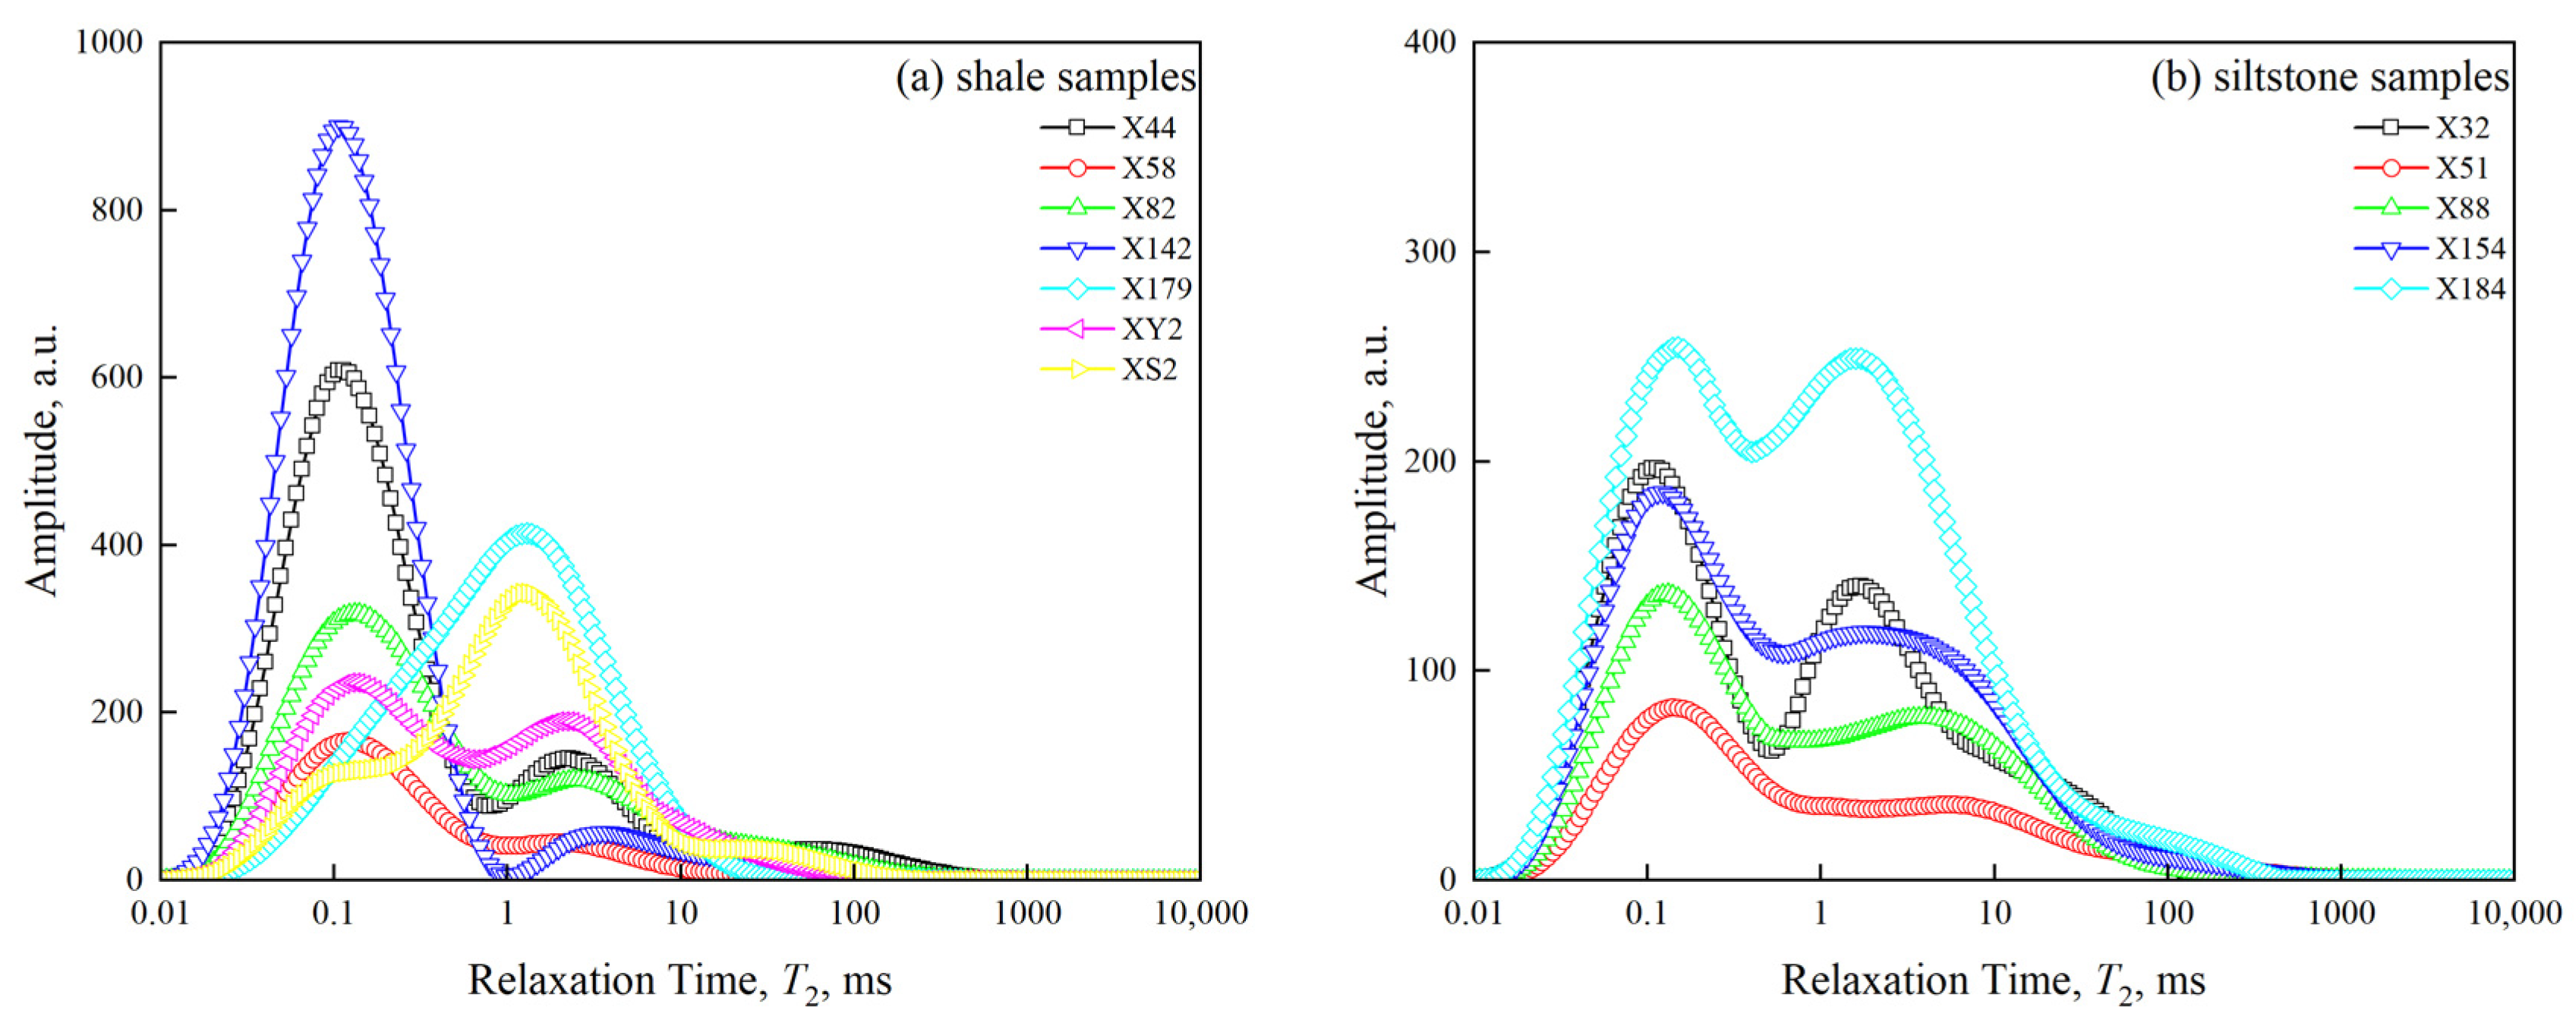
Figure 9 illustrates the NMR T2 spectra of all samples taken from the Upper LGS Formation saturated with kerosene after subtraction of the T2 attenuation signal of the dry sample. The T2 spectra of the siltstone samples show a bimodal distribution, with peak relaxation times ranging from 0.1 to 0.2 ms and 1.7 to 7 ms, respectively. The T2 spectra of the shale samples also exhibit a bimodal distribution, indicating the presence of multi-scale pore spaces in the shale, with the relaxation times of the peaks in the T2 spectra ranging from 0.1 to 0.2 ms and from 1 to 4 ms, respectively.
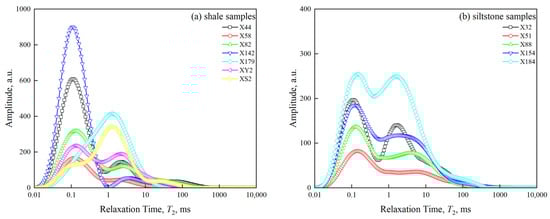
Figure 9.
NMR T2 spectrum of core samples taken from the Upper LGS Formation. (a) Shale samples; (b) siltstone samples.
4.2. Characterization of Full-Scale Pore Size Distribution
Various experimental methods for characterizing PSD have inherent limitations. However, shale reservoirs feature a wide variety of pore sizes, ranging from nanometers to micrometers. Therefore, it is crucial to integrate results from multiple experimental methods comprehensively to accurately describe the complex and wide-ranging PSD of samples.
In this study, LTCA data are adopted to characterize the PSD of micropores, and the LTNA data are adopted to calculate the PSD of micro- to mesopores, while HPMI data are used for macropores characterization. It should be noted that the PSD curves calculated by LTNA and HPMI overlap in some intervals. When connecting PSD curves obtained by LTNA and HPMI, a connecting pore size rp (within 50–80 nm) should be determined. The basic principles of determining rp are that the dV/dlog(D) values of the two PSD curves at the point are roughly equal or the PSD curves exhibit similar trends, which is taken into account to ensure that the volumes of pores measured around the connecting pore size by two methods are similar or have the same trend. Once the connecting pore size is determined, the PSD curve with pore sizes smaller than rp, obtained from LTNA, and that with a pore size larger than rp, obtained from HPMI, were retained. Then, combined with the LTCA data, the full-scale PSD curve of core samples can be obtained.
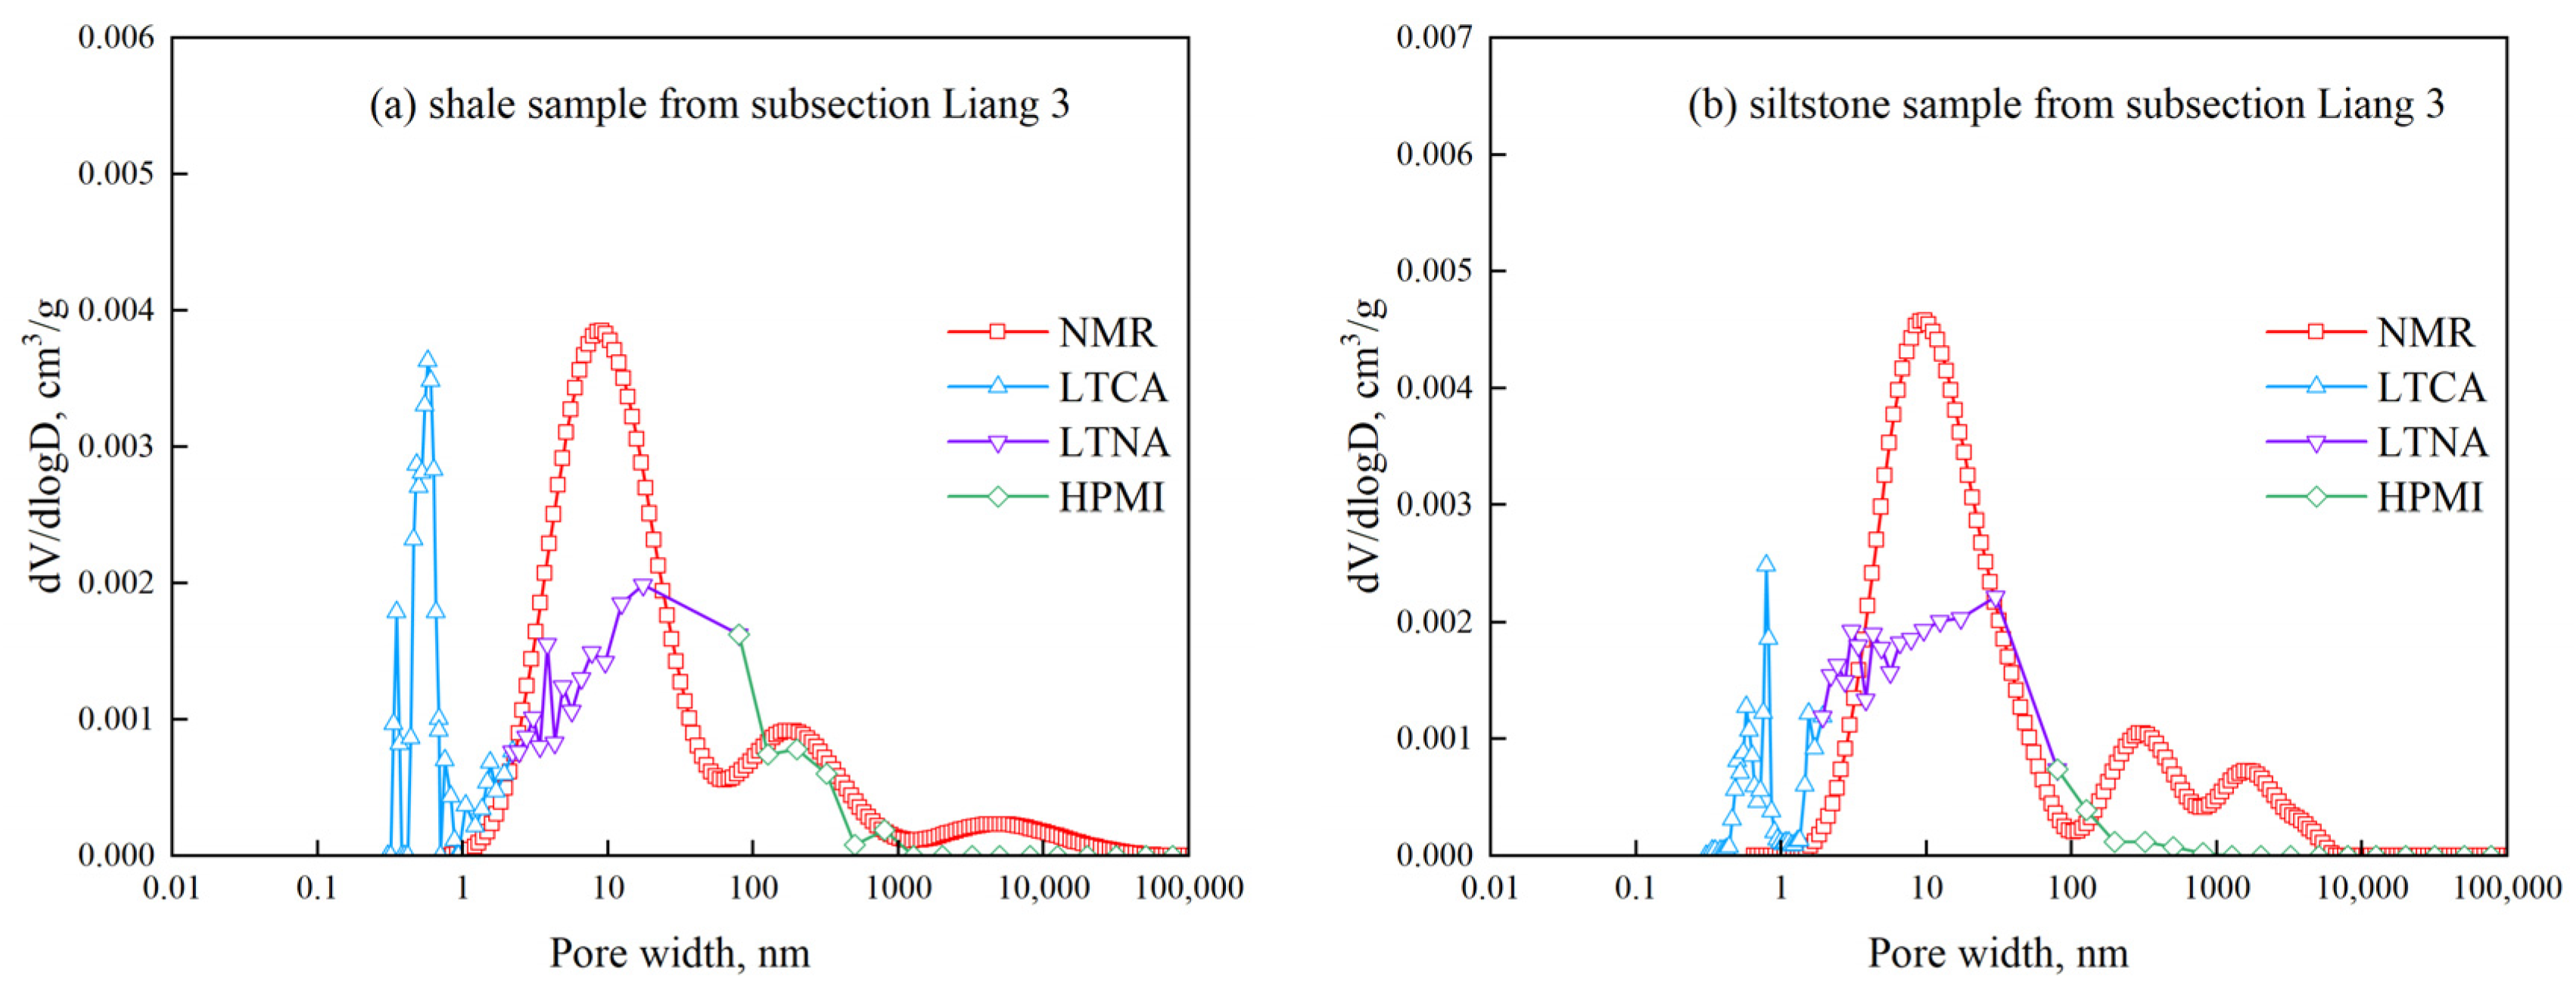
Figure 10 presents the full-scale pore size characterization results for typical core samples of different lithologies from the subsection Liang 3 (the results of other representative core samples from other subsections of the Upper LGS Formation can be found in Appendix A). It is obvious that the full-scale PSDs exhibit “bimodal” or “multi-modal” characteristics, with two peaks at approximately 0.5~0.8 nm and 2~80 nm, respectively. Generally, nanoscale pores smaller than 1 μm are predominant among all of the core samples.
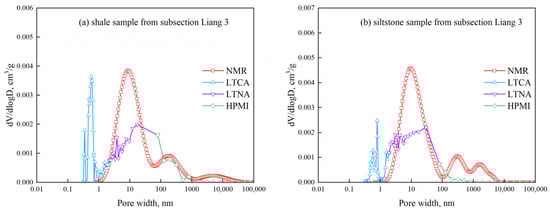
Figure 10.
Full-scale PSD curves of representative samples taken from the Upper of LGS Formation. (a) Representative shale sample from subsection Liang 3; (b) representative siltstone sample from subsection Liang 3.
The NMR T2 spectrum can additionally be transformed to characterize the full-scale PSD. According to eq 1, presented in Section 3.4, and the PSD obtained by LTCA-LTNA-HPMI techniques, the conversion coefficient of NMR T2 spectral C can be determined. For all of the samples, the average value of the conversion coefficient C is 53.4 for siltstone samples and 52.33 for shale samples. Figure 10 also shows the full-scale PSD curve obtained by NMR technology, and it can be observed that the NMR PSD aligns well with the LTCA-LTNA-HPMI combined PSD. It is also noticed that values of the PSD of mesopores obtained from LTNA are usually smaller than those obtained from the conversion of the NMR T2 spectral. This discrepancy may be due to the destruction of original pore structures in powdered samples during preparation in gas adsorption experiments, whereas NMR tests use intact core samples.
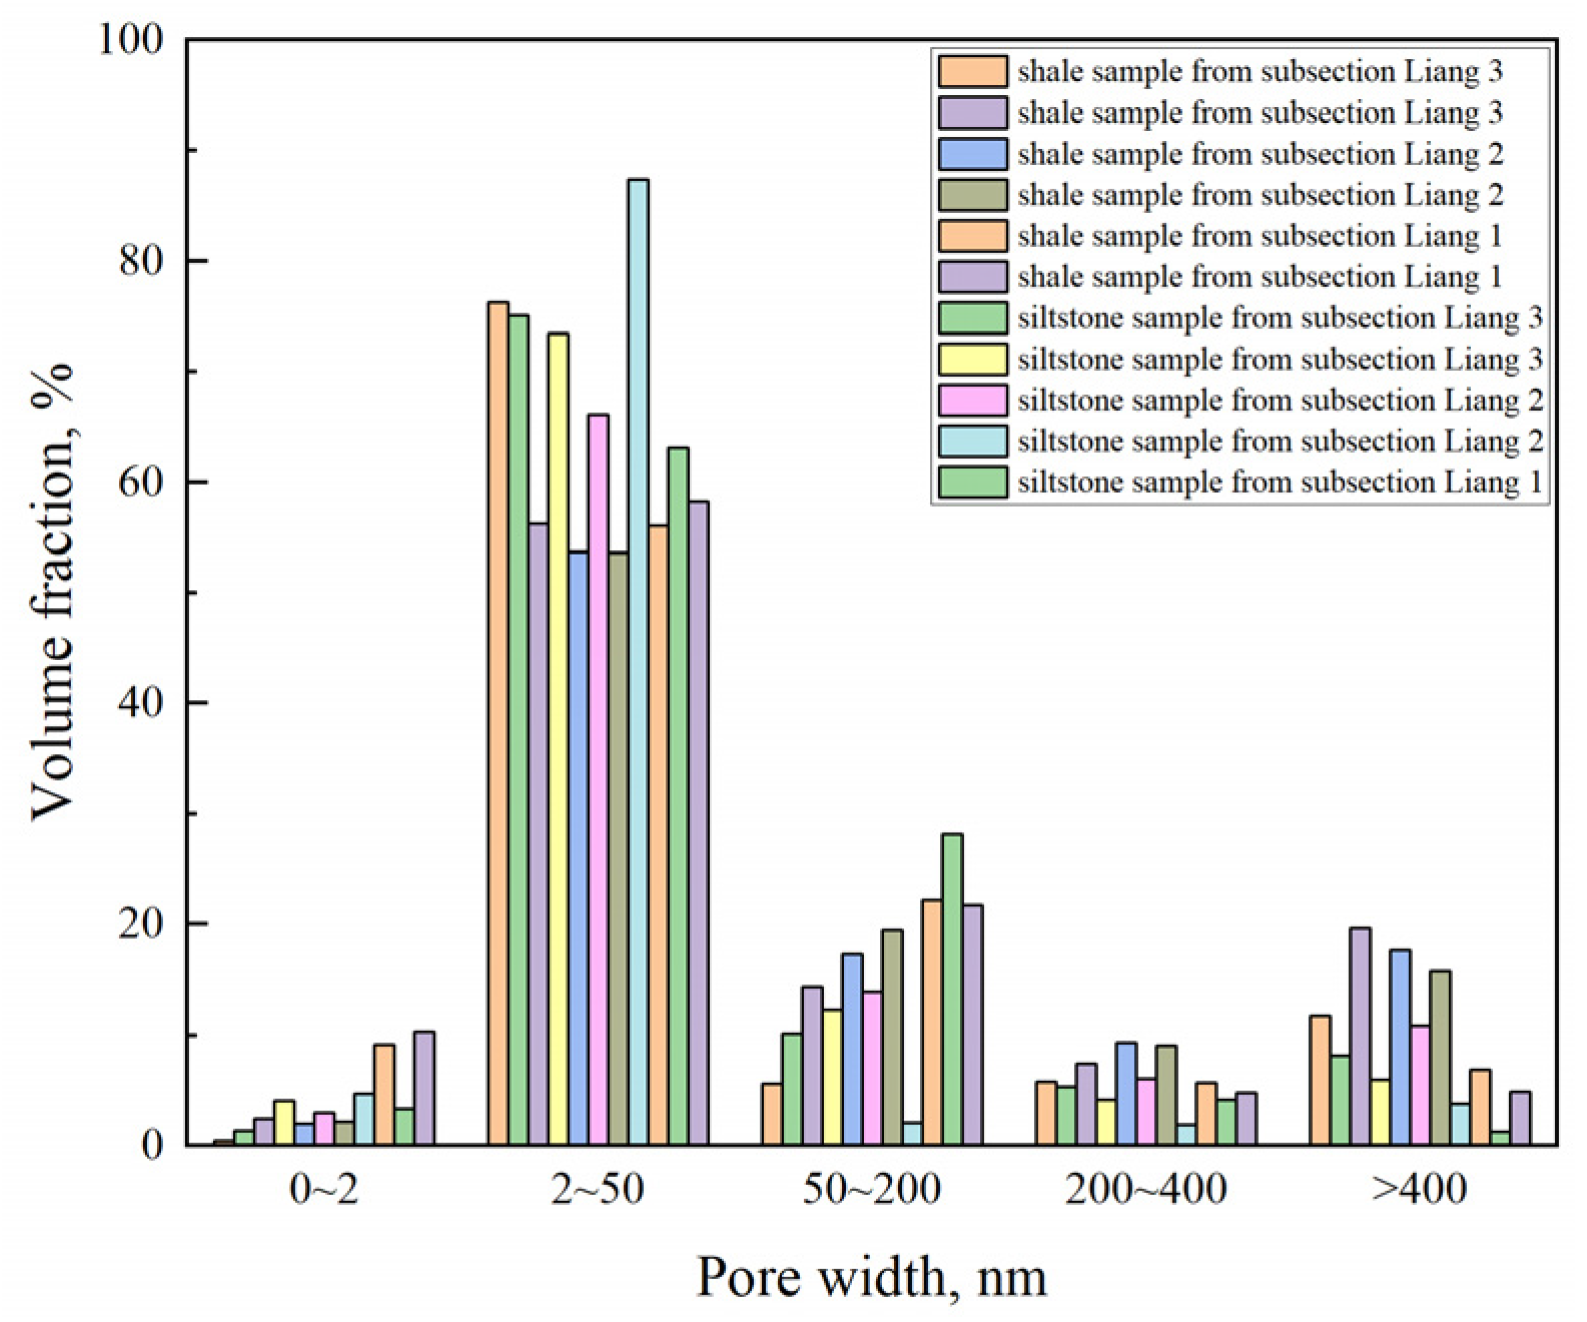
According to the full-scale PSD converted from NMR data (Figure 11), pores in the core samples from the Upper LGS Formation mainly range from 2 to 200 nm. It can be seen that mesopores (2~50 nm) dominated in the total pore volumes, which is followed by pores with widths between 50~200 nm. Yang et al. [51] and Wu [52] also investigated the pore spaces of the Jurassic Lianggaoshan Formation shale, and they found that the pores from core samples of the upper LGS formation were predominantly in the 2~200 nm range, with mesopores (2~50 nm) being dominant, which is consistent with our findings.
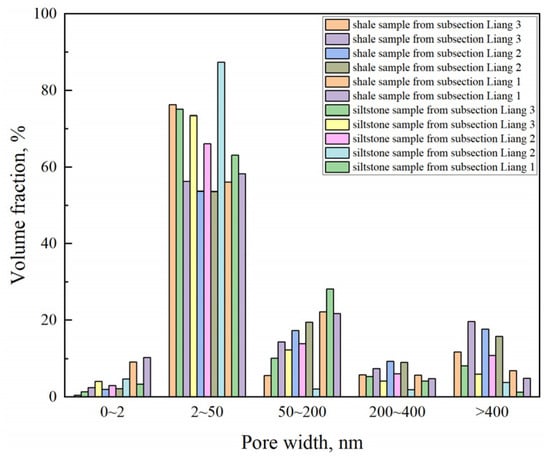
Figure 11.
Histogram of full-scale pore size distribution of core samples taken from the Upper LGS Formation.
4.3. Fractal Characteristics of Full-Scale Pores
4.3.1. Fractal Dimensions Obtained by LTNA
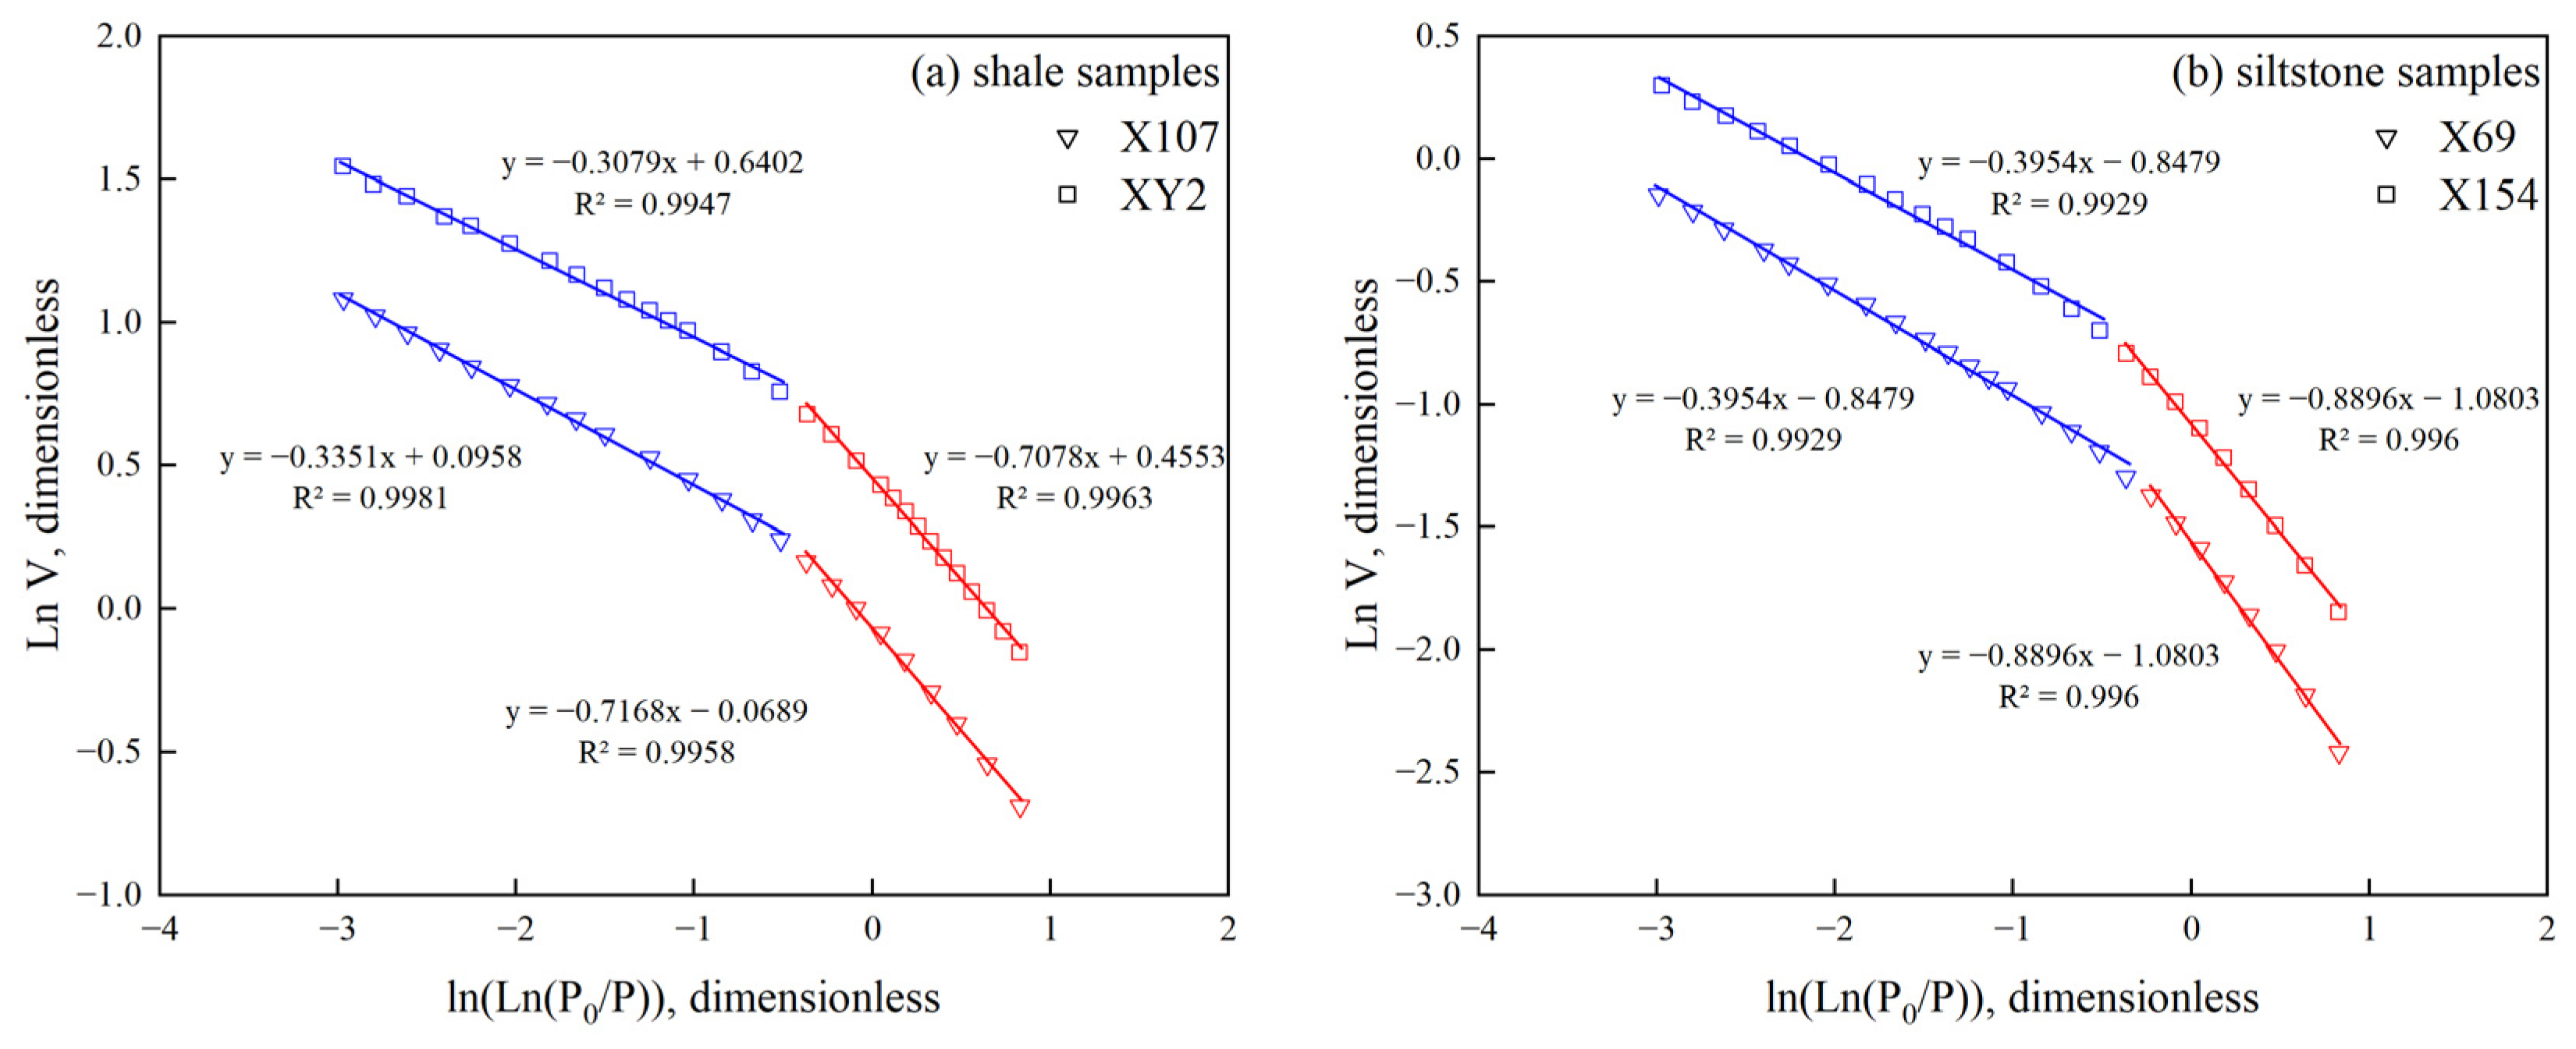
According to Section 3.5, the fractal dimensions D1 and D2 were determined using the LTNA isotherm. Figure 12 presents the curves for representative samples. It is obvious that the curve was divided into two distinct parts. The FHH model was adopted to fit the two segments, and the R2 value of each segment’s fitting curve is larger than 0.99, further verifying the fractal nature of the pores. As described in Section 3.5, D1, determined by the N2 adsorption data at P0/P below 0.45 (or 0.5), characterizes the roughness of the pore surfaces. D2, determined by N2 adsorption data when P0/P exceeds 0.45 (or 0.5), mainly reflects the complexity of pore structures. It should be mentioned that for all samples, the D1 values calculated using D1 = 3K + 3 are less than 2, which contradicts the general understanding of the fractal dimension of rocks. In order to obtain a more realistic result, we followed the approach proposed by Yu et al. [53]. The D1 was calculated using D = K + 3, which provides a reflection of the pore surface irregularity to some extent.
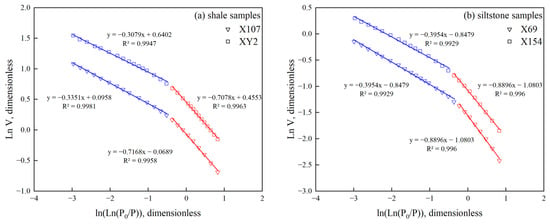
Figure 12.
(a) Linear regression of N2 adsorption isotherms with FHH model for typical shale samples from the Upper LGS Formation. (b) Linear regression of N2 adsorption isotherms with FHH model for typical siltstone samples from the Upper LGS Formation. (The blue triangles and squares represent N2 adsorption data when P/P0 < 0.45, while the red triangles and squares represent N2 adsorption data within the range of P/P0 > 0.45. The blue and red lines are corresponding linear regression curves).
Table 3 presents the values of D1 and D2, calculated for 18 samples based on the FHH model. It is shown that the D1 values of eighteen samples (including nine shale samples and nine siltstone samples) vary from 2.02 to 2.59. The average D1 value of shale samples is 2.39, which is larger than that of siltstone samples (2.24). Contrastingly, the D2 values of different samples vary within a relatively smaller range (2.45~2.72), and the average D2 values of shale and siltstone samples are 2.62 and 2.59, respectively. Overall, the D1 and D2 of shale samples are typically larger than those of siltstone samples, indicating that shale samples exhibit more intricate pore structures and rougher pore surfaces compared to siltstone samples from the Upper LGS Formation.
Table 3.
Fractal dimensions determined by LTNA data.
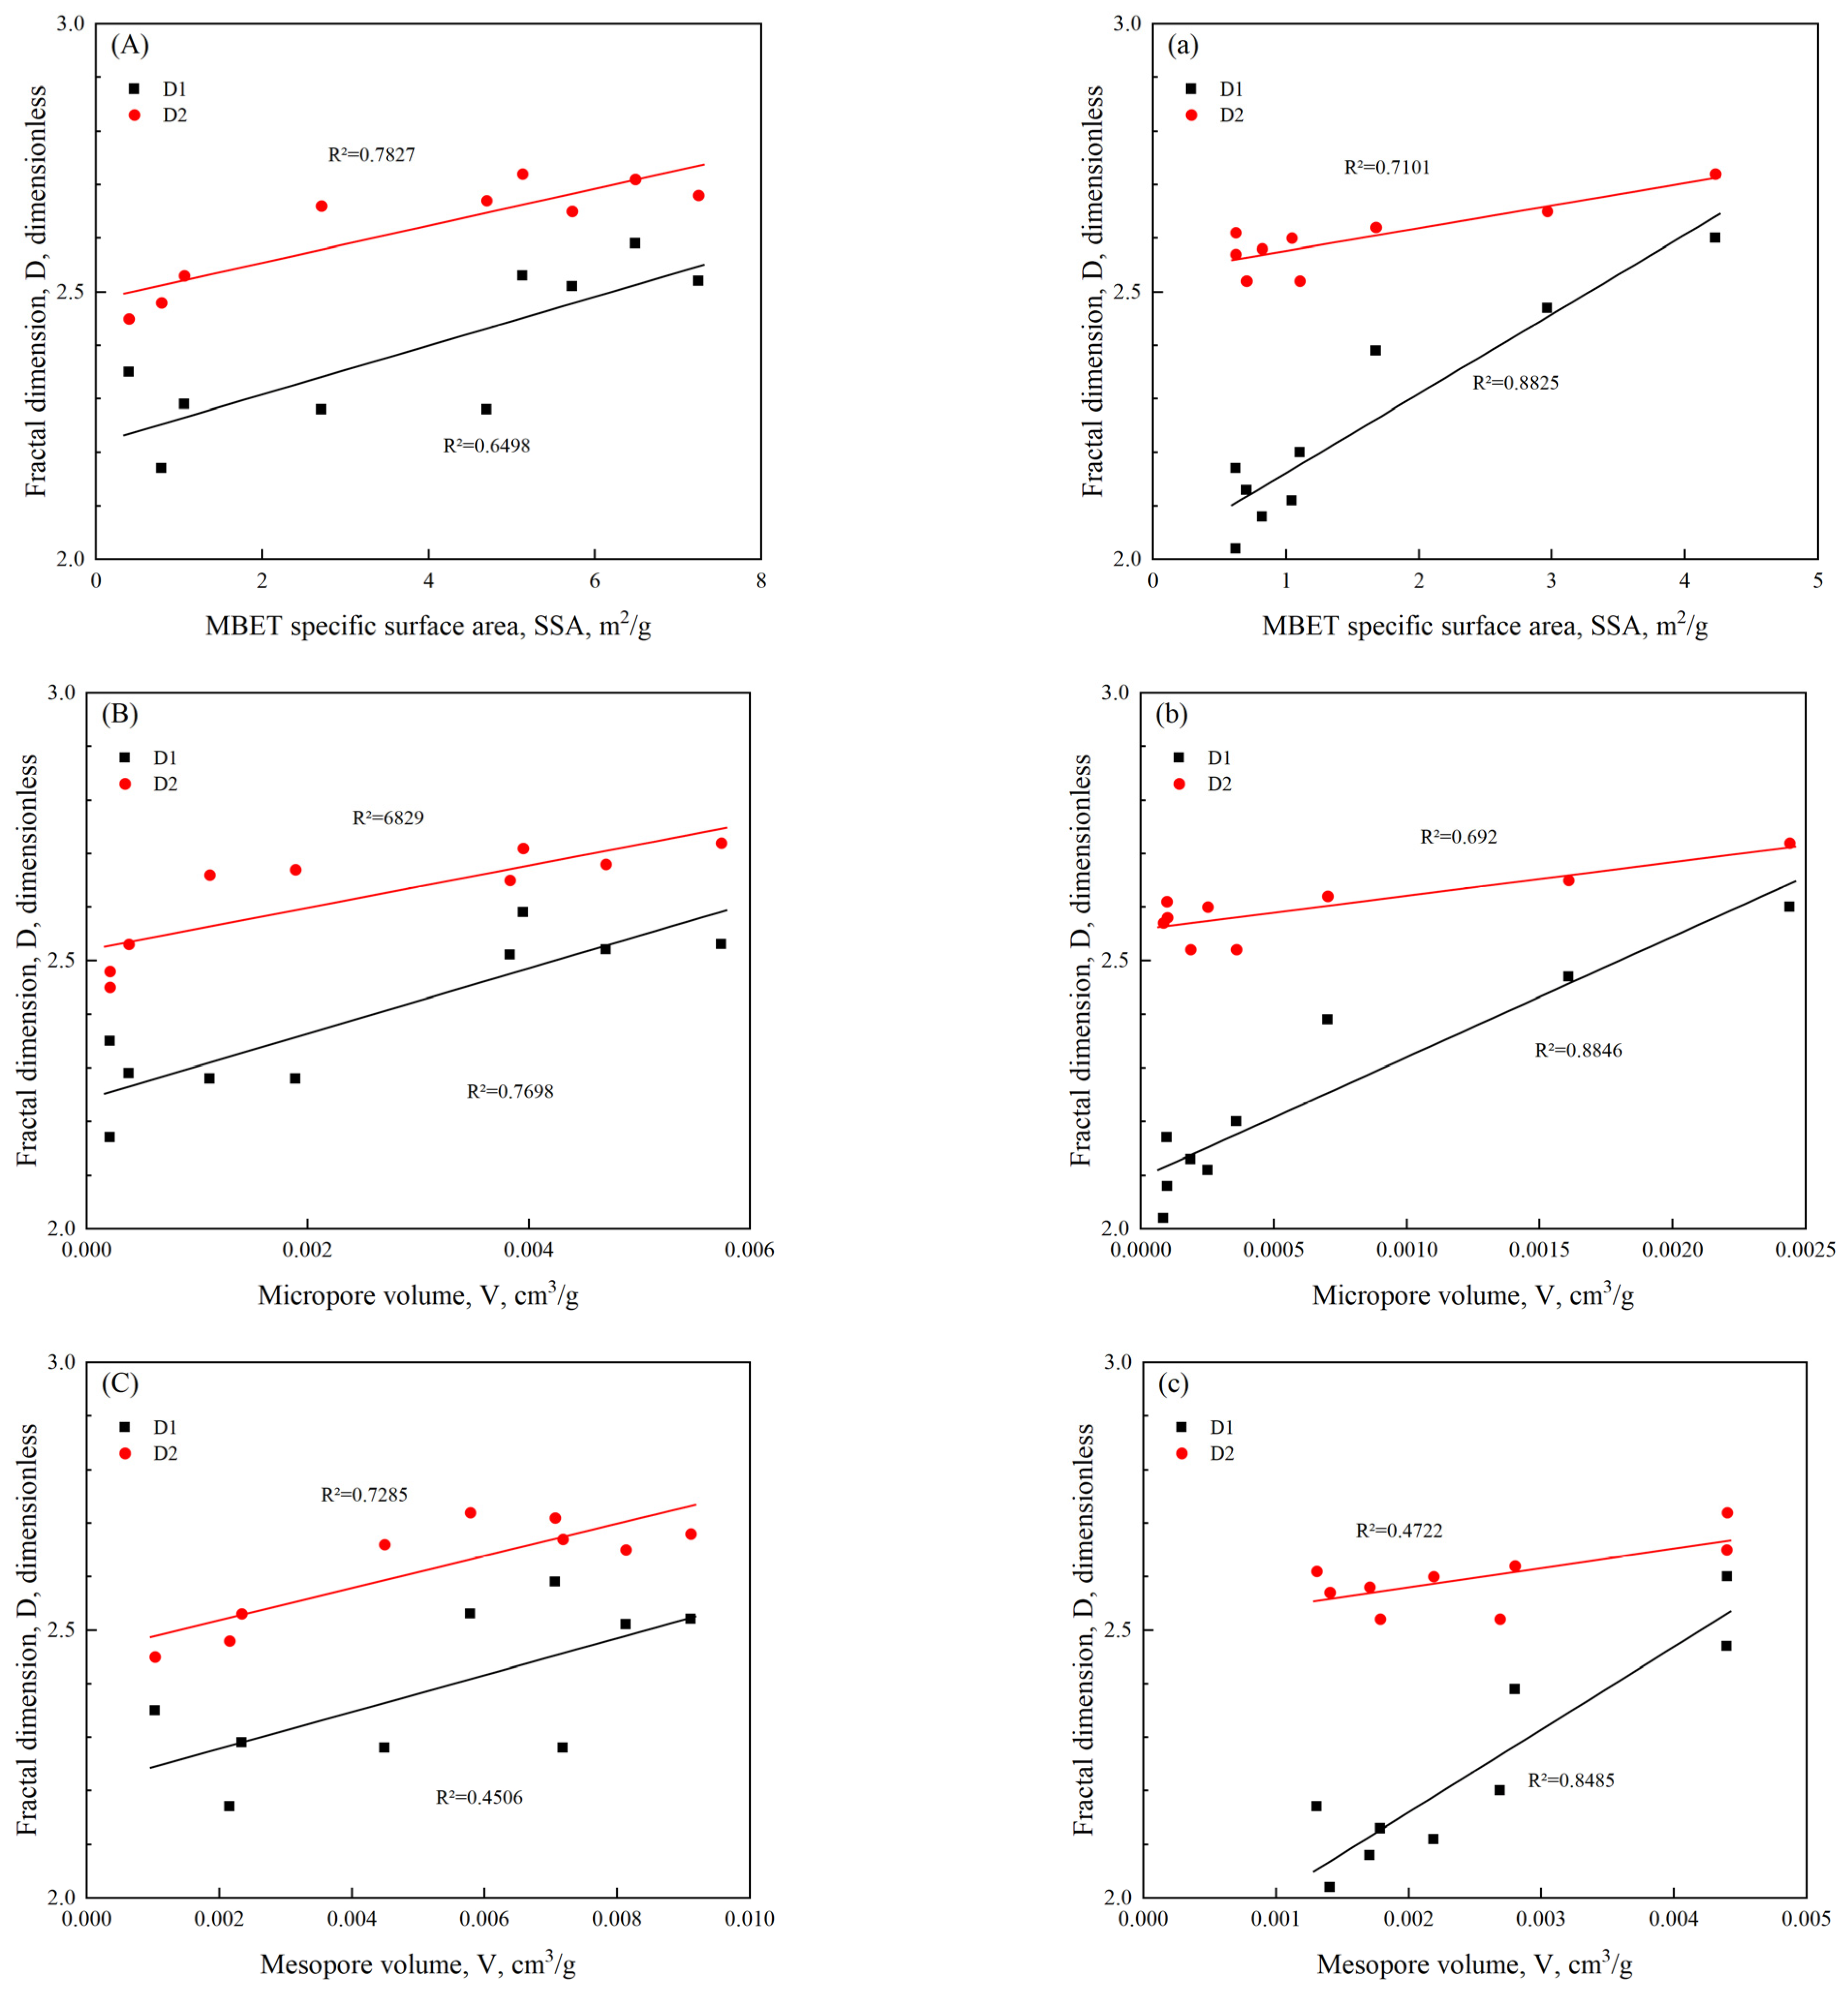
Figure 13 illustrates the correlation between the fractal dimensions (D1, D2) and SSA, volumes of micropores, and mesopores. Strong positive correlations can be observed between D1/D2 and SSA/PV, with fractal dimensions increasing as SSA and pore volume increase. The corresponding R2 values range from 0.4506 to 0.8846 for pore volume, and between 0.6498 and 0.8825 for SSA. These correlations suggest that core samples with a larger SSA and more micropores usually correspond to rougher pore surfaces, more complex pore structures, as well as strong heterogeneity. The observed negative correlations between fractal dimensions (D1, D2) versus SSA and PV are also consistent with prior research results [37,48,54].
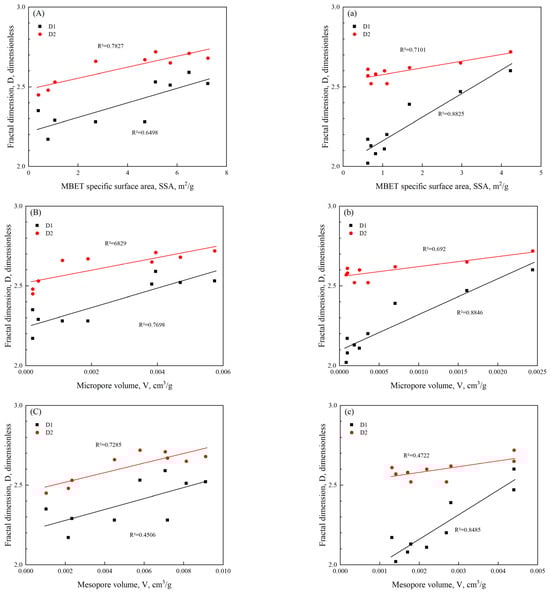
Figure 13.
Relationship between fractal dimensions (D1, D2) and SSA, microporous micro-PV and meso-PV. (A–C) are for shale samples, and (a–c) are for siltstone samples. D1 and D2 calculated based on FHH model presented in Section 3.5.
4.3.2. Fractal Dimension Obtained by HPMI Curves
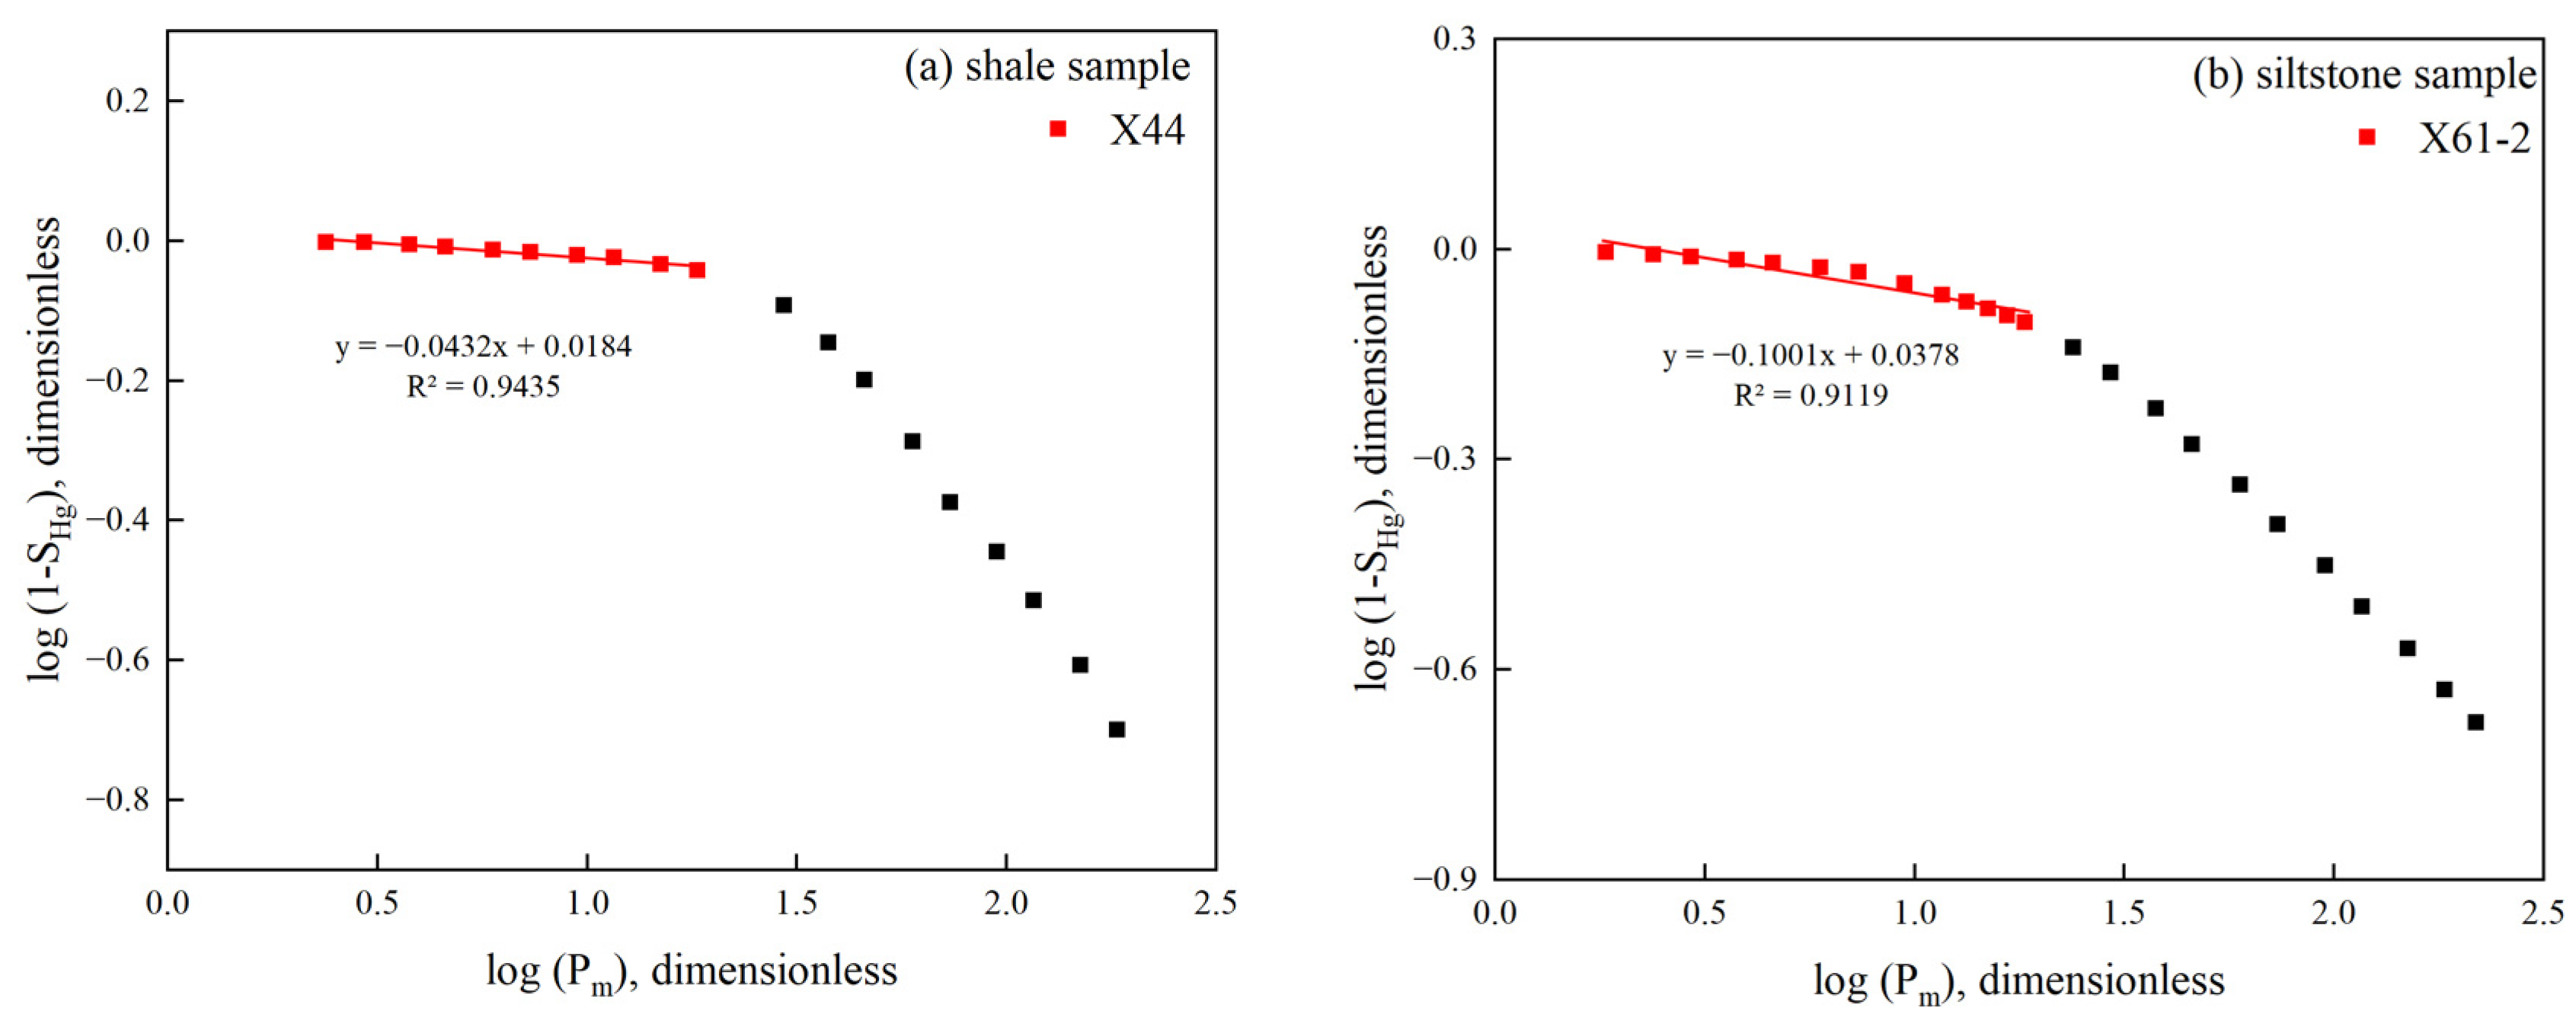
The fractal dimension for macropores (D3) is determined by fitting the plot. Table 4 shows the D3 values calculated for different core samples, which range from 2.9053 to 2.9946. Figure 14 illustrates the log(Pm)~log(1 − SHg) plots of typical shale and siltstone samples, and a distinct inflection point can also be observed in the plot. The right segment represents smaller pores in the samples (approximately < 100 nm), while the left segment reflects the characteristics of larger pores. Given that the LTNA technique has an advantage in accurate characterization of pores smaller than 100 nm, liner regression was performed on the left segment of log(Pm)~log(1 − SHg) plot to obtain the fractal dimension of macropores D3. The correlation coefficients of the fitted lines for most samples exceeded 0.9, indicating fractal characteristics of larger pores in samples. The average D3 values for shale and siltstone samples are 2.9644 and 2.9471, respectively, suggesting that the structures of macropores in shale samples are more intricate than those in siltstone samples.
Table 4.
HPMI fractal dimensions.
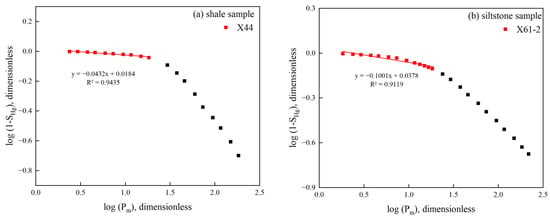
Figure 14.
(a) Fractal fitting curves of representative shale sample from the Upper LGS Formation. (b) Fractal fitting curves of representative siltstone sample from the Upper LGS Formation. (The red squares represent the left-segment, and the black squares represent the right-segment).
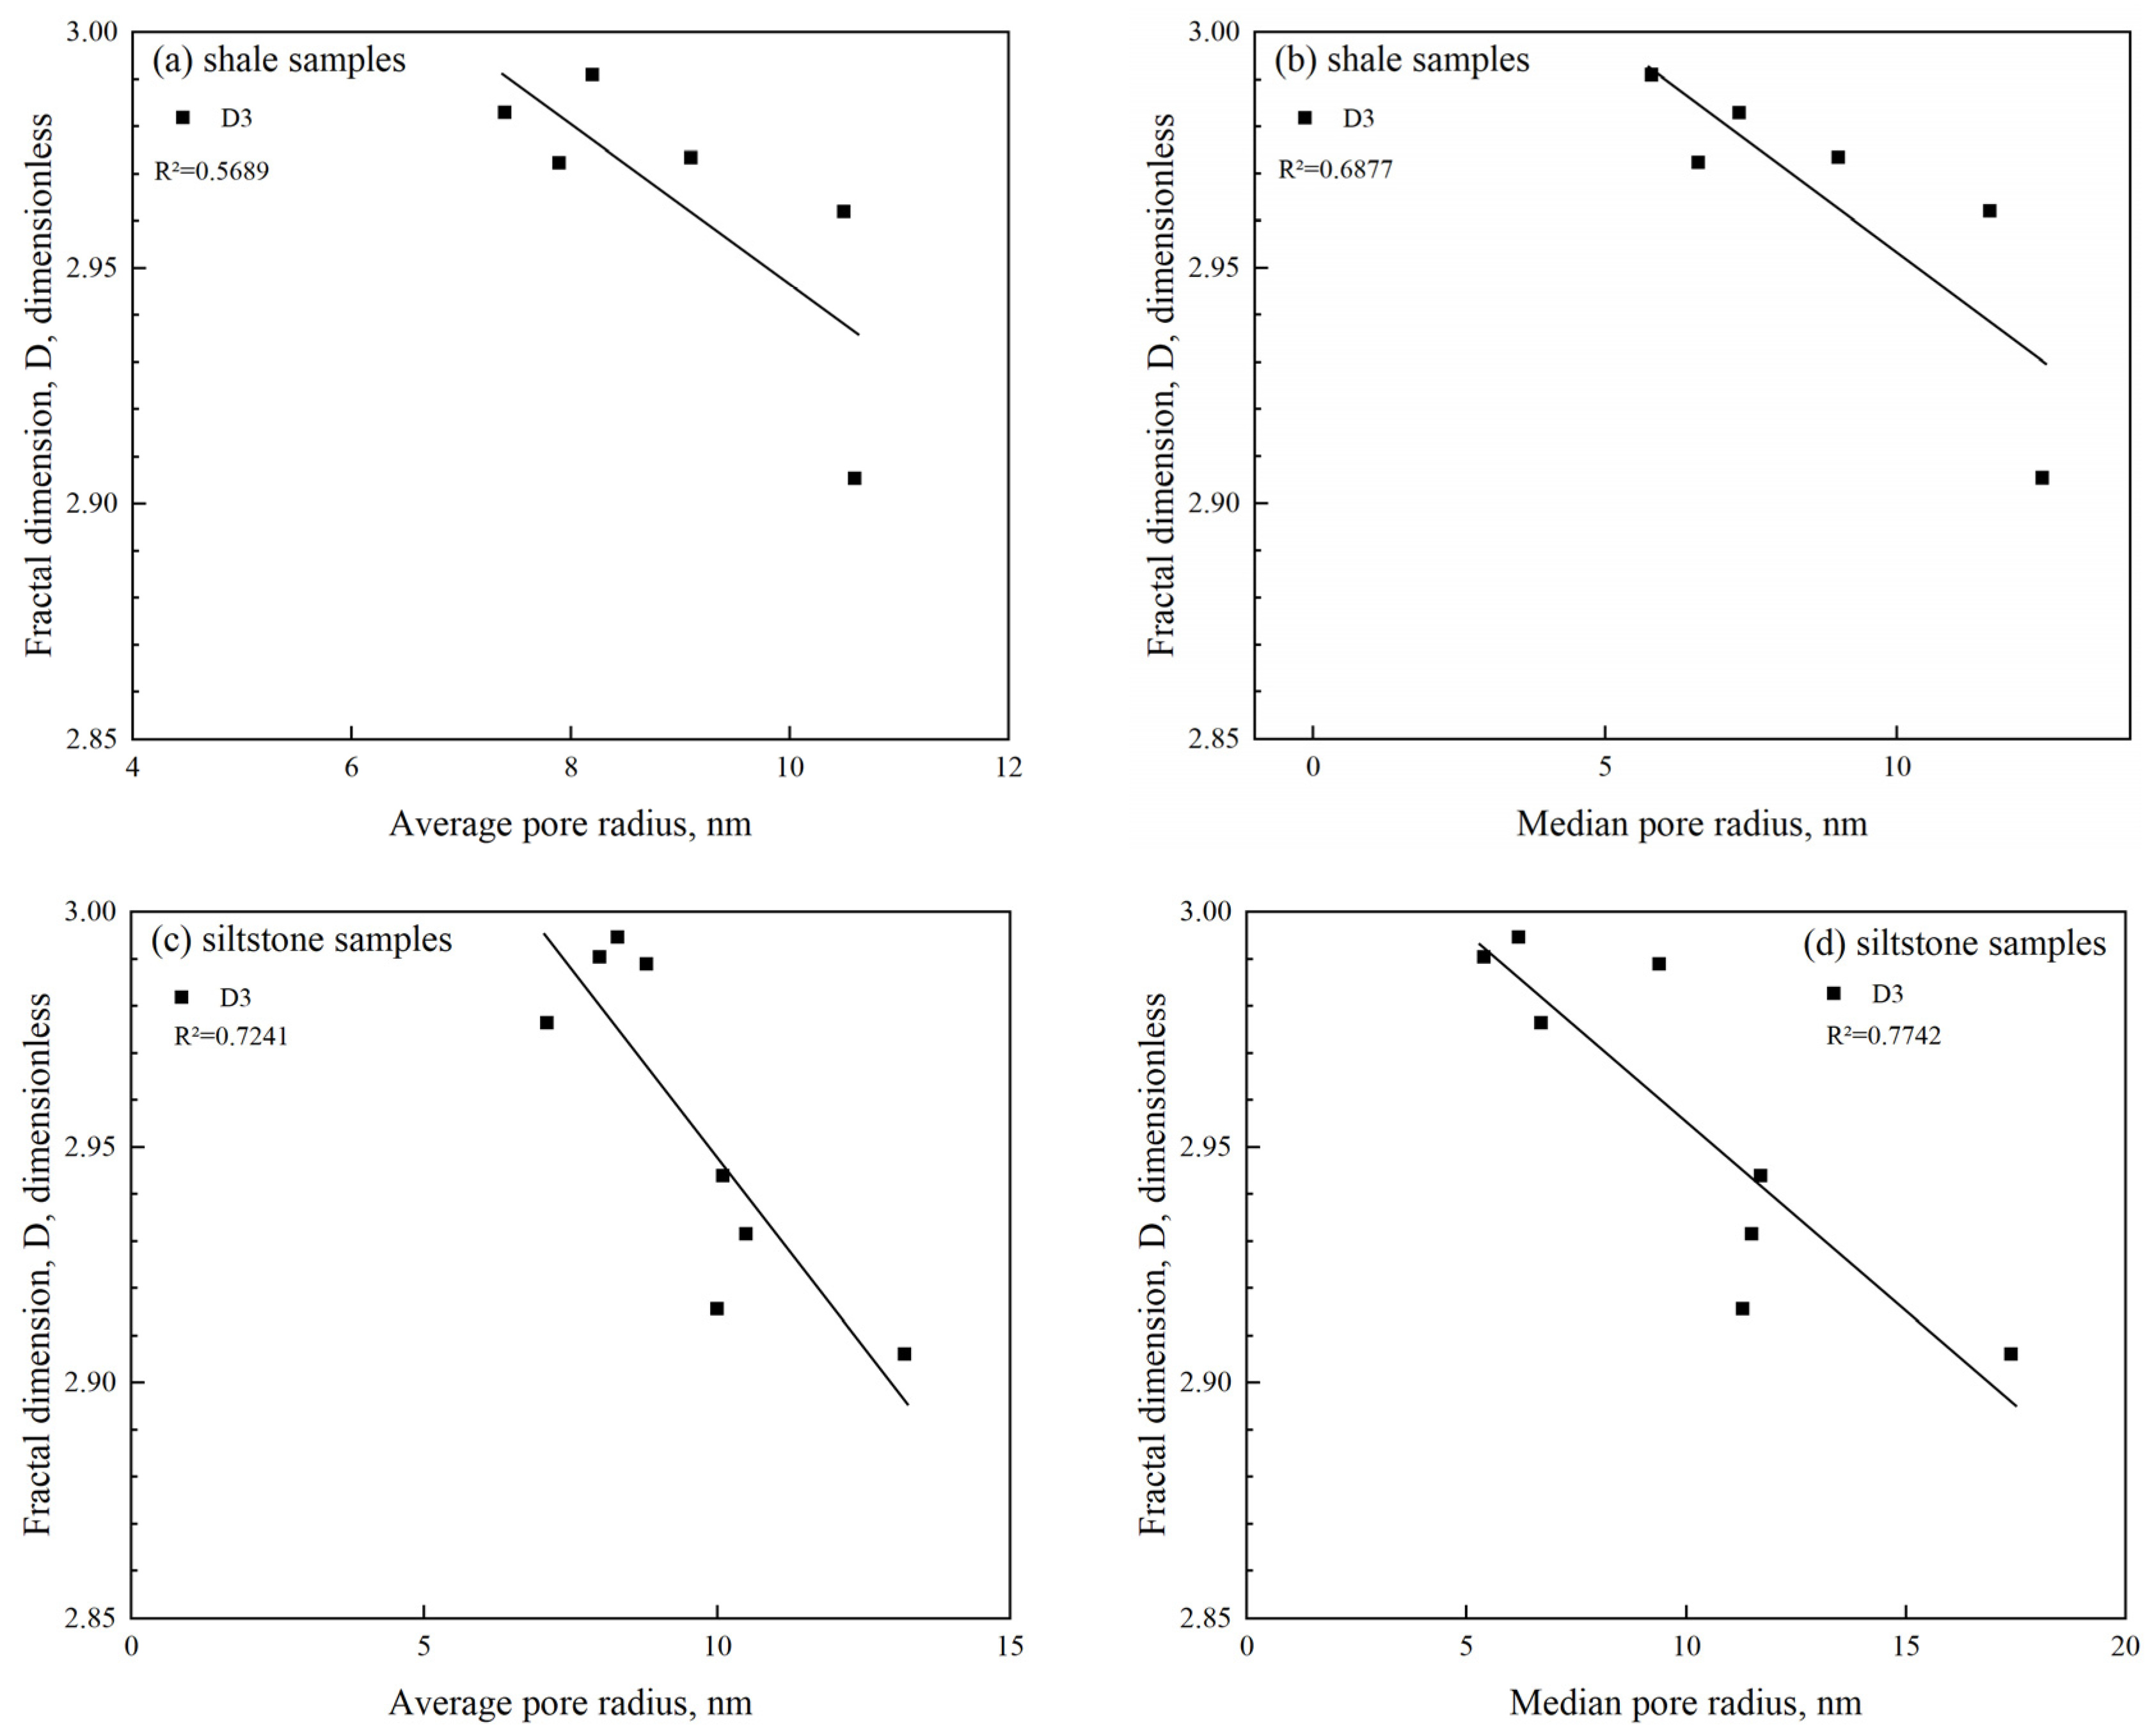
It is evident in Figure 15 that negative correlations exist between D3 and both the average/median pore diameter, with R2 values ranging from 0.5689 to 0.7742. This suggests that as the average pore diameter and median radius decrease, the pore structure of shale and siltstone samples becomes increasingly complex, with rougher surfaces and greater heterogeneity.

Figure 15.
Correlations between fractal dimension D3 and average pore diameter and median radius. (a,b) are for shale samples from the Upper LGS Formation. (c,d) are for siltstone samples from the Upper LGS Formation. D3 calculated based on fractal model presented in Section 3.5.
4.3.3. Multifractal Dimensions Obtained by NMR Curves
Using the full-scale PSD obtained by NMR experiments, the multifractal characteristics of shale and siltstone samples from the Upper LGS Formation were calculated, with q varying from −10 to 10, and with 0.2 as the interval. To distinguish from the single-exponent fractal dimensions, the multifractal dimensions obtained by NMR curves are all marked with a superscript “NMR”. Table 5 displays the generalized dimensions for different core samples, where , , and represent the capacity, information, and correlation dimensions, respectively. and represent the generalized dimensions at the minimum and maximum q values, respectively. The difference between and () is usually used to characterize the heterogeneity of PSD across the whole pore size range, and a larger value of indicates higher heterogeneity of the PSD.
Table 5.
Parameters of the generalized fractal dimensions spectrum.
Table 5 shows that the values of , , and for all of the shale and siltstone samples satisfy the following relationship: > > . This indicates that the pore structures of samples taken from the Upper LGS Formation exhibit multifractal characteristics, and the multifractal parameters are more appropriate to reflect the heterogeneous pore structures at different scales. Table 5 shows that the average for samples from subsection Liang 1 is 1.868, which is the lowest among all of the three subsections. This suggests that the pore structure of subsections Liang 2 and Liang 3 exhibits a higher degree of heterogeneity. Additionally, samples from subsection Liang 1 have the smallest , with an average value of 0.936 compared to the samples collected from subsections Liang 2 (average value of 0.971) and Liang 3 (average value of 0.963), confirming that the pore structure complexity in samples from subsections Liang 2 and Liang 3 is higher.
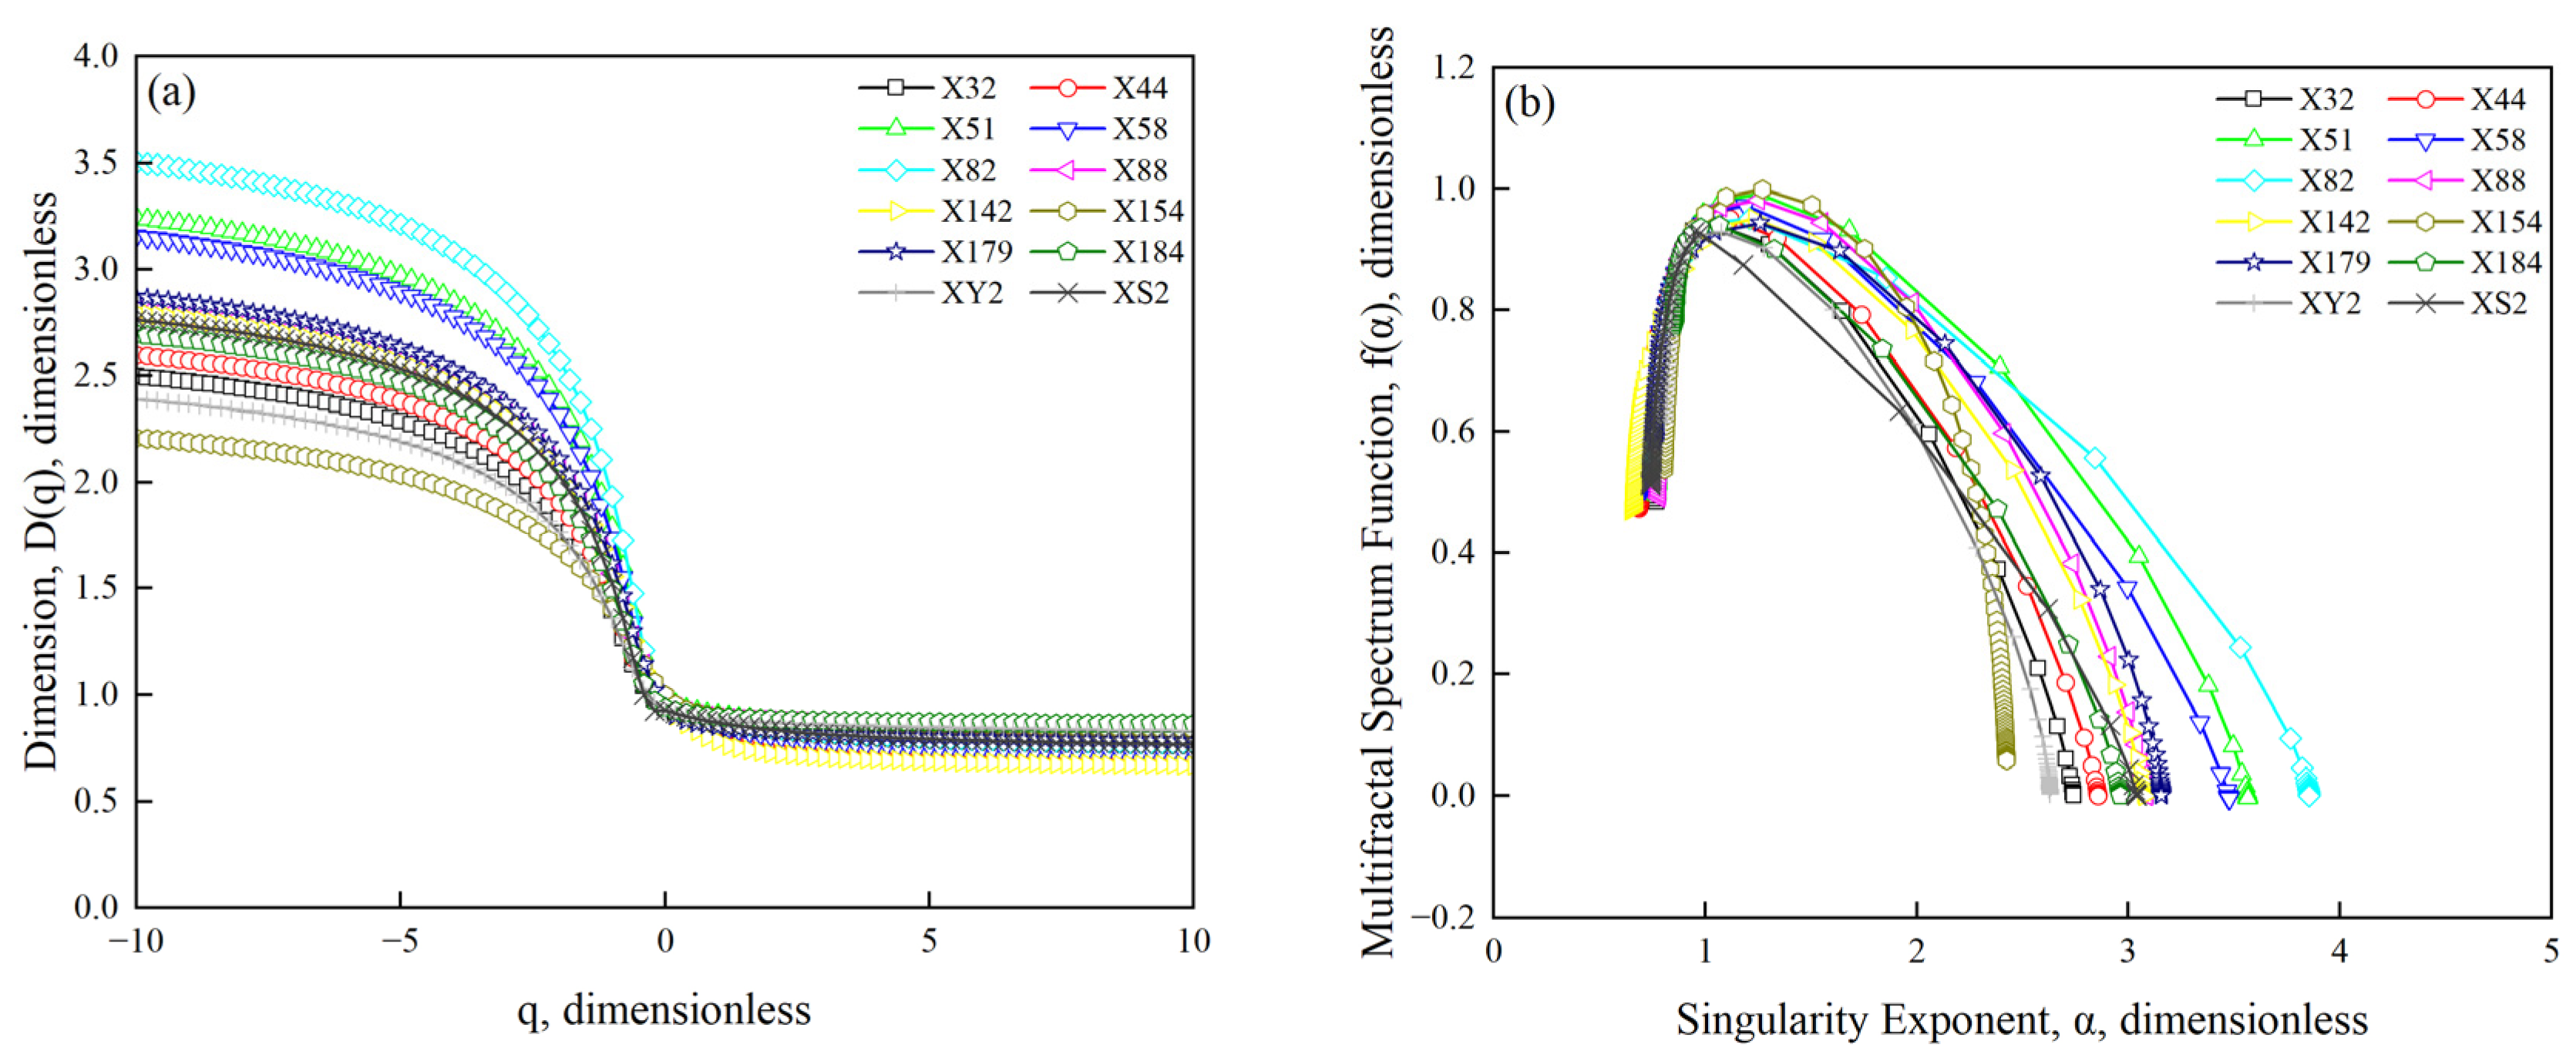
Figure 16a presents the Dq ~ q curves for all samples. As q increases, the variation of Dq follows two distinct trends, which include a sharp decrease for q < 0, and a gradual decline for q > 0. Figure 16b illustrates the multifractal spectra for all samples, and the f(α) spectrum typically exhibits a concave-down parabolic shape. The curve of f(α) initially increases with increasing α(q) and then decreases as α(q) increases. The singularity strength range, denoted as Δα (αmax − αmin), is a parameter that reflects the multifractal characteristics. A larger value of Δα always indicates greater heterogeneity. The Δα values of tested samples vary between 1.617 and 3.104, averaging 2.314 (Table 6), suggesting that the NMR T2 distributions of all samples exhibit notable heterogeneity. The average Δα of subsections Liang 2 and Liang 3 are both greater than the subsection Liang 1, with the average Δα of the subsection Liang 1 (2.155) being the smallest in the Upper LGS Formation. This confirms that the heterogeneity of the pore structures of subsection Liang 1 is the weakest.
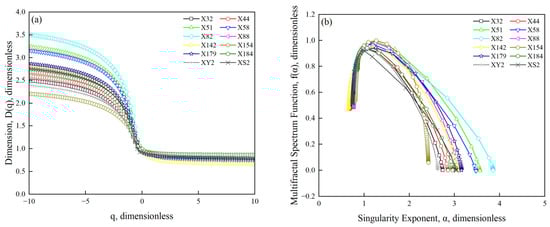
Figure 16.
(a) Generalized dimension (Dq) variation with moment q. (b) f(α) variation with singularity strength α. Dq and f(α) calculated based on multifractal model presented in Section 3.6.
Table 6.
Parameters of multifractal singular spectrum.
In addition, the ∼α0 cross-plot can effectively indicate the multifractal characteristics and heterogeneity of pore structures. The and α0 values of all samples are distributed above the diagonal line, suggesting that the pore structures of shale and siltstone samples conform to multifractal characteristics (Figure 17). Moreover, further deviation of ∼α0 points away from the diagonal line, suggesting a more heterogeneous pore structure. Overall, the ∼α0 points of samples from subsection Liang 1 are closer to the diagonal line, compared to samples from subsections Liang 2 and Liang 3, further confirming that the pore structure of subsection Liang 1 has the lowest heterogeneity and complexity, whereas subsections Liang 2 and Liang 3 exhibit greater heterogeneity.
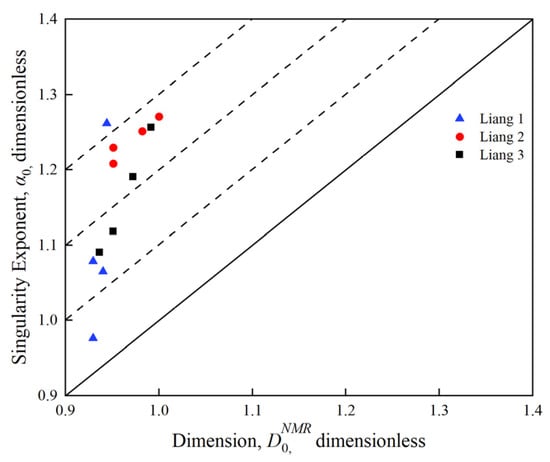
Figure 17.
∼α0 cross-plot of shale and siltstone samples from the Upper LGS Formation.
4.3.4. Fractal Characteristics of Multi-Scale Pore Structure and Fluid Diffusion
Multi-scaled and heterogeneous pore structures of unconventional reservoirs (such as shale oil reservoir, tight oil reservoirs, etc.) have a significant influence on fluid diffusion in the porous media. In highly heterogeneous and disordered porous media, the interaction of heterogeneous pore–throat structure, anisotropy, and connectivity give rise to anomalous diffusion, which deviates from classical Fickian diffusion. Rajyaguru et al. and Fomin et al. [55,56] systematically analyzed the anomalous diffusion through disordered porous rock materials, and proposed general solutions which can describe a broad range of anomalous diffusion, from highly anomalous to nearly Fickian. Li [57] also found that a larger fractal dimension of pore structure will lead to a more complex diffusion path of fluid molecules, which further affects fluid diffusion in unconventional reservoirs. Understanding how the fractal nature of multi-scaled pore space governs anomalous diffusion dynamics can help optimize gas production strategies, and thus enhance oil recovery in shale oil reservoirs. The main objective of this manuscript is to clarify the multi-scaled pore structures of the Upper LGS Formation, and more research on the relationship between fractal characteristics and anomalous diffusion through porous shale will be conducted in our future work.
5. Conclusions
In this research, the multi-scaled pore structure characteristics of core samples from the Upper LGS Formation of the northeastern Sichuan Basin were investigated using the LTCA, LTNA, HPMI, and NMR techniques. Fractal characteristics of core samples collected from different subsections were determined and analyzed by applying single-fractal models and multifractal theory. The following conclusion can thus be obtained:
(1) The adsorption capacity and SSA of samples from different subsections in the Upper LGS formation vary slightly. The samples from subsection Liang 1 have the largest average N2 adsorption amount, and the samples from subsection Liang 3 have the smallest values of the average maximum N2 adsorption amount. The SSA of the samples from subsections Liang 2 and Liang 1 is larger than that from subsection Liang 3, indicating that degrees of pore development in subsections Liang 1 and Liang 2 are higher. The subsections Liang 1 and Liang 2 are more favorable development sections for shale oil compared to subsection Liang 3.
(2) For samples taken from the Upper LGS Formation, both the average maximum N2 adsorption amount and SSA of the shale samples are larger than those of the siltstones, while the pore diameter corresponding to the peak of the PSD curves of siltstones is consistently larger than that of shales, indicating that shale samples have more heterogeneous pore structures.
(3) The NMR T2 spectra are converted to pore size distribution by combining LTCA, LTNA, and HPMI data, which can effectively characterize the full-scale PSD of the shale and siltstone samples in the Upper LGS Formation in the northeastern Sichuan Basin. The conversion coefficients of NMR T2 spectra vary slightly across different layers and lithologies, with an overall range between 30 and 80.
(4) The average values of single-fractal dimensions (D1, D2) obtained by LTNA data are 2.39 and 2.62 for shale samples, and 2.24 and 2.59 for siltstone samples, respectively, indicating the pore structures of shale samples are more complex and heterogenous than those of siltstone samples. The average single-fractal dimension D3 of shale samples calculated from HPMI data is also larger than that of siltstone samples, confirming that the structures of macropores in shale samples are more intricate than those in siltstone samples. D1 and D2 are positively correlated with the SSA, the volume of micropores, and the volume of mesopores, while the D3 of macropores shows a negative correlation with both the average median radius and pore diameter.
(5) Shale and siltstone samples from the Upper LGS formation have multifractal characteristics. Among all three of the subsections, core samples from subsection Liang 1 have the smallest , with an average value of 0.936, and the smallest Δα, with an average value of 2.155, as well as the smallest , with an average value of 1.868, indicating that the pore structure heterogeneity and complexity of the subsection Liang 1 is the weakest.
(6) The multifractal characteristics of pore structure exert a significant influence on gas and oil diffusion dynamics in highly heterogeneous and disordered porous media, such as shale oil reservoirs. A better understanding of the relationship between fractal characteristics of pore spaces and anomalous diffusion dynamics in shales is critical for production strategy optimization and displacement efficiency evaluation of shale oil reservoirs. This research unveils the multifractal characteristics of core samples in the Upper Lianggaoshan Formation, which provides a foundation for further investigation of anomalous diffusion in the multifractal shale formations. The methods presented in this work can also be extended to investigate the variation of multifractal characteristics of shales during the CO2 storage process.
Author Contributions
Conceptualization, J.G.; methodology, H.W. and L.Z.; software, J.G. and G.L.; validation, J.G., G.L. and H.W.; formal analysis, J.G. and G.L.; investigation, J.G. and G.L.; resources, H.W.; data curation, J.G. and H.W.; writing—original draft preparation, G.L.; writing—review and editing, J.G. and L.Z.; visualization, G.L.; supervision, L.Z.; project administration, J.G.; funding acquisition, J.G. and H.W. All authors have read and agreed to the published version of the manuscript.
Funding
This work was financially supported by the National Natural Science Foundation of China (Grant No. 52174036), the Sichuan Province Science and Technology Program (Grant No.s 2024NSFSC2008, 2024NSFSC0199), and the Joint Fund for Innovation and Development of Chongqing Natural Science Foundation (Grant No. 2023NSCQ-LZX0184).
Data Availability Statement
The original contributions presented in this study are included in the article. Further inquiries can be directed to the corresponding author.
Acknowledgments
The authors would like to thank the reviewers and the editor for their valuable comments and helpful suggestions to improve this manuscript.
Conflicts of Interest
No potential conflicts of interest were reported by the authors.
Abbreviations
The following abbreviations are used in this manuscript:
| BJH | Barrette–Joyner–Halenda |
| BET | Brunauer–Emmett–Teller |
| CPMG | Carr-Purcell-Meiboom-Gill |
| FHH | Frenkel–Halsey–Hill |
| HPMI | high-pressure mercury intrusion |
| IUPAC | International Union of Pure and Applied Chemistry |
| LGS | Lianggaoshan |
| LTCA | low-pressure CO2 adsorption |
| LTNA | low-temperature N2 adsorption |
| NMR | nuclear magnetic resonance |
| NK | Neimark–Kiselev |
| PV | Pore Volume |
| PSD | pore size distribution |
| SSA | Specific Surface Area |
Appendix A
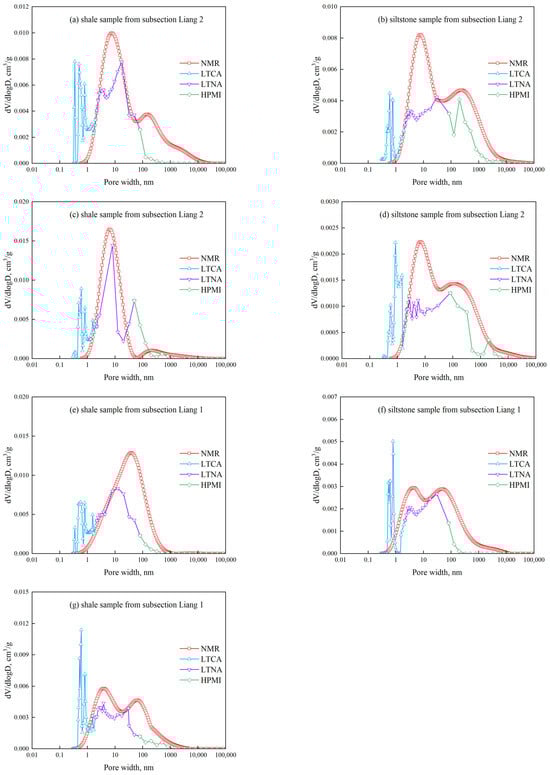
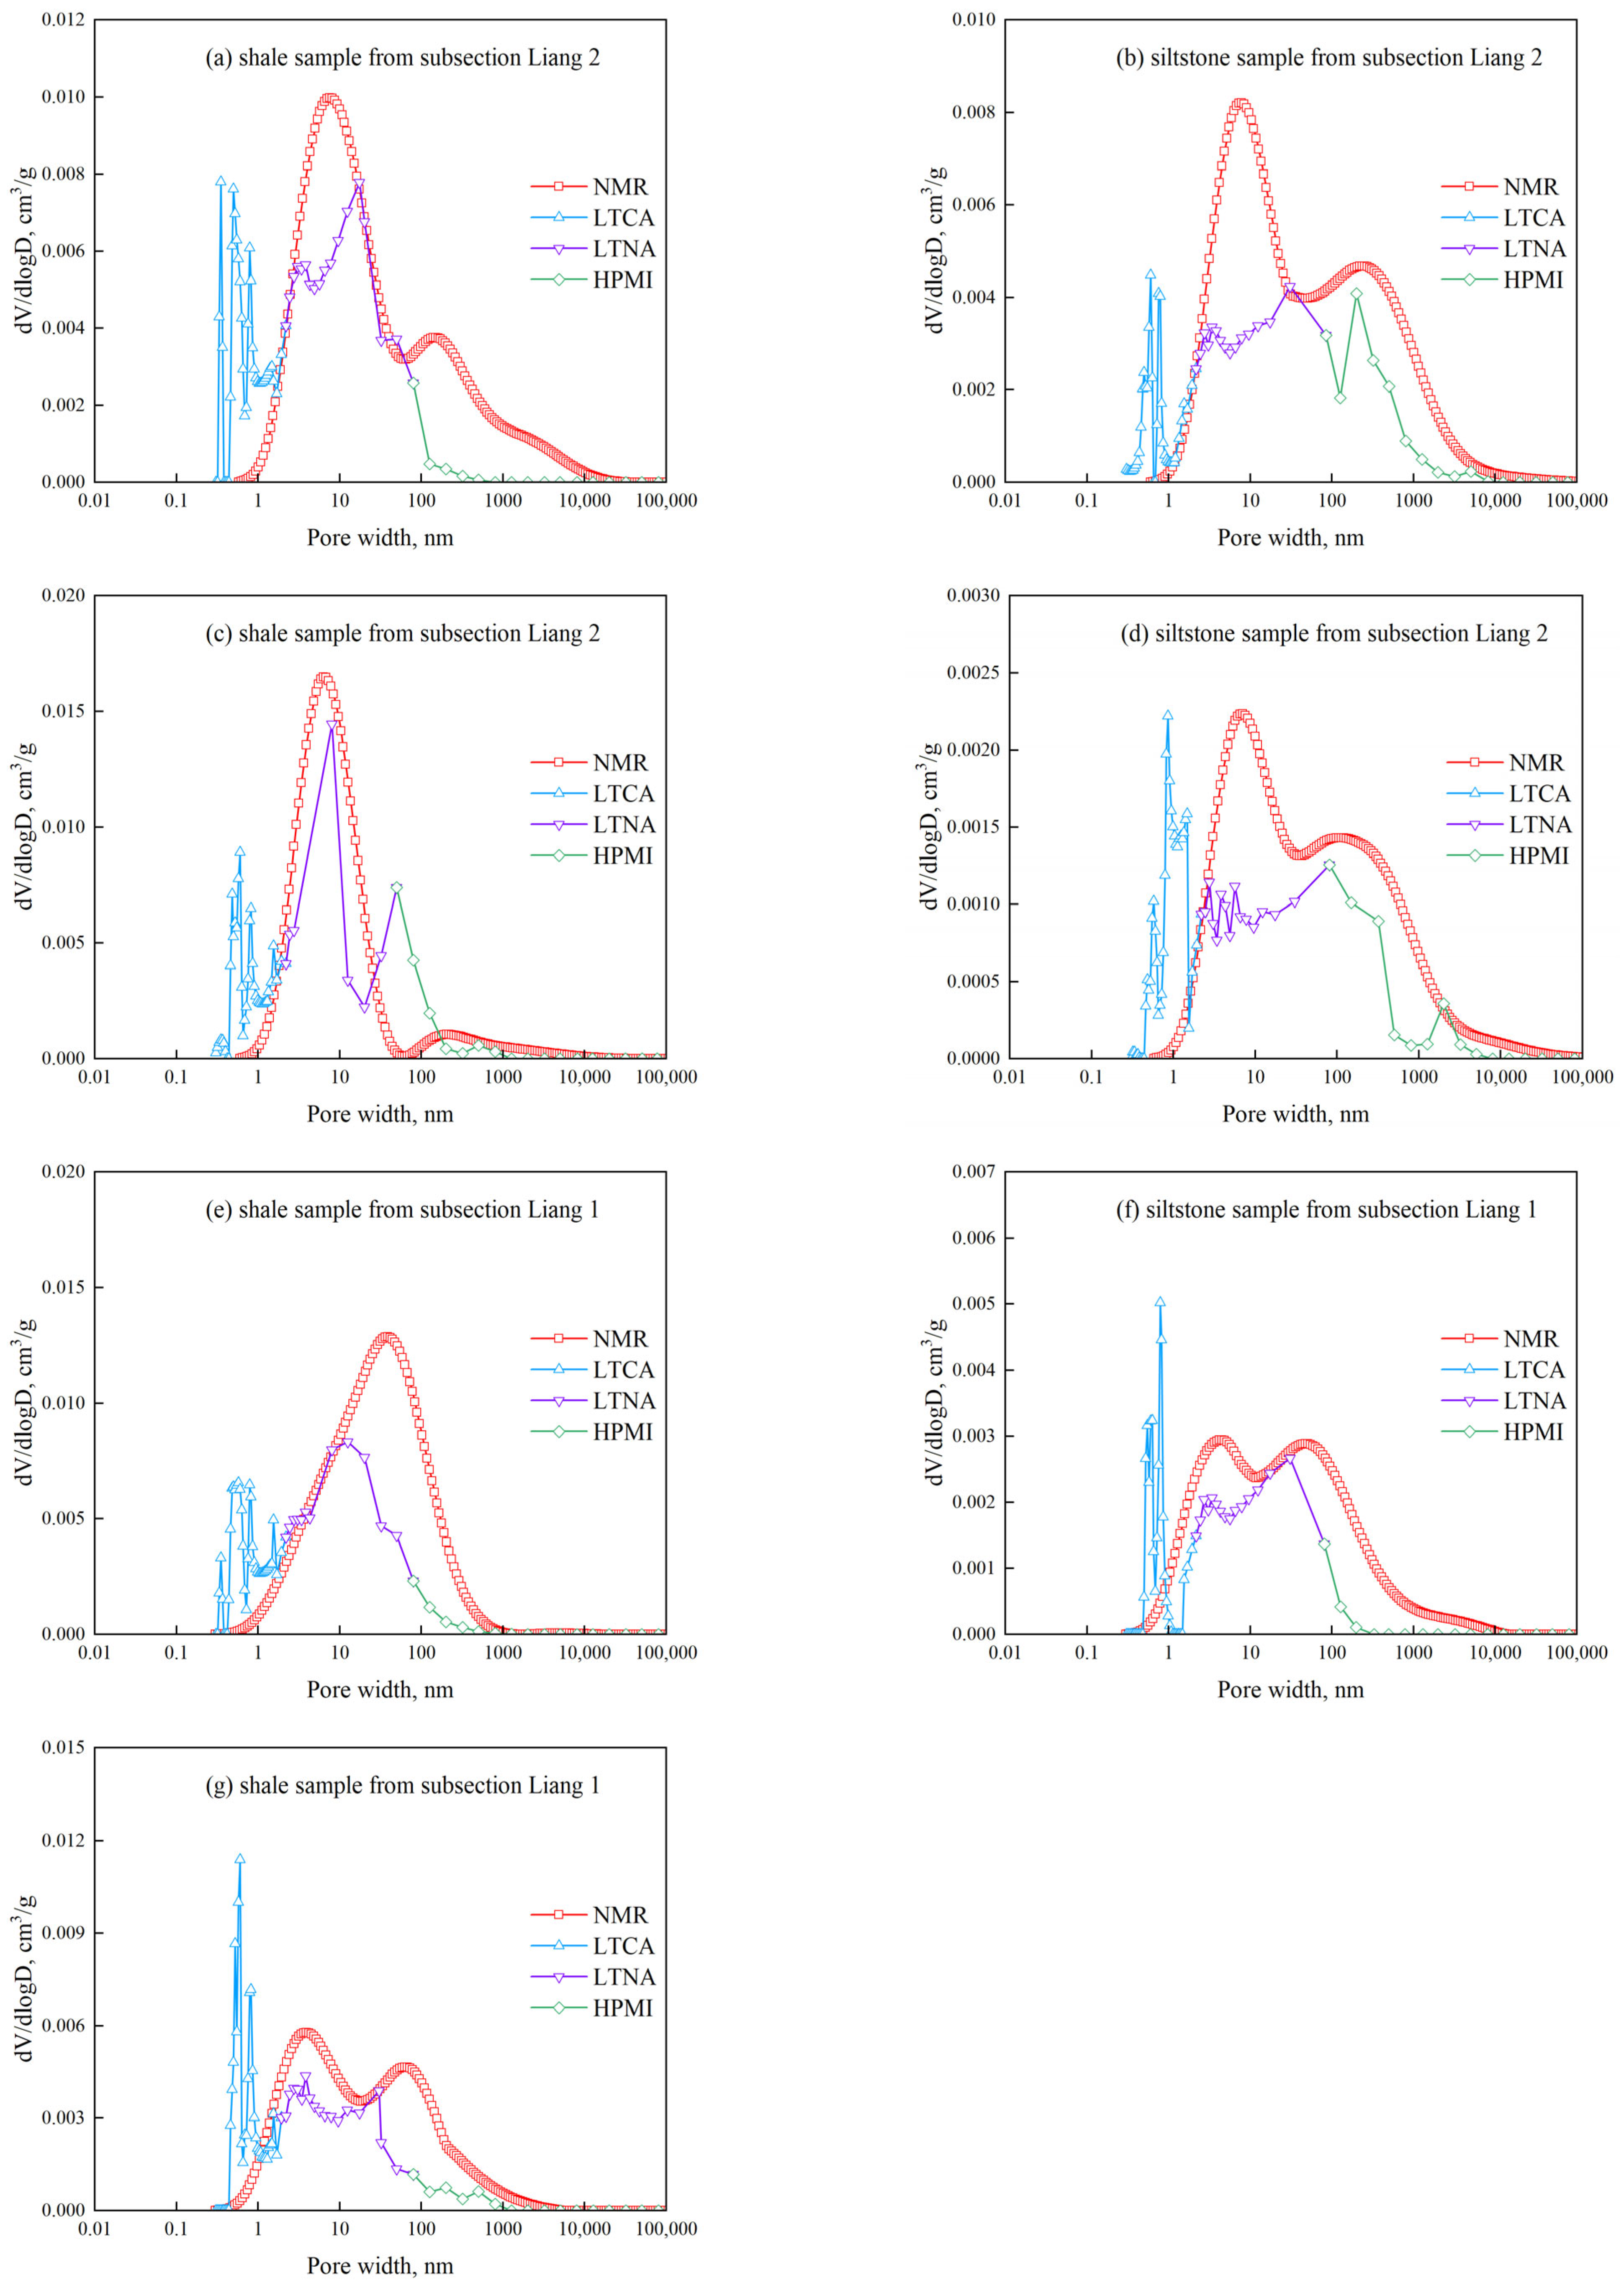
Figure A1.
Full-scale PSD curves of representative samples taken from the Upper of LGS Formation. (a,c) Representative shale sample from subsection Liang 2; (b,d) representative siltstone sample from subsection Liang 2; (e,g) representative shale sample from subsection Liang 1; (f) representative siltstone sample from subsection Liang 1.
References
- Liu, G.; Liu, R.; Du, J.; Zhang, K.; Yu, J.; Liu, Q. Study on Pore Structure and Fractal Characterization during Thermal Evolution of Oil Shale Experiments. ACS Omega 2022, 7, 12922–12936. [Google Scholar] [CrossRef] [PubMed]
- Zhao, J.; Dong, X.; Zhang, J.; Chen, H.; Zhang, W. A 3D FIB-SEM technique for quantitative characterization of oil shale’s microstructure: A case study from the Shahejie Formation in Dongying Depression, China. Energy Sci. Eng. 2021, 9, 116–128. [Google Scholar] [CrossRef]
- He, W.; Meng, Q.; Feng, Z.; Zhang, J.; Wang, R. In-situ accumulation theory and exploration & development practice ofGulong shale oil in Songliao Basin. Acta Pet. Sin. 2022, 43, 1–14. [Google Scholar] [CrossRef]
- Lu, F.; Zhou, Y.; Wang, P.; Jia, K.; Han, G. Pore Characteristics of Oil Shales in Jilin Province, Northeast China: Investigations Using Gas Adsorption, Mercury Intrusion, and NMR Cryoporometry. Energy Fuels 2023, 37, 11914–11927. [Google Scholar] [CrossRef]
- Zhang, P.; Yin, Y.; Lu, S.; Li, J.; Chang, X.; Zhang, J.; Pang, Y.; Chen, G.; Liu, Y.; Li, Z. Insights into Pore Structures and Multifractal Characteristics of Shale Oil Reservoirs: A Case Study from Dongying Sag, Bohai Bay Basin, China. Energy Fuels 2022, 36, 8224–8237. [Google Scholar] [CrossRef]
- Clarkson, C.R.; Solano, N.; Bustin, R.M.; Bustin, A.M.M.; Chalmers, G.R.L.; He, L.; Melnichenko, Y.B.; Radlinski, A.P.; Blach, T.P. Pore structure characterization of North American shale gas reservoirs using USANS/SANS, gas adsorption, and mercury intrusion. Fuel 2013, 103, 606–616. [Google Scholar] [CrossRef]
- Liu, X.; Xiong, J.; Liang, L. Investigation of pore structure and fractal characteristics of organic-rich Yanchang formation shale in central China by nitrogen adsorption/desorption analysis. J. Nat. Gas Sci. Eng. 2015, 22, 62–72. [Google Scholar] [CrossRef]
- Yan, J.; He, X.; Geng, B.; Hu, Q.; Feng, C.; Kou, X.; Li, X. Nuclear magnetic resonance T2 spectrum: Multifractal characteristics and pore structure evaluation. Appl. Geophys. 2017, 14, 205–215. [Google Scholar] [CrossRef]
- Hong, H.; Lu, J.; Qin, C.; Zhang, S.; Zhang, R.; Zhou, Y.; Xiao, Z.; Xiao, H.; Han, L. Shale oil reservoir characteristics and exploration implication in Da’anzhai Member of Jurassic Ziliujing Formation in central Sichuan Basin. Pet. Geol. Exp. 2024, 46, 11–21. [Google Scholar] [CrossRef]
- Wang, Z.; Fu, X.; Hao, M.; Li, G.; Pan, J.; Niu, Q.; Zhou, H. Experimental insights into the adsorption-desorption of CH4/N2 and induced strain for medium-rank coals. J. Pet. Sci. Eng. 2021, 204, 108705. [Google Scholar] [CrossRef]
- Lei, J.; Pan, B.; Guo, Y.; Fan, Y.; Xue, L.; Deng, S.; Zhang, L.; Ruhan, A. A comprehensive analysis of the pyrolysis effects on oil shale pore structures at multiscale using different measurement methods. Energy 2021, 227, 120359. [Google Scholar] [CrossRef]
- Maria, M.; Agnieszka, D.; Arndt, S. Porosity of Devonian and Mississippian New Albany Shale across a maturation gradient: Insights from organic petrology, gas adsorption, and mercury intrusion. AAPG Bull. 2013, 97, 1621–1643. [Google Scholar] [CrossRef]
- Lu, Z.; Liu, C.; Zang, Q.; Wu, Y.; Yang, X.; Yang, H.; Zeng, X.; Li, W. Analysis of the pore structure of tight sandstone by high-pressure mercury injection combined with fractal theory: A case study of the Heshui area in the Ordos Basin. Bull. Geol. Sci. Technol. 2023, 42, 264–273. [Google Scholar] [CrossRef]
- Yang, R.; He, S.; Yi, J.; Hu, Q. Nano-scale pore structure and fractal dimension of organic-rich Wufeng-Longmaxi shale from Jiaoshiba area, Sichuan Basin: Investigations using FE-SEM, gas adsorption and helium pycnometry. Mar. Pet. Geol. 2016, 70, 27–45. [Google Scholar] [CrossRef]
- Rui, Y.; Wang, C.; Zhang, F.; Yao, Y.; Guo, N.; Zheng, R. Characterization of micro-pore throats in the shale gas reservoirs of Zhaotong National Shale Gas Demonstration Area. Nat. Gas Ind. 2021, 41, 78–85. [Google Scholar]
- Zhao, Y.; Sun, Y.; Liu, S.; Wang, K.; Jiang, Y. Pore structure characterization of coal by NMR cryoporometry. Fuel 2017, 190, 359–369. [Google Scholar] [CrossRef]
- Zhang, P.; Lu, S.; Li, J. Characterization of pore size distributions of shale oil reservoirs: A case study from Dongying sag, Bohai Bay basin, China. Mar. Pet. Geol. 2019, 100, 297–308. [Google Scholar] [CrossRef]
- Jin, J.; Liu, W.; Wang, Z.; Guo, H.; Li, Q.; Li, Z.; Bai, N.; Liu, J. Quantitative Characterization of Shale Pore Size Distribution Based on Nuclear Magnetic Resonance T2 Spectrum. Sci. Technol. Eng. 2022, 22, 6448–6455. [Google Scholar]
- Chang, J.; Fan, X.; Jiang, Z.; Wang, X.; Chen, Z. Differential impact of clay minerals and organic matter on pore structure and its fractal characteristics of marine and continental shales in China. Appl. Clay Sci. 2022, 216, 106334. [Google Scholar] [CrossRef]
- Ma, B.; Hu, Q.; Yang, S.; Zhang, T.; Qiao, H.; Meng, M.; Zhu, X.; Sun, X. Pore structure typing and fractal characteristics of lacustrine shale from Kongdian Formation in East China. J. Nat. Gas Sci. Eng. 2020, 85, 103709. [Google Scholar] [CrossRef]
- Zhang, Q.; Liang, F.; Liang, P.; Zhou, S.; Guo, W.; Guo, W.; Lu, B.; Liu, W. Investigation of fractal characteristics and its main controlling factors of shalereservoir: A case study of the Longmaxi shale in Weiyuan shale gas field. J. China Univ. Min. Technol. 2020, 49, 110–122. [Google Scholar] [CrossRef]
- Yang, F.; Ning, Z.; Wang, Q.; Kong, D.; Peng, K.; Xiao, L. Fractal characteristics of nanopore in shales. Nat. Gas Geosci. 2014, 25, 618–623. [Google Scholar] [CrossRef]
- Ji, W.; Song, Y.; Jiang, Z.; Meng, M.; Liu, Q.; Chen, L.; Wang, P.; Gao, F.; Huang, H. Fractal characteristics of nano-pores in the Lower Silurian Longmaxi shales from the Upper Yangtze Platform, south China. Mar. Pet. Geol. 2016, 78, 88–98. [Google Scholar] [CrossRef]
- Tang, L.; Song, Y.; Jiang, Z.; Jiang, S.; Li, Q. Pore Structure and Fractal Characteristics of Distinct Thermally Mature Shales. Energy Fuels 2019, 33, 5116–5128. [Google Scholar] [CrossRef]
- Hu, D.; Li, Z.; Wei, Z.; Duan, J.; Miao, Z.; Pan, L.; Li, C.; Duan, H. Major advancement in oil and gas exploration of Jurassic channel sandstone in Well Bazhong 1HF in northern Sichuan Basin and its significance. Nat. Gas Ind. B 2023, 10, 270–282. [Google Scholar] [CrossRef]
- Wang, X.; Wang, M.; Zhao, C.; Yang, X.; Jia, Y.; Wu, R.; Li, T.; Zhao, X.; Tang, Y. Reservoir characteristics and controlling factors of the middle–high maturity multiple lithofacies reservoirs of the Lianggaoshan Formation shale strata in the northeastern Sichuan basin, China. Mar. Pet. Geol. 2024, 161, 106692. [Google Scholar] [CrossRef]
- He, W.; He, H.; Wang, Y.; Cui, B.; Meng, Q.; Guo, X.; Bai, X.; Wang, Y. Major breakthrough and significance of shale oil of the Jurassic Lianggaoshan Formation in Well Ping’an 1 in northeastern Sichuan Basin. China Pet. Explor. 2022, 27, 40–49. [Google Scholar] [CrossRef]
- Li, J.; Tao, S.; Wang, Z.; Zou, C.; Gao, X.; Wang, S. Characteristics of Jurassic Petroleum Geology and Main Factors of Hydrocarbon Accumulation in NE Sichuan Basin. Nat. Gas Geosci. 2010, 21, 732–741. [Google Scholar]
- Yang, Y.; Yang, J.; Yang, G.; Tao, S.; Ni, C.; Zhang, B.; He, X.; Lin, J.; Huang, D.; Liu, M.; et al. New research progress of Jurassie tight oil in central Sichuan Basin. Pet. Explor. Dev. 2016, 43, 873–882. [Google Scholar] [CrossRef]
- Chen, S.; Gao, X.; Wang, L.; Lu, J.; Liu, C.; Tang, H.; Zhang, H.X.; Huang, Y.; Ni, S. Factors controlling oiliness of Jurassic Lianggaoshan tight sands in central Sichuan Basin, SW China. J. Pet. Explor. Dev. 2014, 41, 421–427. [Google Scholar] [CrossRef]
- Chen, M.; Wang, L.; He, J.; Tan, J.; Hong, H.; Zhao, D.; Kong, L.; Cai, C.; Tan, Y. Application of rock pyrolysis experiment in oil-bearing property evaluation of shale oil reservoir: A case study of the Jurassic Lianggaoshan Formation in the northeastern Sichuan Basin. China Pet. Explor. 2024, 29, 166–176. [Google Scholar] [CrossRef]
- Wang, Y.; Mao, C.; Duan, X. Coupling of Paleosedimentary Environment and Lithofacies: Implications for Shale Oil Enrichment in the Lianggaoshan Formation, Northeastern Sichuan Basin, China. ACS Omega 2024, 9, 28237–28252. [Google Scholar] [CrossRef]
- Mandelbrot, B.B.; Passoja, D.E.; Paullay, A.J. Fractal character of fracture surfaces of metals. Nature 1984, 308, 721–722. [Google Scholar] [CrossRef]
- Zhang, Z.; Weller, A. Fractal dimension of pore-space geometry of an Eocene sandstone formation. Geophysics 2014, 79, 377–387. [Google Scholar] [CrossRef]
- Lai, J.; Wang, G.; Wang, Z.; Chen, J.; Pang, X.; Wang, S.; Zhou, Z.; He, Z.; Qin, Z.; Fan, X. A review on pore structure characterization in tight sandstones. Earth Sci. Rev. 2018, 177, 436–457. [Google Scholar] [CrossRef]
- Huang, J.; Dong, D.; Li, J.; Hu, J.; Wang, Y. Reservoir fractal characteristics of continental shale: An example from Triassic Xujiahe Formation shale, Sichuan Basin, China. Nat. Gas Geosci. 2016, 27, 1611–1618. [Google Scholar] [CrossRef]
- Pratiksha, D.K.; Lalit, K.K.; Nandi, S. Characterization of heterogeneous petroleum reservoir of Indian Sub-continent: An integrated approach of hydraulic flow unit—Mercury intrusion capillary pressure—Fractal model. J. Pet. Sci. Eng. 2021, 205, 108788. [Google Scholar] [CrossRef]
- Li, X.; Wang, Y.; Lin, W.; Ma, L.; Liu, D.; Liu, J.; Zhang, Y. Micro-pore structure and fractal characteristics of deep shale from Wufeng Formation to Longmaxi Formation in Jingmen exploration area, Hubei Province, China. J. Nat. Gas Geosci. 2022, 7, 121–132. [Google Scholar] [CrossRef]
- Zhao, H.; Guo, Y.; Du, X.; Hu, Y.; Kang, R.; Shangguan, J.W. Micro-pore multifractal characteristics of Benxi Formation sandstone reservoir in Gaogiao area, Ordos Basin. Bull. Geol. Sci. Technol. 2020, 39, 175–184. [Google Scholar] [CrossRef]
- Peng, Y.; Du, Y.; Jiang, L.; Fang, Z.; Chao, J.; Yang, Y.; Sun, N.; Cao, Z. Micropore structure and fractal characteristics of shale oil reservoir in gentle slope zone of jiyang Depression. Fault-Block Oil Gas Field 2023, 30, 535–544. [Google Scholar]
- Zhao, D.; Guo, Y.; Xie, D.; Su, C.; Yang, Y.; Yu, Y. Fractal characteristics of shale reservoir pores based on low-temperature nitrogen adsorption experiments. J. Northeast Pet. Univ. 2014, 38, 100–108. [Google Scholar] [CrossRef]
- Bu, H.; Ju, Y.; Tan, J.; Wang, G.; Li, X. Fractal characteristics of pores in non-marine shales from the Huainan coalfield, eastern China. J. Nat. Gas Sci. Eng. 2015, 24, 166–177. [Google Scholar] [CrossRef]
- Wang, J. Fine Characterization of Shale Reservoir of Taiyuan and Shanxi Formations in Yulin Area, Ordos Basin. Ph.D. Thesis, China University of Geosciences, Beijing, China, 2021. [Google Scholar]
- Li, P.; Zheng, M.; Bi, H.; Wu, S.; Wang, X. Pore throat structure and fractal characteristics of tight oil sandstone: A case study in the Ordos Basin, China. J. Pet. Sci. Eng. 2017, 149, 665–674. [Google Scholar] [CrossRef]
- Wang, F.; Zai, Y. Fractal and multifractal characteristics of shale nanopores. Results Phys. 2021, 25, 104277. [Google Scholar] [CrossRef]
- Wu, Y.; Liu, C.; Ouyang, S.; Luo, B.; Zhao, D.; Sun, W.; Awan, R.S.; Lu, Z.; Li, G.; Zang, Q. Investigation of pore-throat structure and fractal characteristics of tight sandstones using HPMI, CRMI, and NMR methods: A case study of the lower Shihezi Formation in the Sulige area, Ordos Basin. J. Pet. Sci. Eng. 2022, 210, 110053. [Google Scholar] [CrossRef]
- Wang, X.; Qi, M.; Hu, Y.; Qiu, Y. Analysis Of The Shale Pore Structures By The Combination Of High-Pressure Mercury Injection and Fractal Theory. Pet. Geol. Oilfield Dev. Daqin 2015, 34, 165–169. [Google Scholar] [CrossRef]
- Gouyet, J.-F.; Bug, A.L.R. Physics and Fractal Structures. Am. J. Phys. 1997, 65, 676. [Google Scholar] [CrossRef]
- Maslov, N.; Haris, K.; Latha, G.; Chakraborty, B. Multifractal Approach for Seafloor Characterization. IEEE Geosci. Remote Sens. Lett. 2014, 11, 54–58. [Google Scholar] [CrossRef]
- Ge, X.; Xiao, Y.; Fan, Y.; Liu, J.; Zhang, Y. Laboratory investigation of the relationship between static rock elastic parameters and low field nuclear magnetic resonance data. Int. J. Rock Mech. Min. Sci. 2020, 127, 104207. [Google Scholar] [CrossRef]
- Yang, X.; Wang, M.; Bai, X.; Wang, X.; Ying, Y.; Li, T.; Dong, J.; Huang, S.; Chen, J. Reservoir Space Characteristics and Exploration of Shale Oil Mobility of the Jurassic Lianggaoshan Formation Shale in the northeasten Sichuan Basin. Petroleum. Science. Bulletin. 2024, 9, 196–212. [Google Scholar] [CrossRef]
- Wu, J. Study on Pore Structure and Wettability of Shale Reservoir in Lianggaosahn Formation in Eastern Sichuan. Master’s Thesis, Yangtze University, Jingzhou, China, 2023. [Google Scholar]
- Yu, H.; Yang, R.; He, Z.; Bao, H.; Han, Y.; Zhang, W.; Xiong, S.; Wang, F.; Hu, Q.; He, S. Full-Scale Pore Structure and Fractal Characteristics of Continental Organic-Rich Shale: A Case Study of the Dongyuemiao Member of Jurassic Ziliujing Formation in the Fuxing Area, Eastern Sichuan Basin. Energy Fuels 2023, 37, 10426–10443. [Google Scholar] [CrossRef]
- Xiao, L.; Li, Z.; Yang, Y.; Tang, L.; Liang, Z.; Yu, H.; Hou, Y.; Wang, L. Pore structure and fractal characteristics of different lithofacies shales of the Lower Silurian Longmaxi Formation in southeast Chongqing. Sci. Technol. Eng. 2021, 21, 512–521. [Google Scholar]
- Rajyaguru, A.; Metzler, R.; Cherstvy, A.G.; Berkowitz, B. Quantifying anomalous chemical diffusion through disordered porous rock materials. Phys. Chem. Chem. Phys. PCCP 2025, 27, 9056–9067. [Google Scholar] [CrossRef] [PubMed]
- Fomin, S.A.; Chugunov, V.A.; Hashida, T. Non-Fickian mass transport in fractured porous media. Adv. Water Resour. 2011, 34, 205–214. [Google Scholar] [CrossRef]
- Li, Y. Fractal Characteristics of Multi-Scale Porestructure and Gas Diffusion in Tectonic Coal. Ph.D. Thesis, Henan Polytechnic University, Jiaozuo, China, 2019. [Google Scholar]

Disclaimer/Publisher’s Note: The statements, opinions and data contained in all publications are solely those of the individual author(s) and contributor(s) and not of MDPI and/or the editor(s). MDPI and/or the editor(s) disclaim responsibility for any injury to people or property resulting from any ideas, methods, instructions or products referred to in the content. |
© 2025 by the authors. Licensee MDPI, Basel, Switzerland. This article is an open access article distributed under the terms and conditions of the Creative Commons Attribution (CC BY) license (https://creativecommons.org/licenses/by/4.0/).