Article

Dynamic Mechanical Characteristics and Fracture Size Effect of Coal Sandstone Under High-Temperature and High-Strain Rate Coupling Action

by
Ming Li
1,2,
Fuqiang Zhu
2,*,
Yiwen Mao
2,
Fangwei Fan
2,
Boyuan Wu
2 and
Jishuo Deng
2
1
State Key Laboratory of Intelligent Construction and Healthy Operation and Maintenance of Deep Underground Engineering, China University of Mining and Technology, Xuzhou 221116, China
2
School of Mechanics and Civil Engineering, China University of Mining and Technology, Xuzhou 221116, China
*
Author to whom correspondence should be addressed.
Fractal Fract. 2025, 9(6), 381; https://doi.org/10.3390/fractalfract9060381
Submission received: 9 May 2025 / Revised: 2 June 2025 / Accepted: 10 June 2025 / Published: 15 June 2025
(This article belongs to the Section Engineering)

Abstract

The deformation control of surrounding rock in the combustion air zone is crucial for the safety and efficiency of underground coal gasification (UCG) projects. Coal-bearing sandstone, a common surrounding rock in UCG chambers, features a brittle structure composed mainly of quartz, feldspar, and clay minerals. Its mechanical behavior under high-temperature and dynamic loading is complex and significantly affects rock stability. To investigate the deformation and failure mechanisms under thermal–dynamic coupling, this study conducted uniaxial impact compression tests using a high-temperature split Hopkinson pressure bar (HT-SHPB) system. The focus was on analyzing mechanical response, energy dissipation, and fragmentation characteristics under varying temperature and strain rate conditions. The results show that the dynamic elastic modulus, compressive strength, fractal dimension of fragments, energy dissipation density, and energy consumption rate all increase initially with temperature and then decrease, with inflection points observed at 400 °C. Conversely, dynamic peak strain first decreases and then increases with rising temperature, also showing a turning point at 400 °C. This indicates a shift in the deformation and failure mode of the material. The findings provide critical insights into the thermo-mechanical behavior of coal-bearing sandstone under extreme conditions and offer a theoretical basis for designing effective deformation control strategies in underground coal gasification projects.

1. Introduction

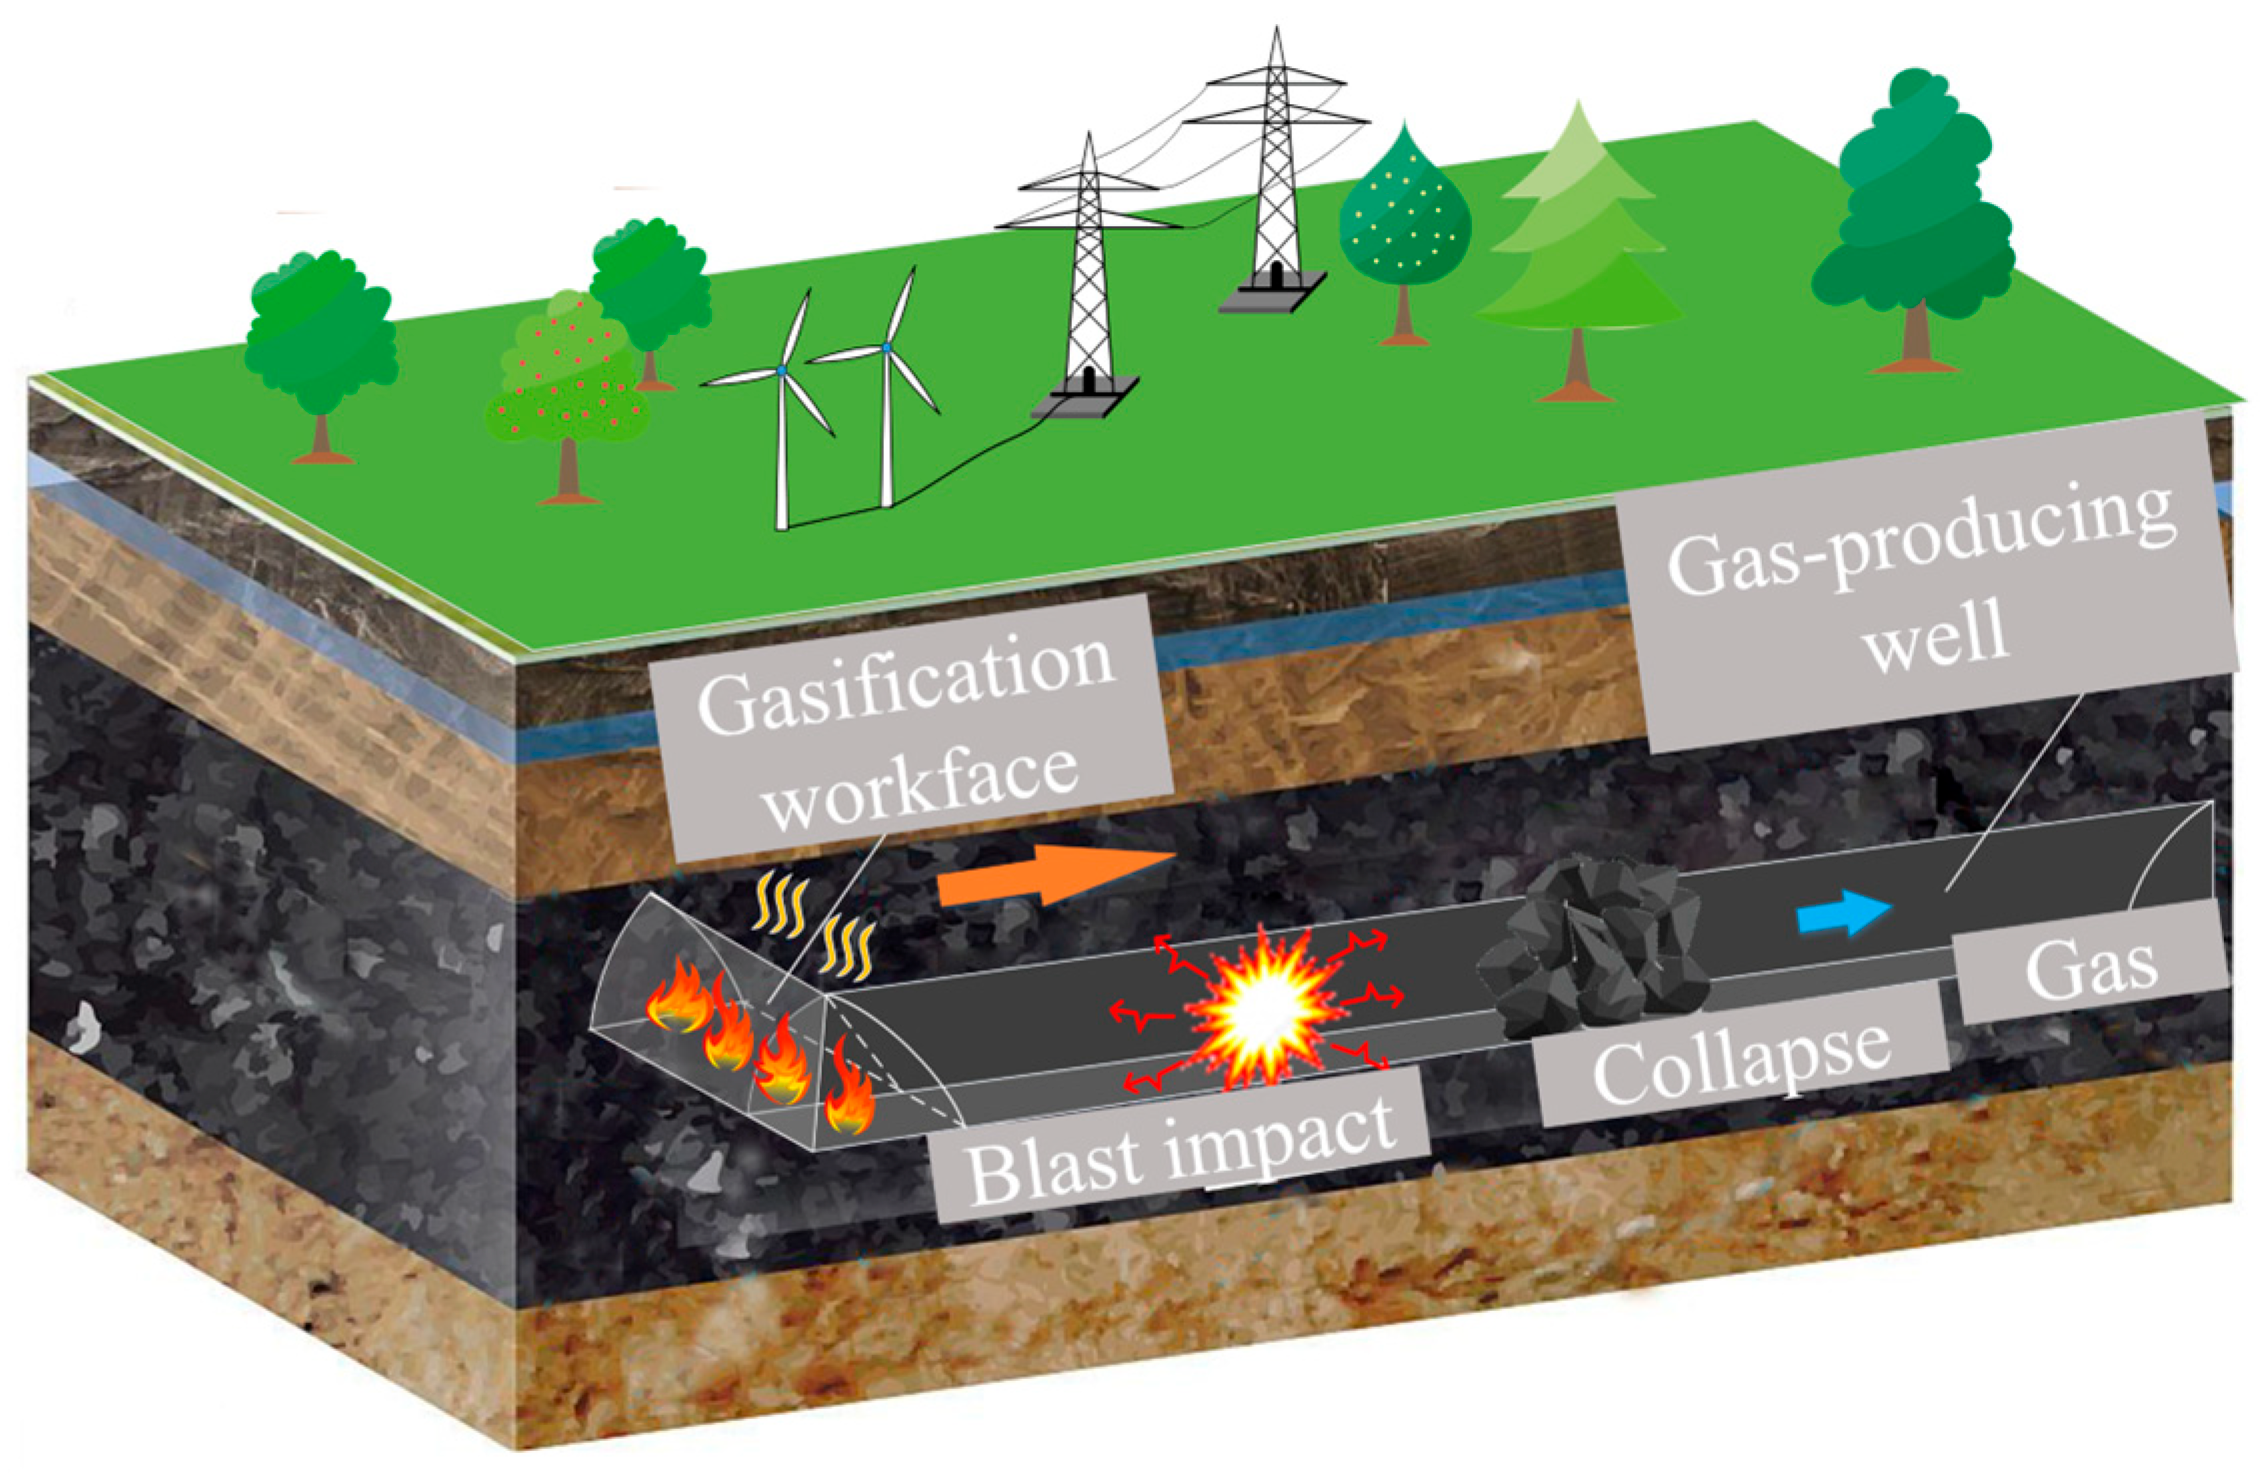
The coal underground gasification technology possesses the advantages of being environmentally friendly, safe, and efficient, as it converts coal in situ into gaseous fuel, thereby enabling low-carbon utilization of coal resources and promoting environmental sustainability [1,2,3]. However, the high temperatures induced by the underground gasification process, coupled with the high strain rate loads caused by blasting or mining operations, significantly affect the stability of the overburden structure, thus constraining the safe and efficient application of underground gasification technology [4,5]. The rock mass above the combustion zone is subjected to prolonged exposure to high temperatures, combined with mining disturbances, rapid thermal expansion during the gasification process, and high strain rate dynamic impacts, which together lead to complex and variable damage and fracture evolution in coal-bearing sandstones, characterized by significant dynamic mechanical features and scale effects [6,7,8], as shown in Figure 1. These dynamic features are reflected in various aspects, including fracture modes, crack propagation rates, and particle size distribution, which ultimately influence the stability of the surrounding rock mass and the structural integrity of the gasification space. Therefore, elucidating the dynamic mechanical properties and fracture size effects of coal-bearing sandstones under the coupling of high temperatures and high strain rate loads is crucial for providing scientific insights and technical support for the control of surrounding rock in the combustion zone and the optimization of engineering structures in coal underground gasification.
High temperature represents the most immediate environmental load encountered by the coal-rock medium in the combustion zone [9,10,11]. The damage and degradation induced by the high-temperature environment are the key factors driving the changes in the macroscopic mechanical properties of rocks [12,13]. In order to comprehensively understand the evolution mechanism of rock damage under high-temperature conditions, scholars have conducted extensive investigations using various monitoring techniques on samples exposed to high temperatures, revealing the multifaceted impacts of high temperature on rock mechanical properties [14]. The research findings indicate that as temperature increases, the longitudinal wave velocity in rocks decreases [15] while permeability increases, primarily due to thermal stresses arising from the differences in the thermal expansion of rock particles, independent of the internal pore pressure [16]. Furthermore, the compressive strength, tensile strength, and elastic modulus of both sandstone and granite exhibit a nonlinear reduction as temperature increases [17]. Therefore, elucidating the thermodynamic response mechanism of the overburden in the combustion zone of coal underground gasification is crucial for ensuring the safe, environmentally friendly, and efficient production of coal underground gasification.
Dynamic loading is the most direct and prevalent type of disturbance load encountered by the coal-rock medium in the combustion zone [18,19,20]. Dynamic loading disturbances directly influence the stability of the surrounding coal-rock mass and determine the long-term safety and overall controllability of the surrounding rock structure in the combustion zone [21,22,23]. Due to its transient, high-speed, and complex nature, dynamic loading can quickly initiate the rapid propagation of latent microcracks or defects within the coal-rock medium, leading to dynamic failure of the rock structure and potentially triggering large-scale collapse or instability. Researchers worldwide have conducted extensive investigations into the dynamic response and damage/fracture mechanisms of coal-rock media under dynamic loading, employing dynamic loading experimental setups. The experimental results reveal that under impact loading, the stress–strain curve lacks a microcrack closure phase, with the slope of the elastic deformation phase being steeper than under static loading [24]. The peak stress increases while the peak strain decreases due to dynamic loading effects [25]. At high loading rates, the energy release rate during loading is significantly lower than that at the moment of failure [26]. Moreover, the dissipation energy index K for water-saturated coal in uniaxial impact tests is strongly correlated with its dynamic strength, with higher strength leading to larger K values and greater energy dissipation during failure [27]. Therefore, elucidating the effects of dynamic loading disturbances on the damage, fracture morphology, and energy dissipation of the coal-rock medium has become a key issue that requires urgent resolution.
In conclusion, the mechanical response of rock samples under impact loading at elevated temperatures exhibits clear strain rate sensitivity and temperature dependence. Essentially, this phenomenon is attributed to high temperatures inducing internal microcrack propagation, mineral component degradation, and thermally driven pore evolution, coupled with the synergistic effect of high strain rate loading that causes instantaneous stress concentration and rapid crack propagation. Therefore, a thorough investigation and analysis of the mechanical response and fracture morphology of rocks under the coupling of high temperature and high strain rate loading is crucial to understanding the instability mechanisms of coal-bearing rock structures and the failure modes of overburden in coal underground gasification. This study utilizes a high-temperature split Hopkinson pressure bar (HT-SHPB) testing system to conduct real-time high-temperature impact loading tests on coal-bearing sandstone, exploring the dynamic mechanical properties and fracture size effects under the combined influence of high temperature and high strain rate. The findings of this study provide theoretical insights for the control of surrounding rock in coal underground gasification projects.
Figure 1. Schematic diagram of the disruption of underground gasification project triggered by high-temperature dynamic load coupling.
Fractalfract 09 00381 g001

2. Specimen Preparation and Test Methods

2.1. Standard Specimen Preparation of Coal Sandstone

The sandstone used in this experiment was sourced from the roof of the mined-out zone near the coal underground gasification face. It is gray-black in color, and its primary components include quartz (SiO2), kaolinite (Al4[Si4O10](OH)8), and strontianite (SrCO3). In accordance with the “Standard for Engineering Rock Mass Testing Methods (GBT 50266-2013)” [28], coal-bearing sandstone samples were extracted using a rock coring machine, cutting machine, and grinding stone mechanism at the National Key Laboratory of Deep Geomechanics and Underground Engineering, China University of Mining and Technology. The collected sandstone was then processed into cylindrical specimens with dimensions of 50 mm × 50 mm (diameter × height), as illustrated in Figure 2.
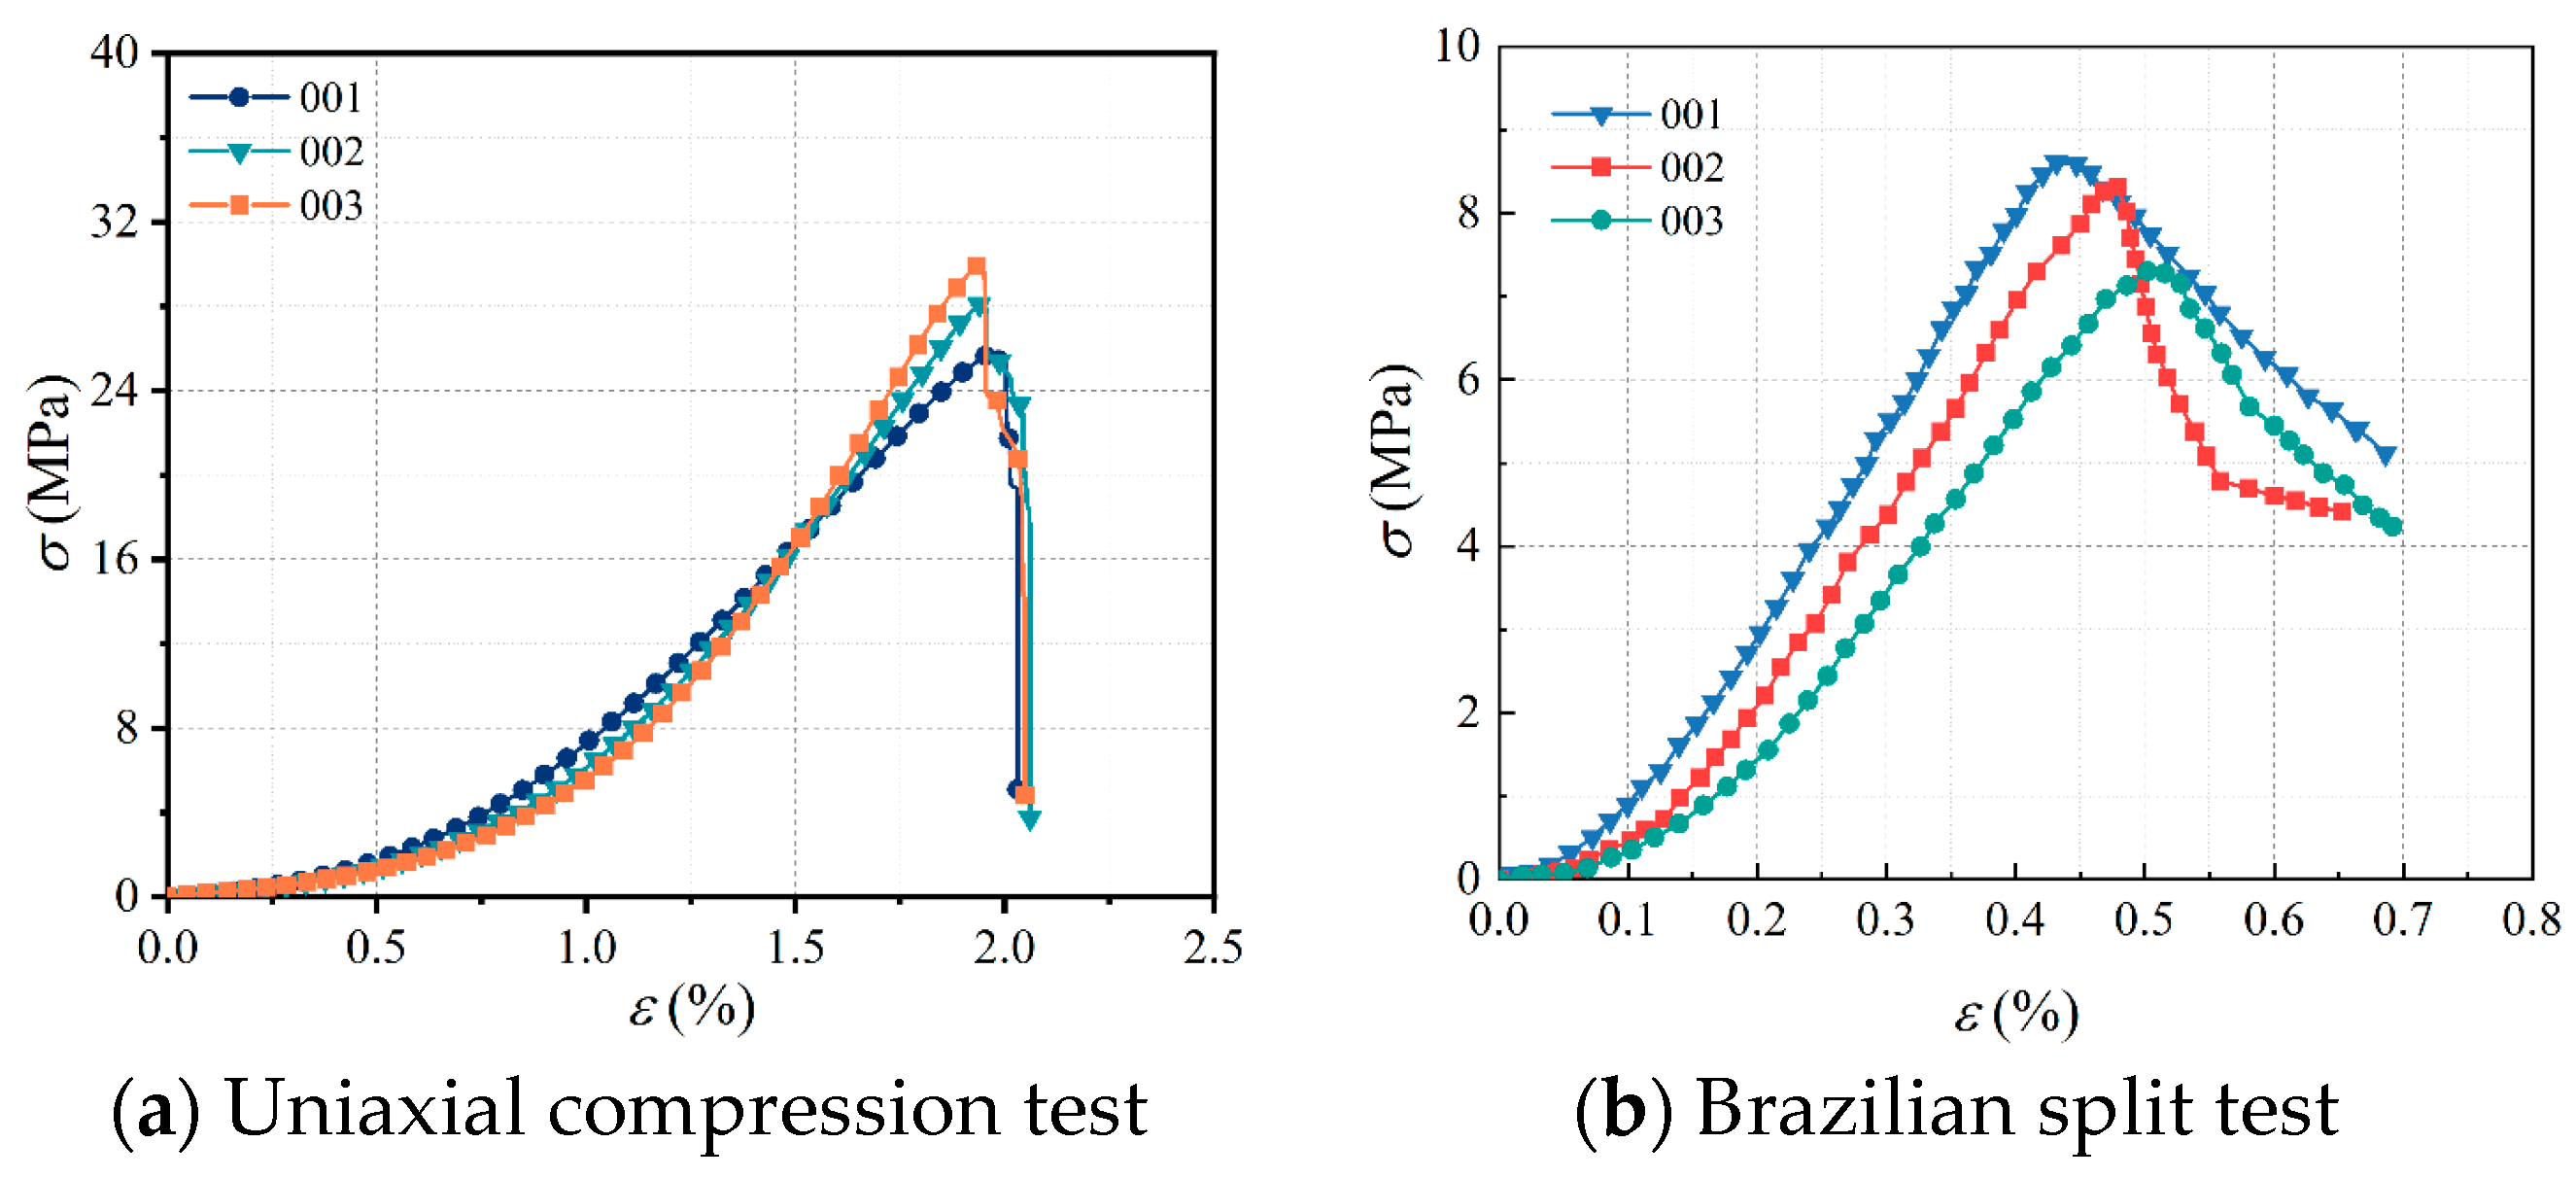
The initially prepared samples were subjected to wave velocity testing using a longitudinal wave velocity instrument, and those with significant dispersion were excluded from further testing. Basic mechanical tests, including uniaxial compression and static splitting tensile tests, were conducted, and the results are presented in Figure 3.

2.2. Real-Time High-Temperature Loading Equipment and Test Methods

(1)
Real-time high-temperature loading test equipment
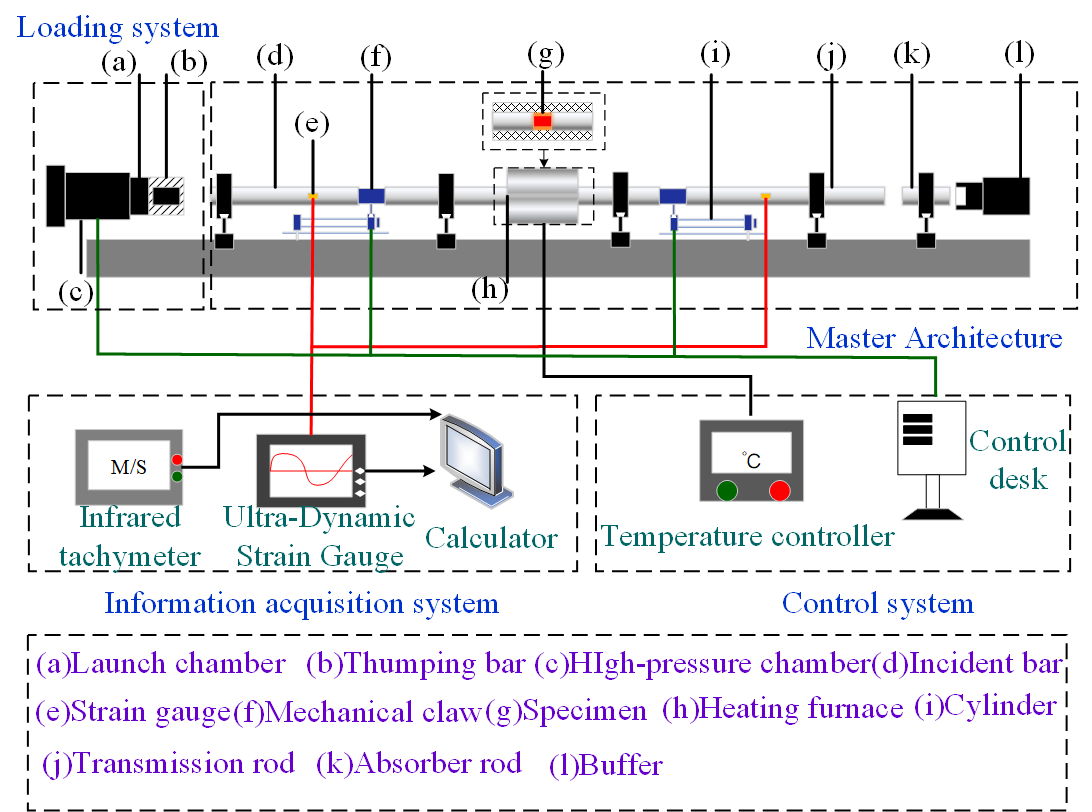
The split Hopkinson pressure bar (SHPB) system is the most commonly applied experimental technique for investigating the dynamic mechanical properties of rock materials [29,30,31]. To achieve dynamic mechanical testing of rock materials under high-temperature conditions, this study employs a direct heating method to carry out dynamic impact compression tests on coal-bearing sandstone at elevated temperatures [32,33,34]. The high-temperature split Hopkinson pressure bar (HT-SHPB) testing system used in this experiment is illustrated in the figure. The modified high-temperature split Hopkinson pressure bar (HT-SHPB) testing system is composed of four primary components: the loading system (including high-pressure gas chamber, launching chamber, and impact bar), the main structure (comprising the incident bar, transmission bar, impact bar, absorption bar, buffer, and supports), the information acquisition system (including strain gauges, ultra-dynamic strain gauges, computer, and infrared velocimeter), and the control system (featuring the control console and temperature controller), as illustrated in Figure 4.
It is important to note that the direct heating method heats both the specimen and a portion of the incident and transmission bars simultaneously to ensure uniform temperature distribution within the specimen. Chen et al. [35] employed the direct heating method to investigate the dynamic compressive mechanical properties of metallic materials under high-temperature conditions. In the direct heating method, the portion of the bars in contact with the specimen is heated together with the specimen, creating a significant temperature gradient between the heated and unheated parts of the bars. This will have a significant impact on the accuracy of the test results. This study improves the direct heating method by incorporating a high-temperature furnace within the SHPB system to directly heat the specimen. Upon completion of heating, the control system drives the cylinder to automate the bars. This approach not only avoids the issue of unmanageable heat loss during the heating-to-transfer process but also solves the problem of temperature gradients formed when the bars are simultaneously heated.
(2)
High-temperature- and high-strain rate-coupled loading test program
The high-temperature- and high-strain rate-coupled loading test procedure is primarily divided into the following three steps [36,37,38]:
① The specimen is placed in the furnace chamber of the tubular heating furnace, where the temperature controller is used to heat the specimen to the designed temperature and maintain a constant temperature.
② Using the control console, the mechanical claws connected to the cylinder drive the incident and transmission bars to translate, achieving automatic alignment and reset of the bars.
③ Impact loading is conducted through command control. The signals from the incident and transmission bars are captured by strain gauges and collected by the data acquisition system. Simultaneously, the loading velocity is recorded by the infrared velocimeter and transmitted to the velocity tester for storage.
It is important to note that during the entire experiment, the specimen is kept inside the furnace chamber of the tubular heating furnace. At the same time, the incident and transmission bars are not heated along with the specimen, preventing the formation of temperature gradients within the bars and enabling impact loading tests on rock materials under real-time high-temperature conditions. The test pressure is designed to range from 0.30 MPa to 0.80 MPa, with temperatures set at 25 °C (ambient), 100 °C, 200 °C, 300 °C, 400 °C, 500 °C, 600 °C, and 800 °C for each pressure condition.

3. Dynamic Mechanical Characteristics of Coal Sandstone Under High-Temperature and High-Strain Rate Action

3.1. Characteristics of Loading Test Waveform and Stress–Strain Curve

(1)
Characteristics of test curves
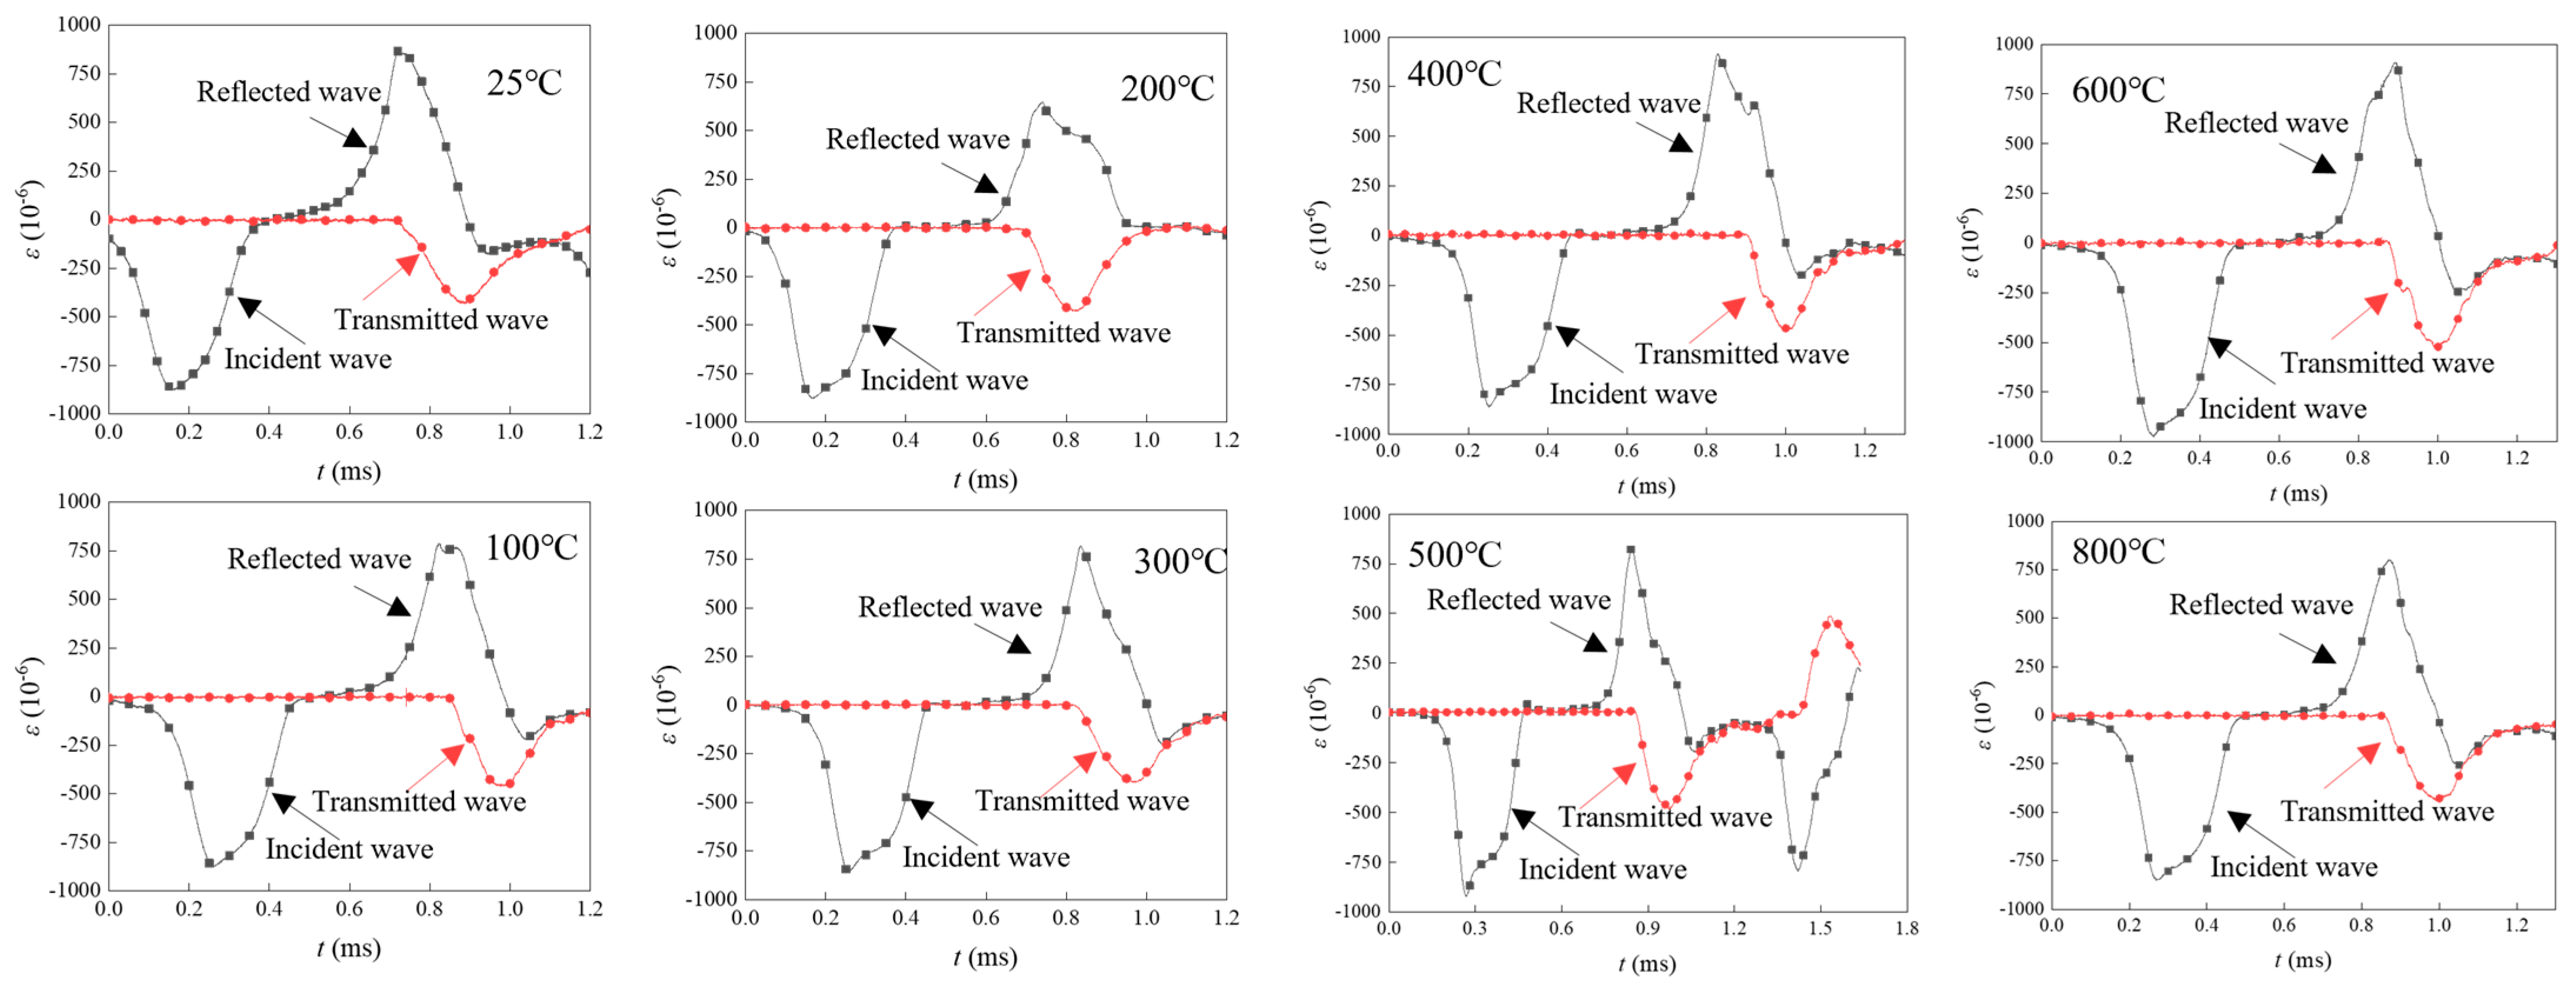
Considering the significant variation in the mechanical properties of coal-bearing sandstone with temperature at different strain rate levels [39,40,41], To further explore the temperature effects on the specimens under different temperature conditions, the loading pressures were fixed at 0.30 MPa and 0.80 MPa, and the real-time loading temperatures (T) were set at 25 °C (ambient), 100 °C, 200 °C, 300 °C, 400 °C, 500 °C, 600 °C, and 800 °C under each pressure condition, with each group undergoing multiple impact tests to ensure at least three valid results. After the tests, the strain rates calculated at different temperatures were averaged to represent the corresponding loading pressure. Figure 5 presents the waveform of coal-bearing sandstone at temperatures of 25 °C, 100 °C, 200 °C, 300 °C, 400 °C, 500 °C, 600 °C, and 800 °C under a loading pressure of 0.80 MPa.
As shown in Figure 5, the incident, reflected, and transmitted waves were all approximately half-sine waveforms at different temperatures (T), with the peak amplitudes of the reflected and transmitted waves being lower than that of the incident wave. Notably, the incident wave exhibits a longer rise time, which is beneficial for achieving stress equilibrium within the rock sample during dynamic loading. This extended loading duration allows stress waves to more fully propagate and reflect within the specimen, reducing inertial effects and localized stress concentrations. Consequently, it helps the specimen to reach a near-uniform internal stress distribution before failure occurs, which is a key requirement for the applicability of the one-dimensional wave propagation theory. Therefore, the longer rise time of the incident wave is critical to ensuring the validity and accuracy of the test results under dynamic conditions.
(2)
Variation characteristics of strain rate ( ε ˙ ) with loading temperature (T)
By analyzing the experimental waveforms in Figure 5, the variation of strain rate ( ε ˙ ) with time (t) at different loading temperatures (T) can be determined, and the arithmetic mean of the strain rate over the entire duration is used as the loading strain rate for the experiment. The average bullet velocity ( V ¯ ) and average strain rate ( ε ˙ ¯ ) are calculated based on three valid results from each group. Table 1 presents the variation of the average bullet velocity ( V ¯ ) and average strain rate ( ε ˙ ¯ ) with loading temperature (T) under 0.30 MPa and 0.80 MPa. From Table 1, it is evident that as the loading temperature (T) increases, with both the average bullet velocity ( V ¯ ) and the average strain rate ( ε ˙ ¯ ) exhibiting a clear increasing trend under both 0.30 MPa and 0.80 MPa. At 0.30 MPa, the average strain rate ( ε ˙ ¯ ) increases from 50.45 s−1 to 69.90 s−1, showing an increase of 38.55%; at 0.80 MPa, the average strain rate ( ε ˙ ¯ ) increases from 210.87 s−1 to 213.20 s−1, with an increase of 1.10%, which is significantly lower than the increase observed at 0.30 MPa. The arithmetic mean strain rates are used to represent the conditions at 0.30 MPa and 0.80 MPa, where a strain rate of 60.12 s−1 corresponds to the 0.30 MPa pressure condition, and 211.64 s−1 corresponds to the 0.80 MPa pressure condition. This suggests that the sensitivity to temperature decreases significantly at higher strain rates when compared with lower strain rates. For the convenience of presenting the results, the strain rate ( ε ˙ ) is referred to as the average strain rate ( ε ˙ ¯ ), as indicated in the previous section.
(3)
Variation characteristics of dynamic stress–strain curves
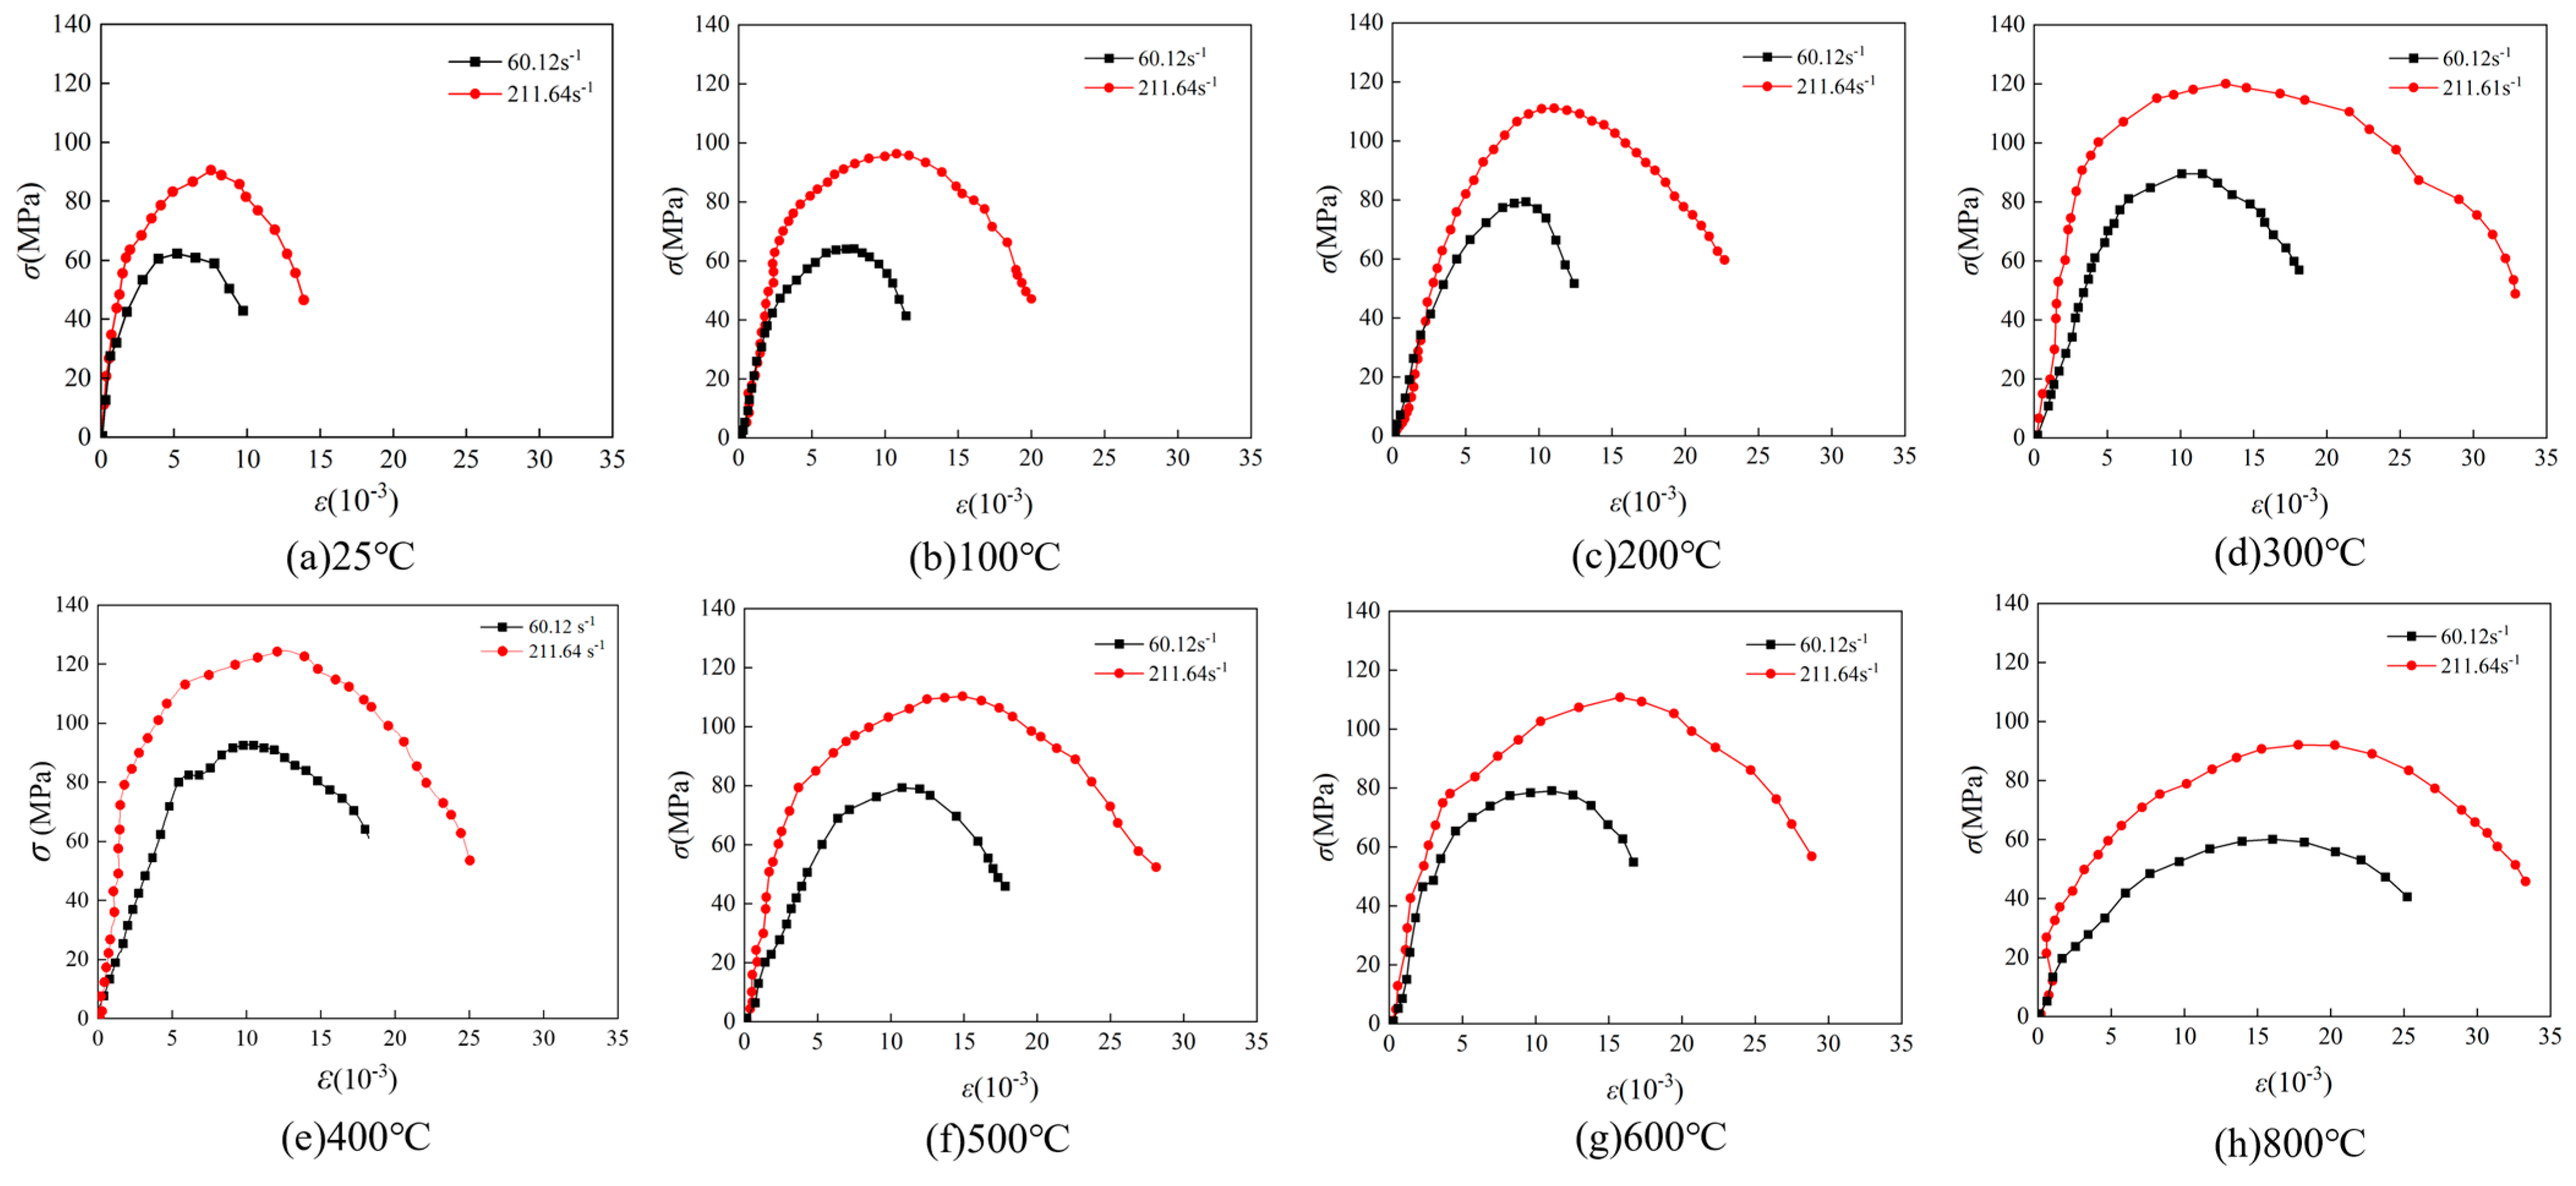
By processing the waveforms, Figure 6 presents the dynamic stress–strain curves of coal-bearing sandstone at strain rates of 60.12 s−1 and 211.64 s−1 at temperatures of 25 °C, 100 °C, 200 °C, 300 °C, 400 °C, 500 °C, 600 °C, and 800 °C.
As seen in Figure 6, the dynamic compressive stress–strain curves of coal-bearing sandstone at various temperatures include the compaction phase, linear elastic phase, inelastic phase, and failure phase. The dynamic peak strain increases with temperature, while the change in dynamic peak compressive strength is not clearly pronounced. Given the complexity of rock structure changes induced by temperature, coal-bearing sandstone typically includes clay minerals and framework particles. When the temperature increase is small, the expansion of particles and clay can effectively fill the rock’s original pores. When the temperature is significantly raised, these substances, due to differing thermal expansion coefficients, will undergo uneven expansion, resulting in damage [42].

3.2. Dynamic Mechanical Properties of Coal Sandstone Specimens

A detailed analysis is performed by extracting the dynamic elastic modulus ( E d ), dynamic compressive strength ( σ d ), and dynamic peak strain ( ε d ) of coal-bearing sandstone from the dynamic stress–strain curves. Combined with the macroscopic fracture morphology and fractal dimension (Ds), the macroscopic failure characteristics are analyzed to quantitatively characterize the temperature effect on the mechanical characteristics and failure characteristics of coal measure sandstone under real-time high temperature [43,44,45].

3.2.1. Characterization of Changes in Dynamic Modulus of Elasticity

To eliminate the dispersion of the results, the average of three valid outcomes is taken for analysis. In this chapter, the dynamic elastic modulus (Ed), dynamic compressive strength ( σ d ) , dynamic peak strain ( ε d ), fractal dimension (Ds), and energy dissipation parameters are analyzed based on their average values, with “average” omitted in the description. Figure 7 illustrates the curve showing the variation of dynamic elastic modulus (Ed) with temperature (T). The standard deviations at different strain rates with increasing temperature are 60.12 s−1 (0.12489996; 0.284780617; 0.125299641; 0.108166538; 0.043588989; 0.115325626; 0.130766968; 0.055075705); 211.64 s−1 (0.23515952; 0.206639783; 0.134288247; 0.17; 0.144222051; 0.075498344; 0.026457513; 0.075498344).
From Figure 7, it can be observed that the dynamic elastic modulus of coal-bearing sandstone (Ed) decreases linearly with temperature (T) at strain rates of 60.12 s−1 and 211.64 s−1, with the fitting equations shown in equations ( E d = 0.0233 T + 23.390 ) and ( E d = 0.0291 T + 31.301 ). At a strain rate ( ε ˙ ) of 60.12 s−1, the dynamic elastic modulus (Ed) decreases from 25.51 GPa to 6.52 GPa, showing a reduction of 74.44%; at a strain rate ( ε ˙ ) of 211.64 s−1, the dynamic elastic modulus (Ed) decreases from 33.38 GPa to 9.80 GPa, a reduction of 70.64%, which is 3.80% smaller than at lower strain rates. This shows that as temperature increases, the deformation resistance of coal-bearing sandstone gradually decreases, and the temperature sensitivity of the dynamic elastic modulus at high strain rates decreases.
By comparing the variation of dynamic elastic modulus (Ed) of coal-bearing sandstone at strain rates of 60.12 s−1 and 211.64 s−1, it can be observed that the dynamic elastic modulus exhibits a clear strain rate sensitivity. Specifically, as the strain rate increases from 60.12 s−1 to 211.64 s−1, the Ed of coal-bearing sandstone increases significantly, ranging from 3.28 GPa to 7.87 GPa, corresponding to an overall increase of approximately 30.85% to 50.31%. This trend indicates that under higher strain rate loading conditions, the material exhibits enhanced stiffness and resistance to initial deformation.
This enhancement in Ed can be attributed to the strain rate strengthening effect, which is commonly observed in brittle geomaterials under dynamic loading. At elevated strain rates, the loading time is significantly reduced, leaving insufficient time for internal microcracks to initiate and propagate, thus inhibiting early-stage damage accumulation. As a result, the material behaves in a more elastic and less dissipative manner, leading to a higher apparent modulus. Additionally, the dynamic compaction effect may also contribute to this increase, as the closure of pre-existing pores and microcracks under rapid loading enhances inter-particle contact and stiffness.

3.2.2. Characterization of Changes in Dynamic Compressive Strength

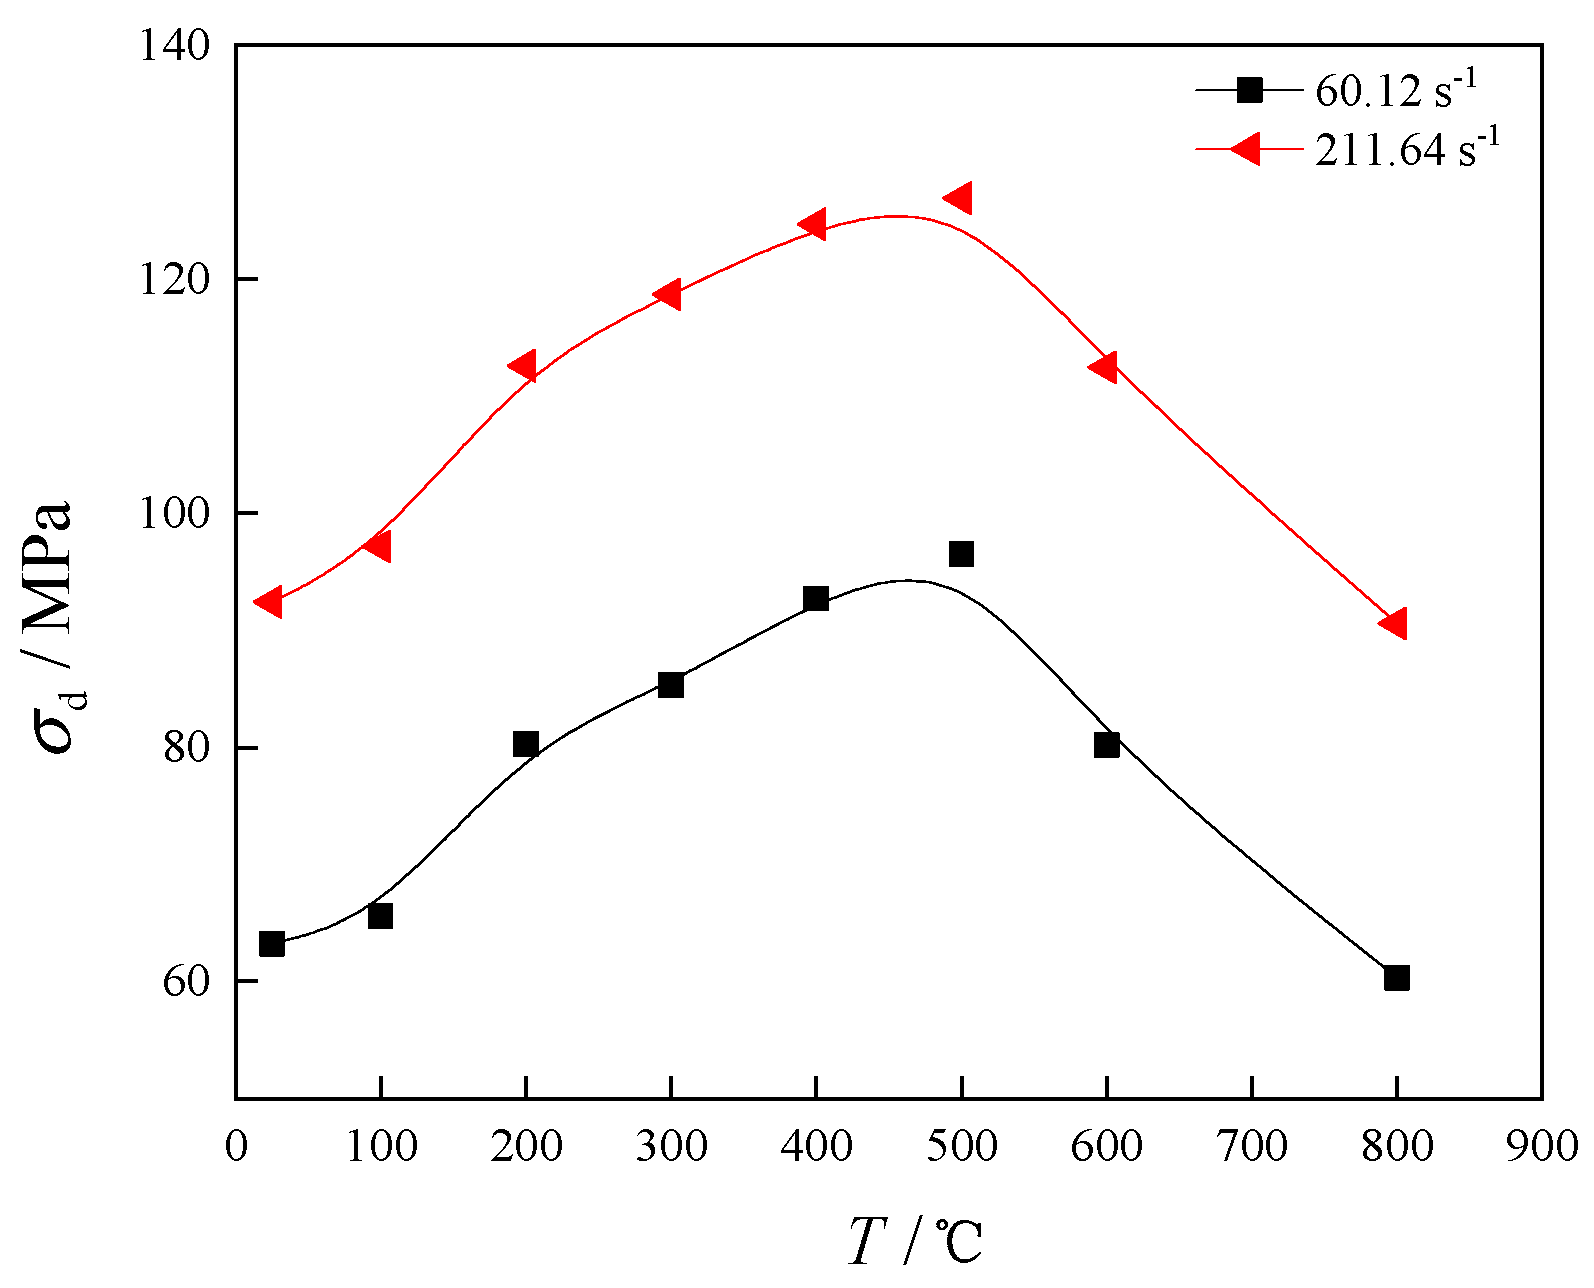
Figure 8 shows the variation curve of dynamic compressive strength (σd) with temperature T. The standard deviations at different strain rates with increasing temperature are 60.12 s−1 (0.334215499; 0.122882057; 0.244404037; 0.130766968; 0.233023604; 0.167032931; 0.075498344; 0.379868398); 211.64 s−1 (0.34394767; 0.117898261; 0.147986486; 0.13; 0.376430604; 0.37; 0.257099203; 0.355949435).
From Figure 8, we can see that: when the strain rate ε ˙ = 60.12 s−1, 211.64 s−1, the dynamic compressive strength of coal sandstone shows a trend of increasing and then gradually decreasing with the temperature T; when ε ˙ = 60.12 s−1, as the temperature T rises from 25 °C to 500 °C, the dynamic compressive strength (σd) increases from 63.22 MPa to 96.50 MPa, with an increase of 52.64%. And the dynamic compressive strength (σd) decreases from 96.50 MPa to 60.31 MPa with a decrease of 37.50% as the temperature (T) increases from 500 °C to 800 °C; the dynamic compressive strength (σd) increases from 92.39 MPa to 126.88 MPa with a 37.33% increase as the temperature (T) increases from 25 °C to 500 °C at ε ˙ = 211.64 s−1; the dynamic compressive strength (σd) increases from 92.39 MPa to 126.88 MPa with a 37.33% increase as the temperature (T) increases from 500 °C to 800 °C; the dynamic compressive strength B decreases from 126.88 MPa to 90.56 MPa with a decrease of 28.63%; and the increase and decrease are shown to decrease relative to the low strain rate. This shows that the temperature has two effects on the strength of coal sandstone: when the temperature is low, the elevated temperature will promote the expansion of clay minerals inside the sandstone, which will block the initial cracks to a certain extent, so that the overall porosity of the sandstone will be reduced, making the dynamic compressive strength of sandstone increase; and when the temperature is higher, the further expansion of clay minerals and skeleton part will cause the internal structure of sandstone to be extruded and broken, and the overall porosity will increase, which will lead to the decrease in the dynamic compressive strength of sandstone, and the compressive strength will be reduced. The magnitude of the change indicates that the temperature sensitivity of the dynamic compressive strength decreases at high strain rates [46].
Comparing the dynamic compressive strength of coal sandstone under strain rate ε ˙ = 60.12 s−1 and 211.64 s−1, it can be seen that the dynamic compressive strength (σd) of coal sandstone under high strain rate increases relative to that under low strain rate; when the strain rate rises from ε ˙ = 60.12 s−1 to ε ˙ = 211.64 s−1, the dynamic compressive strength (σd) changes in the range of 29.17 MPa −33.40 GPa, with an increase of 31.48–50.16%.

3.2.3. Characterization of Changes in Dynamic Peak Strain

Figure 9 presents the curve showing the variation of dynamic peak strain ( ε d ) with temperature (T). The standard deviations at different strain rates with increasing temperature are 60.12 s−1 (0.117153745; 0.073020545; 0.125904726; 0.130046146; 0.197476581; 0.17563314; 0.222737514; 0.237223523); 211.64 s−1 (0.053777319; 0.317490157; 0.120016666; 0.296501265; 0.26471683; 0.197858535; 0.297026935; 0.266810794).
From Figure 9, it can be seen that the dynamic peak strain ( ε d ) of coal-bearing sandstone increases linearly with temperature (T) at strain rates of 60.12 s−1 and 211.64 s−1, with the corresponding fitting equations shown in equations ( ε d = 0.0109 T + 5.719 ) and ( ε d = 0.0132 T + 7.947 ). At a strain rate ( ε ˙ ) of 60.12 s−1, as temperature (T) increases, the dynamic peak strain increases from 0.00514 to 0.0149, a rise of 190.48%; at a strain rate ( ε ˙ ) of 211.64 s−1, as temperature (T) increases, the dynamic peak strain ( ε d ) rises from 0.00751 to 0.0195, an increase of 159.00%, which is 31.48% smaller than the increase observed at lower strain rates. This indicates that as temperature increases, the maximum achievable deformation of coal-bearing sandstone gradually increases, and the temperature sensitivity of dynamic peak strain decreases at higher strain rates compared with lower strain rates [47].
By comparing the dynamic peak strain of coal-bearing sandstone at strain rates ( ε ˙ ) of 60.12 s−1 and 211.64 s−1, it can be seen that: the dynamic peak strain ( ε d ) of coal-bearing sandstone increases at higher strain rates compared with lower strain rates; and when the strain rate ( ε ˙ ) increases from 60.12 s−1 to 211.64 s−1, the dynamic peak strain ( ε d ) changes from 0.002412 to 0.004511, showing an increase ranging from 20.59% to 48.78%.

4. Characteristics of Fracture Fractal and Energy Dissipation Mechanism Under High-Temperature and High-Strain Rate Coupling Effect

4.1. Characteristics of Fracture Fractalization of Coal Sandstone Samples

(1)
Characterization of the crushing degree of specimen damage
Figure 10 presents the failure characteristics of coal-bearing sandstone at different temperatures in the split Hopkinson pressure bar (SHPB) test at a strain rate ( ε ˙ ) of 211.64 s−1.
As can be seen in Figure 10, at a strain rate ( ε ˙ ) of 211.64 s−1, the surface color of the fragments from rock samples with temperatures between 100 °C and 800 °C, except for the rock samples at ambient temperature (25 °C), becomes significantly darker due to the temperature effect. Coal-bearing sandstone samples show significant brittle fracture characteristics under different temperature conditions, and the fracture products are mainly wedge-shaped fragments accompanied by a high proportion of powdery debris. However, the macroscopic observation shows that the temperature changes do not lead to obvious differences in the degree of fracture, and the effect of temperature on the damage morphology of the material needs to be systematically analyzed with the help of the quantitative characterization method of fractal dimension.
(2)
Subdimensional characterization of the degree of specimen fragmentation
Table 2 shows the variation of fractal dimension characteristic parameters of coal-bearing sandstone after failure, based on strain rates ( ε ˙ ) of 60.12 s−1 and 211.64 s−1, as a function of temperature (T). Figure 11 presents the curve showing the variation of fractal dimension ( D s ) with temperature (T).
From Table 2 and Figure 11, it can be seen that the fractal dimension ( D s ) of coal-bearing sandstone decreases and then increases with temperature (T) at strain rates ( ε ˙ ) of 60.12 s−1 and 211.64 s−1; at a strain rate ( ε ˙ ) of 60.12 s−1, as temperature (T) increases from 25 °C to 400 °C, the fractal dimension ( D s ) decreases from 2.40 to 2.04, a reduction of 15.00%. From 400 °C to 800 °C, the fractal dimension ( D s ) increases from 2.04 to 2.44, an increase of 19.61%; at a strain rate ( ε ˙ ) of 211.64 s−1, as temperature (T) increases from 25 °C to 400 °C, the fractal dimension ( D s ) decreases from 2.70 to 2.52, a decrease of 6.67%. From 400 °C to 800 °C, the fractal dimension ( D s ) increases from 2.52 to 2.86, an increase of 13.49%, with both the decrease and increase being smaller compared with the changes observed at lower strain rates. This indicates that as temperature increases from 25 °C to 300 °C, the internal cracks in coal-bearing sandstone close due to thermal expansion, which increases its overall strength and reduces the final degree of failure. However, as the temperature continues to increase, the enhanced expansion effect causes the porosity of coal-bearing sandstone to gradually rise, leading to a further increase in the degree of failure. At higher strain rates, the temperature sensitivity of failure in coal-bearing sandstone decreases, and the change in the degree of failure becomes less pronounced as temperature increases [48].
Comparing the fractal dimension ( D s ) of coal sandstone under the strain rate ( ε ˙ ) of 60.12 s−1 and 211.64 s−1, it can be seen that: the value of the fractal dimension ( D s ) of coal sandstone under high strain rate increases relative to that at low strain rate; and when the strain rate ( ε ˙ ) increases from 60.12 s−1 to 211.64 s−1, the change of its fractal dimension ( D s ) is in the range of 0.30–0.48, with an increase of 12.29–23.53%.

4.2. Influence of Temperature on the Microscopic Fracture Morphology of Coal-Measure Sandstone

This section investigates the effect of temperature on the fracture morphology of coal-measure sandstone by examining the fracture surfaces at three representative temperatures (25 °C, 400 °C, and 800 °C) under a strain rate of 81.52 s−1.
(1)
Microscopic fracture morphology at ambient temperature (25 °C)
Figure 12 presents the microscopic views of the fracture surface of coal-measure sandstone at room temperature under four different magnifications. At 100× magnification, distinct microstructural fracture features are not readily visible; however, both matrix-embedded and exposed crystalline grains can be identified, along with the presence of pores and voids across the surface. When magnified to 500×, pronounced step-like features caused by crystal layer tearing become visible. These are accompanied by adjacent lamellar tearing patterns, suggesting crack propagation from the upper right to the lower left of the field of view.
At higher magnifications (500× and 2000×), intergranular and transgranular cracks are clearly observed, indicating that cracks propagated through individual grains under external loading. The presence of stepped patterns, layered tearing, and transgranular fractures all point to a dominant brittle fracture mechanism. This observation confirms that the fracture surface at 25 °C exhibits clear characteristics of brittle failure. As a typical brittle rock, coal-measure sandstone demonstrates no evidence of plastic deformation under high strain rate loading, further validating that the fracture mode at room temperature is predominantly brittle.
(2)
Microscopic fracture morphology of coal-measure sandstone at 400 °C
Figure 13 illustrates the fracture surface morphology of coal-measure sandstone at 400 °C under four levels of magnification. As shown in Figure 13a, the fracture surface appears relatively smooth, with no prominent protruding crystals. The mineral grains exhibit strong cohesion with the matrix, and the number of pores and voids is significantly reduced compared with the fracture surfaces observed at ambient and 200 °C conditions. This densification is attributed to the thermal expansion of both mineral particles and the matrix under elevated temperature, which macroscopically enhances the dynamic mechanical strength of the rock.
At 500× magnification, transgranular cracks and single crystal fracture features become evident. These crystal-specific patterns are primarily the result of multiple transgranular cracks intersecting individual grains, indicating brittle fracture at the microscale. Further magnification to 2000× reveals river-like patterns formed by interlayer tearing within crystal grains.
Under real-time high-temperature conditions at 400 °C, thermal expansion of mineral constituents leads to a denser internal structure, contributing to improved mechanical integrity. Simultaneously, the elevated temperature causes substantial dehydration of structural water within the crystal lattice, facilitating the formation of transgranular cracks under dynamic loading. The presence of transgranular fractures, single-crystal crack patterns, and river marks—all indicative of brittle failure—demonstrates that the fracture mode of coal-measure sandstone at 400 °C remains predominantly brittle.
(3)
Microscopic fracture morphology of coal-measure sandstone at 800 °C
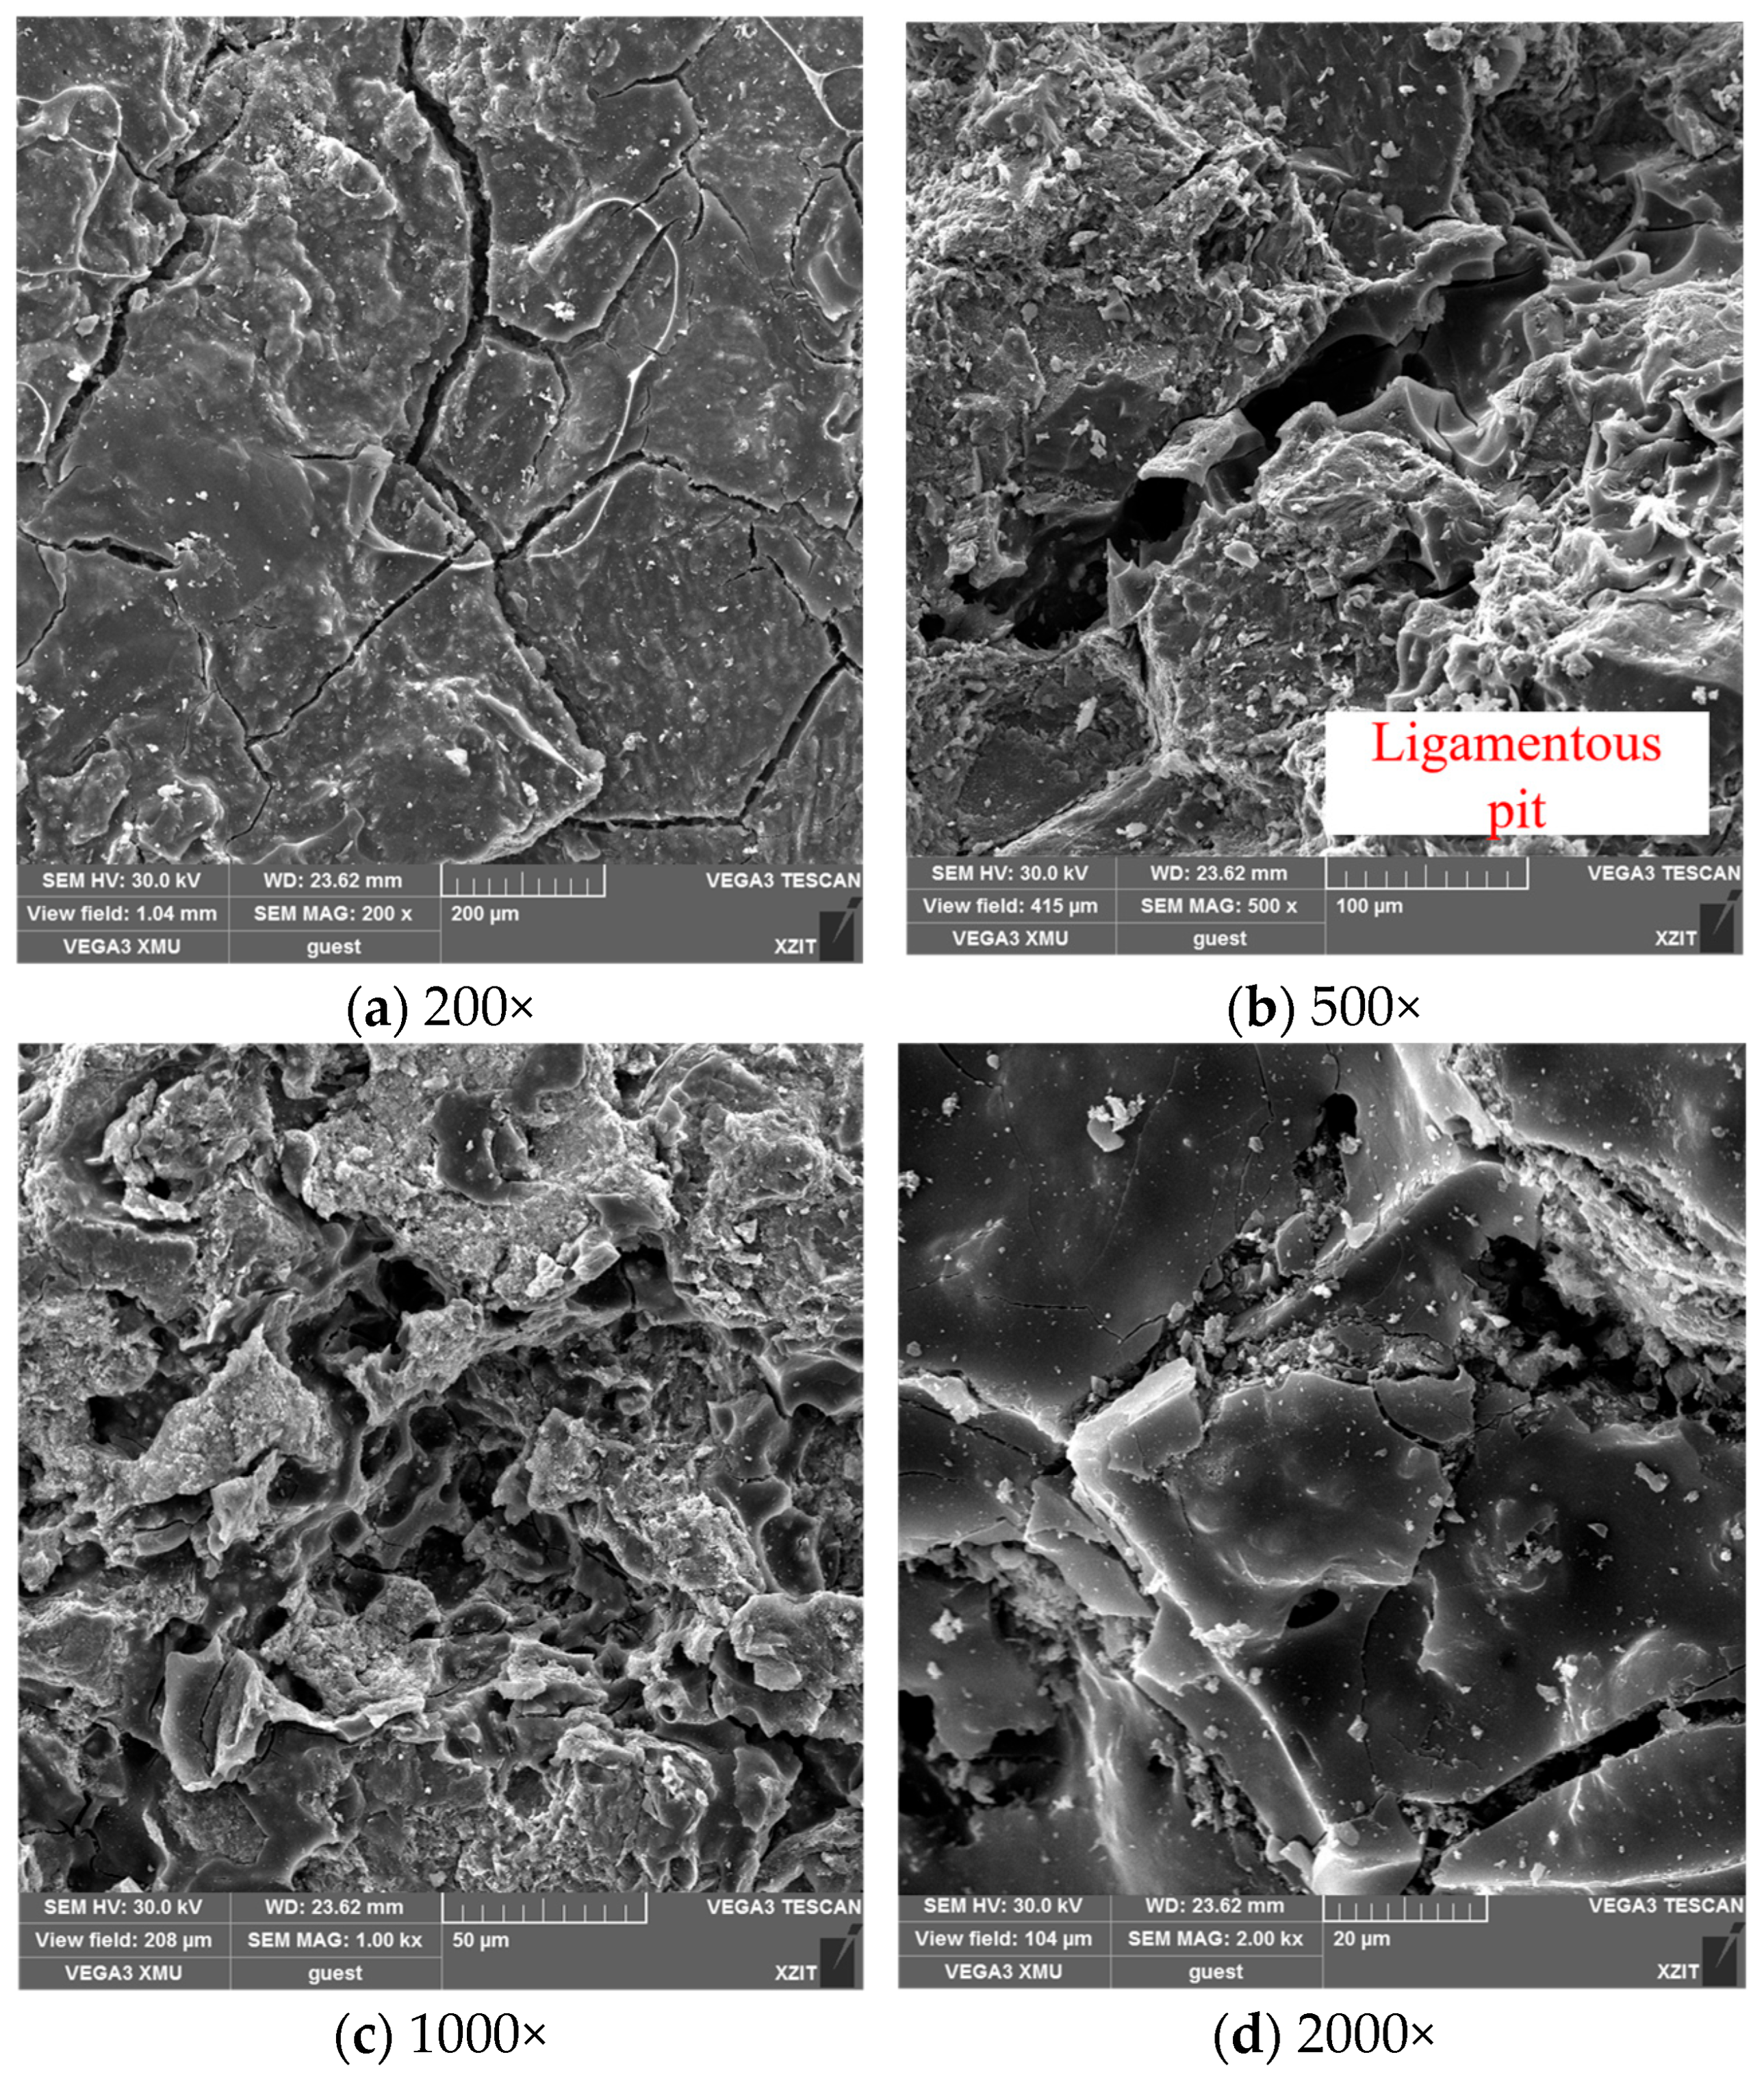
Figure 14 presents the microstructural characteristics of the fracture surface of coal-measure sandstone at 800 °C under various magnifications. At 200× magnification, numerous cracks are observed initiating throughout the structure, with some fissures reaching widths of up to 20 μm. Only the matrix is visible in this view, prompting a shift in the field of observation and an increase in magnification to 500×. At this level, numerous pores and microcracks become apparent, originating from the partial melting of mineral grains. In the lower right portion of the field, dimple-like fracture patterns—associated with void coalescence and ductile features—can be identified.
Upon further magnification to 1000×, the structure reveals significant degradation due to the thermal melting of both the matrix and crystal grains, resulting in a porous, fragmented architecture. The material appears considerably loosened and structurally compromised. At 2000× magnification, extensive melting of mineral grains is evident, leading to the formation of irregular voids. The grains are no longer continuous and are intersected by numerous wide transgranular cracks, some as wide as 40 μm, which effectively segment the grains into discrete fragments.
These observations indicate that at 800 °C, thermal damage causes severe microstructural degradation in coal-measure sandstone. The presence of melt-induced porosity, extensive cracking, and fragmented grain structures suggests a significant shift in failure mode—from brittle fracture observed at lower temperatures to a complex damage mechanism involving both thermally driven ductility and fragmentation under dynamic loading.

4.3. Dynamic Energy Dissipation Law of Coal Sandstone Specimens

According to the basic principles of the three-wave method, let W I ( t ) , W R ( t ) , and W T ( t ) represent the incident energy, reflected energy, and transmitted energy, respectively. The calculation formulas are as follows:
W I ( t ) = E 0 C 0 A 0 0 t ε I 2 ( t ) d t W R ( t ) = E 0 C 0 A 0 0 t ε R 2 ( t ) d t W T ( t ) = E 0 C 0 A 0 0 t ε T 2 ( t ) d t
In the equation, W I ( t ) , W R ( t ) , and W T ( t ) represent the incident energy, reflected energy, and transmitted energy, respectively.
The energy W S ( t ) absorbed by the specimen during the failure process can be represented as:
W S = W I ( W R + W T )
The energy absorbed by the rock specimen will mainly be used for fragmentation energy, elastic kinetic energy dissipation, and other forms of energy dissipation, i.e.,
W S = W FD + W K + W O
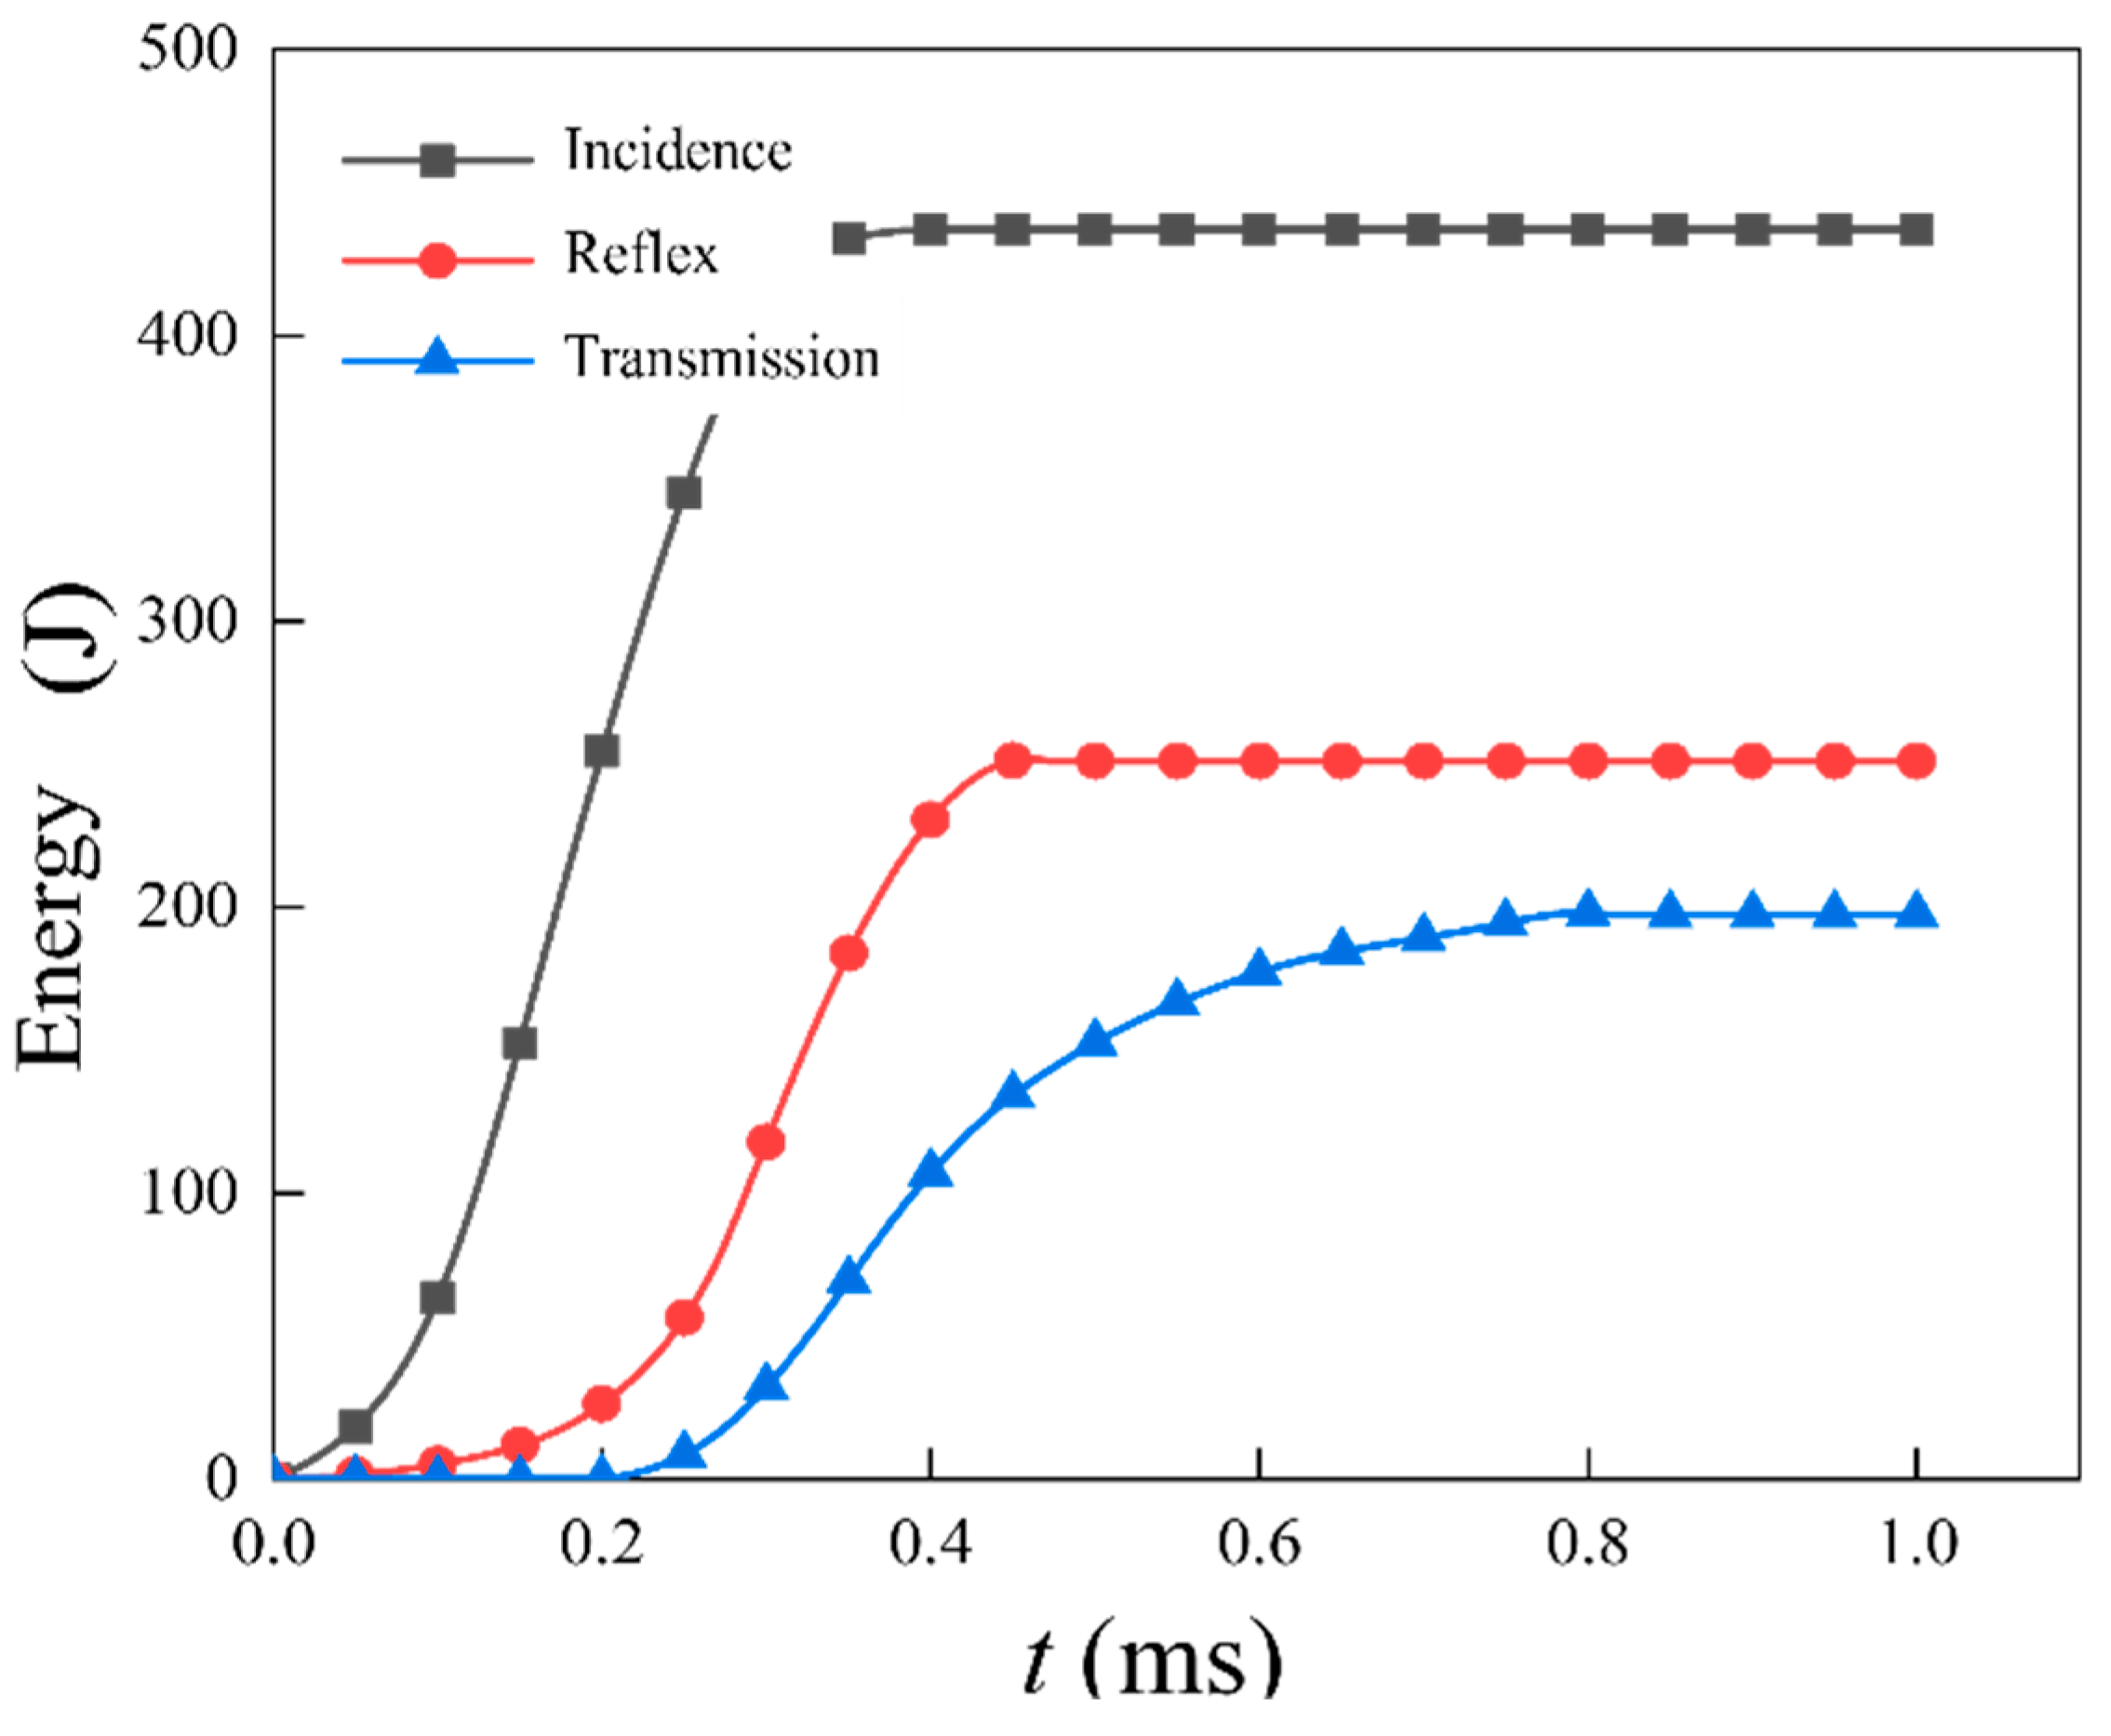
In the equation, W FD represents fragmentation energy, W K represents elastic kinetic energy dissipation, and W O represents other forms of energy dissipation. Typically, over 95% of the energy is used for fragmentation energy, and the rock’s absorbed energy W S can be approximated as W FD , meaning that the absorbed energy is considered as the dissipated energy. Figure 15 illustrates the typical energy variation in a high-temperature split Hopkinson pressure bar (SHPB) test.
From Figure 15, it can be seen that in the early stages of the SHPB test, the incident energy, reflected energy, and transmitted energy gradually increase with time until they stabilize. The incident energy is smaller than the reflected and transmitted energies, and it peaks earlier than both the reflected and transmitted waves. In this study, to analyze the variation of energy under different strain rates, the changes in the peak values of incident energy, reflected energy, and transmitted energy are examined. For simplicity, in the following sections, incident energy WI will represent the peak value of incident energy, reflected energy WR will represent the peak value of reflected energy, and transmitted energy WT will represent the peak value of transmitted energy.

4.3.1. Characterization of Changes in Energy Dissipation Density

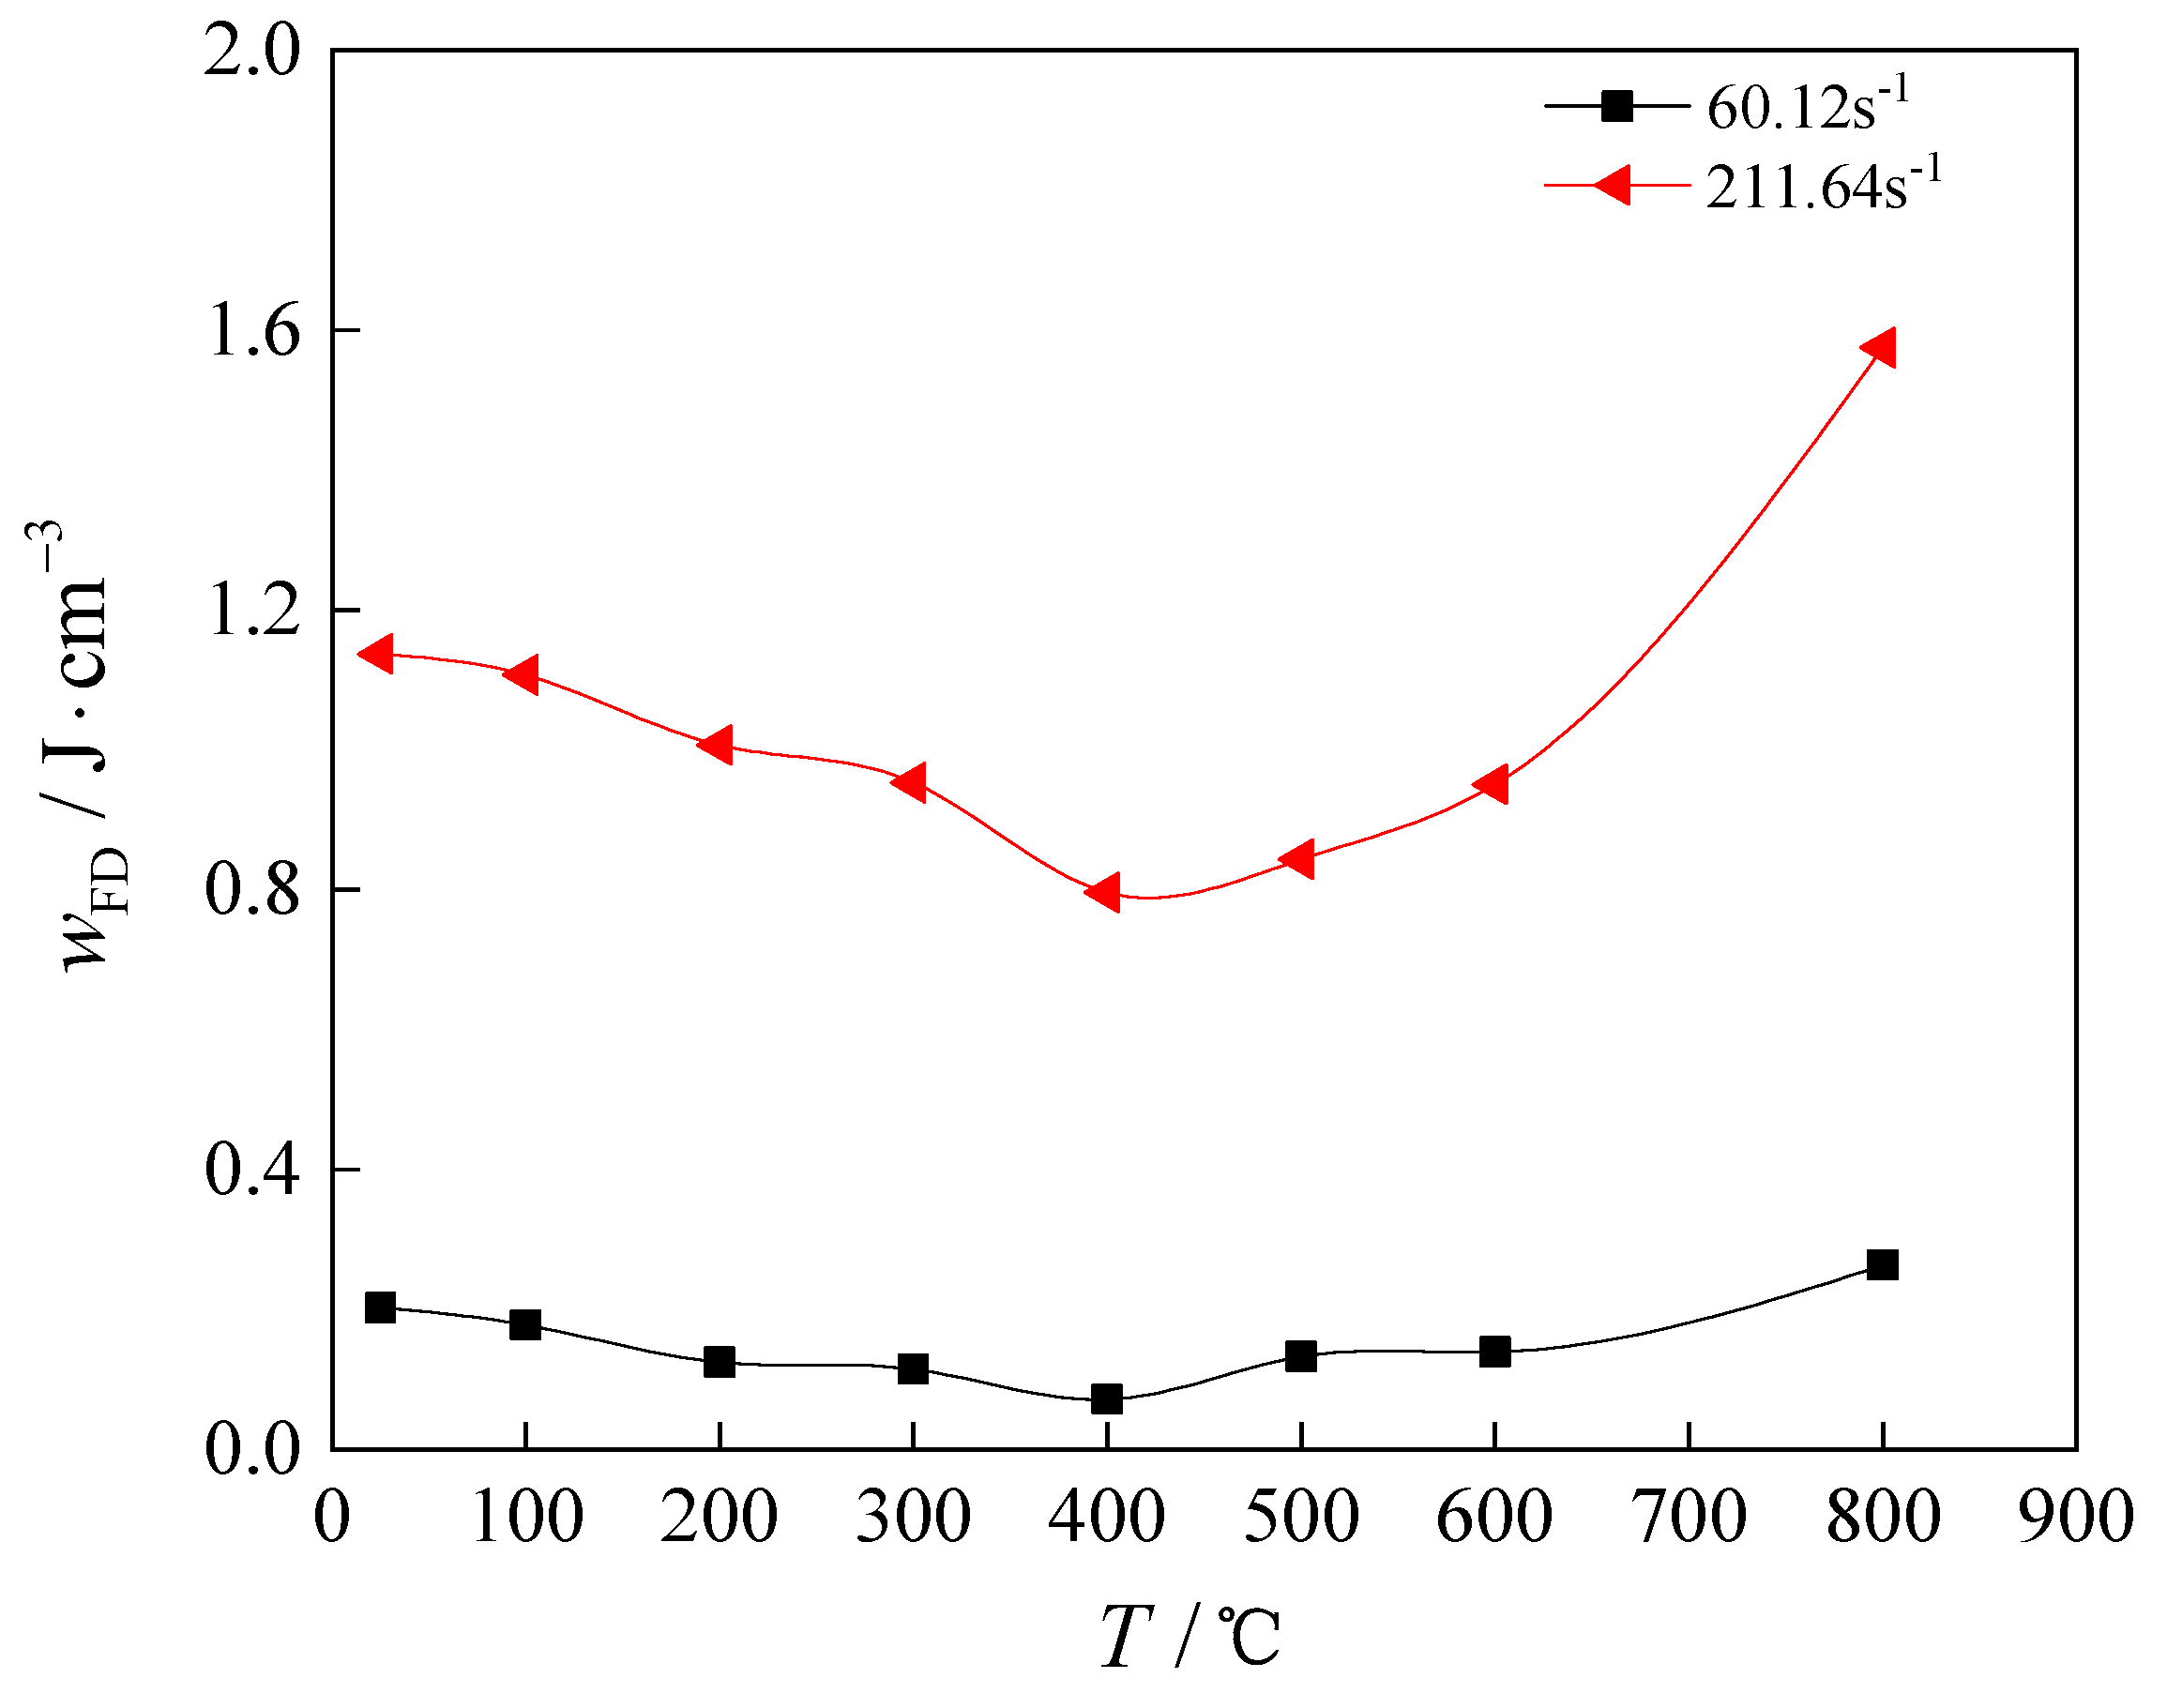
Figure 13 presents the curve showing the variation of energy dissipation density (wFD) with temperature (T).
From Figure 16, it can be seen that the energy dissipation density (wFD) of coal-bearing sandstone shows a decreasing trend followed by an increasing trend with temperature (T) at strain rates ( ε ˙ ) of 60.12 s−1 and 211.64 s−1; at a strain rate ( ε ˙ ) of 60.12 s−1, as temperature (T) increases from 25 °C to 400 °C, the energy dissipation density (wFD) decreases from 0.203 to 0.072, a reduction of 64.53%. From 400 °C to 800 °C, the energy dissipation density (wFD) increases from 0.072 to 0.264, an increase of 266.67%; at a strain rate ( ε ˙ ) of 211.64 s−1, as temperature (T) increases from 25 °C to 400 °C, the energy dissipation density (wFD) decreases from 1.137 to 0.796, a decrease of 29.99%. From 400 °C to 800 °C, the energy dissipation density (wFD) increases from 0.796 to 1.575, an increase of 97.86%, with both the decrease and increase being significantly smaller than those at the lower strain rate. This suggests that as temperature increases, the energy required for coal-bearing sandstone to fail decreases initially and then increases, with the degree of rock failure first decreasing and then increasing. The sensitivity of failure to temperature changes diminishes at higher strain rates, which aligns with the pattern observed from the fractal dimension of the rock samples.
By comparing the energy dissipation density (wFD) of coal-bearing sandstone at strain rates ( ε ˙ ) of 60.12 s−1 and 211.64 s−1, it can be seen that: the energy dissipation density (wFD) of coal-bearing sandstone is higher at higher strain rates compared with lower strain rates; and when the strain rate ( ε ˙ ) increases from 60.12 s−1 to 211.64 s−1, the energy dissipation density (wFD) varies from 0.711 to 1.311, showing an increase ranging from 460.10% to 1005.56%. This result indicates that under high strain rate conditions, coal-measure sandstone absorbs and dissipates a greater amount of energy during impact loading, leading to more intense fracturing and structural reconfiguration of the material, thereby exhibiting more pronounced dynamic failure characteristics.

4.3.2. Characterization of Energy Consumption Rate of Rock Samples

Figure 17 illustrates the curve showing the variation of energy consumption rate (λI) with temperature.
From Figure 17, it can be seen that the energy consumption rate (λI) of coal-bearing sandstone decreases linearly with temperature (T) at strain rates ( ε ˙ ) of 60.12 s−1 and 211.64 s−1, with the fitting equations provided in equations ( λ I = 0.000248 T + 0.412 ) and ( λ I = 0.000245 T + 0.296 ). At a strain rate ( ε ˙ ) of 60.12 s−1, as temperature (T) increases, the energy consumption rate (λI) decreases from 39.26% to 21.74%, a decrease of 44.63%; at a strain rate ( ε ˙ ) of 211.64 s−1, as temperature (T) increases, the energy consumption rate (λI) decreases from 27.45% to 10.91%, a reduction of 60.26%, which is 15.63% larger than the reduction at lower strain rates. The decrease in energy consumption rate during the failure of coal-bearing sandstone suggests that as temperature increases, the material becomes more susceptible to failure, Additionally, the temperature sensitivity of the energy consumption rate of coal-bearing sandstone increases at higher strain rates.
By comparing the energy consumption rate (λI) of coal-bearing sandstone at strain rates ( ε ˙ ) of 60.12 s−1 and 211.64 s−1, it can be seen that: the energy consumption rate (λI) of coal-bearing sandstone is lower at higher strain rates compared to lower strain rates; when the strain rate ( ε ˙ ) increases from 60.12 s−1 to 211.64 s−1, the energy consumption rate (λI) varies between 9.61% and 11.81%, with a decrease ranging from 30.08% to 40.82%.

4.4. Analysis of the Coupled Effect of High Temperature and Strain Rate in Coal Sandstone

By analyzing the strain rate and temperature effects on the mechanical properties, failure characteristics, and dissipation behavior of coal-bearing sandstone, it can be observed that the effects of strain rate and temperature show a significant coupling effect [49,50]. In certain cases, increasing temperature enhances the impact of strain rate, while increasing strain rate also strengthens the temperature effect to some extent. This section analyzes the coupling effects between strain rate and temperature on the dynamic elastic modulus ( E d ), dynamic compressive strength ( σ d ), dynamic peak strain ( ε d ), fractal dimension (Ds), energy dissipation density ( w FD ), and absorption efficiency coefficient (λI) of coal-bearing sandstone.

4.4.1. Dynamic Mechanical Properties and Crushing Fractionation Laws

1.
Characteristics of changes in dynamic modulus of elasticity
Table 3 shows the variation of dynamic elastic modulus ( E d ) of coal-bearing sandstone with strain rate ( ε ˙ ) and temperature (T). Figure 18 presents the surface contour plot of dynamic elastic modulus ( E d ) as a function of strain rate ( ε ˙ ) and temperature (T).
From Table 3 and Figure 18, it can be seen that the dynamic elastic modulus ( E d ) of coal-bearing sandstone increases with increasing strain rate ( ε ˙ ) but decreases with increasing temperature (T); When the strain rate is low ( ε ˙ = 60.12 s−1), the dynamic elastic modulus ( E d ) decreases more quickly as the temperature (T) increases, whereas at higher strain rates ( ε ˙ = 211.64 s−1), the dynamic elastic modulus ( E d ) decreases more slowly with increasing temperature (T); When the temperature is low (T = 25 °C), the dynamic elastic modulus ( E d ) increases more quickly with increasing strain rate ( ε ˙ ), whereas at higher temperatures (T = 800 °C), the increase in dynamic elastic modulus ( E d ) with strain rate ( ε ˙ ) is slower. In fact, the high temperature causes evaporation of internal moisture and structural changes in the rock’s components, which weakens its ability to resist deformatio [51].
2.
Characteristics of changes in dynamic compressive strength
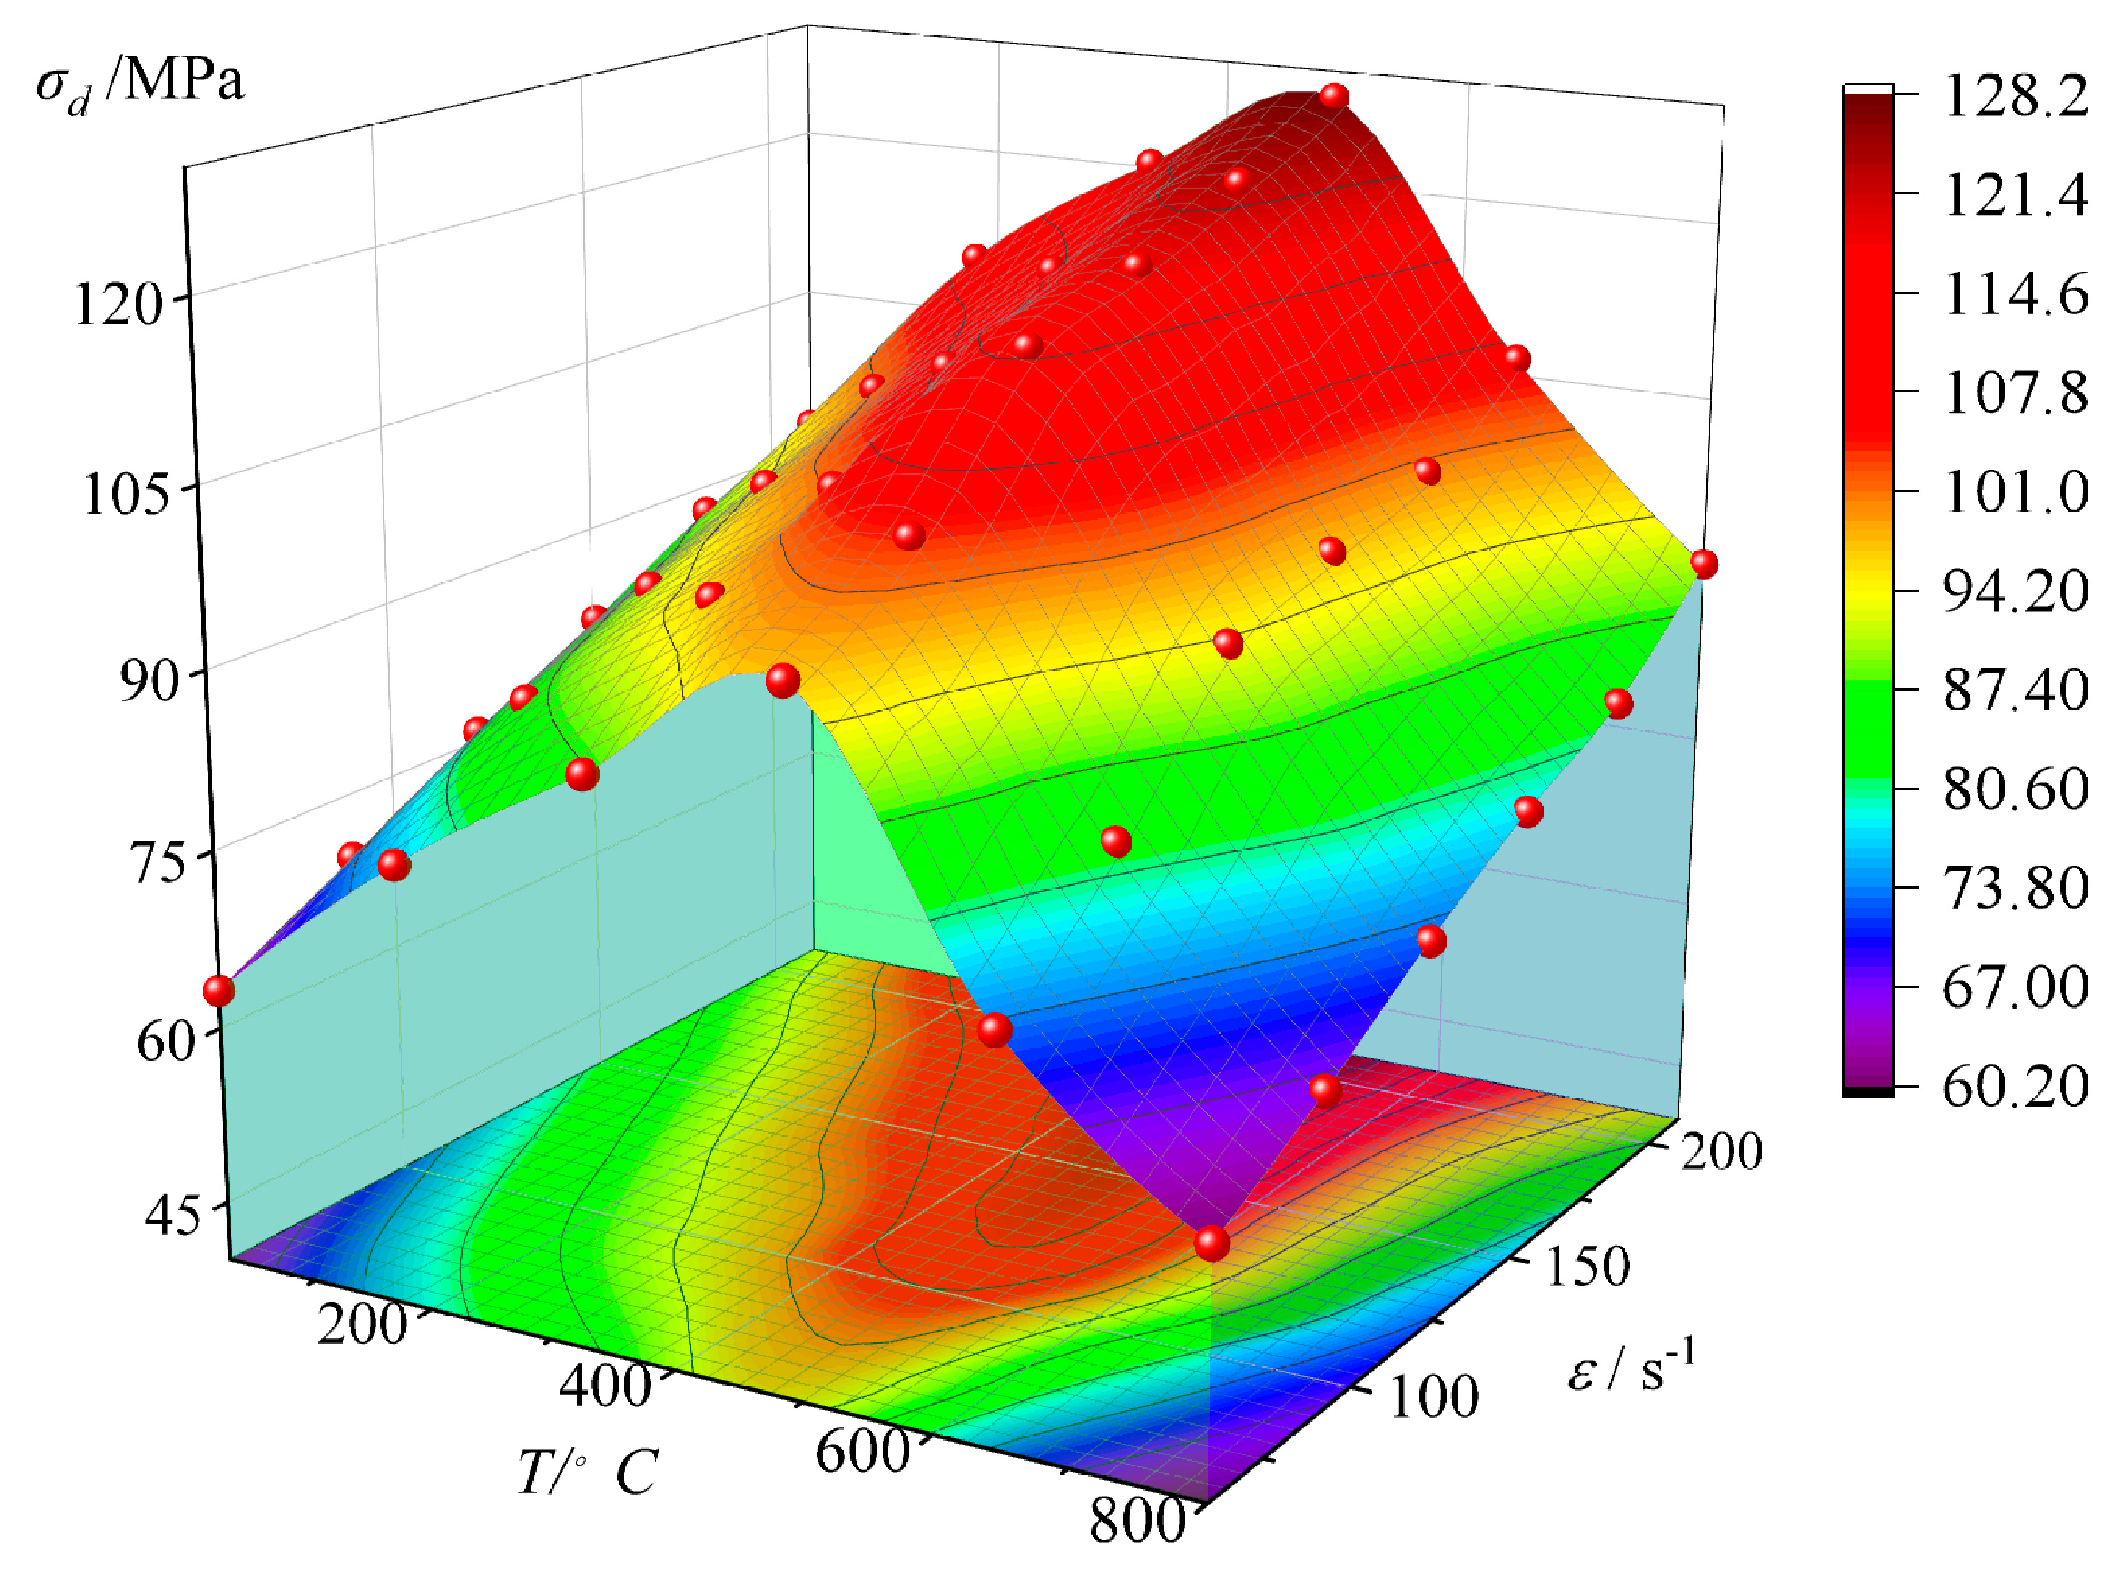
Table 4 shows the variation of dynamic compressive strength (σd) of coal-bearing sandstone with strain rate ( ε ˙ ) and temperature (T). Figure 19 presents the surface contour plot of dynamic compressive strength (σd) as a function of strain rate ( ε ˙ ) and temperature (T).
From Table 4 and Figure 19, it can be seen that the dynamic elastic modulus (σd) of coal-bearing sandstone increases with increasing strain rate ( ε ˙ ); when the temperature (T) is below 400 °C, the dynamic elastic modulus (σd) of coal-bearing sandstone increases with temperature (T). However, when the temperature (T) exceeds 400 °C, the dynamic elastic modulus d) of coal-bearing sandstone decreases with increasing temperature (T). In fact, when the temperature (T) is below 400 °C, the rock sample mainly shows changes in the internal component structure and pore structure; when the temperature (T) exceeds 400 °C, besides changes in internal component structure and pore structure, a significant number of thermally induced fracture units form, weakening its load-bearing capacity.
3.
Characteristics of changes in dynamic peak strain
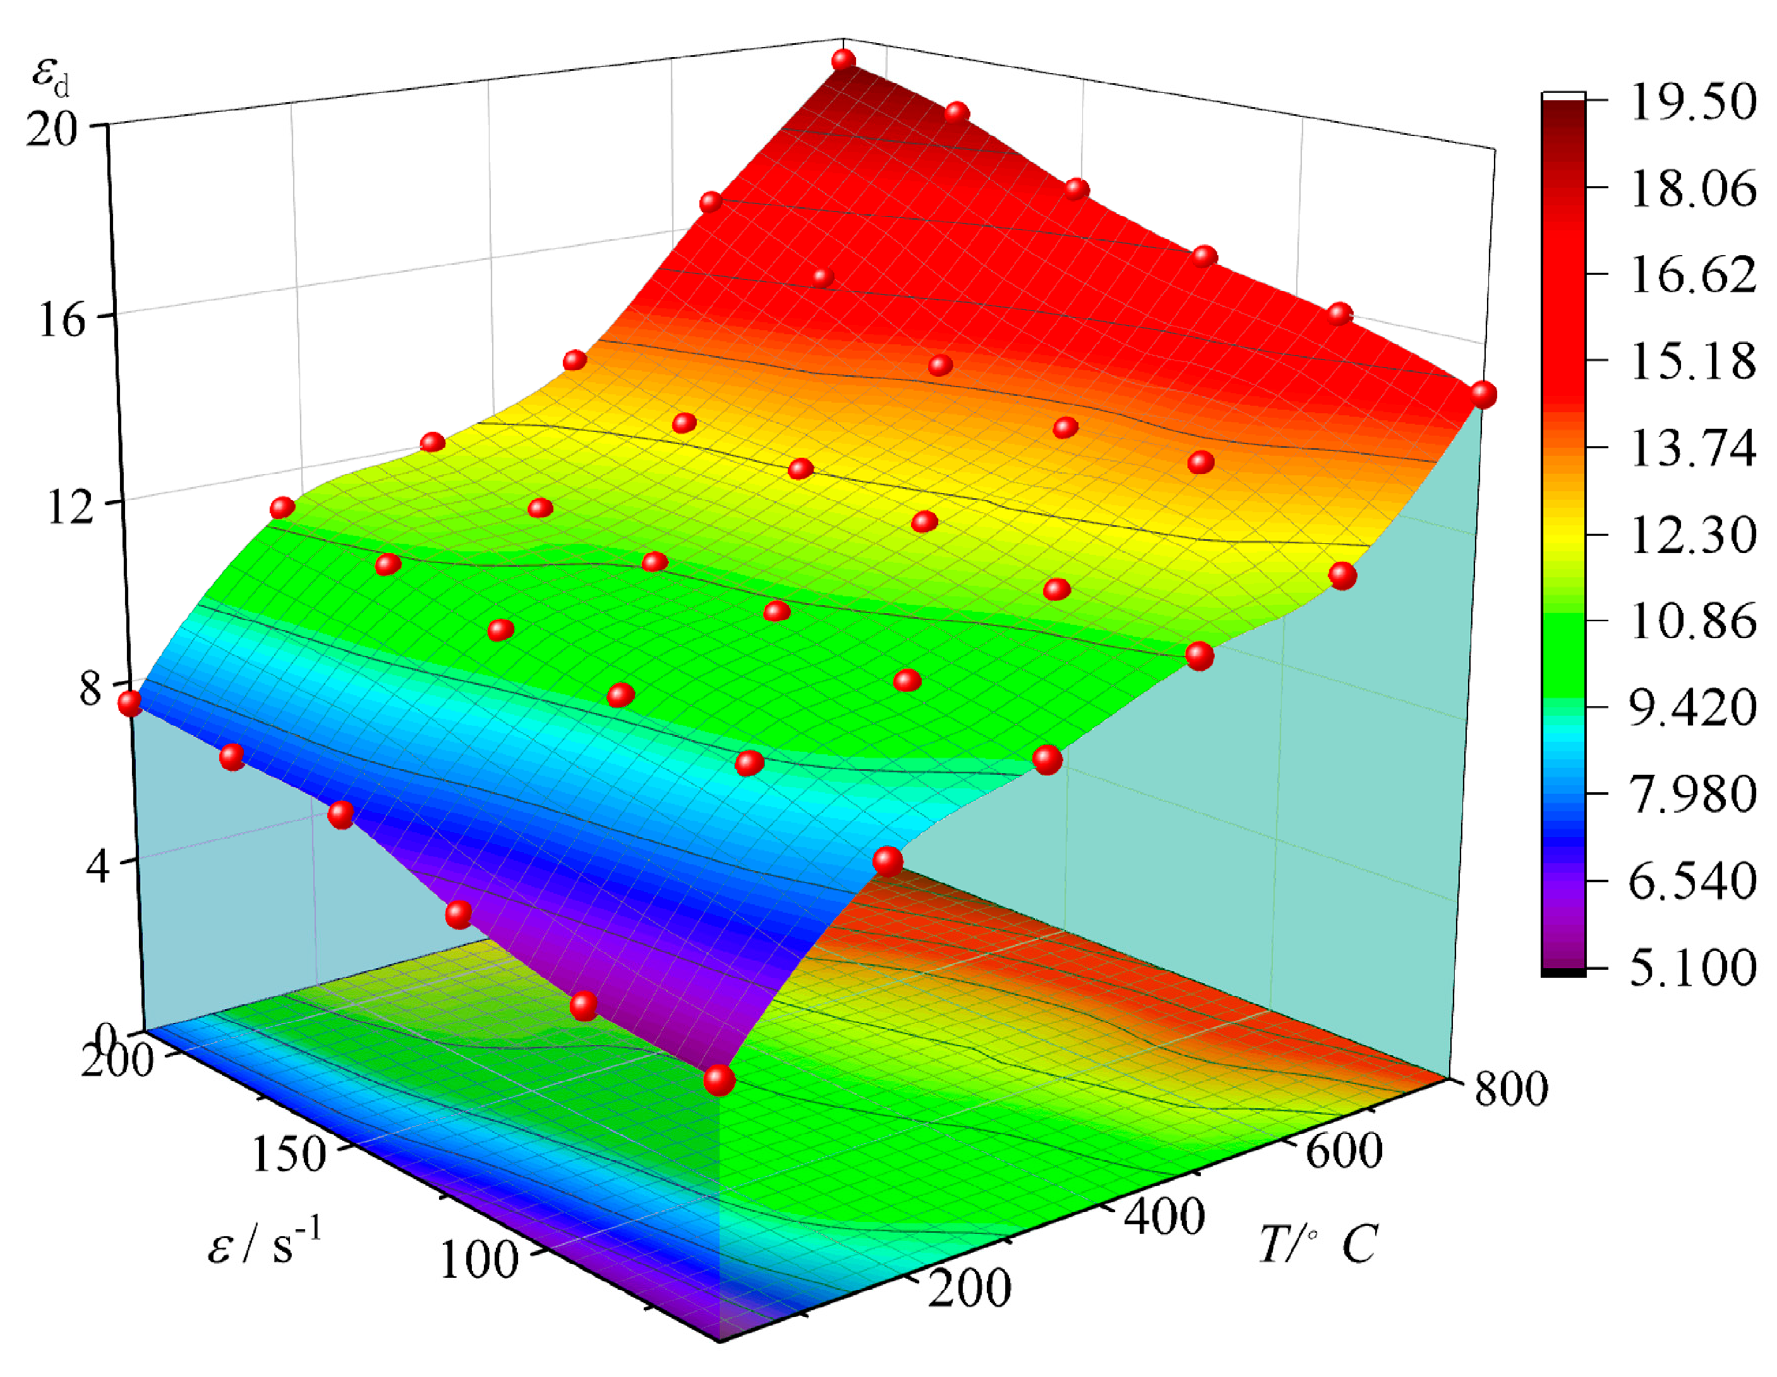
Table 5 shows the variation of dynamic peak strain (εd) of coal-bearing sandstone with strain rate ( ε ˙ ) and temperature (T). Figure 20 presents the surface contour plot of dynamic peak strain (εd) as a function of strain rate ( ε ˙ ) and temperature (T).
From Table 5 and Figure 20, it can be seen that the dynamic peak strain (εd) of coal-bearing sandstone increases with increasing strain rate ( ε ˙ ) and temperature (T). When the strain rate is low ( ε ˙ = 60.12 s−1), the dynamic peak strain (εd) increases more slowly with increasing temperature (T), whereas at higher strain rates ( ε ˙ = 211.64 s−1), the dynamic peak strain (εd) increases more quickly with temperature (T); when the temperature is low (T = 25 °C), the increase in dynamic peak strain (εd) with rising strain rate ( ε ˙ ) is slower, whereas at higher temperatures (T = 800 °C), the dynamic peak strain (εd) increases more rapidly with rising strain rate ( ε ˙ ).
4.
Characteristics of the variation in fractal dimension of clasts
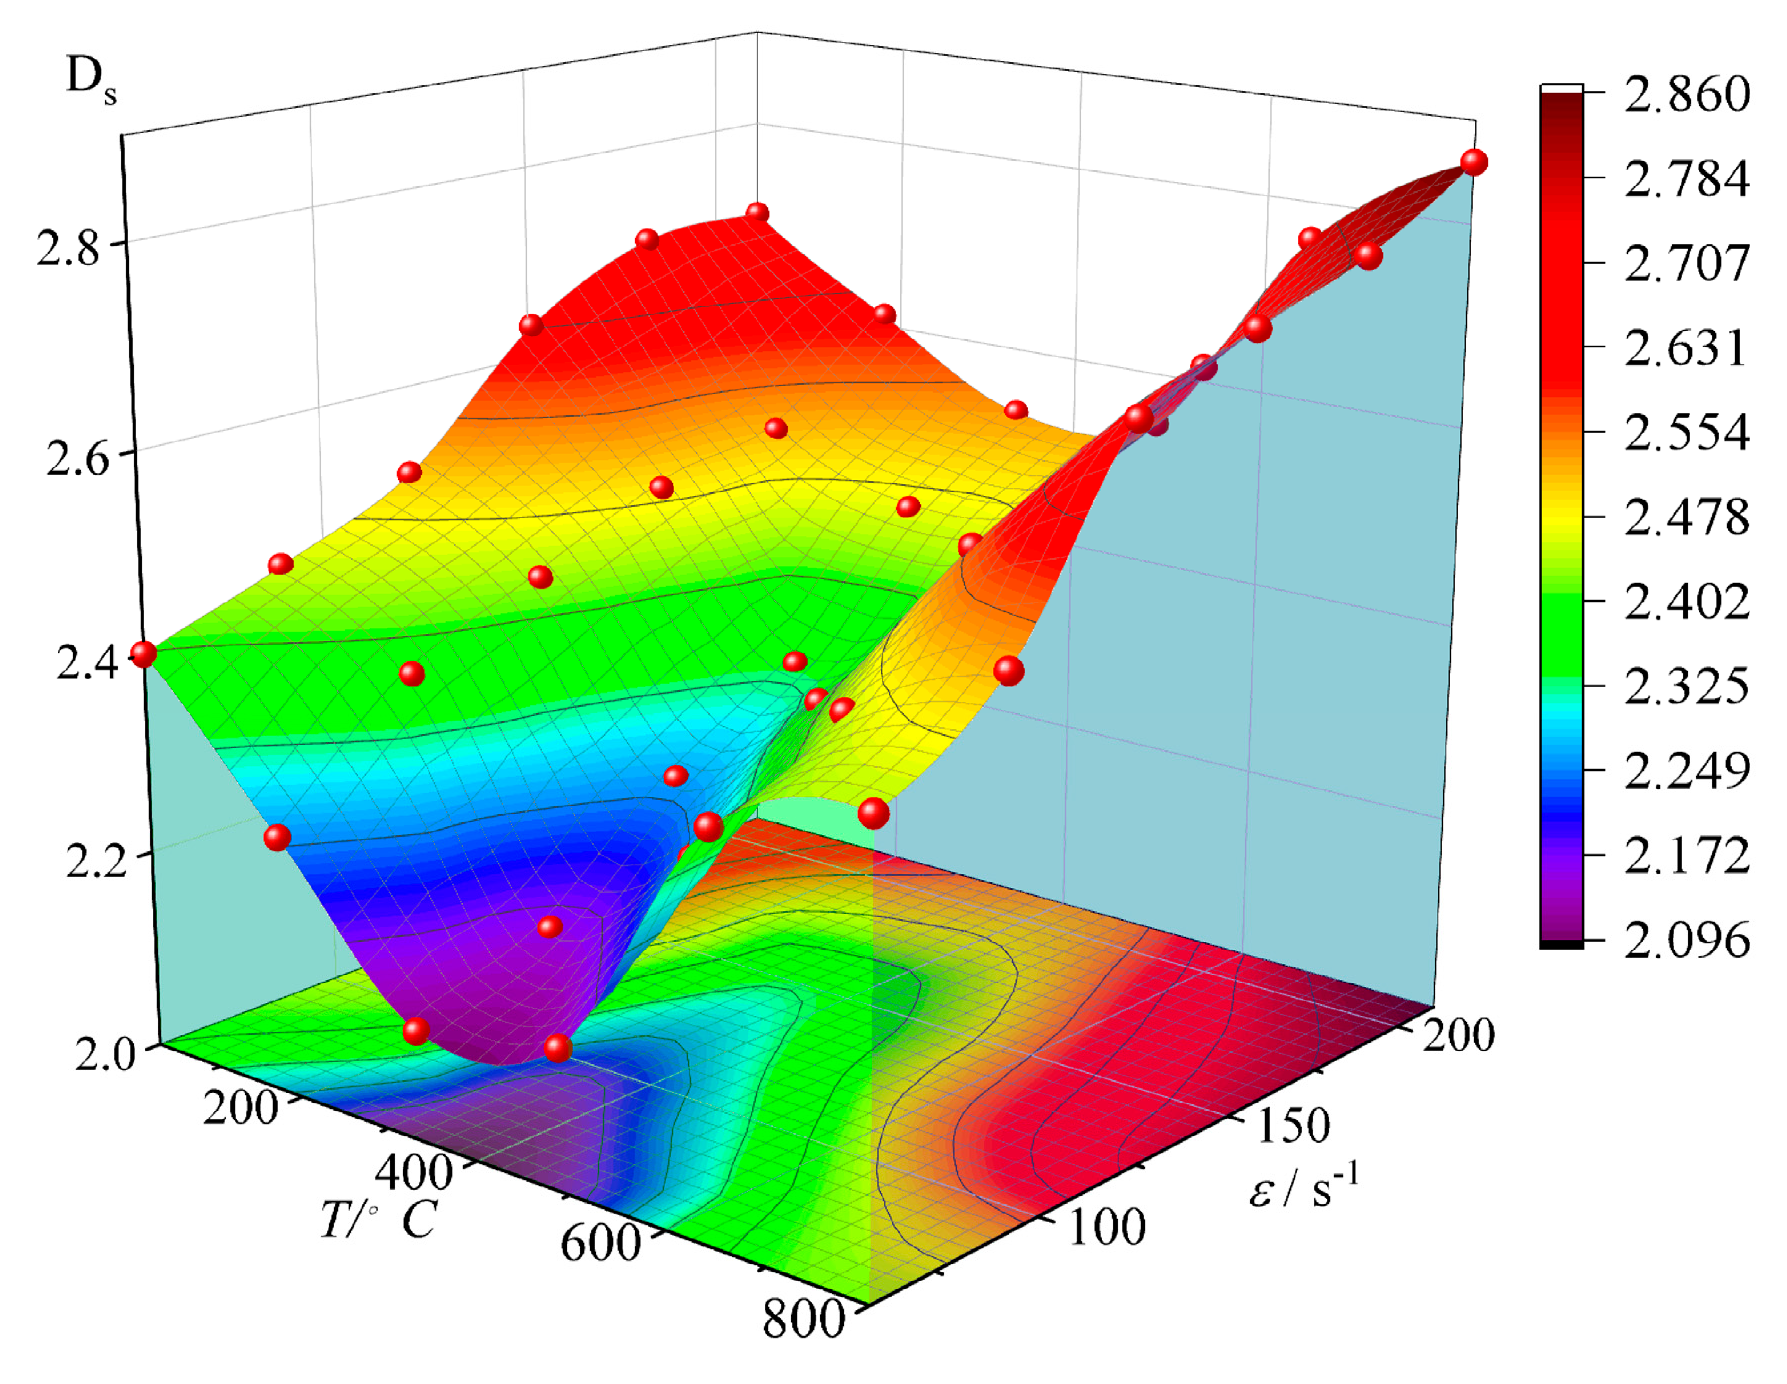
Table 6 shows the variation of the fractal dimension (Ds) of coal-bearing sandstone fragments with strain rate ( ε ˙ ) and temperature (T). Figure 21 presents the surface contour plot of the fractal dimension (Ds) of the rock sample fragment distribution with strain rate ( ε ˙ ) and temperature (T).
From Table 6 and Figure 21, it can be seen that the fractal dimension (Ds) of the coal-bearing sandstone fragment distribution increases with increasing strain rate ( ε ˙ ), indicating that the extent of rock fragmentation increases with increasing strain rate ( ε ˙ ); when the temperature (T) is below about 400 °C, the fractal dimension (Ds) of the coal-bearing sandstone fragment distribution decreases with increasing temperature (T). However, when the temperature (T) is above 400 °C, the fractal dimension (Ds) of the coal-bearing sandstone fragment distribution increases with increasing temperature (T). This indicates that when the temperature is around 400 °C and the strain rate ( ε ˙ ) is relatively low, the rock sample’s fragmentation is at its minimum.

4.4.2. Dynamic Energy Dissipation Laws

This section analyzes the coupling effects of strain rate and temperature on the average energy dissipation density (wFD) and energy consumption rate (λI) of coal-bearing sandstone.
(1)
Characteristics of changes in energy dissipation density
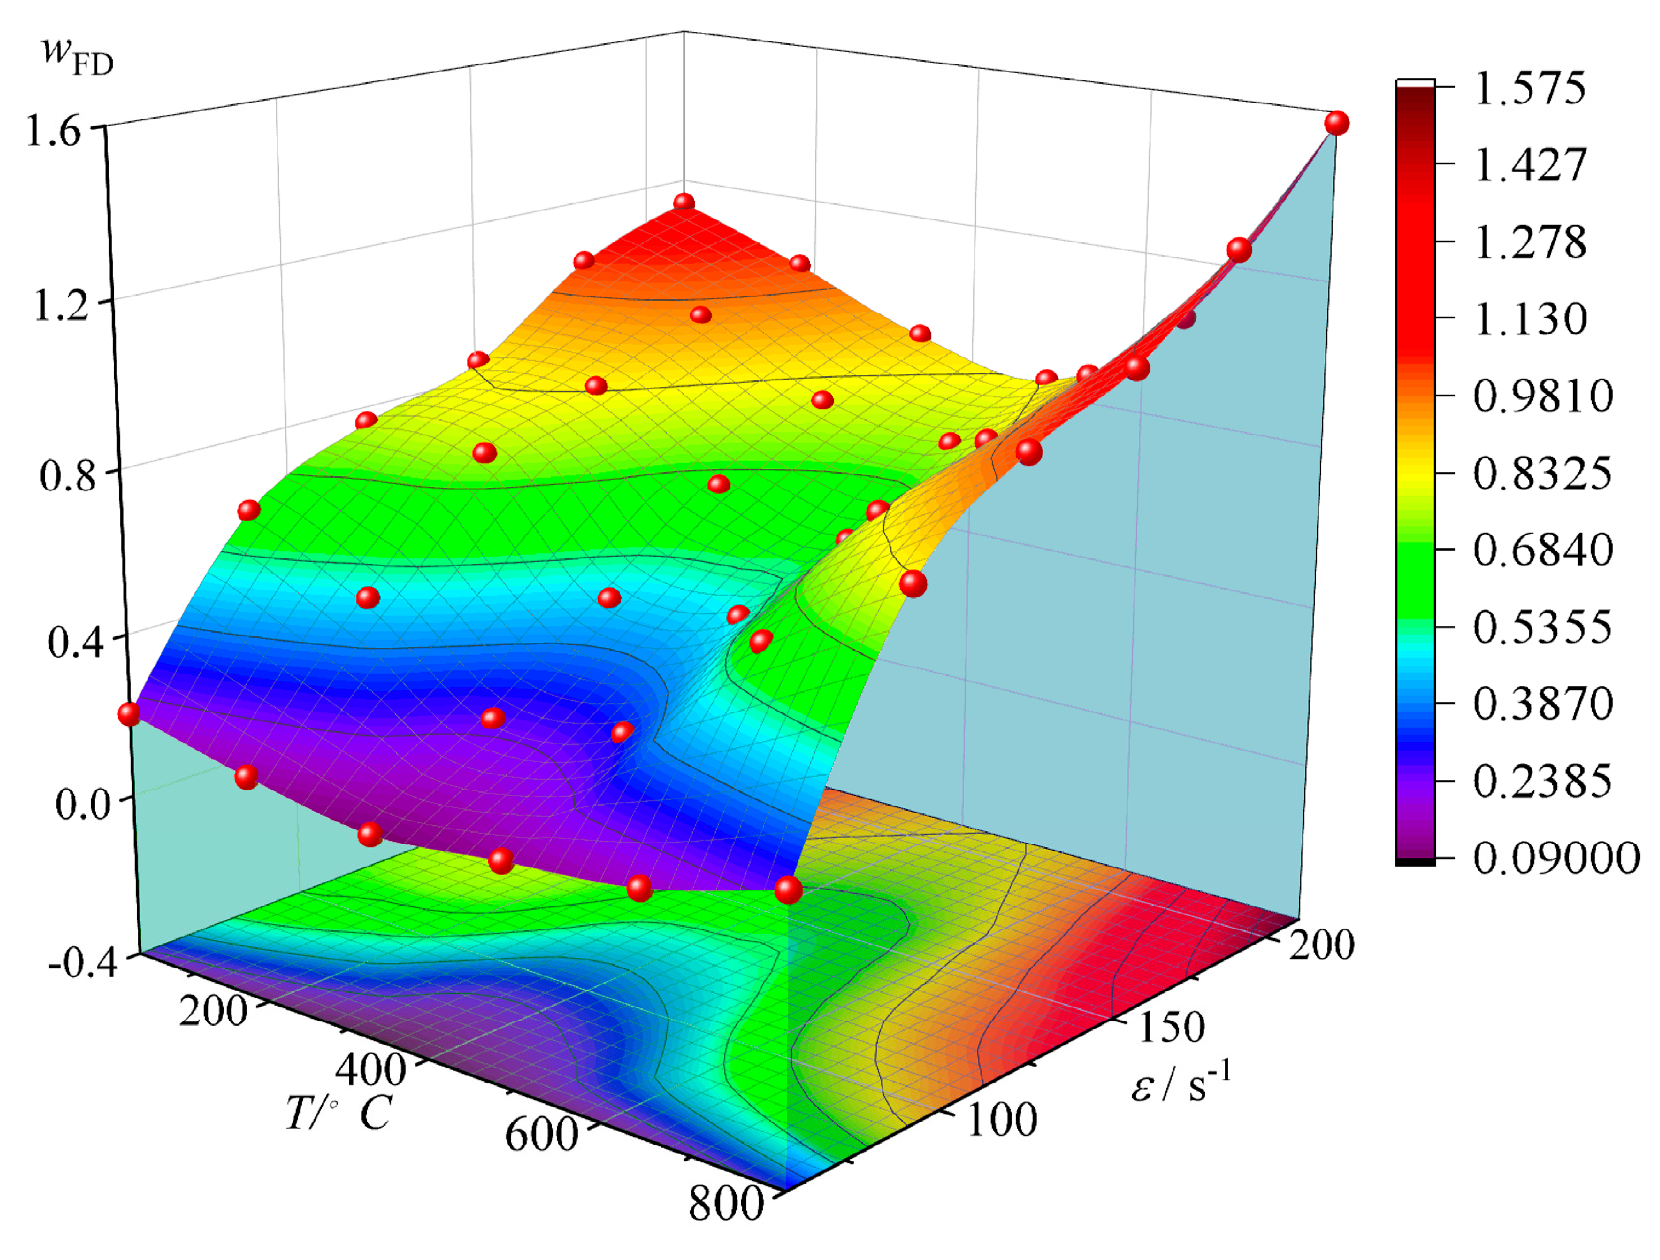
Table 7 shows the variation of energy dissipation density (wFD) of coal-bearing sandstone with strain rate ( ε ˙ ) and temperature (T). Figure 22 presents the surface contour plot of energy dissipation density (wFD) of the rock sample as a function of strain rate ( ε ˙ ) and temperature (T).
From Table 7 and Figure 22, it can be seen that the energy dissipation density (wFD) of the rock sample increases with strain rate ( ε ˙ ). When the temperature (T) is below around 400 °C, the energy dissipation density (wFD) of the rock sample decreases with increasing temperature (T). However, when the temperature (T) is above 400 °C, the energy dissipation density (wFD) increases with increasing temperature (T). This suggests that when the temperature (T) is around 400 °C and the strain rate ( ε ˙ ) is relatively low, the energy dissipation density (wFD) of the rock sample is at its minimum, leading to the least amount of rock fragmentation at this condition.
(2)
Characteristics of variation in energy consumption rates of rock samples
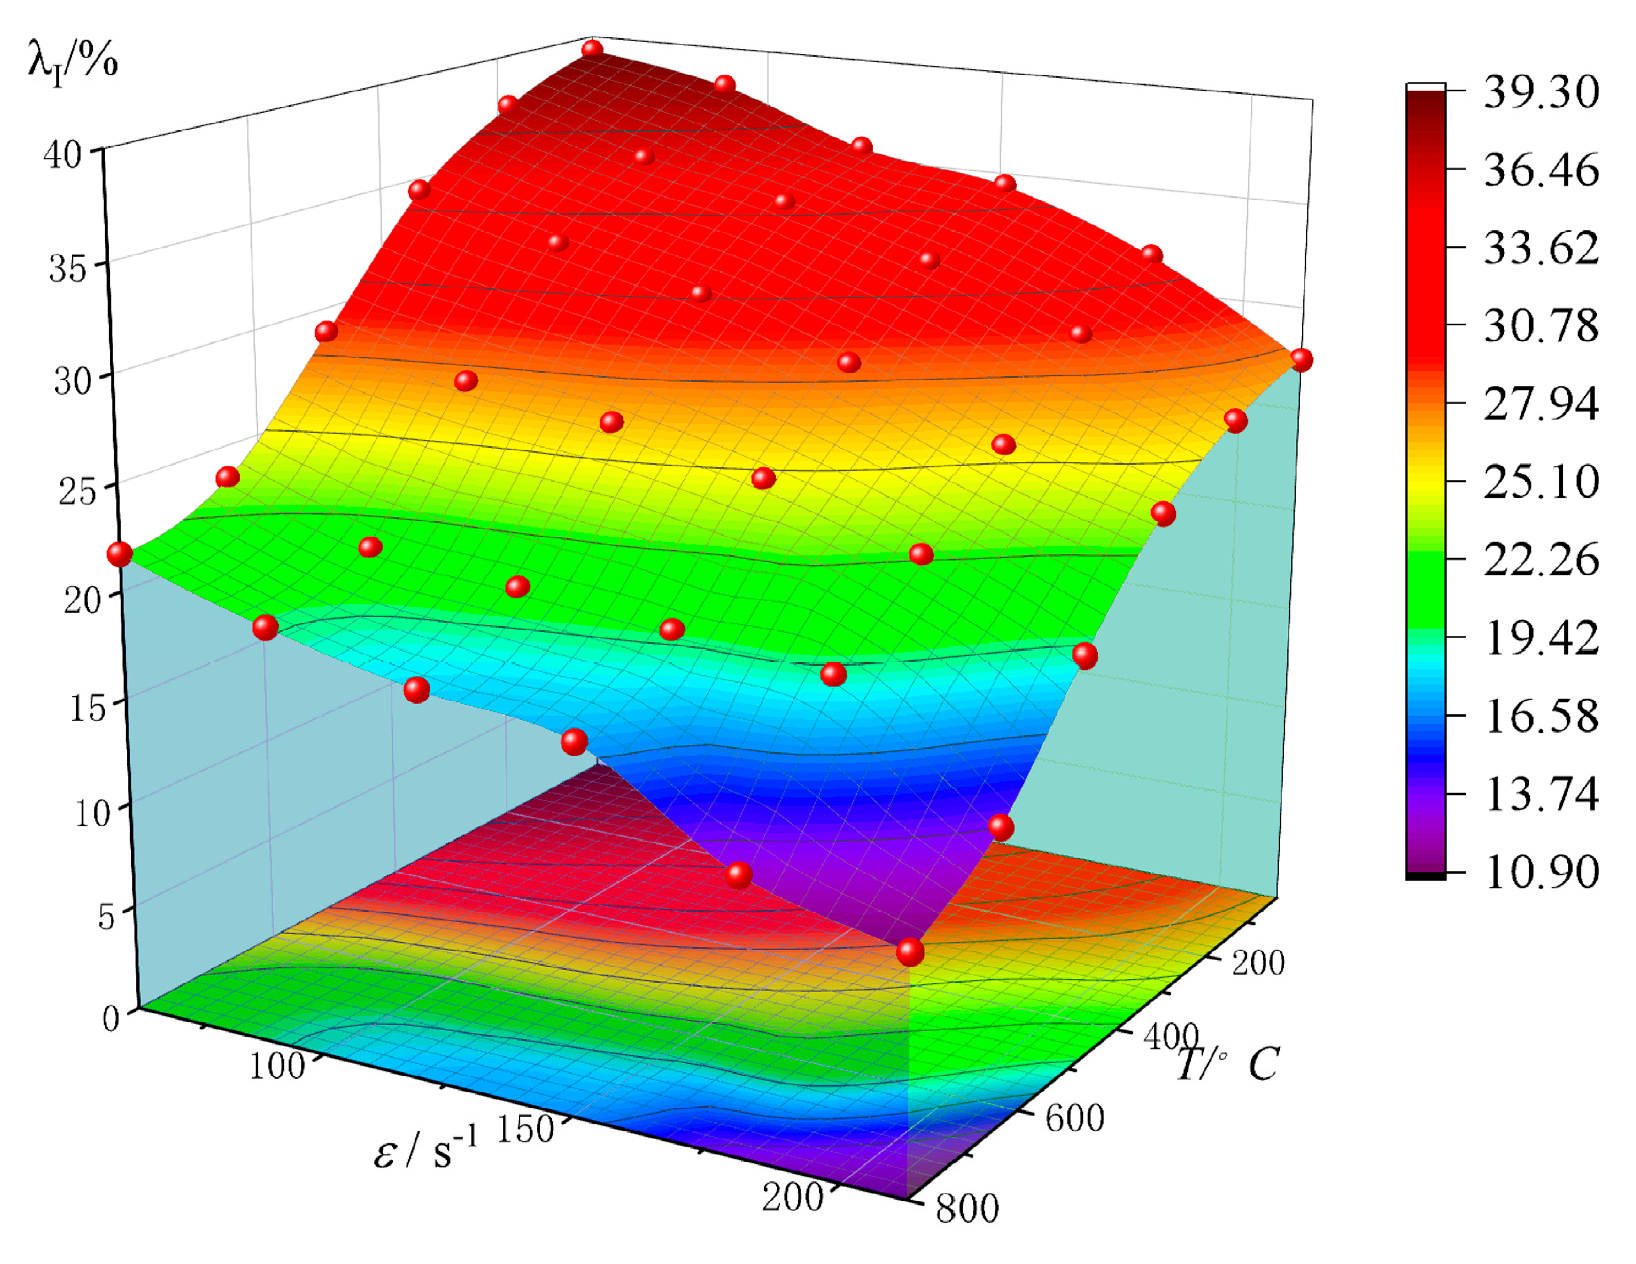
Table 8 shows the variation of energy consumption rate (λI) of coal-bearing sandstone with strain rate ( ε ˙ ) and temperature (T). Figure 23 presents the surface contour plot of energy consumption rate (λI) with strain rate ( ε ˙ ) and temperature (T) for the rock sample.
From Table 8 and Figure 23, it can be seen that the energy consumption rate (λI) of the rock sample decreases with increasing strain rate ( ε ˙ ) and temperature (T). When the strain rate is low ( ε ˙ = 60.12 s−1), the decrease in energy consumption rate (λI) with increasing temperature (T) occurs at a slower rate, and at higher strain rates ( ε ˙ = 211.64 s−1), the energy consumption rate (λI) decreases more rapidly as temperature (T) increases. And when the temperature is low (T = 25 °C), the energy consumption rate (λI) decreases more slowly with increasing strain rate ( ε ˙ ). And at higher temperatures (T = 800 °C), the energy consumption rate (λI) decreases more rapidly as strain rate ( ε ˙ ) increases. This suggests that with increasing strain rate ( ε ˙ ) and temperature (T), the proportion of energy dissipated in rock fragmentation, relative to the system’s input energy, decreases.

5. Conclusions

This manuscript examines the temperature effects on the mechanical properties of coal-bearing rocks under high strain rates, analyzing the variations in dynamic stress–strain curves, dynamic elastic modulus (Ed), dynamic compressive strength (σd), dynamic peak strain (εd), fractal dimension (Ds), energy dissipation density (wFD), and energy consumption rate (λI) with temperature (T). It further analyzes the classification characteristics of coal-bearing sandstone and the coupling effects of high temperature and strain rate, with the main conclusions as follows:
(1)
At a strain rate ( ε ˙ ) of 211.64 s−1, the dynamic elastic modulus (Ed) decreases linearly from 33.38 GPa to 9.80 GPa as the temperature (T) increases, showing a decrease of 70.64%, which is 3.80% smaller than that at lower strain rates. The dynamic compressive strength (σd) increases initially and then decreases with temperature (T). From 25 °C to 500 °C, the dynamic compressive strength (σd) increases from 92.39 MPa to 126.88 MPa, showing an increase of 37.33%. However, as the temperature increases from 500 °C to 800 °C, it decreases from 126.88 MPa to 90.56 MPa, with a reduction of 28.63%. Both the increase and decrease are smaller at higher strain rates compared with lower ones. The dynamic peak strain (εd) of coal-bearing sandstone increases linearly from 0.00751 to 0.0195 as the temperature (T) rises, with an increase of 159.00%, which is 31.48% lower than at lower strain rates.
(2)
At a strain rate ( ε ˙ ) of 211.64 s−1, rock samples visibly darken due to the real-time temperature effect between 100 °C and 800 °C. The coal-bearing sandstone samples show severe fracturing at different temperatures, with many fragments exhibiting a wedge-like shape and a higher proportion of powdery fragments. The fractal dimension (Ds) decreases initially and then increases with temperature (T). As the temperature rises from 25 °C to 400 °C, the fractal dimension (Ds) decreases from 2.70 to 2.52, a reduction of 6.67%. However, from 400 °C to 800 °C, it increases from 2.52 to 2.86, an increase of 13.49%. Both the increase and decrease are lower compared with lower strain rates.
(3)
At a strain rate ( ε ˙ ) of 211.64 s−1, the energy dissipation density (wFD) of coal-bearing sandstone decreases initially and then increases with temperature (T). From 25 °C to 400 °C, the energy dissipation density (wFD) decreases from 1.137 to 0.796, a decrease of 29.99%, and from 400 °C to 800 °C, it increases from 0.796 to 1.575, showing an increase of 97.86%. Both the decrease and increase are smaller compared with lower strain rates. The energy consumption rate (λI) decreases linearly from 27.45% to 10.91% as temperature (T) increases, showing a decrease of 60.26%, which is 15.63% larger than at lower strain rates.
(4)
The dynamic elastic modulus (Ed) of coal-bearing sandstone increases with strain rate ( ε ˙ ) but decreases with increasing temperature (T). The dynamic elastic modulus (σd) increases with strain rate ( ε ˙ ) and initially rises with temperature (T) before decreasing, with an inflection point at T = 400 °C. The dynamic peak strain (εd) increases with both strain rate ( ε ˙ ) and temperature (T). The fractal dimension (Ds) of coal-bearing sandstone fragment distribution increases with strain rate ( ε ˙ ), but with temperature (T), it initially decreases and then increases, with an inflection point at T = 400 °C. The energy dissipation density (wFD) increases with strain rate ( ε ˙ ) and initially rises with temperature (T) before decreasing, with an inflection point at T = 400 °C. The energy consumption rate (λI) decreases with increasing strain rate ( ε ˙ ) and temperature (T).

Author Contributions

Methodology, M.L., Y.M. and B.W.; Validation, B.W. and J.D.; Formal analysis, F.Z. and Y.M.; Resources, F.F.; Data curation, F.Z., Y.M. and F.F.; Writing—original draft, M.L.; Writing—review & editing, F.Z.; Visualization, J.D.; Funding acquisition, M.L. All authors have read and agreed to the published version of the manuscript.

Funding

1. National Key Research and Development Program of China (Grant No. 2023YFC3804204). 2. National Natural Science Foundation of China (NSFC) (Grant No. 52174090; 52474113). 3. The Fundamental Research Funds for the Central Universities (Grant No. 2024KYJD1002). 4. Deep Earth Probe and Mineral Resources Exploration-National Science and Technology Major Project (Grant No. 2024ZD1004104).

Data Availability Statement

Data are contained within the article.

Conflicts of Interest

The authors declare no conflicts of interest.

References

  1. Konovsek, D.; Nadveznik, J.; Medved, M. An Overview of World History of Underground Coal Gasification. In Proceedings of the 22nd International Meeting of Thermophysics 2017 and 4th Meeting of EnRe 2017 (Thermophysics 2017), Terchova, Slovakia, 12–14 September 2017; Volume 1866, p. 5. [Google Scholar] [CrossRef]
  2. Liu, S.Q.; Liu, J.H.; Yu, L. Environmental benefits of underground coal gasification. J. Environ. Sci. 2002, 14, 284–288. [Google Scholar]
  3. Green, M. Recent developments and current position of underground coal gasification. Proc. Inst. Mech. Eng. Part a-J. Power Energy 2018, 232, 39–46. [Google Scholar] [CrossRef]
  4. Li, H.; Guo, G.; Zha, J.; Yuan, Y.; Zhao, B. Research on the surface movement rules and prediction method of underground coal gasification. Bull. Eng. Geol. Environ. 2016, 75, 1133–1142. [Google Scholar] [CrossRef]
  5. Wulandari, W.; Sasongko, D.; Rizkiana, J.; Anggayana, K.; Widayat, A.H.; Zahra, A.C.A.; Azhari, M.A. Non-isothermal Kinetics Analysis of Various Indonesian Coal Thermal Characteristics for Underground Coal Gasification Purposes. In Proceedings of the 11th Regional Conference On Chemical Engineering (RCChE 2018), Yogyakarta, Indonesia, 7–8 November 2018; Volume 2085, p. 9. [Google Scholar] [CrossRef]
  6. Liu, H.; Yao, H.; Yao, K.; Chen, F.; Luo, G. Characteristics of “Three zones” during Underground Coal Gasification. Nat. Resour. Sustain. Dev. II Pts 1-4 2012, 524–527, 56. [Google Scholar] [CrossRef]
  7. Yang, L.H.; Zhang, X.; Liu, S. Characteristics of Temperature Field during the Oxygen-enriched Underground Coal Gasification in Steep Seams. Energy Sources Part a-Recovery Util. Environ. Eff. 2010, 32, 384–393. [Google Scholar] [CrossRef]
  8. Zha, X.; Wang, H.; Cheng, S. Finite element analysis of the subsidence of cap rocks during underground coal gasification process. Adv. Res. Civ. Eng. Mater. Eng. Appl. Technol. 2014, 859, 91–94. [Google Scholar] [CrossRef]
  9. Pekpak, E.; Yoncaci, S.; Kilic, M.G. An overview of underground coal gasification and its applicability for Turkish lignite. In Proceedings of the 12th International Symposium On Environmental Issues and Waste Management in Energy and Mineral Production—SWEMP 2010, Prague, Czech Republic, 24–26 May 2010; pp. 398–407. [Google Scholar]
  10. Perkins, G.; Vairakannu, P. Considerations for oxidant and gasifying medium selection in underground coal gasification. Fuel Process. Technol. 2017, 165, 145–154. [Google Scholar] [CrossRef]
  11. Saulov, D.N.; Plumb, O.A.; Klimenko, A.Y. Flame propagation in a gasification channel. Energy 2010, 35, 1264–1273. [Google Scholar] [CrossRef]
  12. Wang, G.; Tan, J.; Li, C. Analysis of rock cracking characteristics during pyrolysis drilling. Therm. Sci. 2021, 25, 3377–3397. [Google Scholar] [CrossRef]
  13. Gautam, P.K.; Verma, A.K.; Jha, M.K.; Sharma, P.; Singh, T.N. Effect of high temperature on physical and mechanical properties of Jalore granite. J. Appl. Geophys. 2018, 159, 460–474. [Google Scholar] [CrossRef]
  14. Ma, X.; Wang, G.; Hu, D.; Liu, Y.; Zhou, H.; Liu, F. Mechanical properties of granite under real-time high temperature and three-dimensional stress. Int. J. Rock Mech. Min. Sci. 2020, 136, 8. [Google Scholar] [CrossRef]
  15. Salman, H.; Copeland, L. Effect of repeated heating and cooling cycles on the pasting properties of starch. J. Cereal Sci. 2010, 51, 105–109. [Google Scholar] [CrossRef]
  16. Weinbrandt, R.M.; Ramey, H.J., Jr.; Casse, F.J. Effect of temperature on relative and absolute permeability of sandstones. Soc. Pet. Eng. J. 1975, 15, 376–384. [Google Scholar] [CrossRef]
  17. Zhang, W.; Sun, Q.; Hao, S.; Geng, J.; Lv, C. Experimental study on the variation of physical and mechanical properties of rock after high temperature treatment. Appl. Therm. Eng. 2016, 98, 1297–1304. [Google Scholar] [CrossRef]
  18. Porada, S.; Czerski, G.; Dziok, T.; Grzywacz, P.; Makowska, D. Kinetics of steam gasification of bituminous coals in terms of their use for underground coal gasification. Fuel Process. Technol. 2015, 130, 282–291. [Google Scholar] [CrossRef]
  19. Perkins, G. Underground coal gasification—Part II: Fundamental phenomena and modeling. Prog. Energy Combust. Sci. 2018, 67, 234–274. [Google Scholar] [CrossRef]
  20. Laciak, M.; Kacur, J.; Durdan, M.; Skvarekova, E.; Wittenberger, G. Underground coal gasification in laboratory conditions. In Proceedings of the 11th International Multidisciplinary Scientific Geoconference (SGEM 2011), Albena, Bulgaria, 20–25 June 2011; Volume III, p. 123. [Google Scholar]
  21. Li, M.; Yu, H.; Zhang, J.; Lin, G.; Zhu, F.; Mao, Y.; Zhang, L.; Chen, Y. Dynamic tensile mechanical properties of thermally damaged sandstone under impact loads and the influence mechanism of composition. Eng. Fract. Mech. 2023, 289, 19. [Google Scholar] [CrossRef]
  22. Zhang, C.; Wang, F.; Hu, L.; Jiang, F.; Huang, G. Experimental investigation on the mechanical behavior and fracture mechanism of sandstone after heat treatment. Bull. Eng. Geol. Environ. 2024, 83, 18. [Google Scholar] [CrossRef]
  23. Wen, D.; Jiang, N.; Liu, C.; Lv, Z. Study of the Influence of Temperature Rise on the Microstructure of Frozen Soil Based on SEM and MIP. J. Mater. Civ. Eng. 2023, 35, 8. [Google Scholar] [CrossRef]
  24. Jing, S.; Wen, Z.; Jiang, Y.; Wen, J.; Du, W. Mechanical behaviors and failure characteristics of coal-rock combination under quasi-static and dynamic disturbance loading: A case based on a new equipment. Geomech. Geophys. Geo-Energy Geo-Resour. 2024, 10, 16. [Google Scholar] [CrossRef]
  25. Yin, T.B.; Wang, P.; Li, X.B.; Shu, R.H.; Ye, Z.Y. Effects of thermal treatment on physical and mechanical characteristics of coal rock. J. Cent. South Univ. 2016, 23, 2336–2345. [Google Scholar] [CrossRef]
  26. Zhou, C.; He, X.; Song, D.; Li, Z.; Yang, H.; Liu, Y.; Guo, L. Study on signal characteristics of burst tendency coal under different loading rates. Int. J. Coal Sci. Technol. 2024, 11, 9. [Google Scholar] [CrossRef]
  27. Wang, X.; Shen, R.; Wang, X.; Gu, Z.; Zhang, L.; Tan, E.; Yan, S.; Wang, E.; Zhao, E. Study on the mechanical behavior and energy evolution mechanism of coal samples with water content under dynamic load: Field and experimental tests. Phys. Fluids 2024, 36, 23. [Google Scholar] [CrossRef]
  28. GB/T50266-2013; Standard for Test Methods of Engineering Rock Mass. Beijing China Planning Publishing House: Beijing, China, 2013.
  29. Xie, B.J.; Ai, D.H.; Yang, Y. Crack Detection and Evolution Law for Rock Mass under SHPB Impact Tests. Shock Vib. 2019, 2019, 12. [Google Scholar] [CrossRef]
  30. Mishra, S.; Khetwal, A.; Chakraborty, T.; Basu, D. Effect of loading characteristics and specimen size in split Hopkinson pressure bar test on high-rate behavior of phyllite. Arch. Civ. Mech. Eng. 2022, 22, 20. [Google Scholar] [CrossRef]
  31. Sun, B.; Chen, R.; Ping, Y.; Zhu, Z.; Wu, N.; Shi, Z. Research on Dynamic Strength and Inertia Effect of Concrete Materials Based on Large-Diameter Split Hopkinson Pressure Bar Test. Materials 2022, 15, 15. [Google Scholar] [CrossRef]
  32. Huang, H.; Sun, Q.; Guo, C.; Xue, S.; Zhou, S. Investigating the evolution of pore space and magnetization rate of rocks under the effect of coal fire burning. Environ. Earth Sci. 2024, 83, 14. [Google Scholar] [CrossRef]
  33. Meng, T.; Guangwu, X.; Jiwei, M.; Yang, Y.; Liu, W.; Zhang, J.; Bosen, J.; Fang, S.; Ren, G. Mixed mode fracture tests and inversion of FPZ at crack tip of overlying strata in underground coal gasification combustion cavity under real-time high temperature condition. Eng. Fract. Mech. 2020, 239, 23. [Google Scholar] [CrossRef]
  34. Wang, S.; Wang, L.; Ren, B.; Ding, K.; Jiang, C.; Guo, J. Study of the mechanical characteristics of coal-serial sandstone after high temperature treatment under true triaxial loading. Sci. Rep. 2023, 13, 15. [Google Scholar] [CrossRef]
  35. Chen, S.; Huang, C.; Wang, C.; Duan, Z. Mechanical properties and constitutive relationships of 30CrMnSiA steel heated at high rate. Mater. Sci. Eng. A-Struct. Mater. Prop. Microstruct. Process. 2008, 483–484, 105–108. [Google Scholar] [CrossRef]
  36. Huang, R.; Li, S.; Meng, L.; Jiang, D.; Li, P. Coupled Effect of Temperature and Strain Rate on Mechanical Properties of Steel Fiber-Reinforced Concrete. Int. J. Concr. Struct. Mater. 2020, 14, 15. [Google Scholar] [CrossRef]
  37. Gao, C.Y.; Zhang, L.C.; Guo, W.G.; Li, Y.L.; Lu, W.R.; Ke, Y.L. Dynamic plasticity of AZ31 magnesium alloy: Experimental investigation and constitutive modeling. Mater. Sci. Eng. A-Struct. Mater. Prop. Microstruct. Process. 2014, 613, 379–389. [Google Scholar] [CrossRef]
  38. Ruan, Z.; Chen, L.; Fang, Q. Numerical investigation into dynamic responses of RC columns subjected for fire and blast. J. Loss Prev. Process Ind. 2015, 34, 10–21. [Google Scholar] [CrossRef]
  39. Xie, Q.; Chen, Y.; Lyu, H.; Gu, J.; Chen, Y.; Cui, H.; Wu, P. Dynamic mechanical properties and energy dissipation analysis of frozen sandstone with initial damage. Front. Earth Sci. 2023, 11, 10. [Google Scholar] [CrossRef]
  40. Yang, X.; Ge, Z.; Sun, Q.; Zhang, W. Effect of Temperature and Strain Rate on the Brittleness of China Sandstone. Geofluids 2021, 2021, 10. [Google Scholar] [CrossRef]
  41. Ping, Q.; Diao, Q.; Qi, D.; Wang, C.; Zhang, C. Influence of Two Cooling Methods on Dynamic Mechanical Properties of High Temperature Sandstone. Shock Vib. 2021, 2021, 12. [Google Scholar] [CrossRef]
  42. Li, J.; Tang, S.; Zhang, S.; Li, L.; Wei, J.; Xi, Z.; Sun, K. Characterization of unconventional reservoirs and continuous accumulations of natural gas in the Carboniferous-Permian strata, mid-eastern Qinshui basin, China. J. Nat. Gas Sci. Eng. 2018, 49, 298–316. [Google Scholar] [CrossRef]
  43. Shi, S.; Wei, J.; Xie, D.; Yin, H.; Zhang, W.; Li, L. An attribute recognition model to predict the groundwater potential of sandstone aquifers in coal mines. J. Earth Syst. Sci. 2019, 128, 12. [Google Scholar] [CrossRef]
  44. Yang, S.; Ranjith, P.G.; Jing, H.; Tian, W.; Ju, Y. An experimental investigation on thermal damage and failure mechanical behavior of granite after exposure to different high temperature treatments. Geothermics 2017, 65, 180–197. [Google Scholar] [CrossRef]
  45. Ma, C.; Zhu, C.; Zhou, J.; Ren, J.; Yu, Q. Dynamic response and failure characteristics of combined rocks under confining pressure. Sci. Rep. 2022, 12, 17. [Google Scholar] [CrossRef] [PubMed]
  46. Sygala, A.; Bukowska, M. Identification of temperature effect on post-critical geomechanical properties of loaded sandstones. Arab. J. Geosci. 2019, 12, 10. [Google Scholar] [CrossRef]
  47. Pinetown, K.L.; Ward, C.R.; van der Westhuizen, W.A. Quantitative evaluation of minerals in coal deposits in the Witbank and Highveld Coalfields, and the potential impact on acid mine drainage. Int. J. Coal Geol. 2007, 70, 166–183. [Google Scholar] [CrossRef]
  48. Jiang, B.; Ye, W.; Zhao, Y. Nanopore structure and fractal characteristics of sandstone after high-temperature action. Environ. Earth Sci. 2024, 83, 19. [Google Scholar] [CrossRef]
  49. Yu, H.; Li, M.; Pu, H.; Zhang, L.; Chen, Y.; Shi, X.; Yue, Z. Direct tensile mechanical properties and damage fracture mechanisms of thermally damaged coal measures sandstone under high strain rate loading. J. Mater. Res. Technol.-JMRT 2023, 26, 6356–6374. [Google Scholar] [CrossRef]
  50. Li, M.; Mao, X.; Cao, L.; Pu, H.; Mao, R.; Lu, A. Effects of Thermal Treatment on the Dynamic Mechanical Properties of Coal Measures Sandstone. Rock Mech. Rock Eng. 2016, 49, 3525–3539. [Google Scholar] [CrossRef]
  51. Yin, T.; Wang, P.; Yang, J.; Li, X. Mechanical Behaviors and Damage Constitutive Model of Thermally Treated Sandstone Under Impact Loading. IEEE Access 2018, 6, 72047–72062. [Google Scholar] [CrossRef]
Figure 2. Sample preparation methodology (a) Map of China; (b) Location of specimen sampling; (c) Coal mine sampling; (d) Standard specimen preparation; (e) Completed standard specimen preparation.
Fractalfract 09 00381 g002
Figure 3. Static test curves.
Fractalfract 09 00381 g003
Figure 4. The SHPB system with real-time high temperature.
Fractalfract 09 00381 g004
Figure 5. Experimental waveforms at various temperatures (T).
Fractalfract 09 00381 g005
Figure 6. Dynamic stress–strain curves of coal-bearing sandstone at various temperatures (T).
Fractalfract 09 00381 g006
Figure 7. Curve showing the variation of dynamic elastic modulus (Ed) with temperature (T).
Fractalfract 09 00381 g007
Figure 8. Variation curve of dynamic compressive strength σd with temperature T.
Fractalfract 09 00381 g008
Figure 9. Curve showing the variation of dynamic peak strain ( ε d ) with temperature (T).
Fractalfract 09 00381 g009
Figure 10. Failure characteristics at different temperatures at a strain rate ( ε ˙ ) of 211.64 s−1.
Fractalfract 09 00381 g010aFractalfract 09 00381 g010b
Figure 11. Curve showing the variation of fractal dimension (Ds) with temperature (T).
Fractalfract 09 00381 g011
Figure 12. Micromorphology characteristics of coal measure sandstone under 25 °C.
Fractalfract 09 00381 g012
Figure 13. Micromorphology characteristics of coal measure sandstone after at 400 °C.
Fractalfract 09 00381 g013
Figure 14. Micromorphology characteristics of coal measure sandstone at 800 °C.
Fractalfract 09 00381 g014
Figure 15. Energy change curve of specimen.
Fractalfract 09 00381 g015
Figure 16. Curve showing the variation of energy dissipation density (wFD) with temperature (T).
Fractalfract 09 00381 g016
Figure 17. Curve showing the variation of energy consumption rate (λI) with temperature (T).
Fractalfract 09 00381 g017
Figure 18. Surface contour plot of the variation of dynamic elastic modulus (Ed) with strain rate ( ε ˙ ) and temperature (T).
Fractalfract 09 00381 g018
Figure 19. Surface contour plot of the variation of dynamic compressive strength (σd) with strain rate ( ε ˙ ) and temperature (T).
Fractalfract 09 00381 g019
Figure 20. Surface contour plot of the variation of dynamic peak strain (εd) with strain rate and temperature (T).
Fractalfract 09 00381 g020
Figure 21. Surface contour plot of the variation of fractal dimension (Ds) with strain rate ( ε ˙ ) and temperature (T).
Fractalfract 09 00381 g021
Figure 22. Surface contour plot of energy dissipation density (wFD) as a function of strain rate ( ε ˙ ) and temperature (T).
Fractalfract 09 00381 g022
Figure 23. Surface contour plot of energy consumption rate (λI) as a function of strain rate ( ε ˙ ) and temperature (T).
Fractalfract 09 00381 g023
Table 1. The variation of bullet velocity and strain rate with temperature.
NumberP/MPaT/°C V ¯ / m s 1 ε ˙ ¯ /s−1Arithmetic Mean
W-1-10.30255.4150.4560.12
W-1-21005.6051.72
W-1-32005.5058.65
W-1-43005.4661.69
W-1-54005.8761.90
W-1-65005.3862.12
W-1-76005.8564.53
W-1-88005.7369.90
W-6-10.802510.65210.87211.64
W-6-210010.56210.9
W-6-320010.51211.39
W-6-430010.55211.85
W-6-540010.72212.02
W-6-650010.55212.09
W-6-760010.66213.00
W-6-880010.60213.20
Table 2. Variation of fractal dimension (Ds) with temperature (T).
ε ˙ (s−1)T (°C) M ¯ R / M ¯ d ¯ D s
R = 6R = 8.5R = 11R = 13R = 15
60.12250.130.160.180.200.280.602.40
1000.410.510.600.690.730.642.36
2000.260.370.430.480.540.772.23
3000.120.170.190.210.290.842.16
4000.210.280.330.440.520.962.04
5000.230.270.360.410.480.842.16
6000.240.280.350.380.430.662.34
8000.330.400.510.520.650.562.44
211.64250.610.660.710.770.790.302.70
1000.540.590.650.710.740.352.65
2000.270.300.350.400.440.402.60
3000.540.590.650.760.790.452.55
4000.510.560.620.680.710.482.52
5000.530.580.680.740.770.442.56
6000.730.790.890.900.940.292.71
8000.840.940.940.960.960.142.86
Table 3. Variation of dynamic elastic modulus (Ed) with strain rate and temperature (T).
ε ˙ Ed/GPa
25 °C100 °C200 °C300 °C400 °C500 °C600 °C800 °C
60.1225.5121.0517.2315.1313.4510.879.256.52
81.5226.8722.1818.3516.7314.9911.7210.177.29
112.6028.2624.5819.9517.4716.5812.4511.017.63
153.2230.2426.6020.2419.1517.1513.4612.098.48
187.8531.9227.1321.2119.3817.8614.2812.798.80
211.6433.3828.4923.5621.8418.0416.1613.129.80
Table 4. Variation of dynamic compressive strength (σd) with strain rate ( ε ˙ ) and temperature (T).
ε ˙
σ d / MPa
25 °C100 °C200 °C300 °C400 °C500 °C600 °C800 °C
60.1263.2265.5580.2985.2992.7096.580.1860.31
81.5267.5866.7287.0992.9199.97100.0585.3464.23
112.6074.1674.8293.2197.33108.22112.5498.2370.79
153.2282.0381.1299.55105.53115.71118.49104.7078.45
187.8588.8891.57105.16112.84118.45123.57108.0883.94
211.6492.3997.15112.61118.69124.66126.88112.4590.56
Table 5. Variation of dynamic peak strain (εd) with strain rate and temperature (T).
ε ˙ ε d ( 10 3 )
25 °C100 °C200 °C300 °C400 °C500 °C600 °C800 °C
60.125.1457.1588.6489.24810.40310.91311.22214.945
81.525.3017.5129.2179.61710.55011.24412.52015.708
112.605.8228.9329.56710.36710.97611.89012.75016.366
153.227.1279.78310.22310.69911.40012.39813.31117.580
187.857.3089.84010.88911.25811.64412.81514.65118.919
211.647.51210.65011.16011.72912.54513.45615.56519.456
Table 6. Variation of fractal dimension (Ds) with strain rate ( ε ˙ ) and temperature (T).
ε ˙
Ds
25 °C100 °C200 °C300 °C400 °C500 °C600 °C800 °C
60.122.402.362.232.162.042.162.342.44
81.522.442.412.332.182.102.252.382.47
112.602.482.452.392.272.242.372.492.67
153.222.642.572.472.362.352.442.562.76
187.852.702.592.522.502.482.522.632.81
211.642.702.652.602.552.522.562.712.86
Table 7. Variation of energy dissipation density (wFD) with strain rate ( ε ˙ ) and temperature (T).
ε ˙ w FD / J cm 3
25 °C100 °C200 °C300 °C400 °C500 °C600 °C800 °C
60.120.2030.1780.1250.1150.0720.1330.1400.264
81.520.5250.4790.3550.2340.2130.2670.4380.699
112.600.7370.7160.6850.4540.3480.4790.6920.989
153.220.8510.8250.8380.7460.5510.6160.831.143
187.851.0761.010.9620.8710.7490.7920.9221.390
211.641.1371.1071.0070.9530.7960.8440.9511.575
Table 8. Variation of energy consumption rate (λI) with strain rate ( ε ˙ ) and temperature (T).
ε ˙ λI
25 °C100 °C200 °C300 °C400 °C500 °C600 °C800 °C
60.1239.2638.5637.1235.4631.7228.4324.7621.74
81.5238.7037.4735.7134.0231.0527.2522.8920.24
112.6036.0435.2634.1532.1529.5026.3822.1618.23
153.2234.2733.0431.5229.8725.4624.4120.7616.87
187.8530.8529.2728.4326.1623.7921.5119.6311.89
211.6427.4526.7925.9024.4621.5918.8115.1510.91
Disclaimer/Publisher’s Note: The statements, opinions and data contained in all publications are solely those of the individual author(s) and contributor(s) and not of MDPI and/or the editor(s). MDPI and/or the editor(s) disclaim responsibility for any injury to people or property resulting from any ideas, methods, instructions or products referred to in the content.