Article

Multifractal Analysis of Tight Sandstone Using Micro-CT Methods: A Case from the Lower Cretaceous Quantou Formation, Southern Songliao Basin, NE China

1
State Key Laboratory of Continental Shale Oil, Northeast Petroleum University, Daqing 163318, China
2
Research Institute of Exploration and Development, PetroChina Jilin Oilfield Company, Jilin 138000, China
3
College of Geosciences, China University of Petroleum-Beijing, Beijing 102249, China
4
Key Laboratory of Oil & Gas Reservoir and Underground Gas Storage Integrity Evaluation of Heilongjiang Province, Daqing 163318, China
*
Authors to whom correspondence should be addressed.
Fractal Fract. 2025, 9(6), 336; https://doi.org/10.3390/fractalfract9060336
Submission received: 26 March 2025 / Revised: 19 May 2025 / Accepted: 20 May 2025 / Published: 23 May 2025

Abstract

The relationships between the pore structure and a single fractal or specific region have been widely reported. However, the intrinsic relationship between multifractal parameters and physical properties have remained uncertain. In this study, micro-computed tomography scanning technology and high-pressure mercury injection technologies were applied to determine the pore structures of tight sandstone at different scales. Subsequently, the multifractal theory was applied to quantitatively evaluate the multiscale pore structure heterogeneity. An evident linear relationship exists between l o g X q , ε and log ( ε ) , indicating the pore structure of tight sandstones exhibits significant multifractal characteristics. Multifractal parameters, including α ,   D ,   D m i n D 0 , a n d   D 0 D m a x , can serve as sensitive indicators to assess the multiscale pore structure heterogeneity. In particular, the relative development degree of large-scale pores (>10 μm) can be reflected by D m i n D 0   , which has strong heterogeneity. The heterogeneity of the multiscale structure is closely linked to the mineral components of tight sandstone reservoirs, and the heterogeneity of small-scale pores (1–10 μm) is stronger by clay mineral enrichment. Furthermore, the part of the pore structure corresponding to the combination of pore size range of 10 to 20 μm and throat size range of 20 to 40 μm in a low probability measure area may dominate the permeability of tight sandstone. The findings enhance the understanding of pore structure heterogeneity and broaden the application of multifractal theory.

1. Introduction

A scientific framework for quantitatively characterizing the heterogeneous distribution of pore sizes has been provided by fractal geometry theory [1]. Since then, numerous studies have shown that fractal theory effectively explains the irregular, unstable, and complex nature of pore structures in reservoir rocks [2,3,4,5]. Single-fractal theory is inadequate for fully characterizing the heterogeneity of pore systems across all scales [6,7]. Therefore, multifractal theory is required to capture the irregularities and multiscale distribution of pore sizes.
The storage and percolation capacities of tight sandstone reservoirs have always been a popular topic in petrophysical studies, which are of great significance to hydrocarbon exploration and development. As indicated by existing studies, the storage and percolation capacities are closely related to the pore structure characteristics [8,9]. Therefore, pore structure characterizations are required to obtain an understanding of the storage and percolation capacities of sandstone reservoirs. The pore geometrical shape, type, and size distribution determine the petrophysical properties as well as the percolation and accumulation of hydrocarbon in sandstone reservoirs. To date, over 30 parameters have been proposed to be able to affect pore structure, including commonly used ones such as porosity and permeability [6,10,11]. These parameters primarily evaluate the pore structure via a macroscopic perspective, given the essential role of micro-pore structure evaluation in oil and gas exploration and migration [8,12]. Therefore, advanced analytical techniques have been introduced to accurately assess multiscale pore structure [12,13]. Three techniques have been commonly applied to assess micro-pore structure: (1) imaging methods (including scanning electron microscopy [SEM] and X-ray computed tomography [X-ray CT]), (2) fluid invasion methods (including high-pressure mercury injection [HPMI], low-pressure gas [N2, CO2] physisorption, and nuclear magnetic resonance [NMR]), and (3) radiation detection methods [13,14]. However, these methods are difficult in detecting isolated pores in tight sandstones and lack micro-pore structure visualization, which can potentially compromise the results [11].
X-ray CT technology stands out as one of the few non-destructive methods capable of providing three-dimensional (3D) high-resolution insights into the internal structure of tight sandstones [15,16,17]. The high-flux and high-brightness synchrotron radiation of micro-CT enables 4D dynamic observations of pore structure in tight sandstones and rapid acquisition, which make micro-CT the appropriate choice to spatially characterize the petrophysical parameters of tight sandstones [17,18]. The application of micro-CT is restricted due to its resolution limitation, leading to an underestimation of pore sizes less than 1 μm. Additionally, it is constrained by noise and high expense [19]. As indicated above, the extremely wide pore size distribution of tight sandstone reservoirs cannot be solely determined by any single method. The comprehensive pore structure characterizations of tight sandstone reservoirs, including the pore size distribution, pore geometry, and connectivity, relies on the integration of multiple experimental methods.
In this study, micro-computed tomography scanning technology and high-pressure mercury injection (HPMI) technologies were applied to determine the pore structures of tight sandstone at different scales. Subsequently, the multifractal theory was applied to quantitatively evaluate the multiscale pore structure heterogeneity. This study aims to (1) examine the multifractal characteristics across multiscale pore structure and (2) explore the relationship between multifractal parameters and physical property. The findings provide a better understanding of pore structure heterogeneous and broaden the application of multifractal theory.

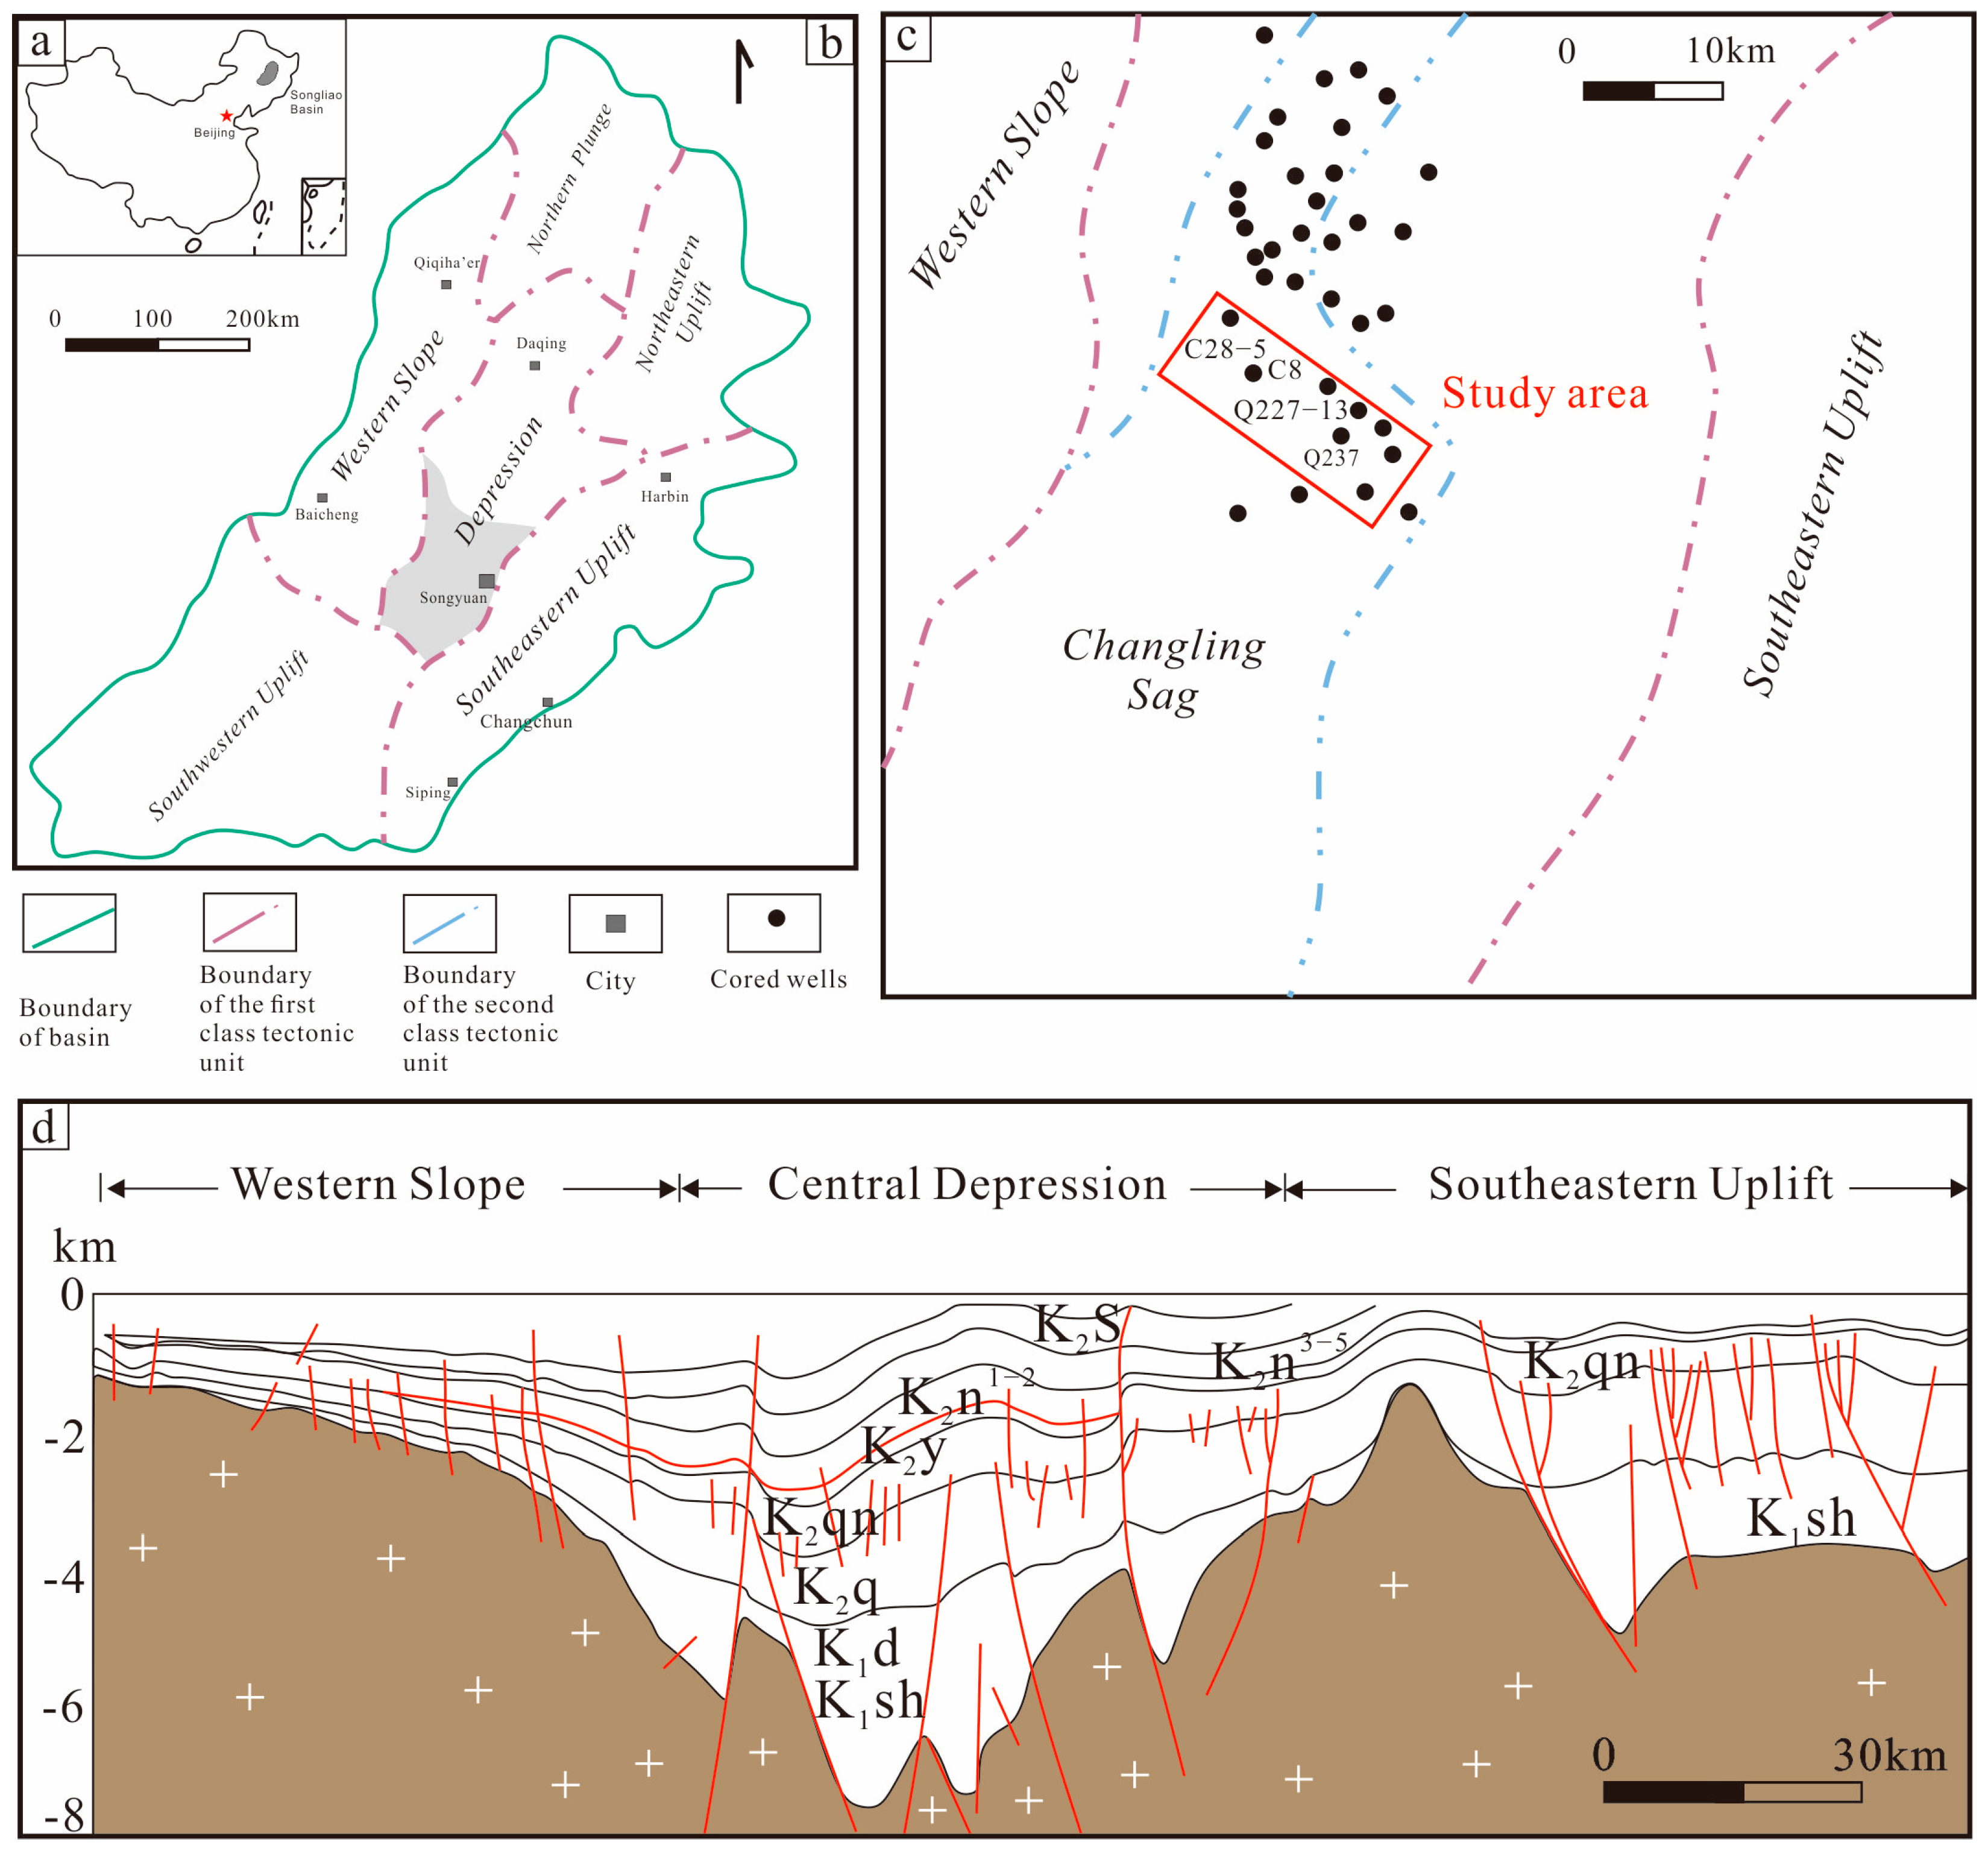
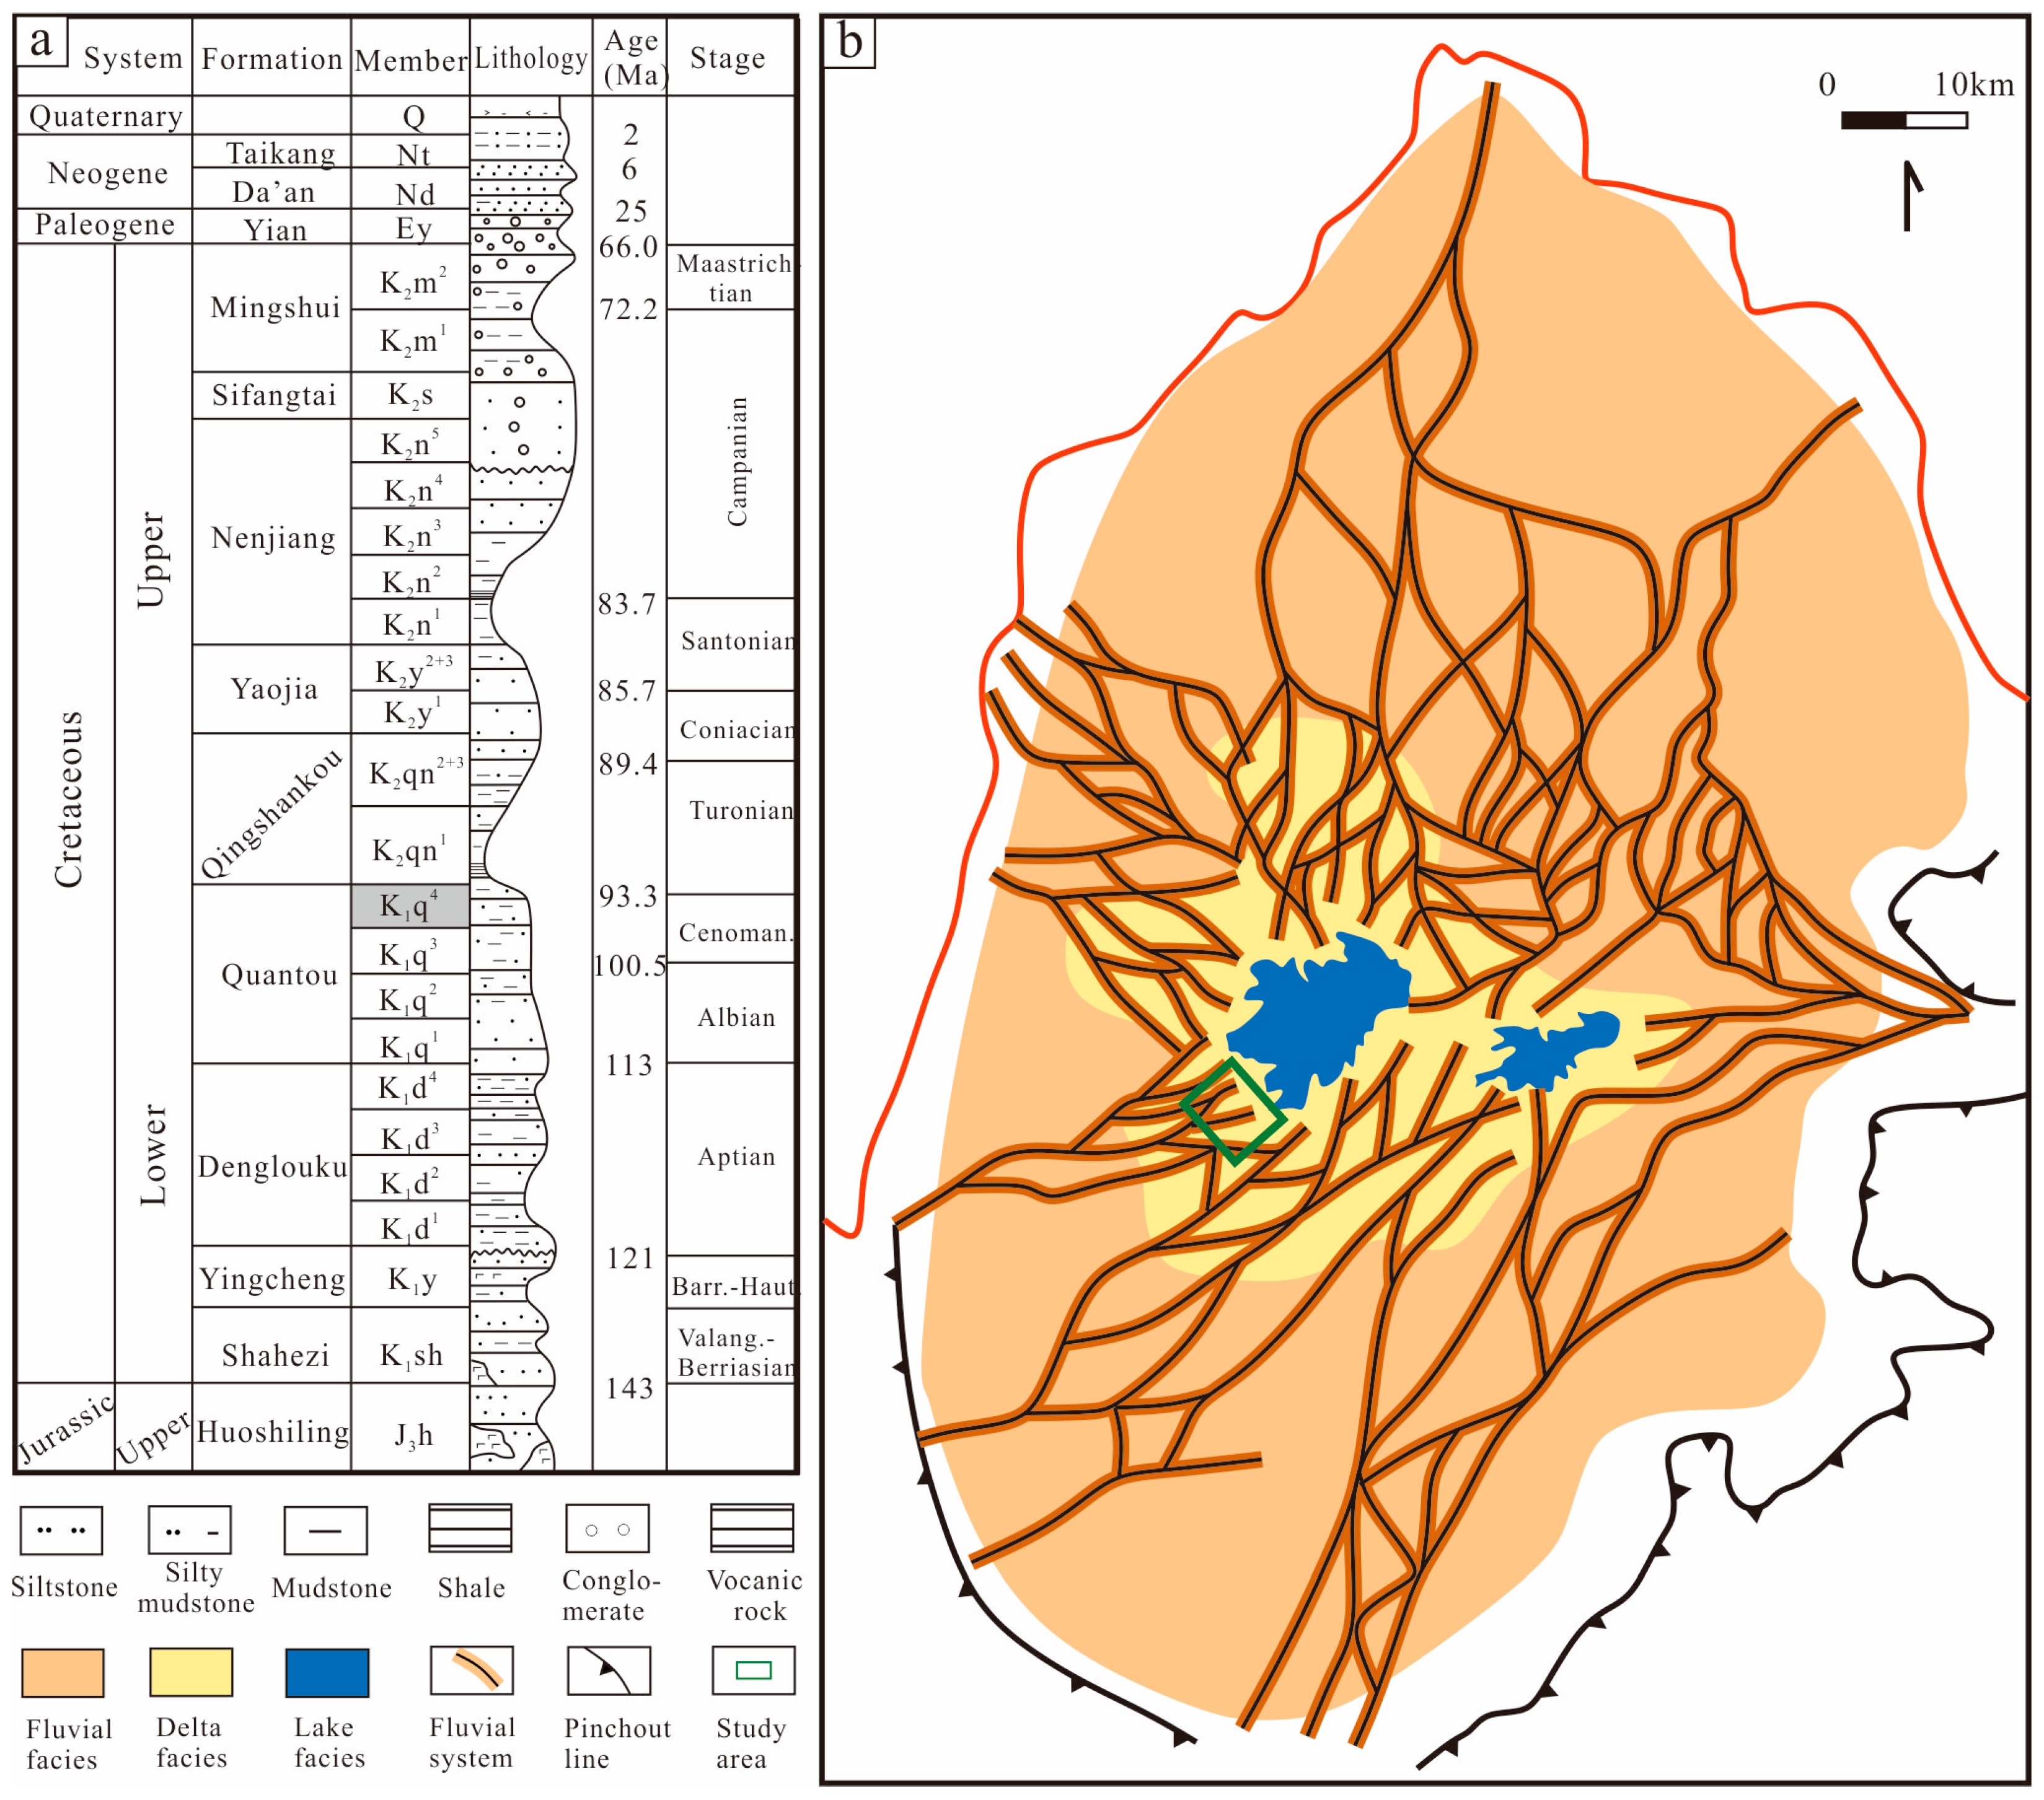
2. Geological Setting

The Songliao Basin is the largest Mesozoic–Cenozoic continental oil and gas basin in Northeast China (Figure 1a), extending in a north–northeastern orientation and covering an area of approximately 26 × 104 km2 [20,21]. It is a large composite sedimentary basin characterized by tectonic complexity. The Songliao Basin can be subdivided into seven first class tectonic zones (Figure 1b). The study area, as one of the most oil rich areas, belongs to the Central Depression Zone (Figure 1c). The Central Depression Zone basement is comprised of late Paleozoic to early Mesozoic metamorphic rocks and contemporaneous igneous rocks. The basin hosts primarily Cretaceous strata, reaching a maximum thickness of 7000 m [22] (Figure 1d).
The sandstones in the fourth member of the Quantou Formation (K1q4), commonly known as the Fuyu Sandstone, constitute one of the primary oil-bearing layers in the southern Songliao Basin. The upper section of K1q4 consists of interbedded gray-black mudstone, gray-brown siltstone, and argillaceous siltstone of varying thicknesses, while the lower section is predominantly composed of purplish-red mudstone interbedded with grayish-white siltstone (Figure 2a). Deposited during the sag phase, these strata range in thickness from 70 m to 100 m, centered around a unified subsidence area. The reservoirs within the Quantou Formation are primarily of fine sandstone and siltstone, developed in shallow-water deltaic distributary channel deposits (Figure 2b) [24].

3. The Experimental Work and Multifractal Theory

3.1. Sample Preparation and Experiments

The tight sandstone samples were collected from the Yuzi Well and Gudian areas of the Changling Sag, southern Songliao Basin (Figure 1c). In general, the tight sandstone reservoirs of the K1q4 are highly tight, with low porosity (ranging from 2 to 14%, average 8.54%) and permeability (ranging from 0.01 to 5 × 10⁻³ μm2, average 0.493 × 10⁻³ μm2) [24]. The basic information of representative tight sandstone samples is summarized in Table 1. For this experiment, X-ray diffraction (XRD), thin section, SEM, HPMI, and micro-CT methods were used to obtain the mineral composition, the pore-throat type, as well as the micro-pore structure, pore size distributions, and pore-throat network of tight sandstone samples, respectively.

3.1.1. XRD

The samples were first ground using an agate mortar and subsequently sieved to obtain powder with a particle size finer than 200 mesh. Approximately 2 to 3 g of each sample were used for the analysis. XRD analysis was performed using a Bruker D8 Advance AA25 diffractometer. Cu Kα radiation (λ = 1.5406 Å) was employed, with the X-ray tube operated at 40 kV and 40 mA. Data were collected over a 2θ range of 5° to 70°, with a step size of 0.02° and a counting time of 0.5 s per step. Phase identification was carried out using the PDF-4+ database provided by the International Centre for Diffraction Data [27]. Phase identification was performed using the PDF-4+ database, and quantitative mineral contents were calculated using the Rietveld refinement method implemented in TOPAS v5.0 [28], which is widely accepted for clay-bearing and heterogeneous sedimentary rocks [29].

3.1.2. Thin Sections and SEM

Thin sections enable a direct observation of pore-throat type, size, and number in tight sandstones [30,31]. In order to visually observe the pore-throat type, the samples of tight sandstone were impregnated with blue resin under high pressure [20]. SEM analysis was performed on a Nova Nano SEM 450 field emission scanning electron microscope. Prior to imaging, the samples were sputter-coated with a thin layer of gold to enhance electrical conductivity and prevent charging under the electron beam. Observations were conducted under high vacuum conditions. For each representative sample, 3 to 5 regions were randomly selected, and a total of 15 high-resolution images were acquired to document microstructural and pore characteristics.

3.1.3. HPMI

Before testing, the tight sandstone samples were dried at 105 °C until a constant weight was reached. Each cylindrical core plug was then sealed in a closed dilatometer and evacuated to remove any residual air or moisture. HPMI experiments were carried out using the CMS-300 mercury intrusion instrument manufactured by Temco (Houston, TX, USA) and the AutoPore IV 9505 instrument manufactured by Micromeritics Instrument Corporation (Norcross, GA, USA). A stepwise pressure increase method was adopted during the mercury injection process to ensure that pressure equilibrium was achieved at each increment. This approach helps to minimize potential hysteresis effects and enhances the accuracy of the pore size distribution. The maximum injection pressure applied was 200 MPa, allowing access to a wide range of pore throat sizes. The mercury injection rate was controlled at 0.1 mL/min, and each pressure step was held for approximately 30 s to allow for pore saturation before proceeding to the next level. For each of the six samples (S1 to S6), one representative measurement was performed on an individual core plug [32].

3.1.4. Micro-CT

For this experiment, tight sandstone samples were processed to a diameter of 2.5 cm and a length of 3.0 cm. Micro-CT scanning was conducted using the GE Phoenix Nanotom S digital nano X-ray system, manufactured by General Electric, Wunstorf, Germany. The scanning was performed at a voltage of 110 kV, a current of 100 μA, and a resolution of 1.29 μm. Image processing is performed by subjecting micro-CT data to a series of algorithms to accurately characterize tight sandstone samples [14]. In addition, image processing uses background equalization, noise reduction, and pore boundary sharpening to improve image resolution (Figure 3). The reconstruction of pore volume and the segmentation of pore space were accomplished through 3D visualization using Volume Graphics Studio Max (version 3.4) and Avizo 8.0 imaging software.
The pore network model is a simplified representation that visualizes the intricate pore space within porous media [33]. In this study, the tight sandstone pore network model was extracted using the central axis method (Figure 4). The fundamental concept of the pore network model involves dividing the complex pore space of porous media into multiple units, where the narrow and elongated pore spaces are defined as throats, and the connections between these throats are designated as equivalent pores, commonly represented by “spheres” and “sticks” [14,33]. The “spheres” are viewed as pores. At the same time, “sticks” are considered throats by quantitatively measuring and statistically analyzing the “spheres”, which involves conducting statistical analysis of the pore size distribution characteristics in the samples. While this approach provides a manageable and intuitive framework for visualizing pore connectivity, it inevitably simplifies the geometrical and physicochemical complexity of the actual pore structure. Such simplification may limit the accuracy of fluid flow predictions in highly heterogeneous or anisotropic systems. Nevertheless, for the purpose of comparative analysis and statistical characterization, this level of abstraction is generally considered sufficient and widely accepted in reservoir-scale studies [34,35].

3.2. Multifractal Theory

This study employed the box-counting method, using cubic boxes with side length ε pixels to cover the reconstructed 3D image, forming a regular and orderly grid. The formation of the grid adopted a binary scale method [1,36,37]. The ε varies with along 2 k ( k = 0 , 1 , 2 , 3 , ), and the count of boxes for multiscale pore size distributions at a specified minor scale is denoted as N ( ε ) , thus:
N ε D
where D is the fractal dimension; it can be considered that the studied object has fractal characteristics.
The proportion of pore in each box presented as p i ( ε ) .
p i ε = M i   ε M
where M i   ( ε ) is the pore volume in the i t h box. M is the total pore volume.
The weighted sum of the q -order moments of the proportion of pore in each box is obtained to yield the distribution. The formula X ( q , ε ) is as follows:
X q , ε = i = 1 N ε p i q
There is a relationship between the partition function X ( q , ε ) and ε :
N q , ε ~ ε τ q
The quality index τ ( q ) can be obtained by the ratio of l o g X ( q , ε ) and log ( ε ) , the quality index τ ( q ) is related to the generalized dimensions D ( q ) : τ ( q ) = ( 1 q ) D ( q ) , D ( q ) can be calculated as:
D q = lim ε 0 1 1 q i = 1 N ε p i q log ε
where q is the probability density weight index, which is an integer ranging from to + . In the case of q = 1 , D 1 can be calculated as [38]:
D 1 = lim ε 0 log i = 1 N ε p i log p i log ε  
In multifractals, P i ε and ε exist:
P i ε = ε α i
where α i   is the singularity index, which represents the pore size distributions in the i t h box.
The count of boxes for multiscale pore size distribution with a specified minor scale is counted as N ε ( α ) , thus:
N ε α ε f α
where f α represents the singularity spectrum, reflecting the fractal dimension of subintervals with identical singularity strength [16].
The f α function can be obtained through Legendre transformation [39]:
α q = d τ q d q
f α = q α q τ q
Generally, the multifractal parameters is often used to calculate the quality index τ ( q ) , singularity spectra f α , generalized dimensions D ( q ) [16,38].

4. Results

4.1. Mineralogical Compositions

The XRD data reveals that quartz, feldspar, carbonate, and clay minerals predominantly comprise tight sandstone samples in the K1q4 (Table 2). Quartz is the predominant original component, ranging from 26.2% to 36.2% (mean: 32.27%). Feldspar content varies between 6.7% and 32.8% (mean: 18.97%). Carbonate content ranges from 9.5% to 17.7% (mean: 12.65%), encompassing calcite, ankerite, and dolomite.

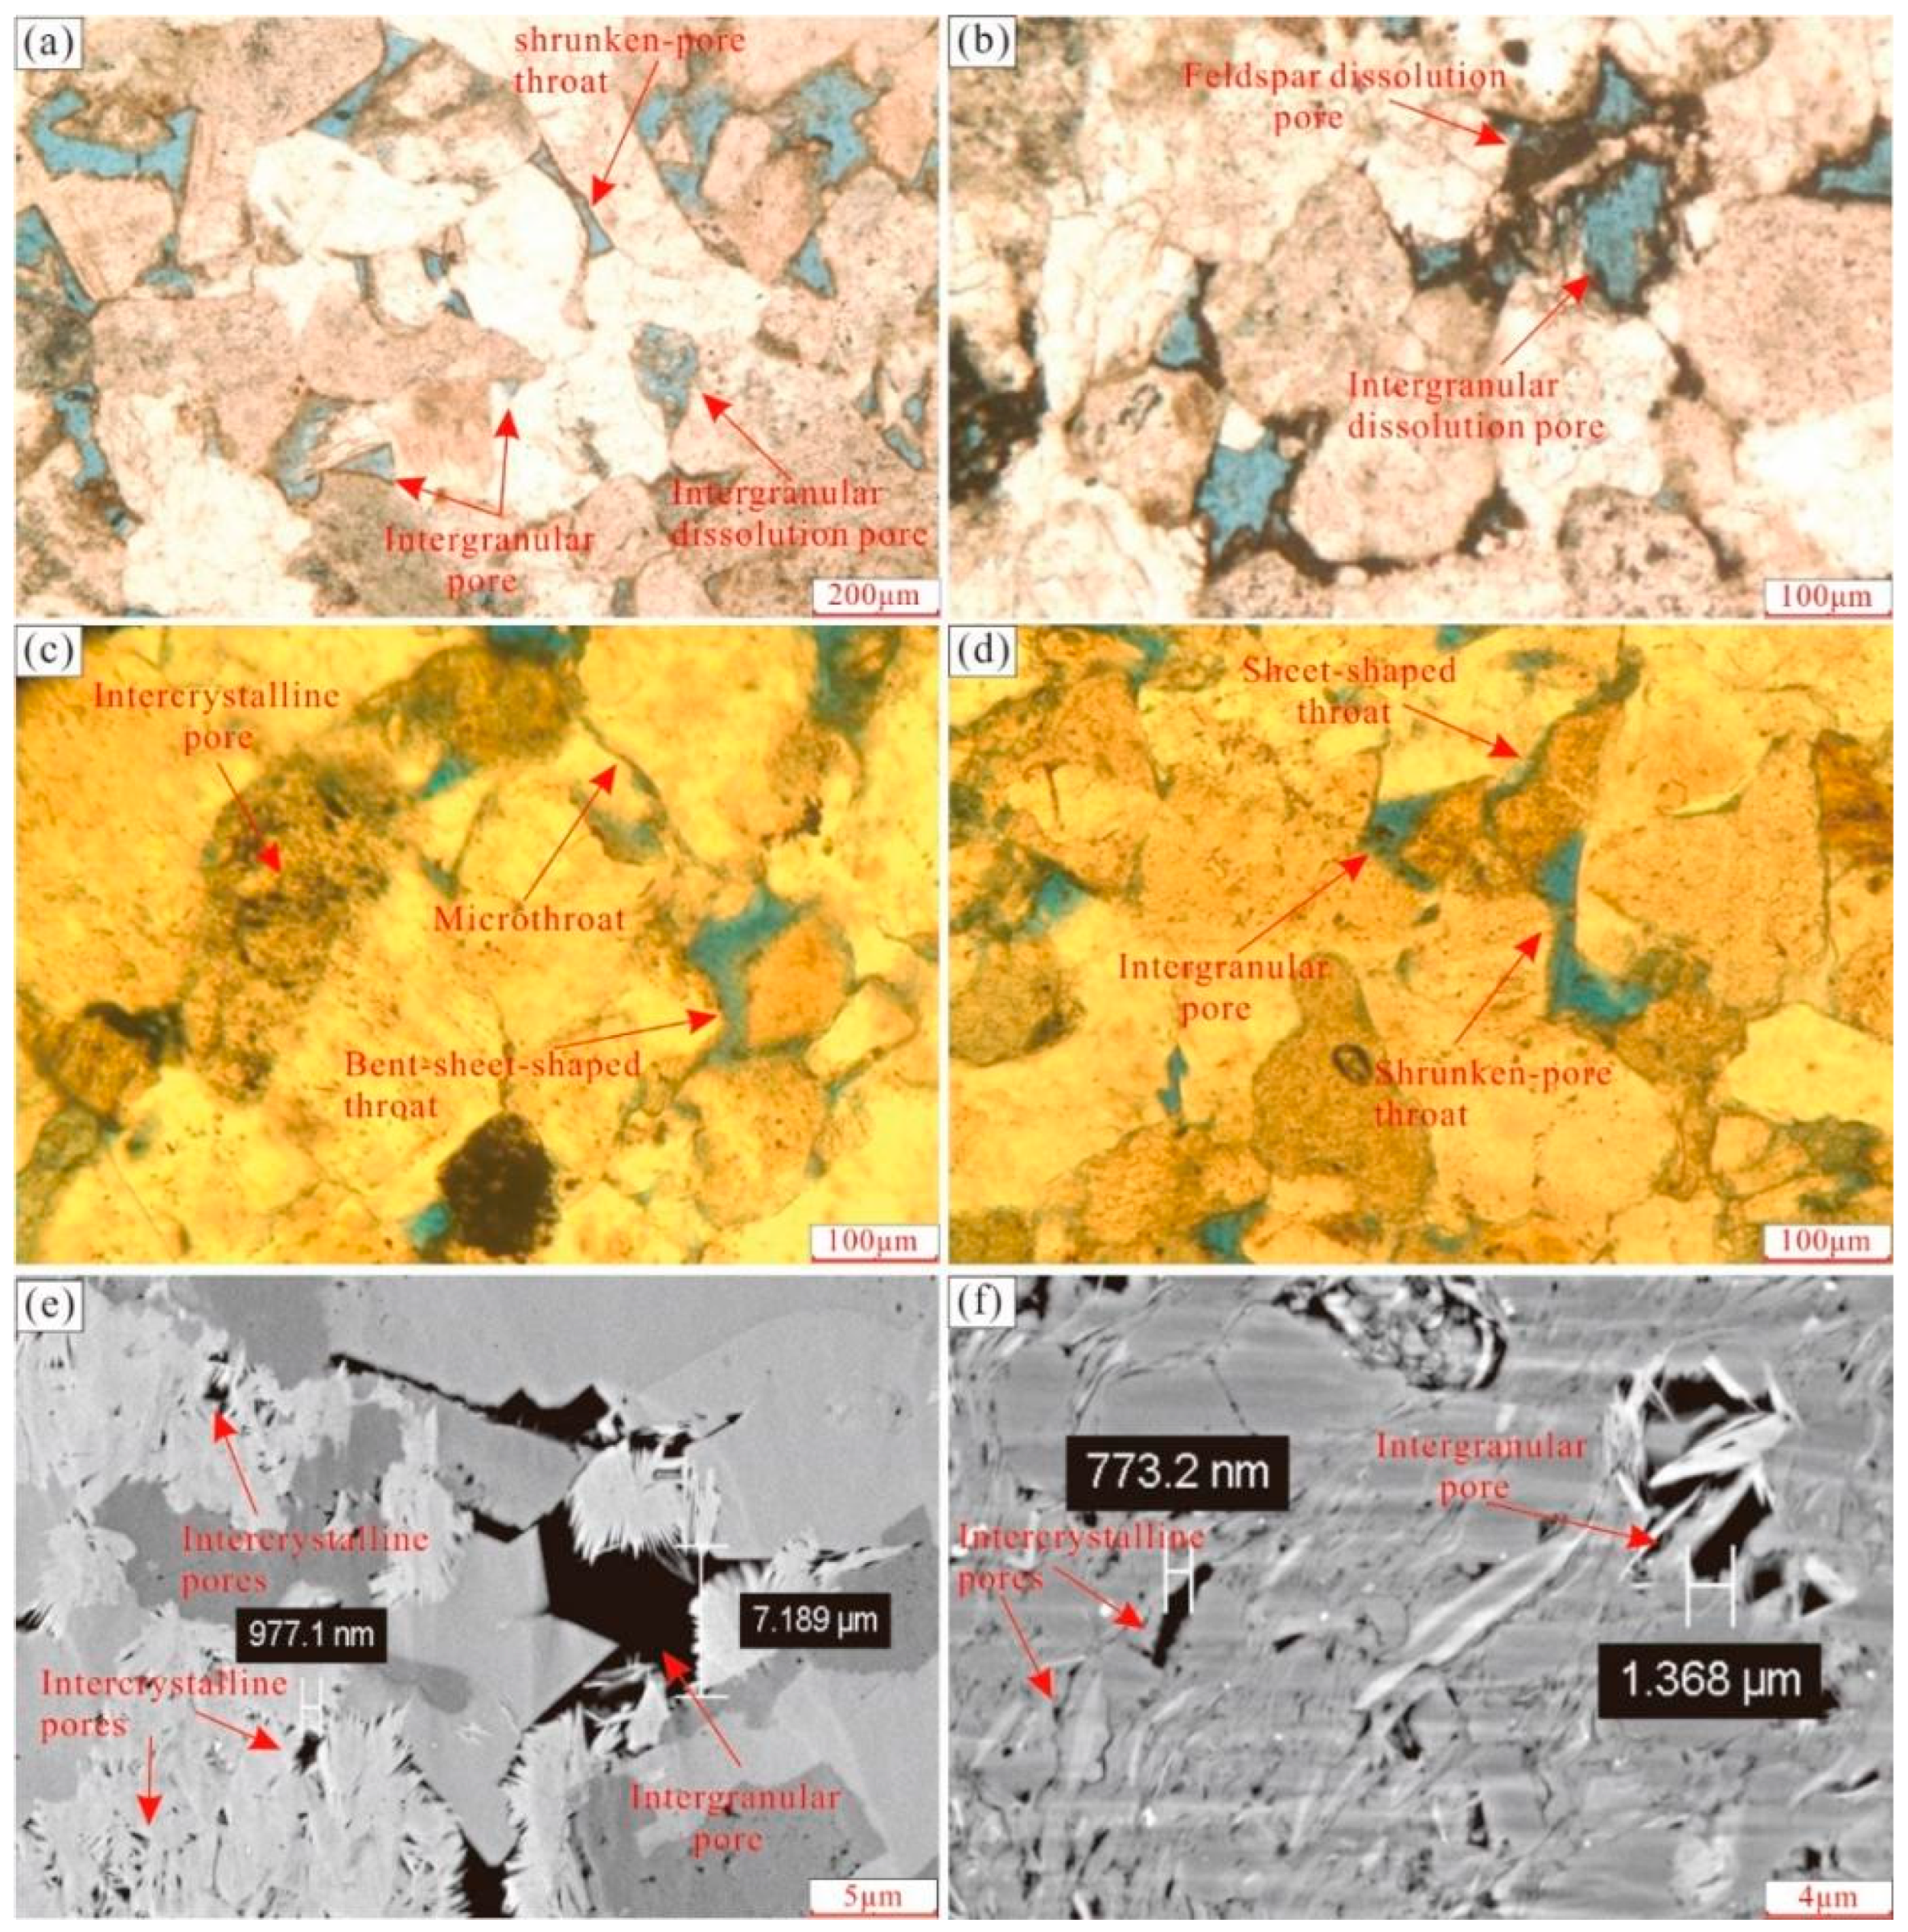
4.2. Pore Morphology

Thin section and SEM images reveal three types of pores: primary intergranular pore, dissolution pore, and intercrystalline pore (Figure 5). The primary intergranular pore were left from the deposition period (Figure 5a). Quantitative analysis of SEM images reveals that intergranular pores account for approximately 10–20% of total visible pore types, with typical sizes ranging from 5 to 15 μm. The dissolution pore formed during the middle diagenetic stage, including feldspar dissolution (Figure 5b) pore and intergranular dissolution pore (Figure 5c). Feldspar dissolution pores, formed through intense rock–water reactions, are primarily located within feldspar grains. The dissolution pore is widely developed and has good pore connectivity (Figure 5b). Dissolution pores are more abundant, comprising 30–40%, with sizes ranging from 2 to 20 μm, depending on the extent of feldspar alteration. Intercrystalline pores in clay minerals are the dominant type of pore (Figure 5e). Intercrystalline pores, primarily associated with clay minerals, make up 40–60% of total pore observations but are significantly smaller, typically less than 1 μm in diameter (Figure 5f). Additionally, various throat types, including shrunken-pore throat (Figure 5d), bent-sheet-shaped throat (Figure 5c), micro-throat (Figure 5c), and sheet-shaped throat (Figure 5d), are observed in thin sections.

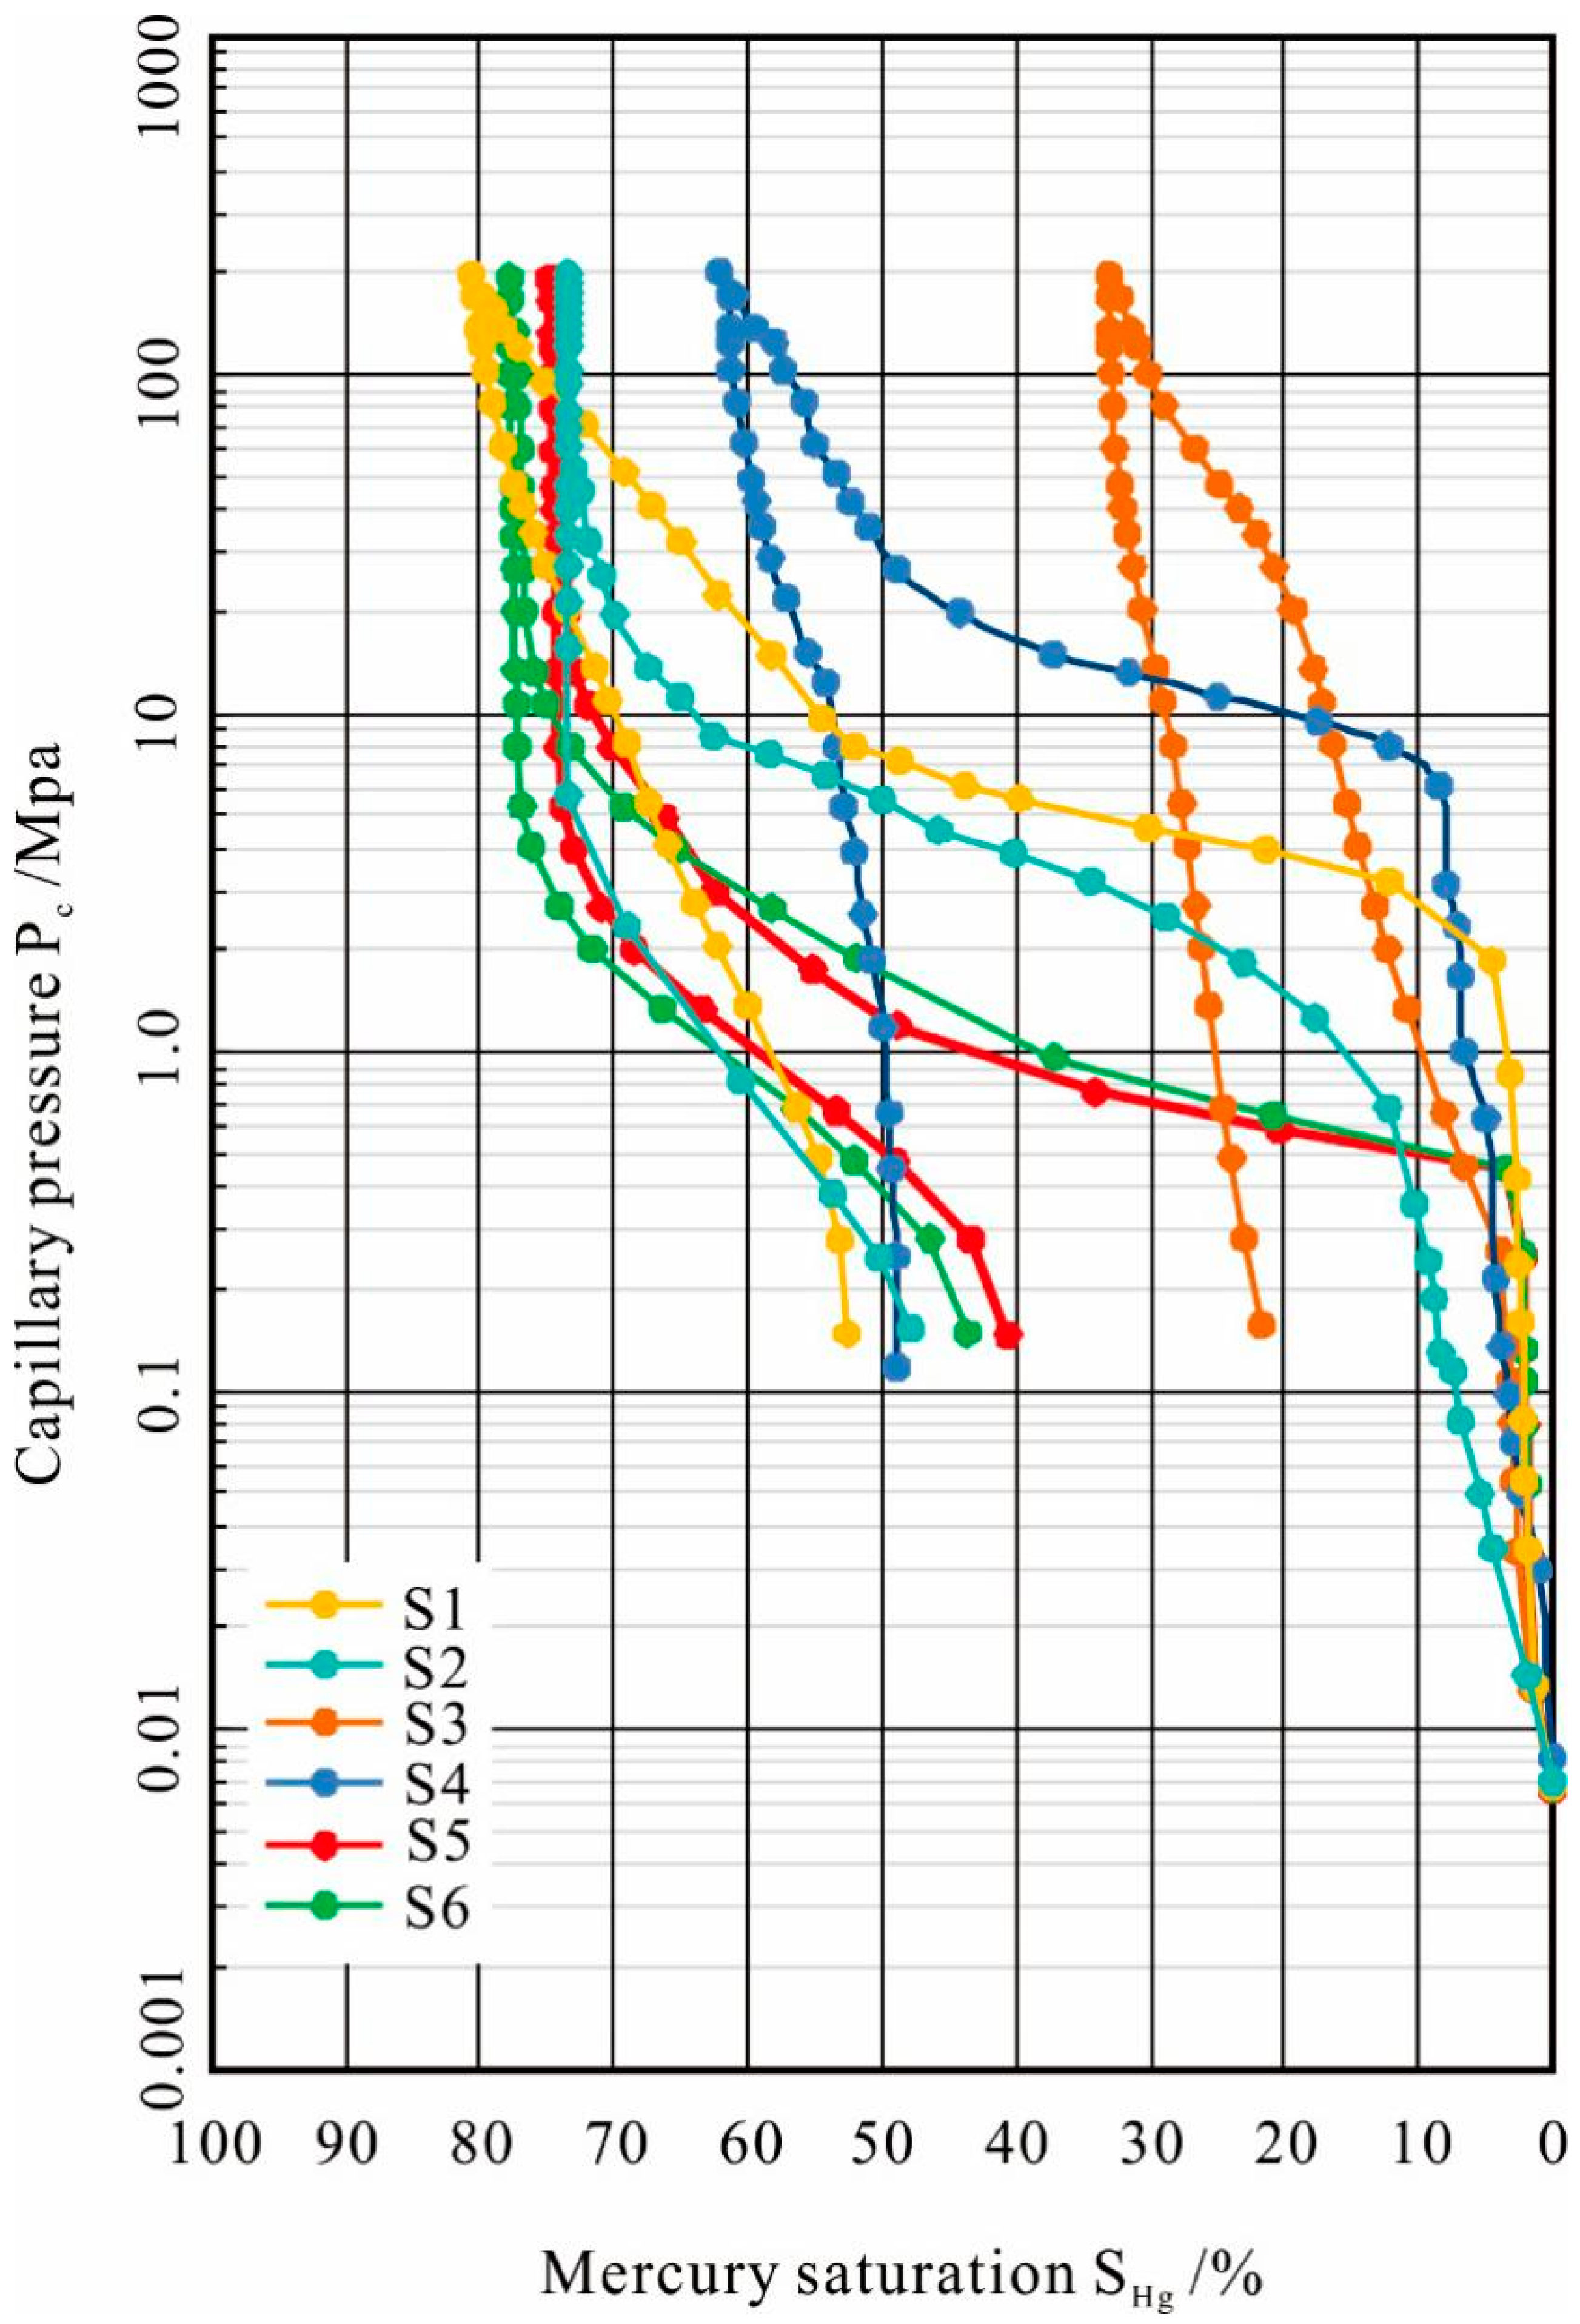
4.3. Mercury Intrusion Curves

The mercury intrusion curves in HPMI experiments can reflect pore-throat connectivity and distribution characteristics. The physical properties of the tight sandstone reservoirs in the K1q4 vary greatly, with displacement pressure distributed between 0.250 and 4.076 MPa. The maximum mercury saturation mainly ranges from 33.139% to 96.355%, with a large variation in curve parameters and overall low mercury withdrawal efficiency (Figure 6), indicating strong heterogeneity in the tight sandstone reservoirs. For samples 5 and 6, the platform period is obvious, with coarse skewness, indicating good pore-throat connectivity and sorting. Samples 3, 4, and 2 show no platform period, indicating poor pore-throat connectivity and sorting. Sample 1 exhibits secondary mercury intrusion when the pressure increases to a certain value, suggesting a complex pore structure where mercury may enter large pores through small throats (similar to an ink-bottle effect).

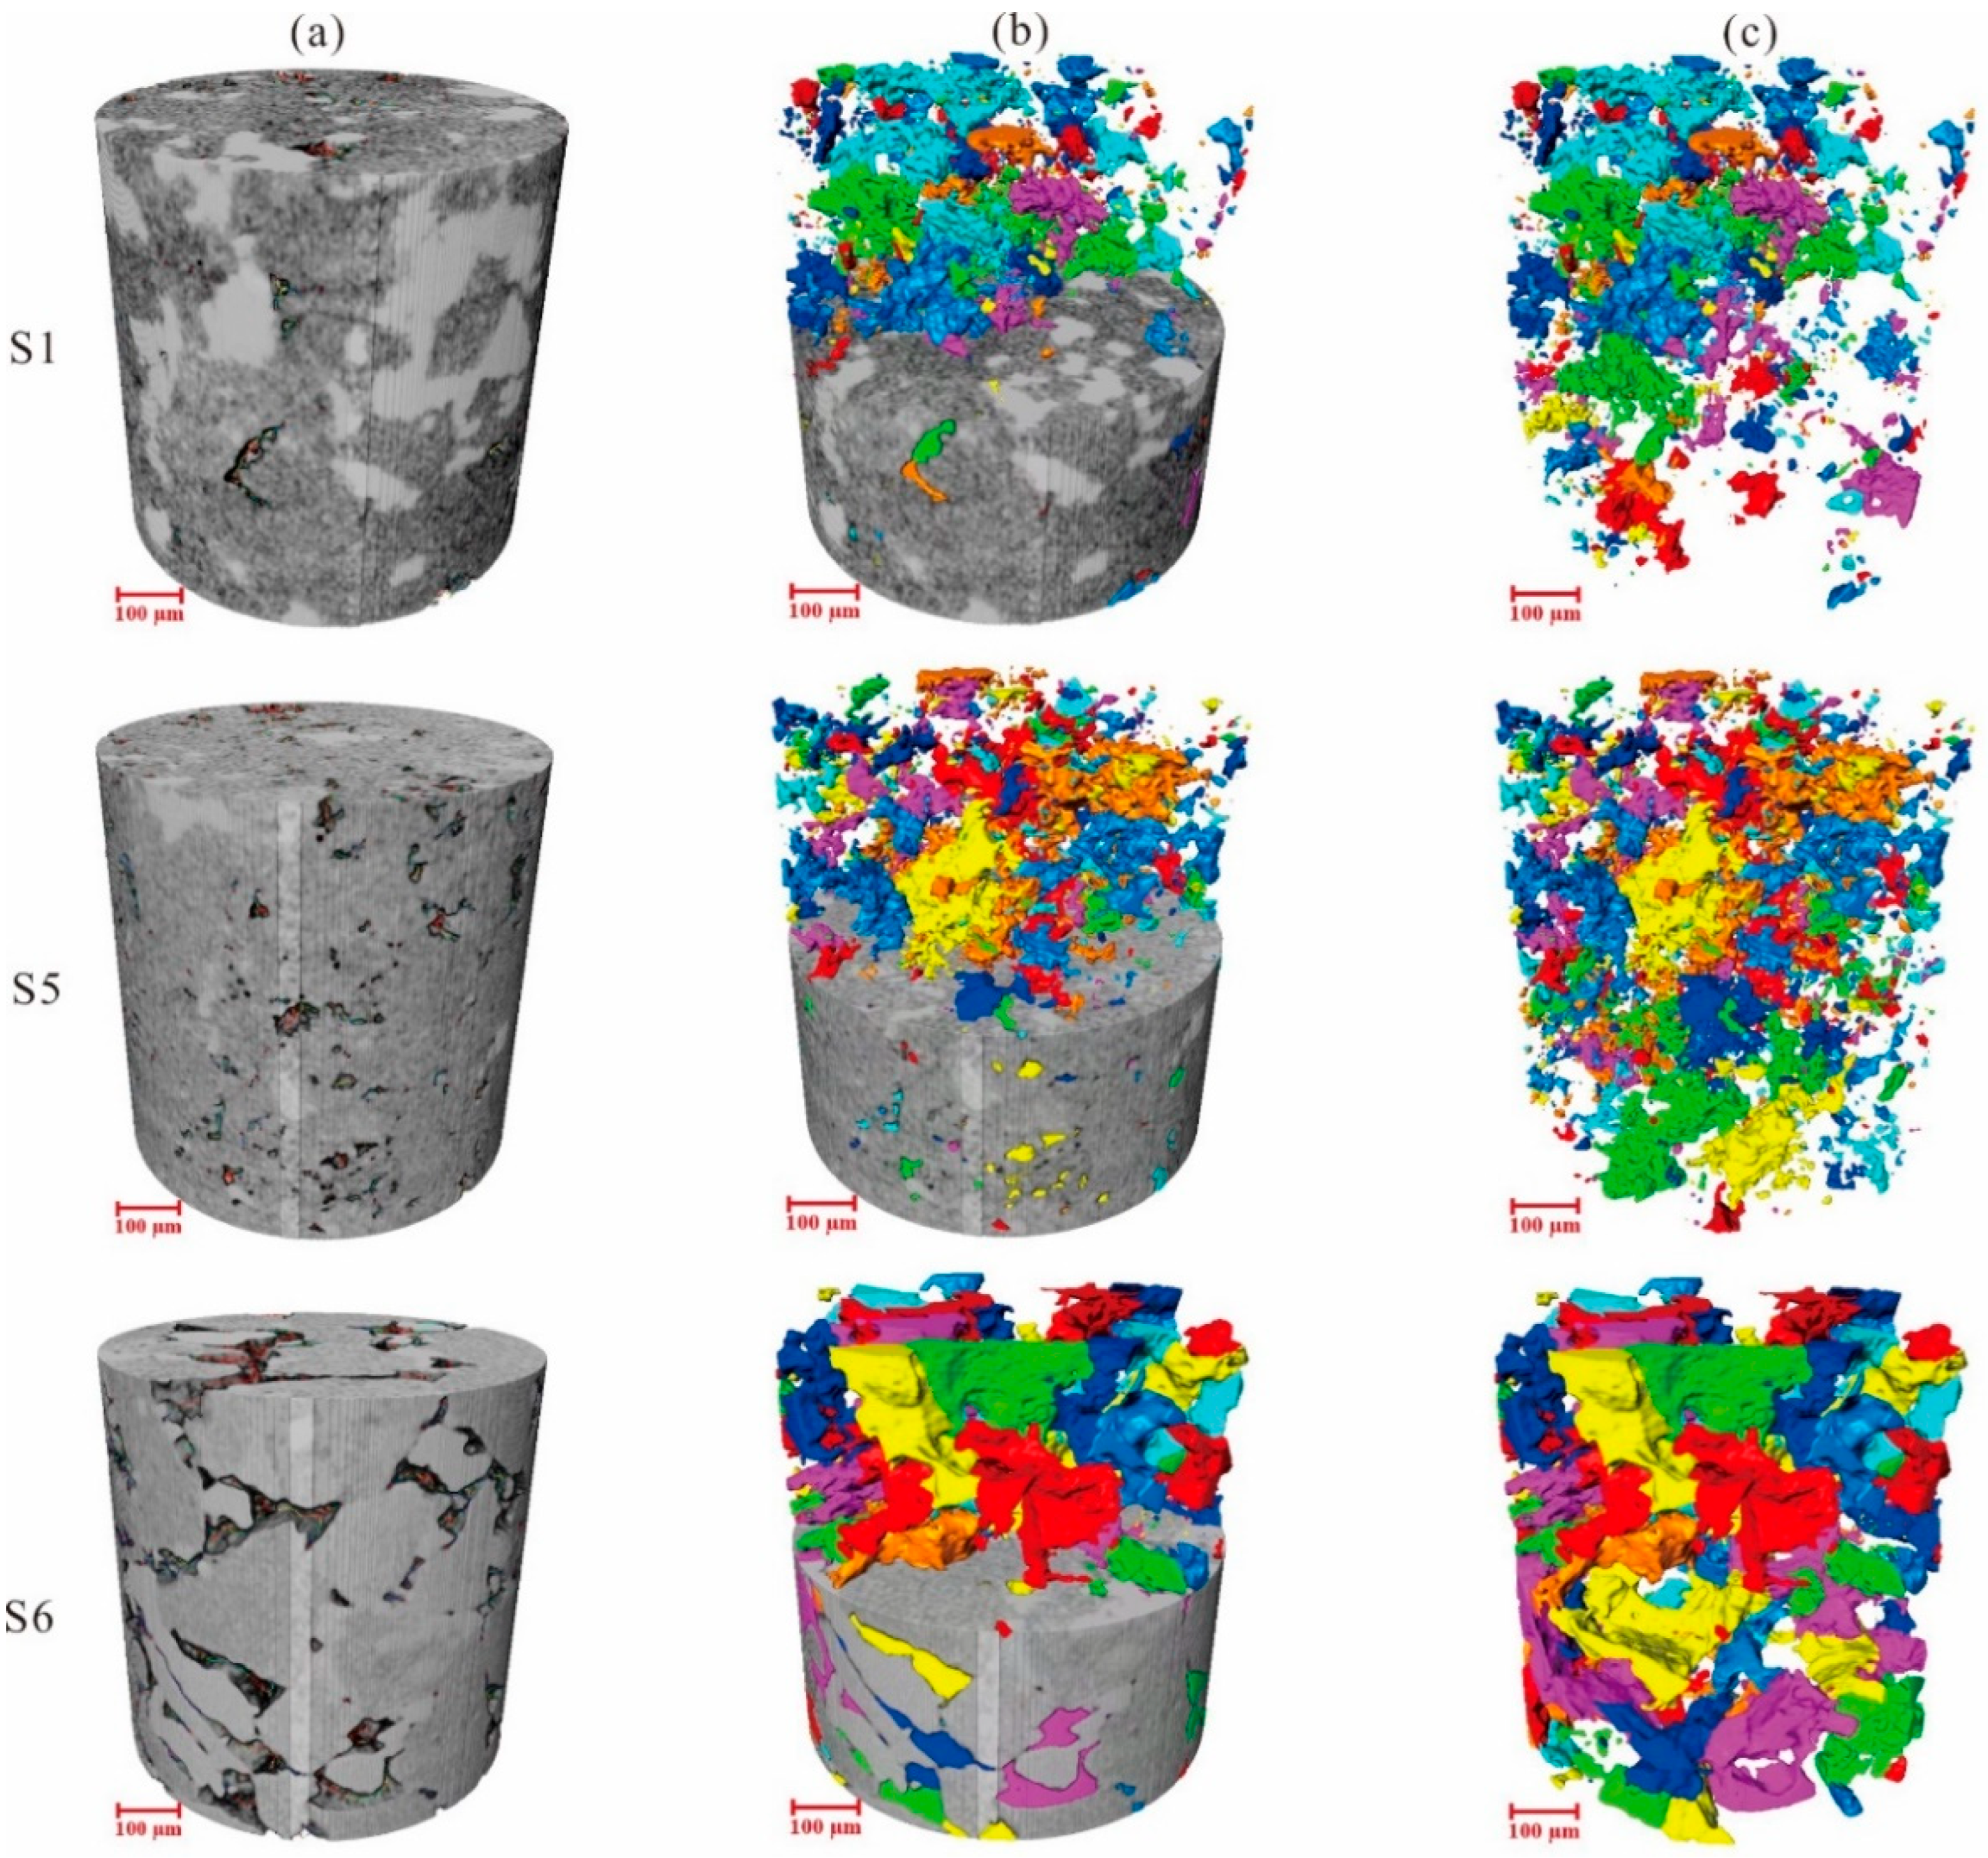
4.4. Three-Dimensional Micro-CT Models

Since micro-CT scanning captures the spatial location and grayscale data of each critical unit within the sample, the 3D spatial distribution of the pore-throat is achievable post-precise identification [40]. Within the Volume Graphics Studio Max system, binary segmentation was conducted on a 3D tight sandstone model measuring 2.5 cm in diameter and 3.0 cm in height, utilizing the pore-throat grayscale threshold (0 to 19,000) derived from the digital terrain model to distinguish the pore-throat (Figure 7a). Following that, the measurement analysis function is employed to gather data on the pore-throat, which are then color-coded based on the size of the pore-throat unit bodies. Interconnected pores are considered a singular unit throughout the coloring process (Figure 7b,c).
The central axis method is used to extract the pore network model of the 3D pore structure of tight sandstone based on micro-CT scanning (Figure 4). As shown in Figure 8, the upper part exhibits a sheet-like structure formed by the superposition of cylindrical rods (Figure 8a). In contrast, the lower part shows an isolated relationship between pores with a few throat connections (Figure 8b). The small number of throats and short extensions hinder the interconnection between pores in the sample. The throats are most developed in sample 6, with many cylindrical rods representing the throat densely superimposed on the model, forming a spider web-like structure. The throat development position aligns well with the hole position, indicating the sample has strong seepage capacity.
The pore structure of tight sandstones exhibits the following characteristics (Figure 8): (1) Pore shape: pore shapes are often isolated, but some appear banded. (2) Pore size distributions: the pore displays a multiscale of pore size distributions, characterized by uneven layering and localized development in the vertical direction. (3) Pore-throat connectivity: small-scale pores (1–10 μm) appear isolated, whereas large-scale pores (>10 μm) with tubular connections may communicate with micropores.

5. Discussion

Shallow water deltaic deposits in the Quantou Formation of the Songliao Basin have been identified as significant hydrocarbon reservoirs. However, exploration and development of these low-permeability, tight sandstone reservoirs are complicated by factors such as narrow river channels, thin sand bodies, and strong reservoir heterogeneity [24]. Consequently, a comprehensive evaluation of reservoir pore structures is critical to overcoming the challenges and enhancing the effectiveness of exploration and development efforts [21,24,41]. Advanced techniques such as SEM, low-pressure gas adsorption (N2, CO2), MICP, and NMR are employed to estimate the fractal dimension of pore structures [42,43]. However, due to the limitations of constant-rate mercury injection pressures, the single fractal model better represents the distribution of small pore throats, while the fractal dimensions calculated from the HPMI method mainly capture small pore throat distributions [5]. Therefore, the heterogeneity for a full-scale pore system cannot be simply characterized by a single fractal dimension. Additionally, the intrinsic relationships between multifractal parameters, pore structure, and physical properties have remained uncertain.

5.1. Pore System Characteristics of Tight Sandstone Reservoirs

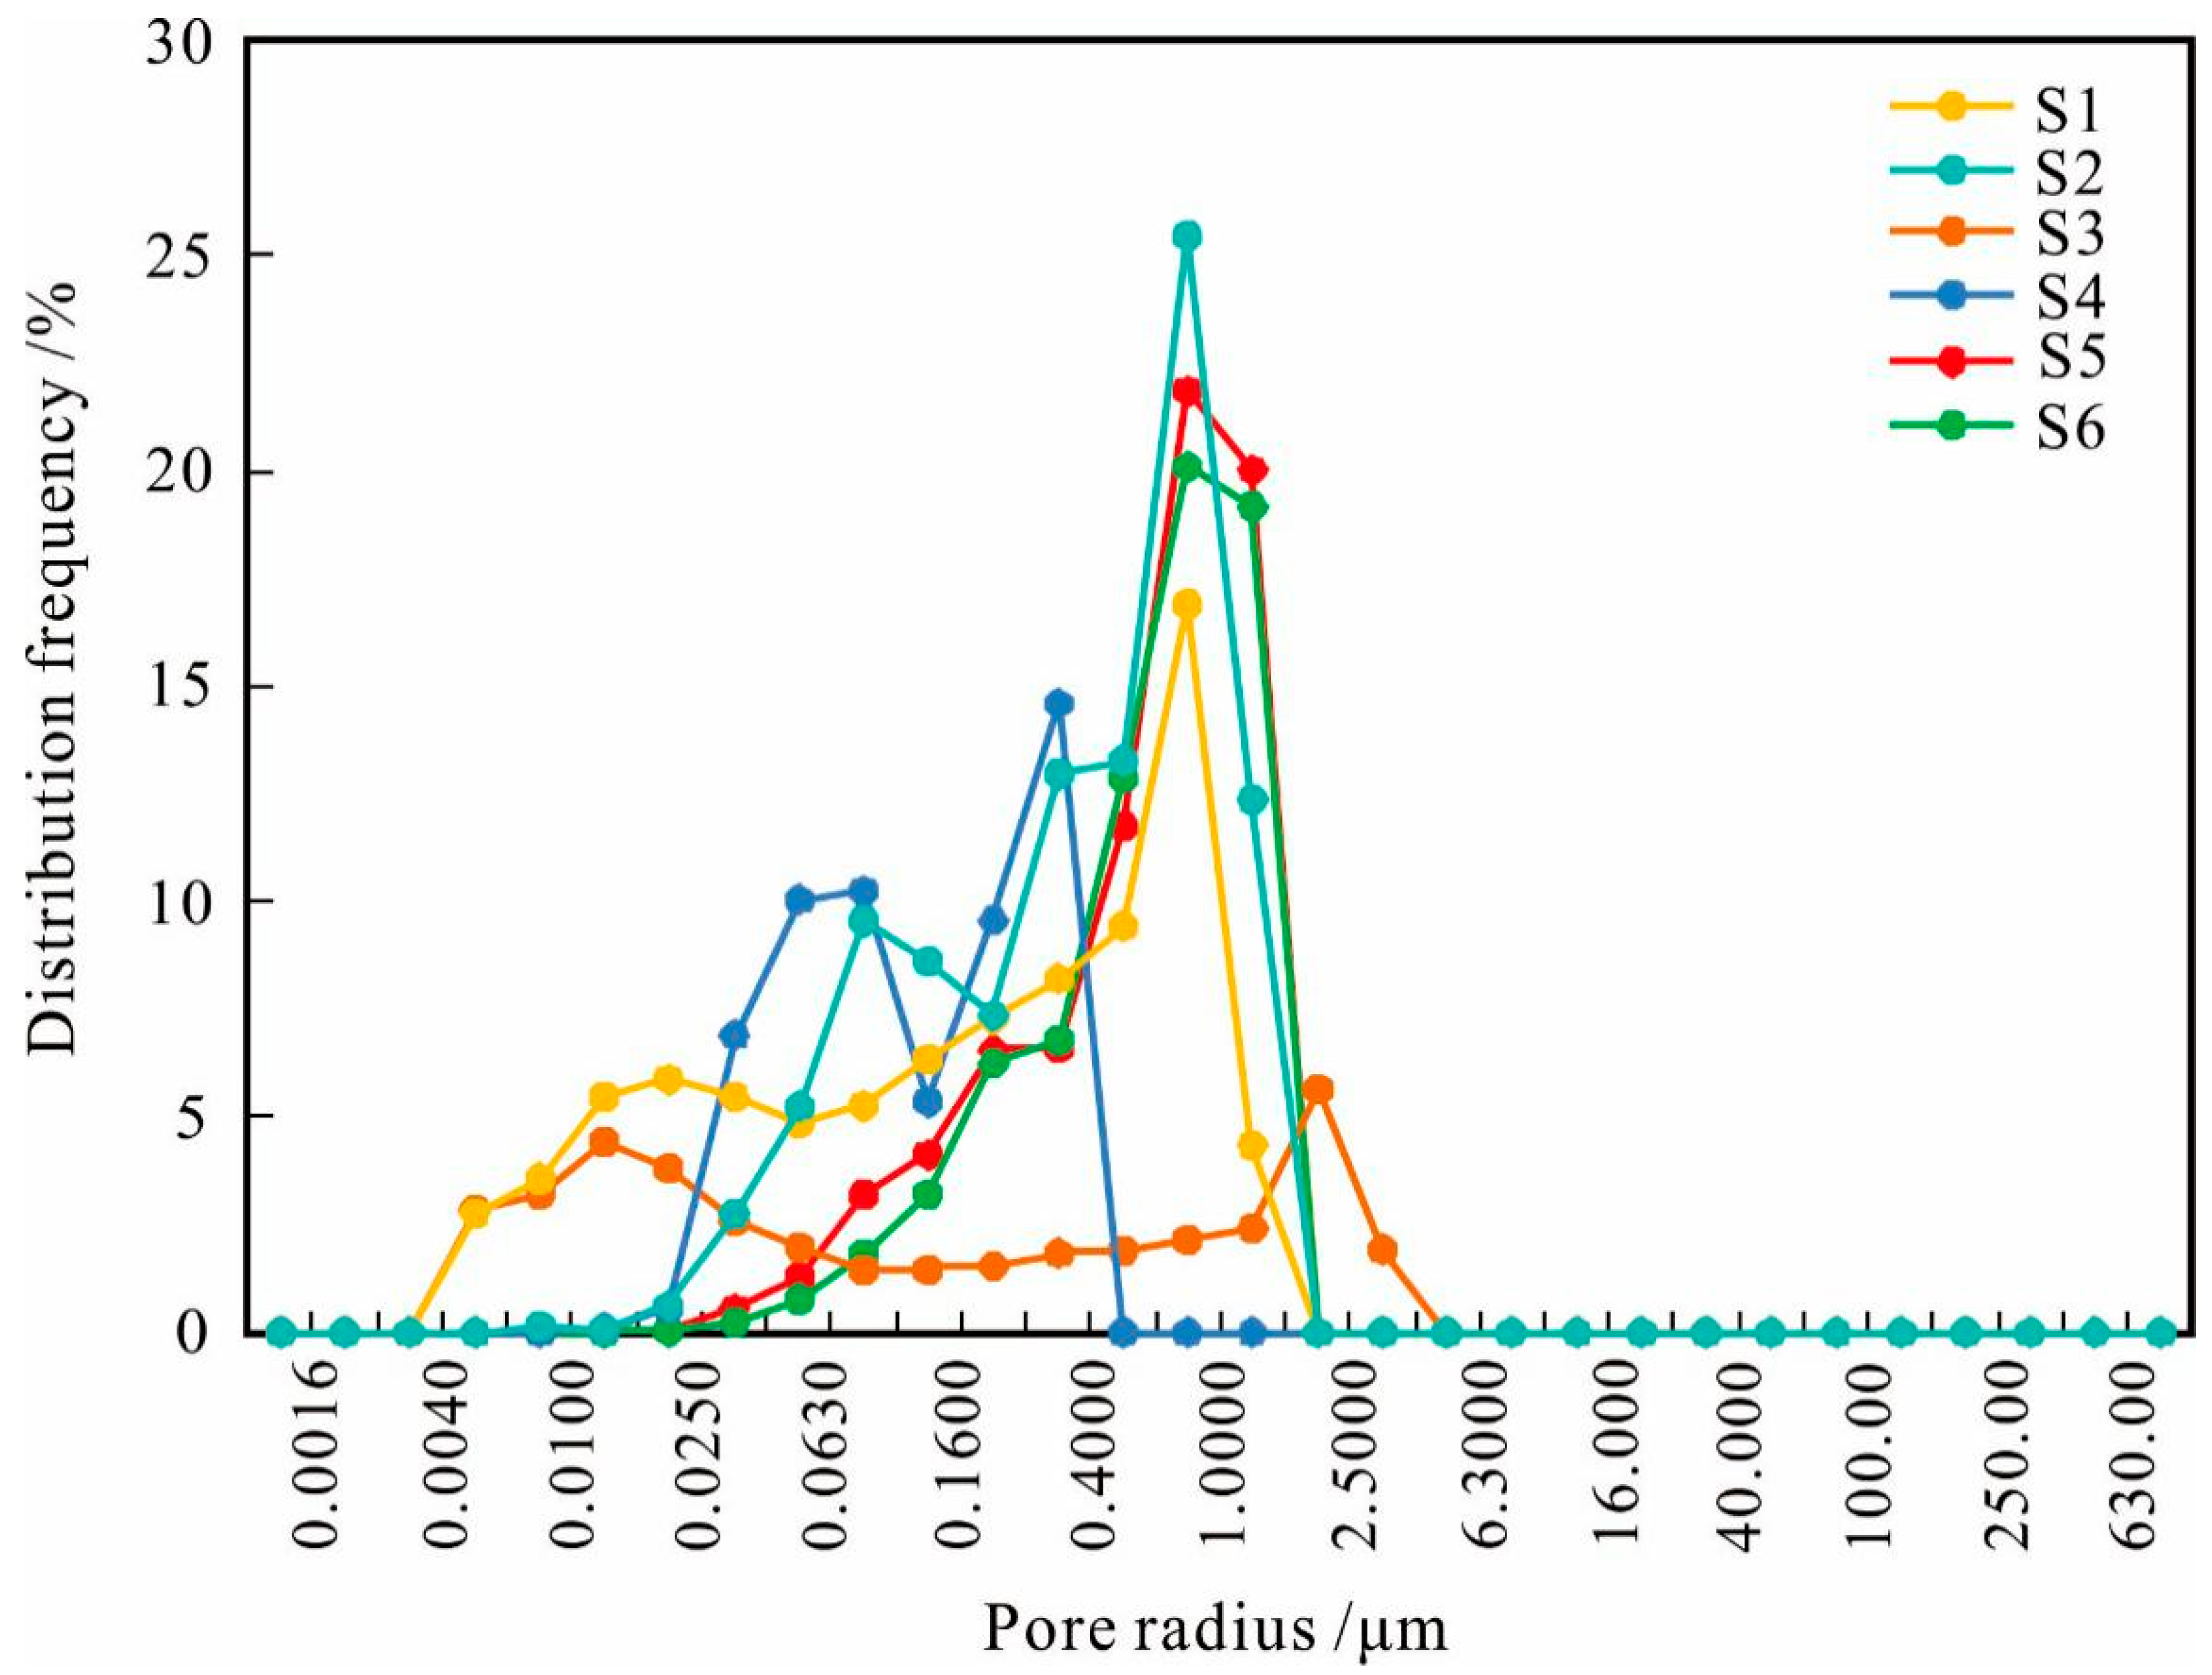
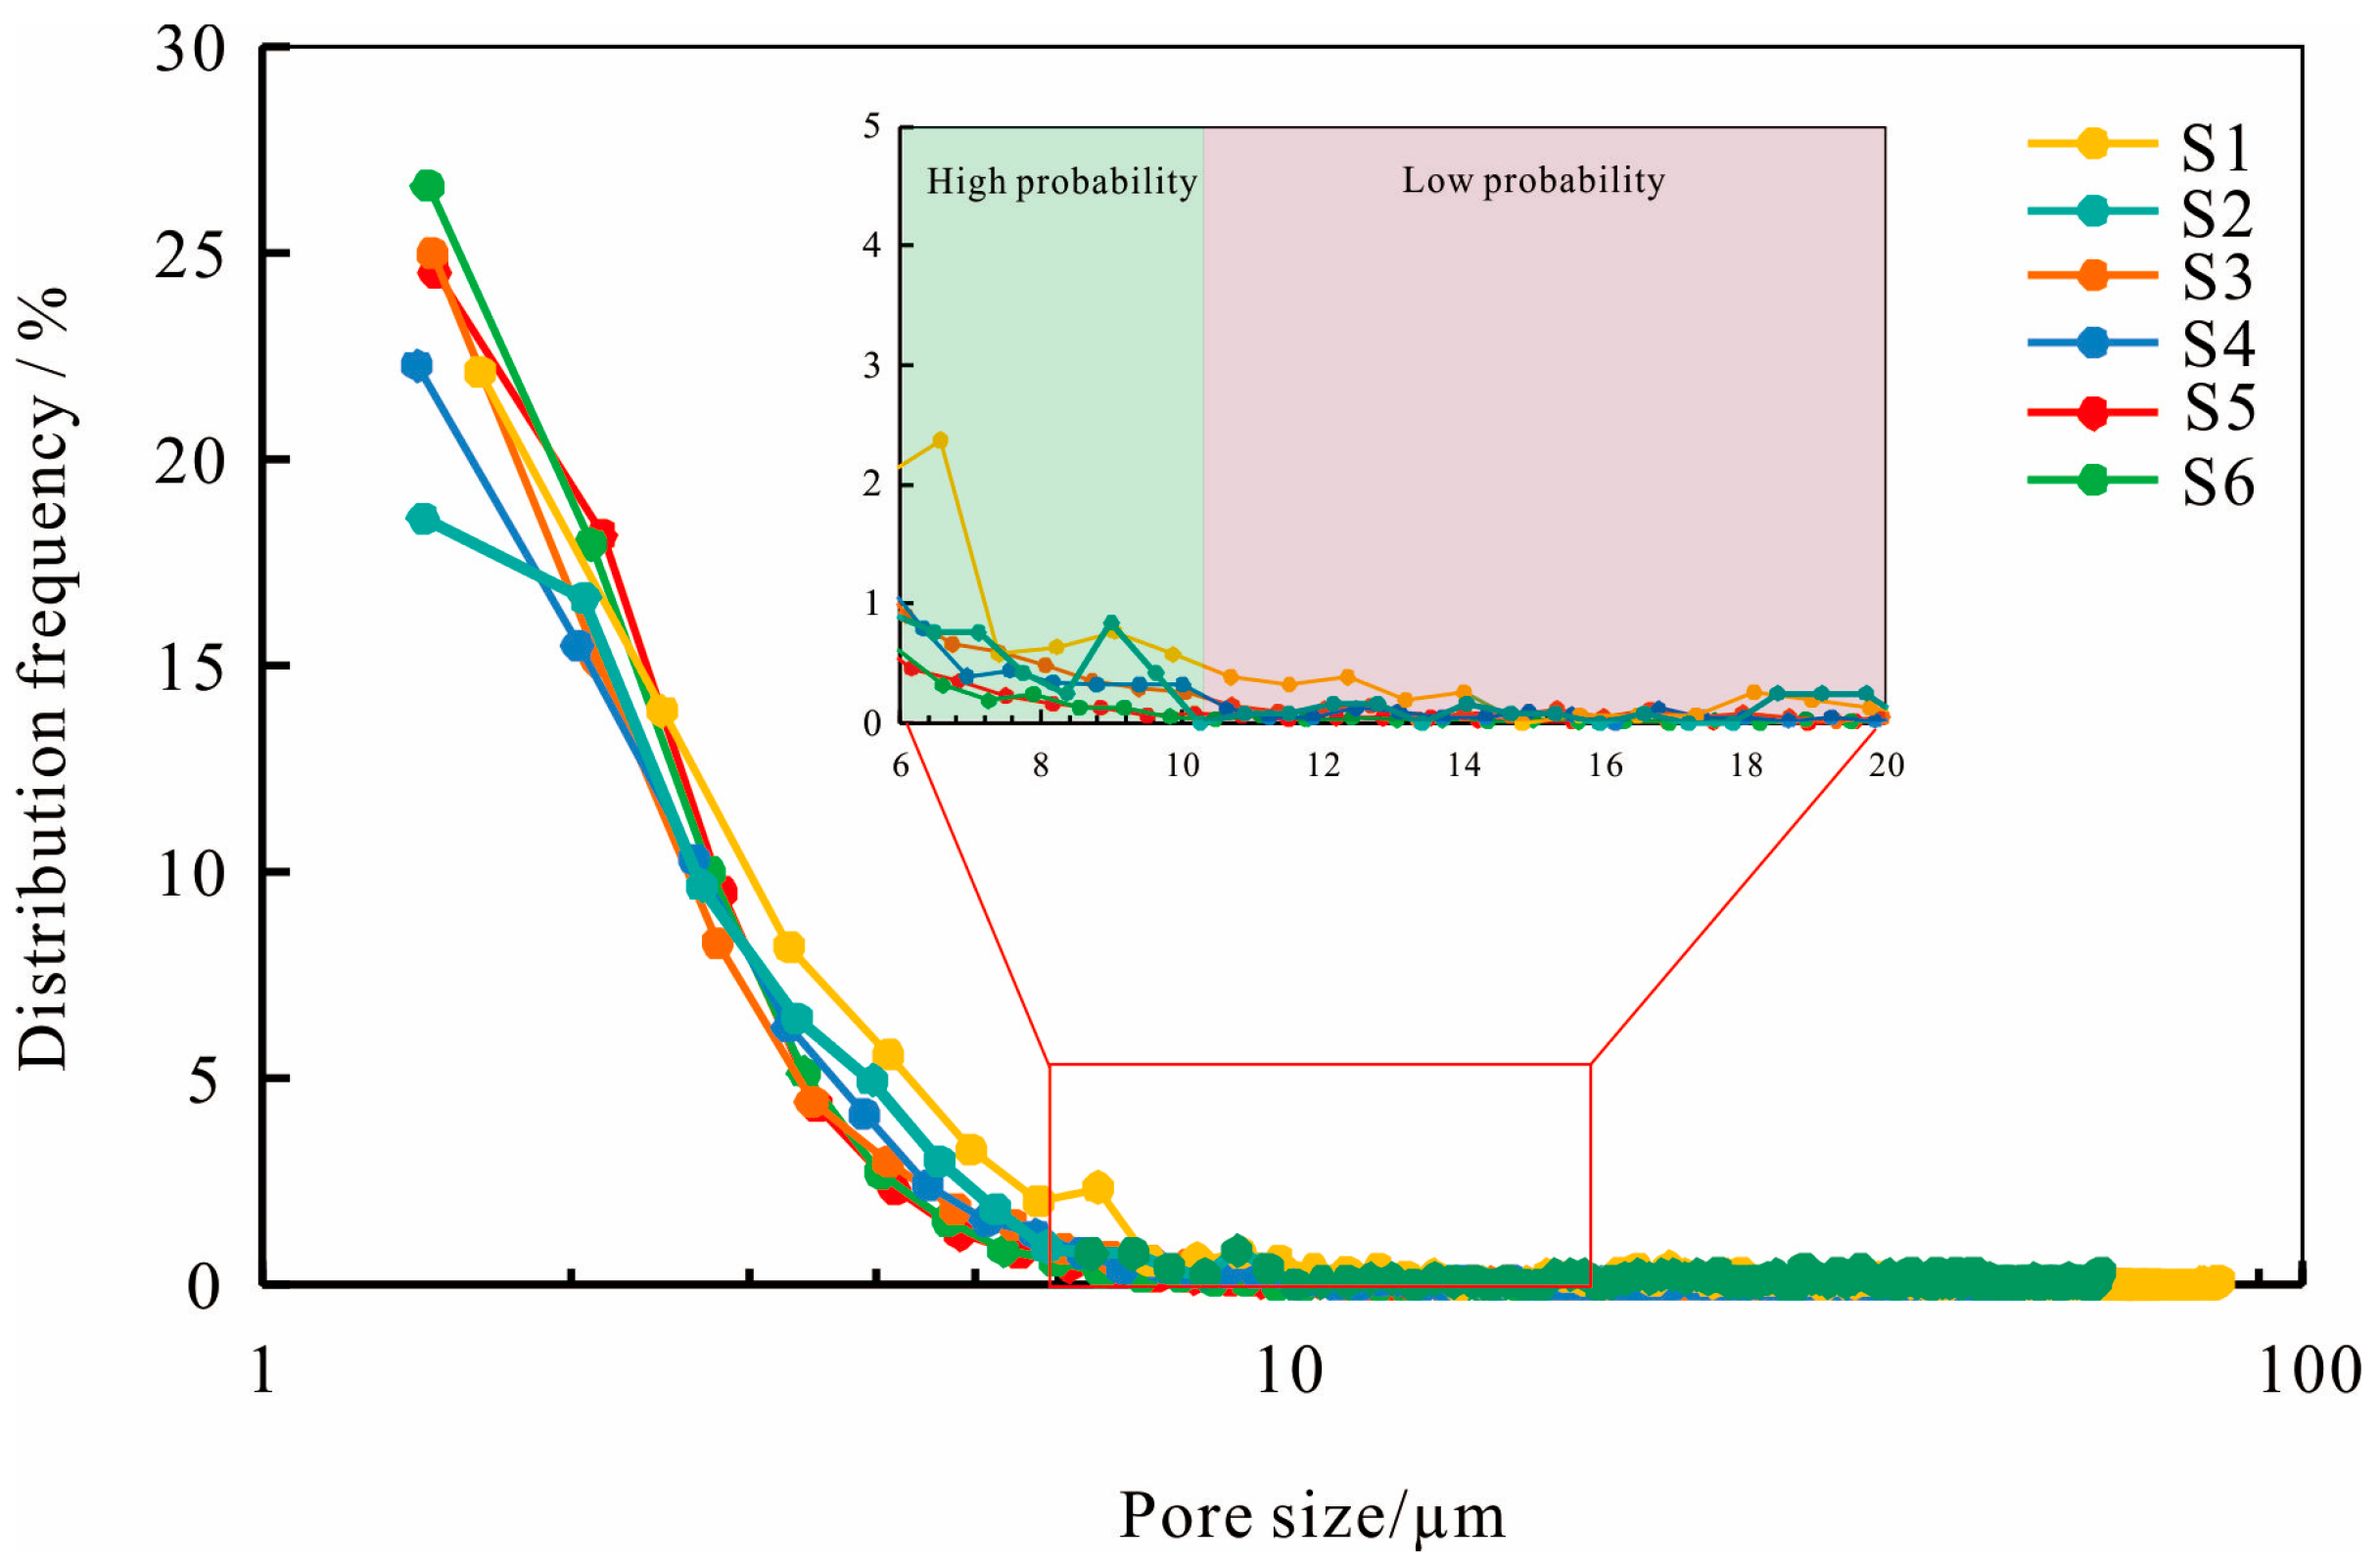
5.1.1. Pore Size Distribution

The distribution characteristics of pore radius obtained from HPMI, particularly for pore-throats smaller than 1 μm (Figure 9). Samples 5 and 6 exhibit the highest distribution frequency at 0.4 μm, with approximately 25% and 20%, respectively. The pore size distributions of samples 3 and 4 are more dispersed, with sample 3 exhibiting multiple frequency peaks within the range of 0.06 μm to 4 μm, while sample 4 shows a bimodal distribution at 0.16 μm and 1 μm. The distribution frequency of sample 1 is relatively low, primarily concentrated at 0.4 μm, whereas the pore size distributions of sample 2 are broader, with a peak around 0.6 μm. These characteristics indicate significant differences in the pore structures among the samples, which have important implications for fluid flow and reservoir performance.
The pore size distributions of various pore types with different scales were obtained by micro-CT, indicating strong pore structure heterogeneity of the tight sandstone samples (Figure 10). For pore sizes of 1–10 μm, the pore size distributions exhibited a unimodal distribution with a peak in the pore size of 1–2 μm and then rapidly declined as the pore size increased. This indicates that the pores in tight sandstone are primarily concentrated in the small size range, with a high degree of consistency in pore structures within this range across all samples. For pore sizes greater than 10 μm, the distribution frequency of all samples significantly decreased and approached zero, indicating the scarcity of large pores in these samples. Accordingly, we define three pore size categories: nano-scale (<1 μm), small-scale (1–10 μm), and large-scale (>10 μm). This classification is informed by analytical resolution thresholds, statistical distribution characteristics, and the functional implications of pore connectivity. Specifically, nano-scale pores are mainly detected by HPMI and SEM due to micro-CT resolution limits, small-scale pores represent the dominant high-frequency domain across samples, and large-scale pores, despite their low abundance, play a key role in enhancing permeability owing to their better connectivity with throats [11]. The pore size distributions characteristics indicate that tight sandstone samples are predominantly composed of small pores, with relatively few large pores. This pore structure has significant implications for reservoir performance and fluid flow characteristics. The high-frequency distribution of small pores may restrict fluid flow, while the relative scarcity of large pores suggests low permeability in these rocks.

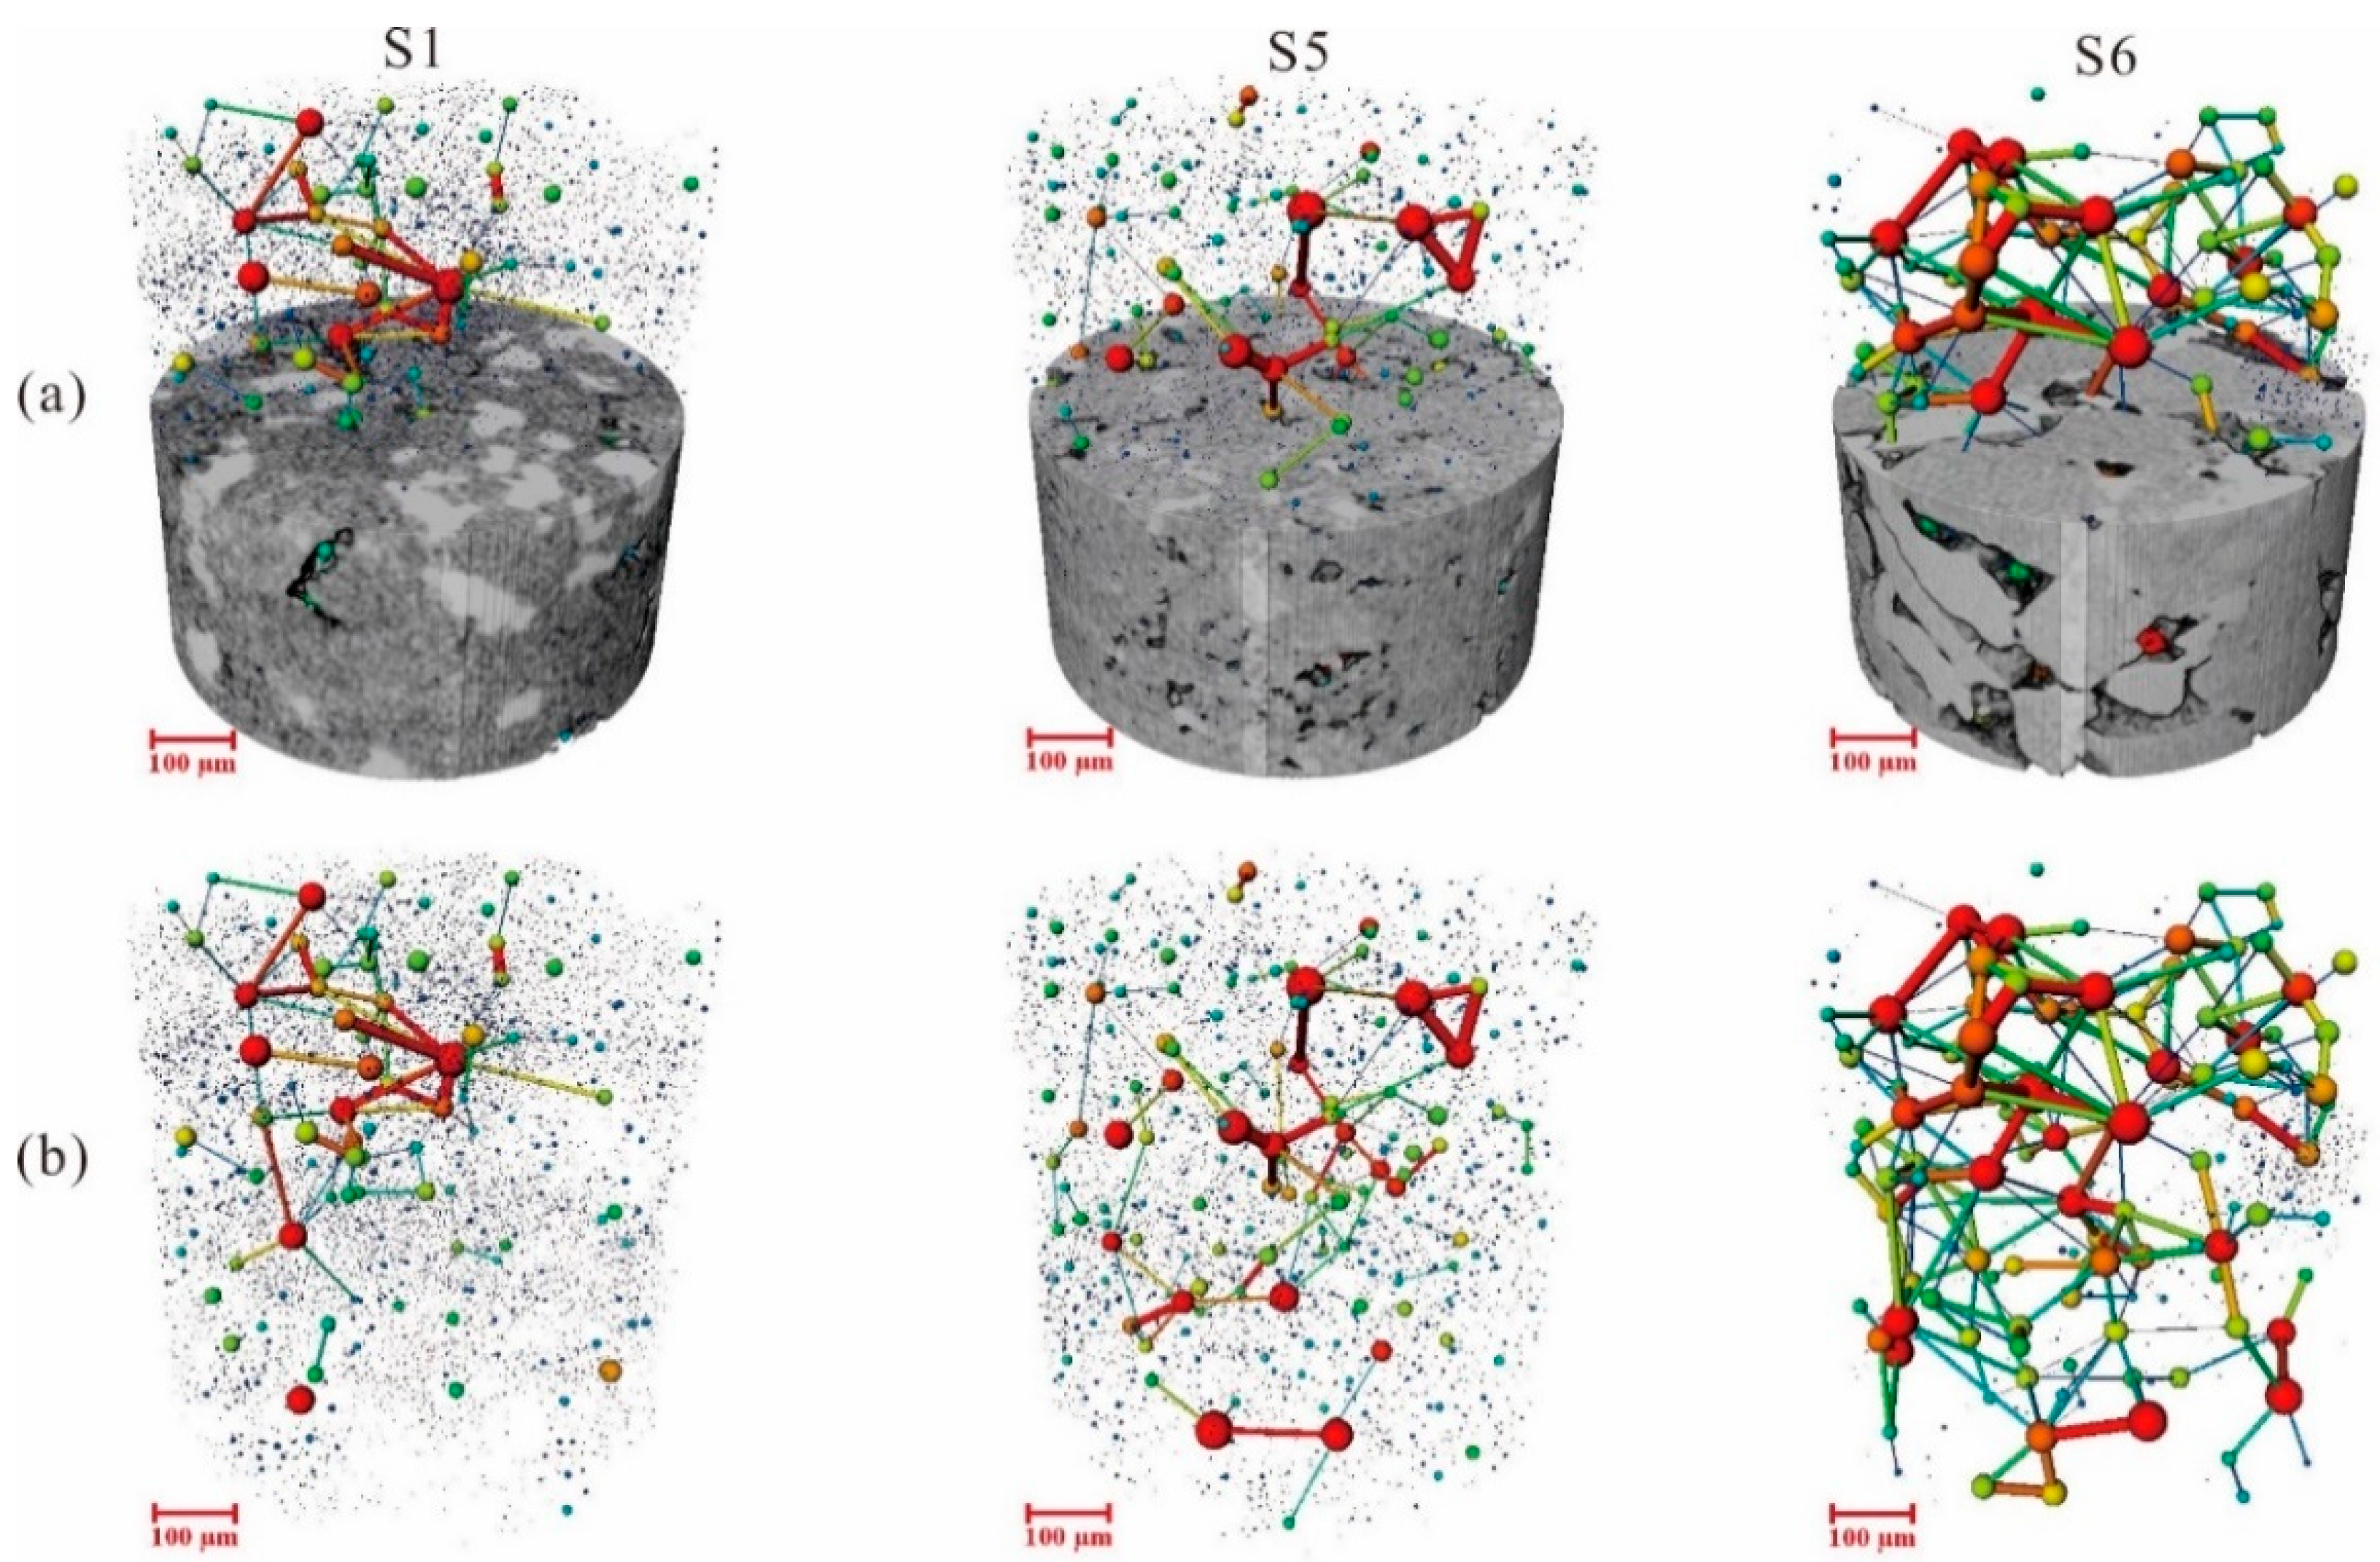
5.1.2. Pore Connectivity

Physical properties of connected pores and throats (fractures), including diameter, count proportion, and throat length, collectively govern the permeability of porous media [44]. Table 3 presents several parameters that characterize the scale of pore development and the distribution features, including the voxel count of pores, area, volume, and the proportion of connected pores. We can see that the pore size in tight sandstone spans a large scale, and that the distribution of those pore sizes is uneven, with a relatively complex distribution of pores (Table 3).
Figure 11 shows connected pore voxel count, volumes, and areas of tight sandstone, indicating that the smaller the connected pore size, the greater the number of pores, with the voxel count exponentially increasing as the size decreases. It is worth noting that the connected pore voxels count of large-scale pores (>10 μm) is mostly less than 10. Although the connected pore voxels count of small-scale pores (1–10 μm) is predominant, the connected pore volume and area are relatively small. Conversely, while the number of pores with connected pores of large-scale pores (>10 μm) is small, the volume and area of these pores are large, and both the volume and area of these connected pores increase with an increase. For instance, samples 5 and 6 feature only 9 and 13 voxel counts in the large-scale pores (>10 μm). Despite this, their corresponding volumes are 205,038.81 μm3 and 287,707.84 μm3, and their areas are 84,136.05 μm2 and 93,388.77 μm2, respectively.
Furthermore, we compared samples 5 and 6 from the same well; both showcase similar mineralogy and physical properties (Table 1). We analyzed the throat size, area distributions, and channel length (Figure 12). The voxel numbers of throats decrease as the throat size increases. The throat areas primarily exhibit a throat size distribution ranging from 0 to 20 μm, and the average throat length appears to be randomly distributed. In sample 6, the number of throats within the 20 to 40 μm size range surpasses that in sample 5, leading to a pore-throat representation exhibiting increased connectivity, a larger cross-sectional diameter, and a higher permeability than sample 5 (Table 1). The pore-throat in sample 6 is globally connected, whereas the reservoirs in Sample 5 are locally connected. These observations imply that the percolation capability of sample 6 overshadows that of sample 5. Therefore, the throat size range of 20 to 40 μm may significantly escalate the overall connectivity and seepage capacity of the pores within the range of sizes.

5.2. Multifractal Analyses of Tight Sandstone Reservoirs

5.2.1. Multiscale Pore Structure Determination

The multifractal theory is an effective method for characterizing the complex degrees and heterogeneities of pore structure. Figure 13 shows a relationship between l o g X ( q , ε ) and log ( ε ) with q ranging from −10 to 10 for the tight sandstone sample derived from micro-CT. An evident linear relationship exists between l o g X q , ε and log ( ε ) , indicating the pore structure of tight sandstones exhibits significant multifractal characteristics [38]. A nearly monotonic decrease in D q is observed within the interval of 10 q 10 . Furthermore, a stronger correlation when q is close to 0, reflecting that the pore structure of the tight sandstone has a strongly heterogeneous distribution.
As the current pore classification schemes are not suitable for describing the pore types of tight sandstone, and consequently resulting in misestimates of the storage and percolation capacities, it is essential that a specific classification scheme is developed for tight sandstone reservoirs. We classify the samples based on pore size distributions, pore connectivity, and fractal dimension into three categories: the nano-scale pores (<1 μm), the small-scale pores (1–10 μm), and the large-scale pores (>10 μm).
Based on the pore size distributions obtained from HPMI (Figure 10), pore size distributions smaller than 1 μm (i.e., nanopores) are mostly intercrystalline pores formed between clay aggregates, which can be defined as intercrystalline nanopores size distributions less than 1 μm (Figure 5e). The pore size distribution analysis shows a unimodal distribution for pores in the range of 1.08–38.72 μm, with a peak in the 1–10 μm range, and little variation in diameters greater than 10 μm (Figure 11). The correlation between pore volume and pore area was assessed for small-scale pores (1–10 μm) and large-scale pores (>10 μm). Small-scale pores (1–10 μm) exhibited a positive correlation between pore surface area and volume, characterized by high correlation coefficients (R2 = 0.9814) (Figure 14a). Conversely, for large-scale pores (>10 μm), a positive correlation between pore surface area and volume was observed, but with a lower correlation coefficient (R2 = 0.5735) (Figure 14b). The complexity of small-scale pores (1–20 μm) demonstrated relatively uniform characteristics across samples compared to large-scale pores (>10 μm).
The multifractal analysis divides the pore size distributions into high probability measure areas and low probability measure areas. The small-scale pores (1–10 μm) have a high distribution frequency, while the large-scale pores (>10 μm) have a low distribution frequency. Consequently, the small-scale pores (1–10 μm) are identified as the high probability measure area, while large-scale pores (>10 μm) correspond to the low probability measure area.

5.2.2. Multifractal Analyses for Multiscale Pore Structure

The generalized dimensions of the sample are shown in Figure 15. It can be seen that the D ( q ) spectra exhibit typical anti-S curves (Figure 15a). The generalized dimensions Δ D reflects the degree of variation of the local characteristics of the pore. The greater the value of Δ D , the stronger the heterogeneity of pore structure [38]. When q = 10 , the generalized dimensions take the maximum value D m a x ; when q = 10 , the generalized dimensions take the minimum value   D m i n . Using q = 0 as the boundary, the multifractal parameter D m i n D 0 represents the width of the left branch of the generalized dimensions, corresponding to the heterogeneity of lower probability measure areas. The multifractal parameter D 0 D m a x represents the width of the right branch, corresponding to the heterogeneity of high probability measure areas.
The f α of tight sandstone exhibits left hook shapes, which indicates that a large probability subset occupies a dominant position [45] (Figure 15b). The multifractal parameter ( α ) represents the width of the multifractal spectrum, offering insights into the heterogeneity development of multiscale pore structure. The multifractal parameter Δ f reflects the shape characteristics of the multifractal spectrum and characterizes the degree of symmetry in pore size distributions [16]. Figure 15c,d illustrate the graphical meanings of multifractal parameters.
Table 4 summarizes the characteristic multifractal parameters of the pore structure in tight sandstone. Note that the multifractal parameters D 0 D m a x and D m i n D 0 ranged from 0.0323 to 0.1454, and 0.1402 to 0.3275, respectively, suggesting that low probability measure areas exhibit stronger heterogeneity of tight sandstone reservoirs.

5.3. The Research Significance of Characterizing Pore Structure Based on Multi-Fractal Dimension

5.3.1. The Relationship Between Multifractal Characteristics and Rock Physical Properties

Physical property parameters serve as a comprehensive reflection of the pore system, where porosity and permeability emerge as crucial indicators for assessing tight sandstone reservoirs’ storage capacity and seepage potential [46]. Figure 16a shows the correlation of multifractal parameters and porosity; there was a positive relationship between porosity and D 0 D m a x (R2 = 0.5775), significantly higher than that of multifractal parameters D m i n D 0 (R2 = 0.0881). The multifractal parameter D 0 D m a x   represents the width of the right branch, corresponding to the heterogeneity of high probability measure areas. The positive correlation between porosity and D 0 D m a x within a specific range for small-scale pores (1–10 μm) indicates that D 0 D m a x is a sensitive indicator for the porosity of tight sandstone. Furthermore, small-scale pores (1–10 μm) situated in the high probability measure areas substantially influence porosity. We also found that the voxel count, volumes, and areas of small-scale pores (1–10 μm) were distributed intensely at the high probability measure area. Therefore, small-scale pores (1–10 μm) possess a more robust ability to characterize porosity heterogeneity.
The multifractal parameters demonstrate a correlation with permeability. In contrast to porosity, the correlation between multifractal parameters D m i n D 0 and permeability is significantly higher than that of multifractal parameters D 0 D m a x , and has a negative relationship between porosity with high correlation coefficient (R2 = 0.4291) (Figure 16b). This phenomenon shows that D m i n D 0 is a sensitive indicator for permeability. The multifractal parameter   D m i n D 0 represents the width of the left branch of the generalized dimensions, corresponding to the heterogeneity of lower probability measure areas. Therefore, the low probability measure area substantially influences the permeability of tight sandstone. Additionally, we observed a pore size range of 10 to 20 μm and a throat size range of 20 to 40 μm in the low probability measure area. Consequently, the part of the micro-pore corresponding to the combination of pore size range of 10 to 20 μm and throat size range of 20 to 40 μm in a low probability measure area may dominate the permeability of tight sandstone.

5.3.2. The Relationship Between Multifractal Parameters and Mineral Composition

Previous studies have demonstrated a significant correlation between the pore structure of tight sandstone reservoirs and mineral composition [38]. We investigated the impact of mineral composition on pore heterogeneity by examining the correlation between multifractal parameters and mineral composition (Figure 17). The feldspar mineral in the long stone is negatively correlated with ( α ) ,   D , and D m i n D 0 , suggesting that the higher the feldspar content, the lower heterogeneity of pore structure. Furthermore, a strong negative value of   D m i n D 0 suggests that the segment of large-scale pores (>10 μm) in the low probability measure area primarily influences the heterogeneity of pore size distributions. The diagenetic stage of K1q4 is the middle, where secondary dissolution pores are relatively common [24]. Dissolution alters the micro-pore structure, increasing the number of large pores. As a result, feldspar promotes the formation of relatively larger-scale macropores, contributing to the homogeneity of larger pores.
Clay minerals positively correlate with ( α )   a n d D , suggesting that clay minerals govern the complexity and dispersion of pore size distributions. The correlation between clay minerals and D 0 D m a x is stronger than that of   D m i n D 0 . Pore size distribution reveals that small-scale pores (1–10 μm) represent high probability measure areas, while the large-scale pores (>10 μm) correspond to lower probability measure areas. Thus, clay minerals significantly control small-scale pores (1–10 μm) structure heterogeneity. This may be because clay minerals fill the pore space during diagenesis, resulting in the disappearance of pores, especially macropores (Figure 5e). The subsequent transformation and volume shrinkage of clay minerals in the later diagenetic process rapidly created numerous interface pores and diagenetic contraction joints, thereby promoting the formation of pores, particularly nanopores (Figure 5f).
It should be noted that diagenetic processes play a critical role in the evolution of pore structures. However, the present study primarily focuses on establishing a statistical correlation between multifractal heterogeneity and mineralogical composition. Although this work centers on the physical complexity of pore networks as characterized by multifractal analysis, future studies should incorporate geochemical parameters, such as pore fluid chemistry and organic matter content, to further clarify their influence on pore structure development and fluid flow behavior.

6. Conclusions

Multiscale pore structure characteristics of tight sandstones were investigated by integrating HPMI and micro-CT 3D pore network modeling, with multifractal theory applied to quantitatively assess pore structure heterogeneity. The results revealed a multiscale pore size distribution, wherein small pores (1–10 μm) tend to be isolated, while larger pores (>10 μm) with tubular connections may facilitate communication with micropores. The pore structures exhibited clear multifractal behavior, and the extracted multifractal parameters proved to be sensitive indicators for characterizing heterogeneity across different scales. In addition, the pore structure was closely related to compositional variation; tight sandstones enriched in feldspar displayed improved pore connectivity, whereas clay mineral enrichment was associated with increased micropore heterogeneity. Notably, pore structure heterogeneity exerted a significant influence on permeability, with pores sized 10–20 μm and throats 20–40 μm in the low probability measure zone potentially playing a dominant role in controlling reservoir permeability.

Author Contributions

Conceptualization, L.L. and Z.B.; methodology, Z.L. and L.L.; software, C.L. and L.L.; validation, Y.L.; formal analysis, H.H., J.W., and W.Z.; writing—original draft preparation, L.L. and Z.B.; writing—review and editing, Z.B. and C.L. All authors have read and agreed to the published version of the manuscript.

Funding

This research was funded by the funding project of Heilongjiang Provincial Natural Science Foundation Project (LH2022D014), and the National Natural Science Foundation of China (52074088, 52474036, 52174022).

Data Availability Statement

Data are available from the authors upon request.

Conflicts of Interest

Authors Zhongcheng Li, Haotian Han and Jianyi Wang were employed by PetroChina Jilin Oilfield Company. The remaining authors declare that the research was conducted in the absence of any commercial or financial relationships that could be construed as a potential conflict of interest.

References

  1. Mandelbrot, B.B. The Fractal Geometry of Nature; W. H. Freeman: New York, NY, USA, 1982. [Google Scholar]
  2. Broseta, D.; Barré, L.; Vizika, O.; Shahidzadeh, N.; Guilbaud, J.; Lyonnard, S. Capillary condensation in a fractal porous medium. Phys. Rev. Lett. 2001, 86, 5313. [Google Scholar] [CrossRef] [PubMed]
  3. Li, Y.; Wang, Z.; Pan, Z.; Niu, X.; Yu, Y.; Meng, S. Pore structure and its fractal dimensions of transitional shale: A cross-section from east margin of the Ordos Basin, China. Fuel 2019, 241, 417–431. [Google Scholar] [CrossRef]
  4. Xin, Y.; Wang, G.; Liu, B.; Ai, Y.; Cai, D.; Yang, S.; Liu, H.; Xie, Y.; Chen, K. Pore structure evaluation in ultra-deep tight sandstones using NMR measurements and fractal analysis. J. Pet. Sci. Eng. 2022, 211, 110180. [Google Scholar] [CrossRef]
  5. Wu, Y.; Liu, C.; Ouyang, S.; Luo, B.; Zhao, D.; Sun, W.; Awan, R.S.; Lu, Z.; Li, G.; Zang, Q. Investigation of pore-throat structure and fractal characteristics of tight sandstones using HPMI, CRMI, and NMR methods: A case study of the lower Shihezi Formation in the Sulige area, Ordos Basin. J. Pet. Sci. Eng. 2022, 210, 110053. [Google Scholar] [CrossRef]
  6. Anovitz, L.M.; Cole, D.R.; Jackson, A.J.; Rother, G.; Littrell, K.C.; Allard, L.F.; Pollington, A.D.; Wesolowski, D.J. Effect of quartz overgrowth precipitation on the multiscale porosity of sandstone: A (U) SANS and imaging analysis. Geochim. Cosmochim. Acta 2015, 158, 199–222. [Google Scholar] [CrossRef]
  7. Wang, J.; Zhang, J.; Xiao, X.; Chen, Y.N.; Han, D. Pore Structure and Fractal Characteristics of Inter-Layer Sandstone in Marine–Continental Transitional Shale: A Case Study of the Upper Permian Longtan Formation in Southern Sichuan Basin, South China. Fractal Fract. 2024, 9, 11. [Google Scholar] [CrossRef]
  8. Shanley, K.W.; Cluff, R.M. The evolution of pore-scale fluid-saturation in low-permeability sandstone reservoirs. AAPG Bull. 2015, 99, 1957–1990. [Google Scholar] [CrossRef]
  9. Wang, W.; Lin, C.; Zhang, X. Fractal Characteristics of Pore Throat and Throat of Tight Sandstone Sweet Spot: A Case Study in the East China Sea Basin. Fractal Fract. 2024, 8, 684. [Google Scholar] [CrossRef]
  10. Hu, Q.; Zhang, Y.; Meng, X.; Li, Z.; Xie, Z.; Li, M. Characterization of micro-nano pore networks in shale oil reservoirs of Paleogene Shahejie Formation in Dongying Sag of Bohai Bay Basin, East China. Pet. Explor. Dev. 2017, 44, 720–730. [Google Scholar] [CrossRef]
  11. Liu, P.; Nie, B.; Zhao, Z.; Li, J.; Yang, H.; Qin, C. Permeability of micro-scale structure in coal: Insights from μ-CT image and pore network modelling. Gas Sci. Eng. 2023, 111, 204931. [Google Scholar] [CrossRef]
  12. Yang, R.; He, S.; Yi, J.; Hu, Q. Nano-scale pore structure and fractal dimension of organic-rich Wufeng-Longmaxi shale from Jiaoshiba area, Sichuan Basin: Investigations using FE-SEM, gas adsorption and helium pycnometry. Mar. Pet. Geol. 2016, 70, 27–45. [Google Scholar] [CrossRef]
  13. Sun, M.; Zhao, J.; Pan, Z.; Hu, Q.; Yu, B.; Tan, Y.; Sun, L.; Bai, L.; Wu, C.; Blach, T.P. Pore characterization of shales: A review of small angle scattering technique. J. Nat. Gas Sci. Eng. 2020, 78, 103294. [Google Scholar] [CrossRef]
  14. Liu, P.; Nie, B.; Zhao, Z.; Zhao, Y.; Li, Q. Characterization of ultrasonic induced damage on multi-scale pore/fracture in coal using gas sorption and μ-CT 3D reconstruction. Fuel 2023, 332, 126178. [Google Scholar] [CrossRef]
  15. Zhou, S.; Liu, D.; Cai, Y.; Yao, Y.; Li, Z. 3D characterization and quantitative evaluation of pore-fracture networks of two Chinese coals using FIB-SEM tomography. Int. J. Coal Geol. 2017, 174, 41–54. [Google Scholar] [CrossRef]
  16. Soto-Gomez, D.; Perez-Rodriguez, P.; Juiz, L.V.; Paradelo, M.; Lopez-Periago, J.E. 3D multifractal characterization of computed tomography images of soils under different tillage management: Linking multifractal parameters to physical properties. Geoderma 2020, 363, 114129. [Google Scholar] [CrossRef]
  17. Liu, Q.; Sun, M.; Sun, X.; Liu, B.; Ostadhassan, M.; Huang, W.; Chen, X.; Pan, Z. Pore network characterization of shale reservoirs through state-of-the-art X-ray computed tomography: A review. Gas Sci. Eng. 2023, 113, 204967. [Google Scholar] [CrossRef]
  18. Zhu, H.; Huang, C.; Ju, Y.; Bu, H.; Li, X.; Yang, M.; Chu, Q.; Feng, H.; Qiao, P.; Qi, Y. Multi-scale multi-dimensional characterization of clay-hosted pore networks of shale using FIBSEM, TEM, and X-ray micro-tomography: Implications for methane storage and migration. Appl. Clay Sci. 2021, 213, 106239. [Google Scholar] [CrossRef]
  19. Alyafei, N.; Mckay, T.J.; Solling, T.I. Characterization of petrophysical properties using pore-network and lattice-Boltzmann modelling: Choice of method and image sub-volume size. J. Pet. Sci. Eng. 2016, 145, 256–265. [Google Scholar] [CrossRef]
  20. Zhang, L.; Bao, Z.; Dou, L.; Xu, Q. Diagenetic alterations related to sedimentary architecture of deltaic distributary channels in red beds of the Cretaceous Yaojia Formation, Songliao Basin. J. Pet. Sci. Eng. 2021, 203, 108564. [Google Scholar] [CrossRef]
  21. Peng, H.; Jiao, Y.; Fu, X.; Wu, L.; Guo, X.; Wang, Q.; Liu, C. Provenance and uranium source tracing for uranium-bearing series in the south of Songliao Basin: Evidence from zircon UPb chronology and lithogeochemistry. J. Geochem. Explor. 2025, 272, 107703. [Google Scholar] [CrossRef]
  22. Feng, Z.; Jia, C.; Xie, X.; Zhang, S.; Feng, Z.; Cross, T.A. Tectonostratigraphic units and stratigraphic sequences of the nonmarine Songliao basin, northeast China. Basin Res. 2010, 22, 79–95. [Google Scholar]
  23. Li, L.; Bao, Z.; Li, L.; Li, Z.; Ban, S.; Li, Z.; Wang, T.; Li, Y.; Zheng, N.; Zhao, C. The source and preservation of lacustrine shale organic matter: Insights from the Qingshankou Formation in the Changling Sag, Southern Songliao Basin, China. Sediment. Geol. 2024, 466, 106649. [Google Scholar] [CrossRef]
  24. Xi, K.; Cao, Y.; Jahren, J.; Zhu, R.; Bjørlykke, K.; Zhang, X.; Cai, L.; Hellevang, H. Quartz cement and its origin in tight sandstone reservoirs of the Cretaceous Quantou formation in the southern Songliao basin, China. Mar. Pet. Geol. 2015, 66, 748–763. [Google Scholar] [CrossRef]
  25. Zhang, Q.; Wu, X.; Radwan, A.E.; Wang, B.; Wang, K.; Tian, H.; Yin, S. Diagenesis of continental tight sandstone and its control on reservoir quality: A case study of the Quan 3 member of the cretaceous Quantou Formation, Fuxin uplift, Songliao Basin. Mar. Pet. Geol. 2022, 145, 105883. [Google Scholar] [CrossRef]
  26. Feng, Z.; Zhang, S.; Feng, Z. Discovery of “Enveloping surface of oil and gas overpressure migration” in the Songliao Basin and its bearings on hydrocarbon migration and accumulation mechanisms. Sci. China Earth Sci. 2012, 55, 2005–2017. [Google Scholar] [CrossRef]
  27. Liu, B.; Wang, H.; Fu, X.; Bai, Y.; Bai, L.; Jia, M.; He, B. Lithofacies and depositional setting of a highly prospective lacustrine shale oil succession from the Upper Cretaceous Qingshankou Formation in the Gulong sag, northern Songliao Basin, northeast China. AAPG Bull. 2019, 103, 405–432. [Google Scholar] [CrossRef]
  28. Bish, D.L.; Howard, S.A. Quantitative phase analysis using the Rietveld method. Appl. Crystallogr. 1988, 21, 86–91. [Google Scholar] [CrossRef]
  29. Środoń, J.; Drits, V.A.; McCarty, D.K.; Hsieh, J.C.; Eberl, D.D. Quantitative X-ray diffraction analysis of clay-bearing rocks from random preparations. Clays Clay Miner. 2001, 49, 514–528. [Google Scholar] [CrossRef]
  30. Loucks, R.G.; Reed, R.M.; Ruppel, S.C.; Jarvie, D.M. Morphology, genesis, and distribution of nanometer-scale pores in siliceous mudstones of the Mississippian Barnett Shale. J. Sediment. Res. 2009, 79, 848–861. [Google Scholar] [CrossRef]
  31. Milliken, K.L.; Rudnicki, M.; Awwiller, D.N.; Zhang, T. Organic matter–hosted pore system, Marcellus formation (Devonian), Pennsylvania. AAPG Bull. 2013, 97, 177–200. [Google Scholar] [CrossRef]
  32. Zhang, F.; Jiang, Z.; Sun, W.; Li, Y.; Zhang, X.; Zhu, L.; Wen, M. A multiscale comprehensive study on pore structure of tight sandstone reservoir realized by nuclear magnetic resonance, high pressure mercury injection and constant-rate mercury injection penetration test. Mar. Pet. Geol. 2019, 109, 208–222. [Google Scholar] [CrossRef]
  33. Klaver, J.; Desbois, G.; Littke, R.; Urai, J.L. BIB-SEM characterization of pore space morphology and distribution in postmature to overmature samples from the Haynesville and Bossier Shales. Mar. Pet. Geol. 2015, 59, 451–466. [Google Scholar] [CrossRef]
  34. Ramkumar, M.; Nagarajan, R.; Santosh, M. Advances in sediment geochemistry and chemostratigraphy for reservoir characterization. Energy Geosci. 2021, 2, 308–326. [Google Scholar] [CrossRef]
  35. Soleimani, M.; Jodeiri Shokri, B. 3D static reservoir modeling by geostatistical techniques used for reservoir characterization and data integration. Environ. Earth Sci. 2015, 74, 1403–1414. [Google Scholar] [CrossRef]
  36. Peyton, R.L.; Gantzer, C.J.; Anderson, S.H.; Haeffner, B.A.; Pfeifer, P. Fractal dimension to describe soil macropore structure using X ray computed tomography. Water Resour. Res. 1994, 30, 691–700. [Google Scholar] [CrossRef]
  37. Zeleke, T.B.; Si, B.C. Characterizing scale-dependent spatial relationships between soil properties using multifractal techniques. Geoderma 2006, 134, 440–452. [Google Scholar] [CrossRef]
  38. Li, R.; Hou, X.; Chen, L.; Fang, H.; Zheng, C. Multifractal investigation on multi-scale pore structure heterogeneity of high rank coal reservoirs. Nat. Resour. Res. 2022, 31, 1665–1685. [Google Scholar] [CrossRef]
  39. Halsey, T.C.; Jensen, M.H.; Kadanoff, L.P.; Procaccia, I.; Shraiman, B.I. Fractal measures and their singularities: The characterization of strange sets. Phys. Rev. A 1986, 33, 1141. [Google Scholar] [CrossRef]
  40. Taud, H.; Martinez-Angeles, R.; Parrot, J.F.; Hernandez-Escobedo, L. Porosity estimation method by X-ray computed tomography. J. Pet. Sci. Eng. 2005, 47, 209–217. [Google Scholar] [CrossRef]
  41. Cao, Z.; Lin, C.; Dong, C.; Ren, L.; Han, S.; Dai, J.; Xu, X.; Qin, M.; Zhu, P. Impact of sequence stratigraphy, depositional facies, diagenesis and CO2 charge on reservoir quality of the lower cretaceous Quantou Formation, Southern Songliao Basin, China. Mar. Pet. Geol. 2018, 93, 497–519. [Google Scholar] [CrossRef]
  42. Zhou, N.; Wang, M.; Lu, S.; Dodd, T.J.; Liu, W.; Guan, Y. Evolution of fractal pore structure in sedimentary rocks. Earth Space Sci. 2022, 9, e2021E–e2167E. [Google Scholar] [CrossRef]
  43. Zhang, P.; Misch, D.; Meng, Q.; Sachsenhofer, R.F.; Liu, Z.; Jia, J.; Gao, F.; Bechtel, A.; Hu, F. Lateral changes of organic matter preservation in the lacustrine Qingshankou Formation (Cretaceous Songliao Basin, NE China): Evidence for basin segmentation. Int. J. Coal Geol. 2022, 254, 103984. [Google Scholar] [CrossRef]
  44. Giffin, S.; Littke, R.; Klaver, J.; Urai, J.L. Application of BIB–SEM technology to characterize macropore morphology in coal. Int. J. Coal Geol. 2013, 114, 85–95. [Google Scholar] [CrossRef]
  45. Wang, F.; Yang, K.; Zai, Y. Multifractal characteristics of shale and tight sandstone pore structures with nitrogen adsorption and nuclear magnetic resonance. Pet. Sci. 2020, 17, 1209–1220. [Google Scholar] [CrossRef]
  46. Ramandi, H.L.; Mostaghimi, P.; Armstrong, R.T.; Saadatfar, M.; Pinczewski, W.V. Porosity and permeability characterization of coal: A micro-computed tomography study. Int. J. Coal Geol. 2016, 154, 57–68. [Google Scholar] [CrossRef]
Figure 1. (a) Location of the Songliao Basin [20]. (b) The first class tectonic unit of the Songliao Basin [23]. (c) The second class tectonic units of the study area and well locations. (d) Structural cross-section of the Songliao Basin [22,23].
Fractalfract 09 00336 g001
Figure 2. (a) Lithostratigraphy and sequence stratigraphy [25]. (b) Depositional settings of K1q4 in the Songliao Basin (modified from [26]).
Fractalfract 09 00336 g002
Figure 3. Workflow of micro-CT image processing and 3D visualization model of pore structure.
Fractalfract 09 00336 g003
Figure 4. Schematic of 3D visualization of pore network model from micro-CT [11,33].
Fractalfract 09 00336 g004
Figure 5. Typical pore types and throat types in plane-polarized light images of tight sandstone samples in the K1q4. (a) Intergranular pore and shrunken-pore throat, Well H87-7, 2306.59 m. (b) Feldspar dissolution pores, Well H87-7, 2308.48 m. (c) Bent-sheet shaped throat, Well H87-7, 2308.48 m. (d) Sheet-shaped throat, Well R53, 2204.61 m. (e) Intercrystalline pores in clay minerals, Well C45, 2110.26 m. (f) Intergranular distribution of illite, Well Q262, 2320.95 m.
Fractalfract 09 00336 g005
Figure 6. Characteristics of capillary pressure curve of HPMI.
Fractalfract 09 00336 g006
Figure 7. Micro-pore structure of tight sandstones from the micro-CT analysis in the K1q4. (a) The 3D pore network reconstruction. (b) The 3D local visualization of pore connectivity. (c) The 3D visualization of pore connectivity.
Fractalfract 09 00336 g007
Figure 8. 3D visualization of pore network model from the micro-CT scanning of tight sandstone in the K1q4. (a) The 3D local visualization of pore network model. (b) The 3D visualization of pore network model.
Fractalfract 09 00336 g008
Figure 9. Distribution characteristics of pore radius obtained from HPMI.
Fractalfract 09 00336 g009
Figure 10. Distribution characteristics of pore radius obtained from micro-CT.
Fractalfract 09 00336 g010
Figure 11. The connected pore voxels count, volumes, areas of tight sandstones in the K1q4. (a) Sample 5; (b) Sample 6.
Fractalfract 09 00336 g011
Figure 12. Throat size distributions, area distributions, and channel length of tight sandstones in the K1q4. (a) Sample 5; (b) Sample 6.
Fractalfract 09 00336 g012
Figure 13. Relationships between l o g X ( q , ε ) and log ( ε ) from multifractal analyses of tight sandstones in the K1q4.
Fractalfract 09 00336 g013
Figure 14. Correlation analysis between volumes and areas of tight sandstones in the K1q4. (a) Small-scale pores (1–10 μm), (b) Large-scale pores (>10 μm).
Fractalfract 09 00336 g014
Figure 15. Generalized dimensions (a,c) and singularity spectra (b,d) of tight sandstones in the K1q4.
Fractalfract 09 00336 g015
Figure 16. Correlation analysis of multifractal parameters with porosity (a) and permeability (b).
Fractalfract 09 00336 g016
Figure 17. Pearson correlation matrix between tight sandstones compositions and fractal parameters.
Fractalfract 09 00336 g017
Table 1. Basic information of tight sandstone samples in the K1q4. Data are consistent with measurements reported in reference [24].
No.WellDepth/mLithologyPorosity/%Permeability/×10−3 μm2
S1C82390.01–2390.21siltstone4.340.19
S2C82391.53–2391.73siltstone7.820.12
S3C28-52221.67–2221.77siltstone7.290.25
S4Q227-131678.69–1678.78fine sandstone9.840.69
S5Q2371665.12–1665.20fine sandstone12.650.71
S6Q2371684.47–1684.57fine sandstone6.910.29
Table 2. XRD of tight sandstones in the K1q4.
No.Quartz
(%)
Feldspar
(%)
Calcite
(%)
Ankerite
(%)
Dolomite
(%)
Siderite
(%)
Pyrite
(%)
Clay
(%)
S126.210.55.203.200.001.402.4051.10
S230.612.14.300.000.002.902.3047.80
S335.86.72.403.900.001.402.4047.40
S436.221.53.200.006.201.100.6031.20
S530.432.86.700.009.101.600.3019.10
S634.430.21.200.0013.200.600.3020.10
Table 3. The total pores, closed pores, and connected pores subsection distribution were computed by micro-CT of tight sandstones in the K1q4.
No.Pore Size
(μm)
Total PoresClosed PoresConnected PoresConnected Pores Proportion
Voxels CountVolumes
/μm3
Areas
/μm2
Voxels CountVolumes
/μm3
Areas
/μm2
Voxels CountVolumes
/μm3
Areas
/μm2
VolumesAreas
S51–28335117,782.36205,770.128193116,116.53202,759.291421665.833010.831.41%1.46%
2–34662289,852.33369,030.204535281,931.05358,951.091277921.2810,079.112.73%2.73%
3–41731289,523.89295,763.681651276,190.81282,052.218013,333.0813,711.464.61%4.64%
4–5621227,435.22201,123.33585213,758.66188,666.163613,676.5512,457.176.01%6.19%
5–6256173,501.81136,826.30237160,439.21126,410.631913,062.6010,415.677.53%7.61%
6–7128143,411.68103,184.85116129,808.1193,018.011213,603.5710,166.859.49%9.85%
7–876131,031.7382,624.8170120,922.9776,200.67610,108.766424.147.71%7.78%
8–944113,469.6667,596.483898,022.0958,972.12615,447.578624.3513.61%12.76%
9–102278,972.3839,991.281864,495.1132,562.76414,477.277428.5218.33%18.58%
10–1121102,918.6955,810.801574,569.5239,265.61628,349.1716,545.1927.55%29.65%
11–121382,716.2143,245.58957,368.1129,691.39425,348.1013,554.1930.64%31.34%
12–131079,822.4737,244.55864,188.1429,090.07215,634.338154.4819.59%21.89%
13–1413134,382.7158,804.1912124,591.6655,514.3319791.053289.857.29%5.59%
14–15785,880.4229,111.20560,229.6419,677.14225,650.789434.0629.87%32.41%
15–16579,281.50 29,440.52 464,731.25 22,970.98114,550.26 6469.5318.35%21.97%
16–17579,281.50 32,192.50 473,305.12 25,505.38 15976.38 6687.11 7.54%20.77%
17–185110,734.78 48,231.80 486,852.87 40,792.45 123,881.91 7439.35 21.57%15.42%
18–19377,233.56 31,460.01 125,977.08 13,003.42 251,256.48 18,456.59 66.37%58.67%
19–20396,251.07 30,294.76 263,301.55 19,643.88 132,949.52 10,650.89 34.23%35.16%
S61–25487715.2013,412.425017073.3412,290.6747641.861121.768.32%8.36%
2–335022,557.4128,044.5132821,275.8326,429.65221281.571614.865.68%5.76%
3–416128,366.3526,974.3114224,648.2823,549.24193718.073425.0713.11%12.70%
4–510339,196.3930,939.309335,370.9928,101.40103825.402837.909.76%9.17%
5–66142,482.9829,813.395437,728.0626,450.0174754.923363.3811.19%11.28%
6–73945,776.0028,830.383541,293.7125,896.7244482.292933.669.79%10.18%
7–82134,198.9019,555.061931,135.5818,046.7923063.331508.278.96%7.71%
8–91333,909.1016,717.221026,870.1113,151.4237038.993565.7920.76%21.33%
9–101449,959.8924,831.221140,140.9419,198.6039818.965632.6219.65%22.68%
10–11732,807.8516,136.72522,892.2910,930.5629915.565206.1630.22%32.26%
11–121062,120.8927,582.33637,652.9216,740.58424,467.9610,841.7539.39%39.31%
12–13649,818.2122,236.36433,864.0214,596.28215,954.197640.0832.02%34.36%
13–14442,510.8815,965.30333,026.8112,520.3919484.073444.9122.31%21.58%
14–15338,249.7012,594.01225,036.838389.07113,212.874204.9434.54%33.39%
15–16179,281.506463.2900.000.00115,632.196463.29100.00%100.00%
16–17115,632.194761.2900.000.00115,632.194761.29100.00%100.00%
17–18121,649.365884.2800.000.00121,649.365884.28100.00%100.00%
18–194106,563.7926,574.31127,666.536533.34378,897.2620,040.9774.04%75.41%
19–204123,655.7339,967.66130,877.989860.40392,777.7530,107.2675.03%75.33%
Table 4. Characteristic multifractal parameters of tight sandstones in the K1q4.
No.D1 Δ D D0D1(α)fD0Dmax DminD0
S11.9875 0.3820 0.0125 0.7127 0.7080 0.0323 0.2366
S21.9887 0.5341 0.0113 0.8242 1.3173 0.1066 0.3275
S31.9977 0.4003 0.0023 0.6980 0.8391 0.1078 0.2925
S41.9913 0.2543 0.0087 0.5243 0.9802 0.0668 0.1556
S51.9994 0.2197 0.0006 0.4276 1.1887 0.1454 0.1874
S61.9988 0.1471 0.0012 0.3505 1.0669 0.0988 0.1402
Disclaimer/Publisher’s Note: The statements, opinions and data contained in all publications are solely those of the individual author(s) and contributor(s) and not of MDPI and/or the editor(s). MDPI and/or the editor(s) disclaim responsibility for any injury to people or property resulting from any ideas, methods, instructions or products referred to in the content.

