Article

Deep Learning for Leukemia Classification: Performance Analysis and Challenges Across Multiple Architectures

by
Hari Mohan Rai
1,†,
B. Omkar Lakshmi Jagan
2,
N. Thiruapthi Rao
3,
Thayyaba Khatoon Mohammed
4,†,
Neha Agarwal
5,†,
Hanaa A. Abdallah
6,* and
Saurabh Agarwal
7,*
1
School of Computing, Gachon University, 1342 Seongnam-daero, Sujeong-gu, Seongnam-si 13120, Republic of Korea
2
Department of Electrical and Electronics Engineering, Vignan’s Institute of Information Technology (A), Duvvada, Visakhapatnam 530049, Andhra Pradesh, India
3
Department of Computer Science and Engineering, Vignan’s Institute of Information Technology (A), Duvvada, Visakhapatnam 530049, Andhra Pradesh, India
4
Department of Computer Science and Engineering, VNR Vignana Jyothi Institute of Engineering & Technology, Hyderabad 500090, Telangana, India
5
School of Chemical Engineering, Yeungnam University, Gyeongsan 38541, Republic of Korea
6
Department of Information Technology, College of Computer and Information Sciences, Princess Nourah Bint Abdulrahman University, P.O. Box 84428, Riyadh 11671, Saudi Arabia
7
School of Computer Science and Engineering, Yeungnam University, Gyeongsan 38541, Republic of Korea
*
Authors to whom correspondence should be addressed.
These authors contributed equally as the first author.
Fractal Fract. 2025, 9(6), 337; https://doi.org/10.3390/fractalfract9060337
Submission received: 2 April 2025 / Revised: 15 May 2025 / Accepted: 18 May 2025 / Published: 23 May 2025

Abstract

Leukemia is a very heterogeneous and complex blood cancer, which poses a significant challenge in its proper categorization and diagnosis. This paper aims to introduce various deep learning architectures, namely EfficientNet, LeNet, AlexNet, ResNet, VGG, and custom CNNs, for improved classification of leukemia subtypes. These models provide much improvement in feature extraction and learning, which further helps in the performance and reliability of classification. A web-based interface has also been provided through which a user can upload images and clinical data for analysis. The interface displays model predictions, symptom analysis, and accuracy metrics. Data collection, preprocessing, normalization, and scaling are part of the framework, considering leukemia cell images, genomic features, and clinical records. Using the preprocessed data, training is performed on the various models with thorough testing and validation to fine-tune the best-performing architecture. Among these, AlexNet gave a classification accuracy of 88.975%. These results strongly underscore the potential of advanced deep learning techniques to radically transform leukemia diagnosis and classification for precision medicine.

1. Introduction

Leukemia represents a malignant disease of the blood and bone marrow, which remains a significant health burden globally, resulting in rising rates of morbidity and mortality [1]. The disease is characterized by an uncontrollably high development of aberrant white blood cells, with a wide variety of subgroups included within the disease, each with distinctive morphological, genetic, and clinical characteristics. Effective classification and diagnosis of several types of leukemia are vital for directing suitable treatment plans and enhancing patient outcomes. The classification and diagnosis of leukemia can now be improved with the use of machine learning techniques. Other traditional machine learning methods, like SVMs, Random Forests, and Decision Trees, have been harnessed in the field, with their features originating from a wide array of sources, such as gene expression profiles, cytogenetic abnormalities, and clinical parameters [2,3]. These approaches have achieved only moderate success, and very often, they face limitations because of the complexity and heterogeneity present in leukemia datasets [4]. In this regard, the present study is aimed at proposing a deep learning approach to leukemia image classification. Deep learning is a paradigm shift toward conventional machine learning methods with an emphasis on using highly scalable, efficient, and robust algorithms that can handle huge datasets with high-dimensional features. This, in particular, examines the application of deep learning architecture, including VGG, EfficientNet [5], LeNet, AlexNet [6], Convolutional Neural Networks (CNNs), and ResNet, for leukemia subclass classification [7]. Compared to typical machine learning methods, several deep learning models have several advantages, including the capability to automatically learn hierarchical representations from raw data, adapt to complex data distributions, and generalize effectively to previously unseen samples [8,9]. While deep learning methods use comprehensive data comprising several variables from genomic data, clinical histories, and images of leukemia cells, they can reveal complex patterns and biomarkers associated with different subtypes of leukemia [10,11,12].
This research, with detailed experimentation and review, tries to compare the performance and efficiency of deep learning models with regular machine learning approaches in the classification tasks of leukemia. The results of this study could greatly contribute to the development of precision medicine and personalized health care, enabling more accurate and reliable diagnosis and therapeutic choices for patients with leukemia.
Section 2 summarizes the literature review and clearly includes the problem statement. Section 3 explains the methodology and operation of the proposed model. Section 4 gives the experimental results with clear explanations. Section 5 concludes the proposed methodology.

2. Literature Review
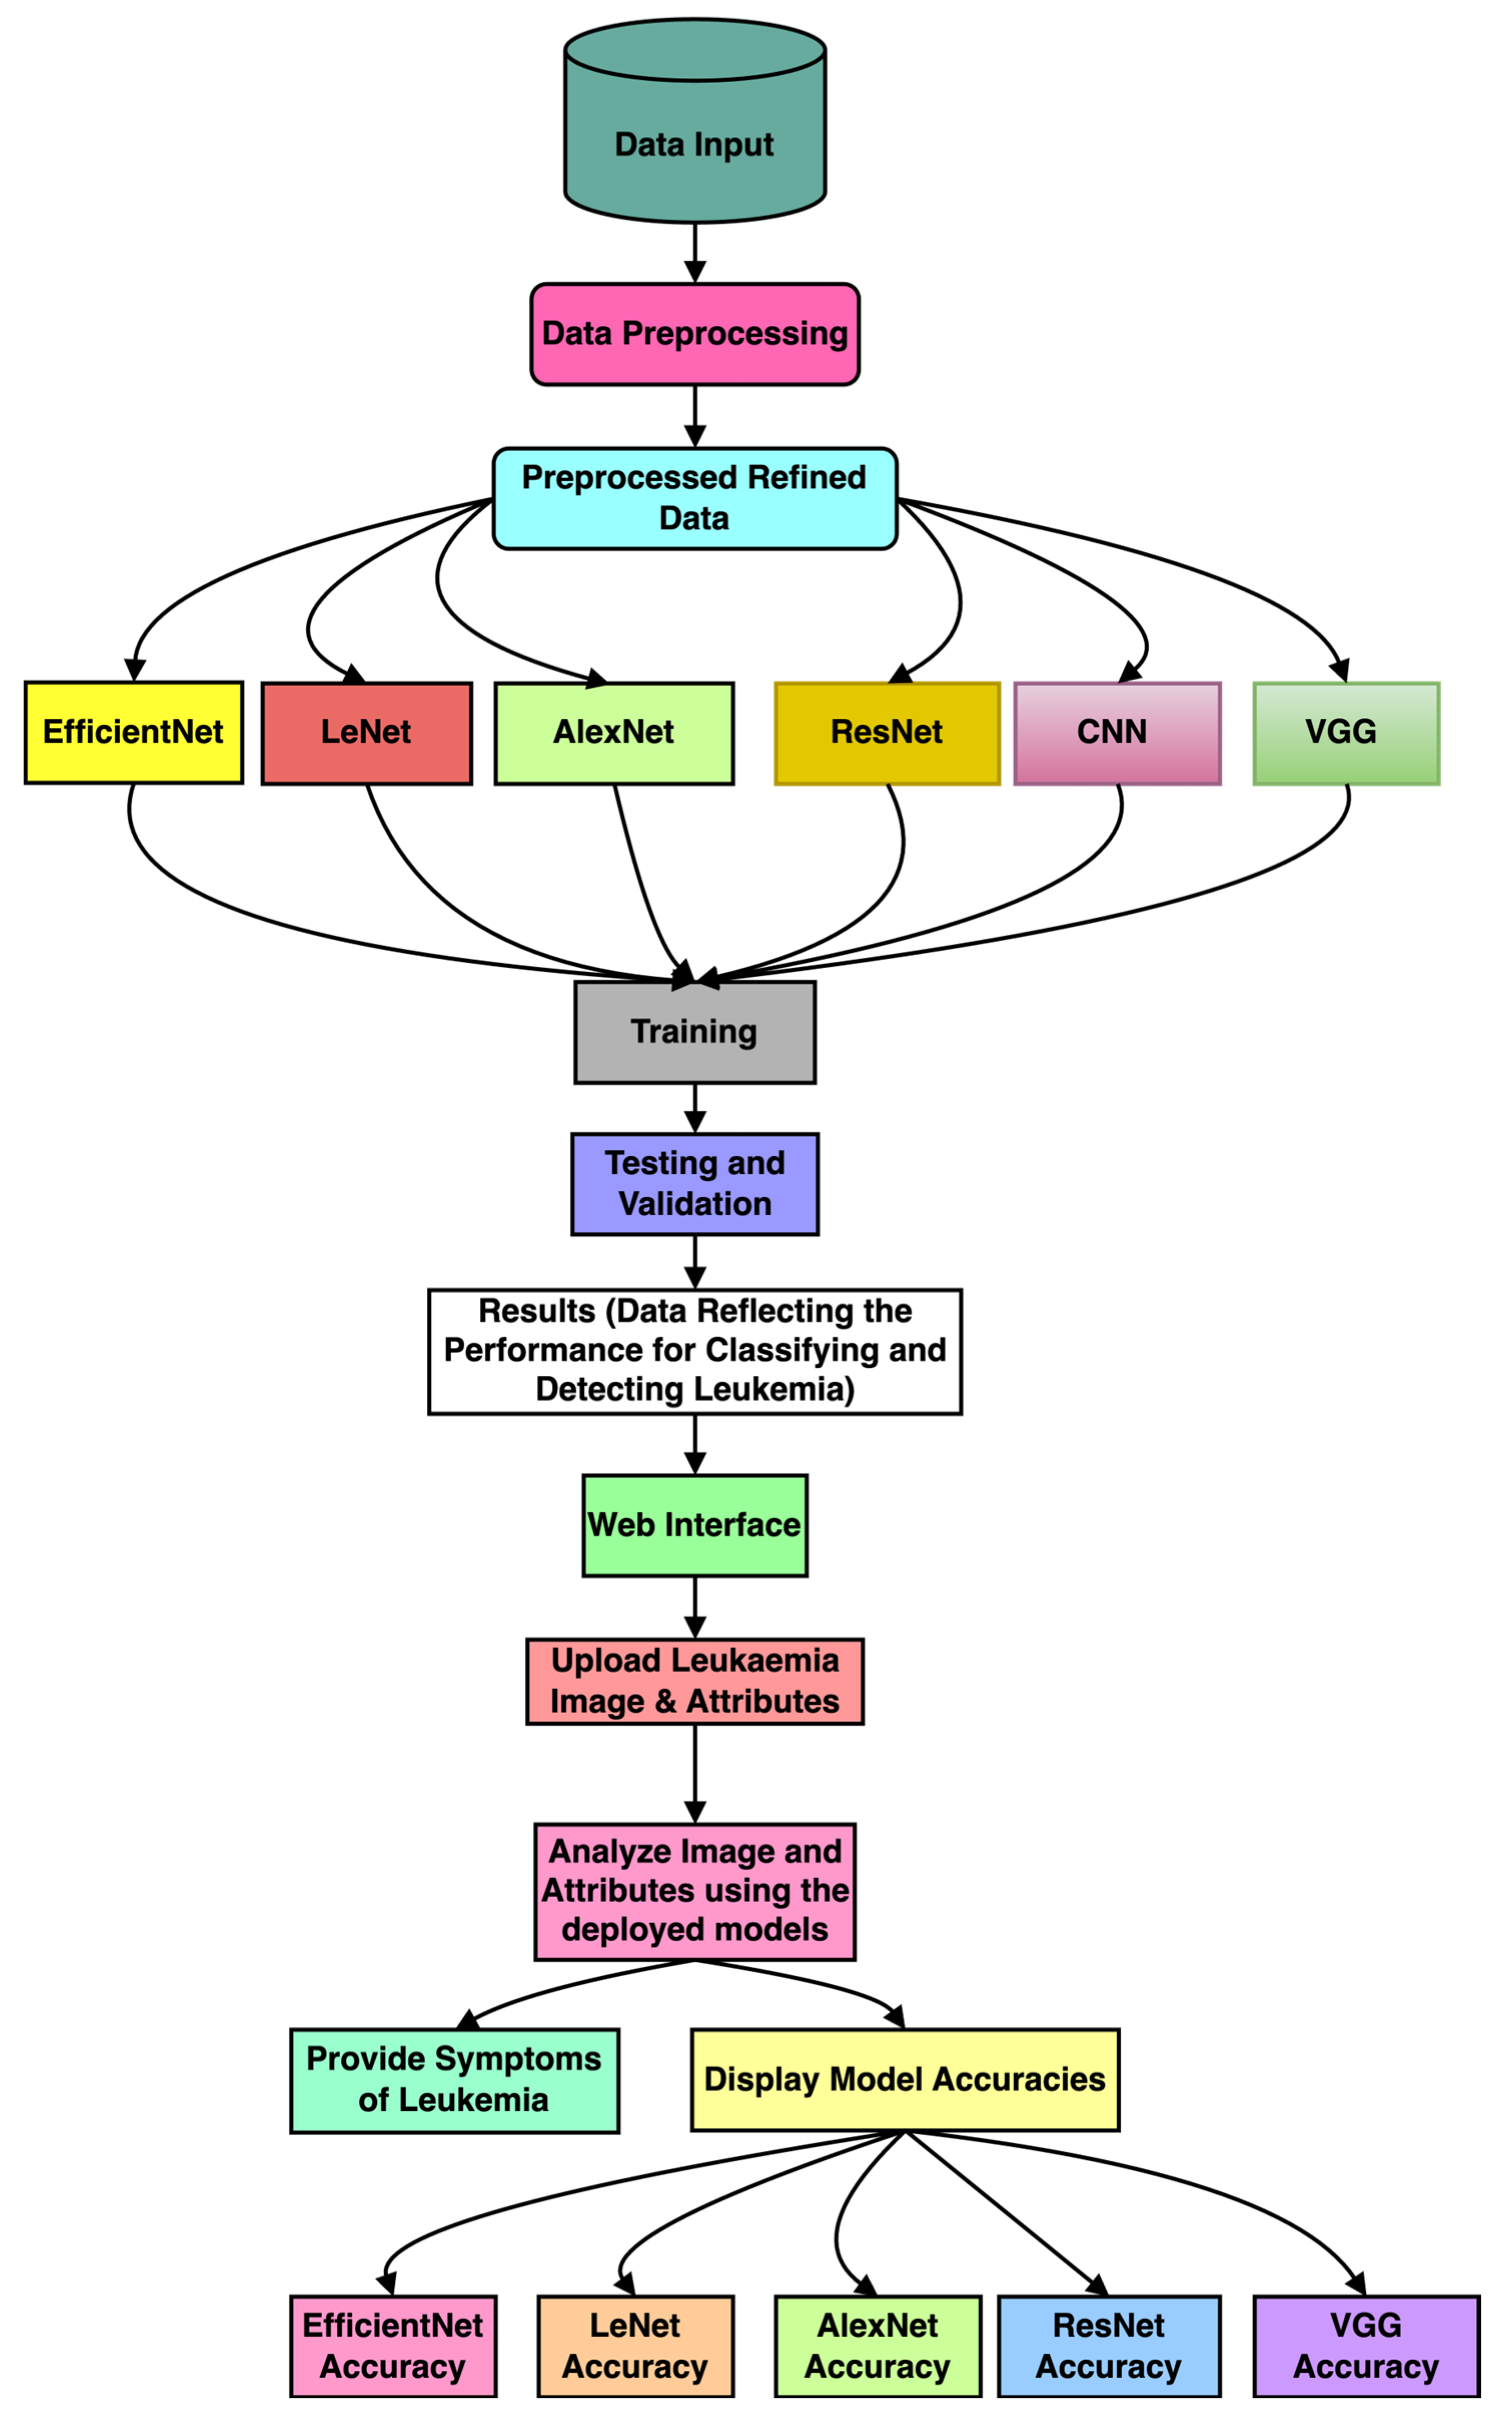
Leukemia is characterized as an illness in which white blood cells multiply abnormally. It is a heterogeneous disease, and this fact complicates the diagnostic process since its heterogeneity can raise numerous questions from the outset. Research has focused on finding more accurate leukemia subtype classification using different machine learning methodologies. This paper briefly presents important studies and methodologies used in this field [13,14,15,16].
Traditional machine learning techniques have been extensively used in leukemia classification tasks. Techniques like Random Forests, Decision Trees, and Support Vector Machines (SVMs) are frequently used. The reviewed studies on conventional ML models for leukemia detection demonstrate a variety of approaches, datasets, and evaluation metrics, as shown in Table 1. ANNs, Random Forests, and SVMs are prominent classifiers applied to features such as morphological, statistical, geometric, and deep features extracted from blood smear images (BSIs). For instance, Bodzas et al. (2020) [17] and Mirmohammadi et al. (2021) [18] achieved accuracies of 0.9752 and 0.9800, respectively, using ANN and Random Forest on private hospital datasets. Similarly, Shahin et al. (2019) [19] used SVM with shape and texture features, achieving 0.9610 accuracy on public ALL_DB datasets. Deep learning-based features with traditional ML have shown exceptional performance. For example, Emam Atteia (2023) [20] achieved an accuracy of 1.0000 using deep features with SVM, and Elhassan et al. (2022) [21] combined CNN-based features with Random Forest, yielding an accuracy of 0.9757. Also, N. M. Deshpande et al. (2024) [22] used RF with DenseNet-based deep features and achieved 0.9600 accuracy, 0.9700 precision, and 0.9700 sensitivity on the ALL-IDB1 and ALL-IDB2 datasets. However, challenges persist, including limited dataset sizes (Bodzas et al., 2020) [17], over-reliance on private datasets (Mirmohammadi et al., 2021) [18], and variability in reported metrics. While deep features have improved classification performance (in most cases), dataset diversity and scalability remain critical areas for improvement.
Since deep learning methods (Table 2) have become more popular, researchers have started to explore their potential in leukemia classification tasks. Deep learning techniques have been extensively applied in leukemia classification tasks, demonstrating diverse approaches and promising results. Techniques like SCA-CNN, ViT-CNN, AlexNet, and ResNet have been effectively utilized with datasets such as ALL-IDB, Kaggle, and C-NMC 2019, achieving high accuracies. For instance, Talaat & Gamel (2023) [29] achieved 0.9999 accuracy using AlexNet on the C-NMC 2019 dataset, and Jawahar et al. (2024) [30] reported a perfect 1.0000 accuracy using DDRNet on Kaggle data. Hybrid approaches combining CNNs with traditional classifiers, like SVM with HOG features (C. Zhang et al., 2020) [31] and DG-CNN (Zare et al., 2024) [32], have shown significant potential, achieving accuracies of 0.9593 and 0.9940, respectively. Despite the advancements, challenges remain, including reliance on private or limited datasets (Ul Ain et al., 2022) [33], overfitting risks in models with high reported metrics (Talaat & Gamel, 2023) [29], and the need for generalization across diverse datasets. While deep learning models have significantly improved performance, achieving scalability and handling data variability continue to be critical areas for future exploration.
Although the machine learning methods reported encouraging results, some challenges remain regarding leukemia cancer classification. Some of the critical challenges the researchers face are limited annotated dataset availability, class imbalance, and deep learning model interpretability. These challenges provide the opportunity for future research directions, such as proposing novel algorithms, integrating multi-omics data, and incorporating clinical domain knowledge into machine learning models [40,41].

3. Methodology

This section presents the methodology used for detecting leukemia from the microscopic image dataset and implementing a web interface. Figure 1 illustrates the block diagram of the utilized methodology, and the following subsections provide a detailed explanation of each stage.

3.1. Preprocessing

We have utilized various types of data preprocessing, which enhances the quality and consistency of the raw input data. Also, it prepares the dataset for effective and efficient training of the DL models. In this work, we have applied the following preprocessing techniques:
Normalization: We first normalized and standardized the input microscopic image pixels to the range [0, 1], which minimizes variations due to different illumination levels and ensures compatibility with DL models. The equation gives the utilized normalization technique:
I norm x , y = I x , y I min I max I min
This process also maintains consistency in the input data distribution and reduces the potential biases.
Resizing: The dataset contains images of various sizes and with varied resolutions. To ensure uniformity, we applied a resizing technique to standardize the uniformity (224 × 224) of all the images. This step provides the compatible image sizes for the CNN models while preserving the spatial information; the equation gives this:
I resized u , v = I u W W orig , v H H orig
where W o r i g , H o r i g and W , H are the original and target image dimensions, respectively. u , v are the coordinates in the resized image, and the values are interpolated from the original image.
Rotation: Images were rotated randomly within a range of (±20°). The rotation transformation can be expressed as follows:
x y = cos θ sin θ sin θ cos θ x y
where x , y are the original pixel coordinates, x , y are the rotated pixel coordinates, and ( θ ) is the rotation angle.
Zoom: We applied random zoom within a scale range of 0.8,1.2 . The zoom operation scales pixel positions as follows:
x y = s · x y
where s is the scaling factor.
Horizontal flipping (HF): We applied HF, where images were flipped along the vertical axis to simulate variations in orientation. Mathematically, this operation reflects pixel positions as follows:
x = W x     and   y = y
where W is the image width. By applying these transformations, we artificially increased the dataset’s diversity, effectively addressing class imbalance and variability.

3.2. Selection of Optimal Deep Learning Architectures for Leukemia Detection

We utilized various deep learning architectures, VGG, EfficientNet, LeNet, AlexNet, CNN, and ResNet, for leukemia detection. These designs are appropriate choices for our investigation because they provide different levels of depth, complexity, and computing efficiency. The selection of optimal architecture(s) will be guided by considerations such as model complexity, generalization ability, and computational resources [28,29,42]. Table 1 clarifies the complete comparison of deep learning techniques used.

3.2.1. VGG (Visual Geometry Group)

VGG is a deep convolutional neural network architecture that is prominent for its simplicity and efficacy. It is composed of many convolutional layers with gradually increasing depth, followed by max-pooling layers. VGG architectures, such as VGG16 and VGG19, are frequently employed for image classification applications. In the context of leukemia classification, VGG can be employed to analyze leukemia cell images and extract discriminative features related to cell morphology and structure [43].

3.2.2. EfficientNet

EfficientNet represents a family of CNN architectures that, for the first time, attained state-of-the-art results while requiring an order of magnitude fewer parameters than conventional architectures. Balancing network depth, width, and resolution can achieve efficient and accurate models in EfficientNet designs [5]. In leukemia classification, EfficientNet can efficiently analyze large-scale image data, where relevant features are derived from leukemia cell images with minimal computational overhead.

3.2.3. LeNet

One of the first convolutional neural network techniques for handwritten digit recognition is LeNet, developed by Yann LeCun. Convolutional layers are the first and are followed by fully connected and average pooling layers. LeNet has proven to perform well on several picture classification tasks in spite of its simplicity [40]. Regarding LeNet in leukemia classification, it analyzes cell pictures and extracts information related to various subtypes of leukemia based on cell morphology and texture.

3.2.4. AlexNet

Rising to prominence in the aftermath of its victory in the 2012 ImageNet Large-Scale Visual Recognition Challenge (ILSVRC), AlexNet is a deep convolutional neural network design. Convolutional layers are the first, followed by fully connected and max-pooling layers. AlexNet is prominent for its effectiveness in image classification tasks, particularly on large-scale datasets [44,45]. In leukemia classification, AlexNet can be utilized to analyze diverse image modalities, such as peripheral blood smear images or bone marrow aspirate slides, to extract informative features for subtype classification.

3.2.5. Convolutional Neural Networks (CNNs)

CNNs are a subclass of deep neural networks created to manage structured, grid-like input, such as images. Convolutional layers, activation functions, pooling layers, and fully connected layers are the standard components of the CNN architecture [45]. CNNs can easily learn hierarchical representations from raw, unprocessed pixel data, making them well suited for image classification tasks. In leukemia classification, CNNs can be employed to analyze leukemia cell images and extract features indicative of different leukemia subtypes based on cell morphology, staining patterns, and other visual cues.

3.2.6. ResNet (Residual Network)

ResNet is a deep CNN architecture defined by residual connections that can make training incredibly deep networks possible and solve the vanishing gradient problem [46]. ResNet architectures, such as ResNet50 and ResNet101, have demonstrated superior performance on various image recognition benchmarks [47]. In leukemia classification, ResNet can analyze high-resolution cell images and capture intricate features associated with different leukemia subtypes, effectively leveraging its ability to learn complex representations from raw pixel data.
This work presents a systematic performance analysis that considers several deep learning architectures, such as VGG, EfficientNet, LeNet, AlexNet, CNN, and ResNet (Table 3). It characterizes the model’s performance for leukemia cell classification with high granularity. This comparative framework provides significant insight into the strengths and limitations of each model when applied to medical imaging and is a valuable contribution to the field. Future work will investigate the integration of transfer learning and ensemble methods to improve model performance and innovation further.

3.3. Feature Extraction and Representation

Deep learning models have proven very effective for automatically learning hierarchical representations from raw and unstructured data. For the classification of leukemia, feature extraction from heterogeneous data modalities, including gene expression profiles, cytogenetic abnormalities, and clinical parameters, can be explored. In this manuscript, we have considered an image dataset for leukemia classification. Transfer learning techniques, such as fine-tuning pre-trained models using leukemia-specific datasets, will be used to fully exploit knowledge learned from related tasks and domains.

3.4. Model Training, Validation, and Evaluation

The chosen deep learning architecture shall then be trained using the preprocessed datasets with appropriate optimization algorithms and loss functions. The HPC infrastructure shall be leveraged for training to guarantee faster convergence and to handle the computational load that a typical deep learning model requires. Model performance shall be evaluated through standard metrics such as accuracy, precision, recall, and F1-score. Robustness and generalization shall be evaluated by applying stratified cross-validation.

3.5. Interpretability and Visualization

The interpretability of deep learning models is necessary for providing insights into the mechanism underlying leukemia classification. Gradient-based visualization, activation maximization, and attention mechanisms are some techniques that may be used to interpret and understand model predictions. Additionally, feature importance analysis and saliency mapping may identify which discriminative features have helped the model reach a particular classification decision.

4. Experimental Results

The Leukemia Classification dataset used in our study consists of 12,528 high-resolution images categorized into two classes: ALL cancers (8491 images) and No Leukemia (4037 images). Each image in this dataset is labeled accordingly, which makes it robust enough for the training and evaluation of classification models. Indeed, the images contain Peripheral Blood Mononuclear Cells (PBMCs) with a stain to outline the cellular features properly [48]. Images also have enough details to be visually classified correctly. The high-quality annotations and diverse representation across subtypes make this dataset an invaluable resource for developing and evaluating deep learning models tailored to leukemia detection. Furthermore, the heterogeneity and substantial volume of data ensure that the models trained on this dataset can generalize effectively, accurately distinguishing between subtypes under various conditions [48,49,50,51,52].
The proposed steps in data preprocessing ensure that the images are optimally prepared for model training. Normalization of the pixel values in the range [0, 1] standardized the input data. The images were resized to 224 × 224 pixels to make them consistent for different models and to enable similar evaluation performances. Rotation, zoom, and horizontal flipping were some of the augmentation methods applied: rotation up to ±20 degrees, zooming from 0.8 to 1.2 times, and horizontal flipping. By giving this information, we ensure our dataset description is complete and that other researchers who wish to replicate this study will be able to do so with precision and verify our results.
The hyperparameter tuning process was accordingly carried out by cautiously designing every aspect of this process to bring the best performance to the model. The learning rate was fixed at 0.001 for all five epochs, thus yielding a stable and efficient convergence during the training process. The batch size was set to 40 across all models—EfficientNet, ResNet, VGG, LeNet, AlexNet, and CNN—to balance memory usage with convergence speed. Each of these models was trained for five epochs to optimize learning without the risk of overfitting. For all the models, the Adam optimizer was used because of its adaptive learning rate capabilities that enhance the convergence speed and overall performance.
The six deep learning models under consideration were allowed to interact with various training and testing datasets. The accuracy of the models in correctly predicting the presence or absence of leukemia in their training and validation phases was recorded and plotted in graphs. In contrast, the confusion matrices were plotted in order to understand how precise and sensitive the models were during the classification process. The precision, recall, and F1-score of each model were also calculated and tabulated to understand their efficiency and their potential performance in real-world applications. A brief explanation of the front-end user interface of the application is also given, along with diagrams, for better understanding. The observations for each of the six models and the user interface are listed in detail below.

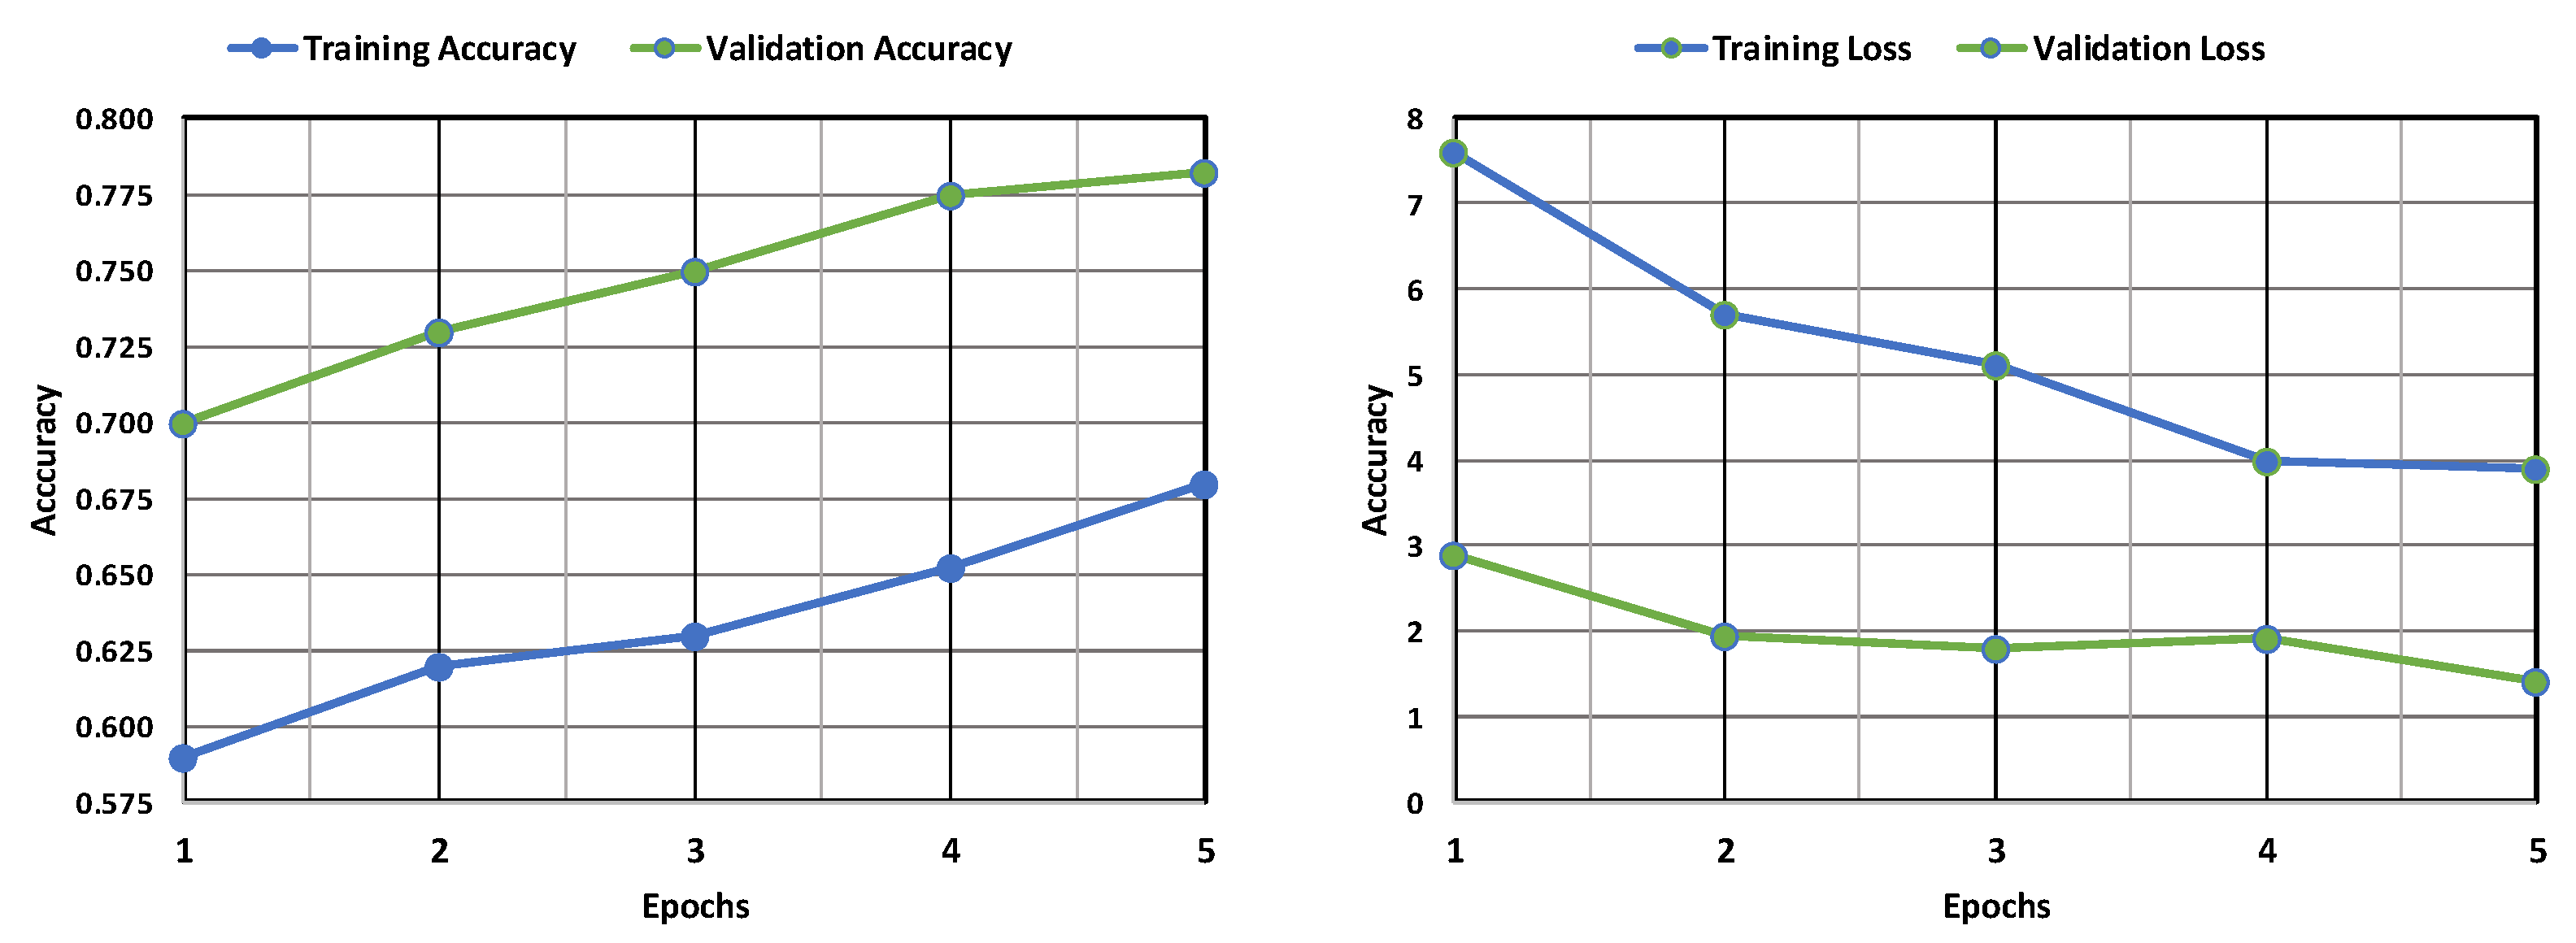
4.1. VGG Model Performance

The VGG model’s deep architecture allows it to learn complex patterns in the images, which is crucial for identifying subtle differences between healthy and leukemic cells. The training accuracy is lower than the validation accuracy, which suggests that the model may fit the training data. The validation loss is decreasing, which suggests that the model is learning from the training data, as shown in Figure 2. The confusion matrix displayed in Figure 3 shows how well a VGG model classified leukemia. The model correctly identified most cases (955 positives, 279 negatives) but also made mistakes (136 false positives, 230 false negatives). These errors, especially missed cases, highlight areas for improvement.

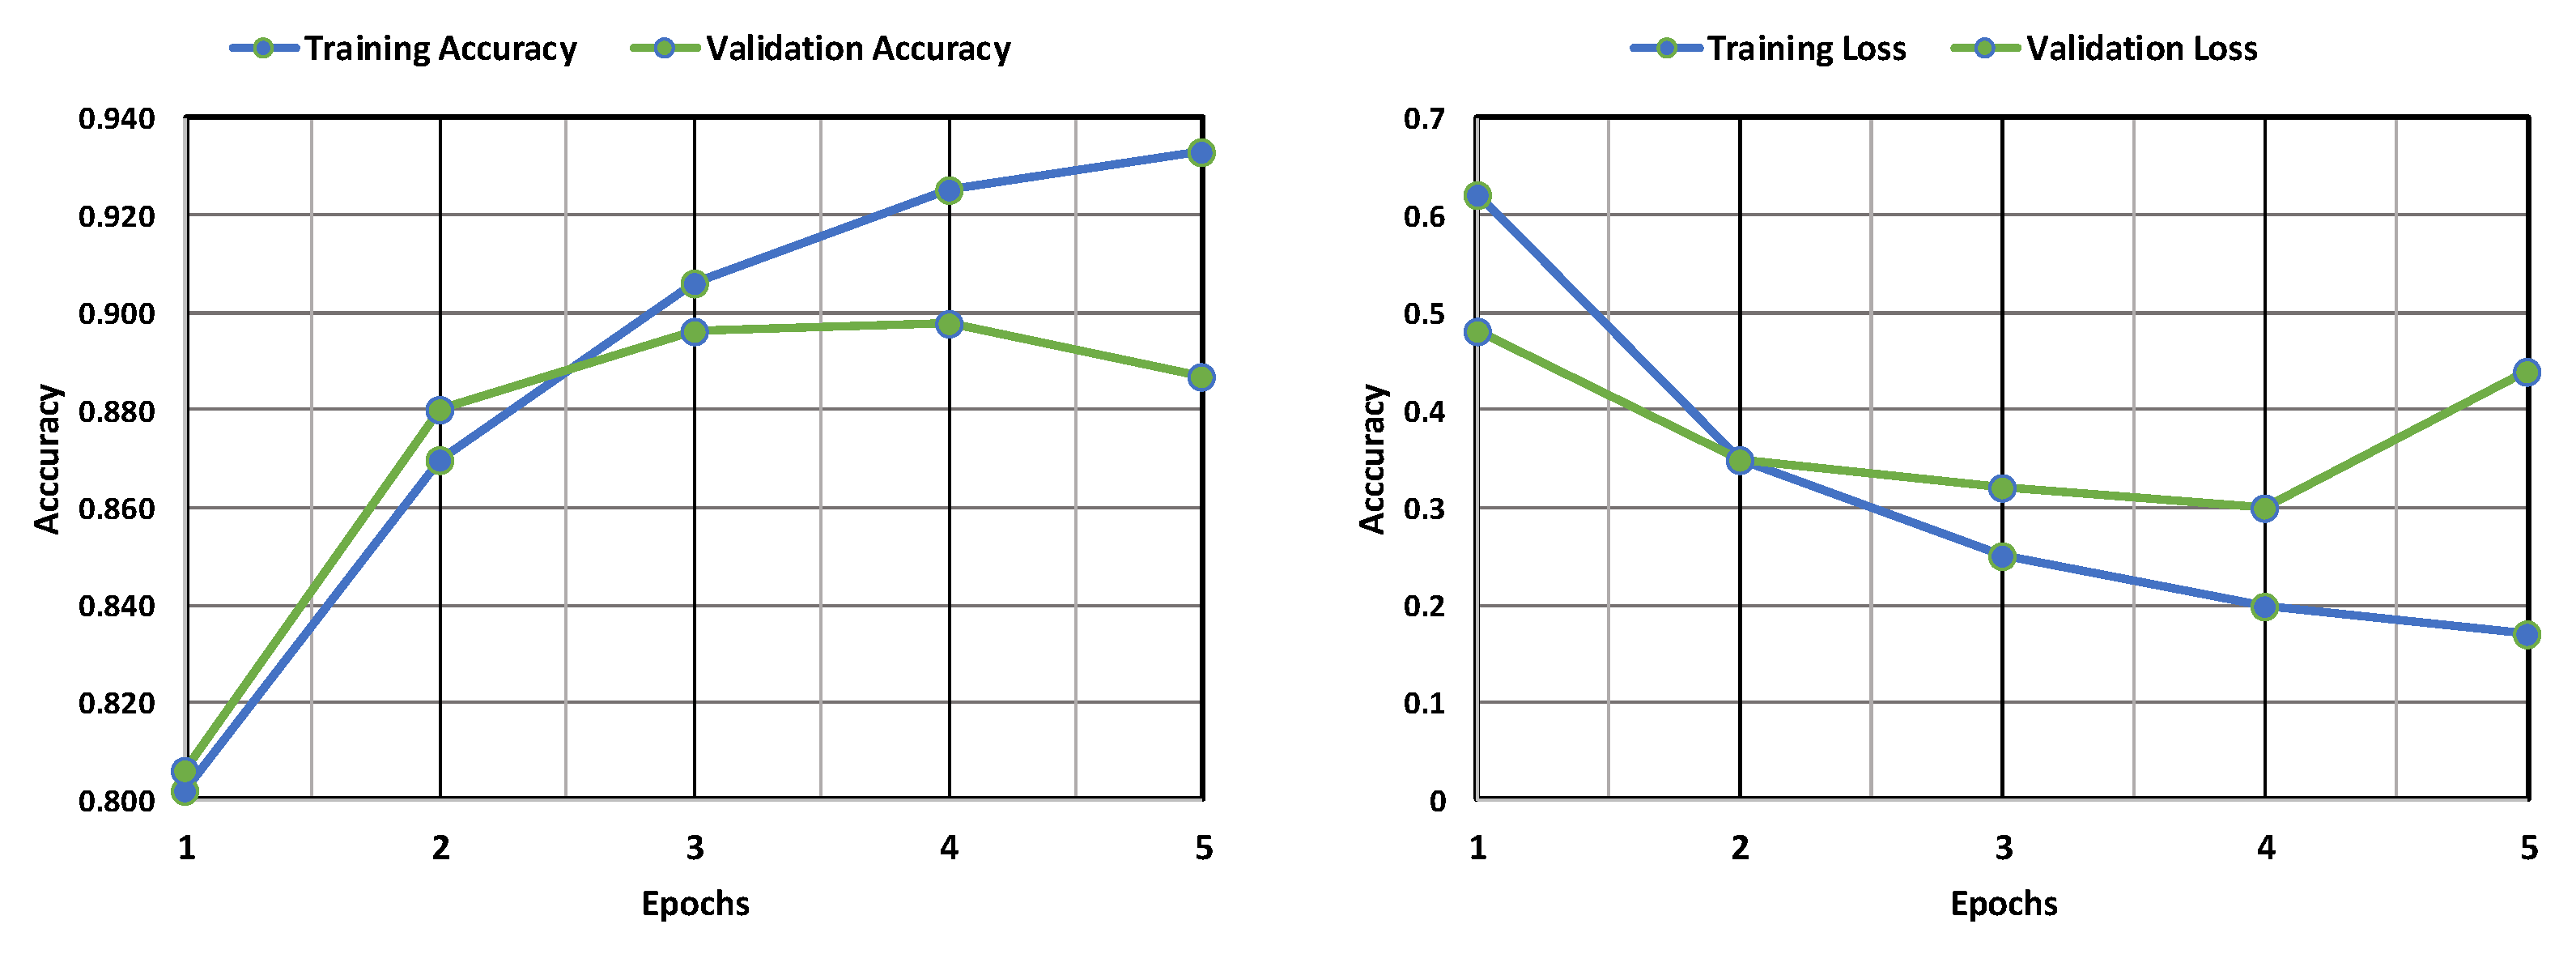
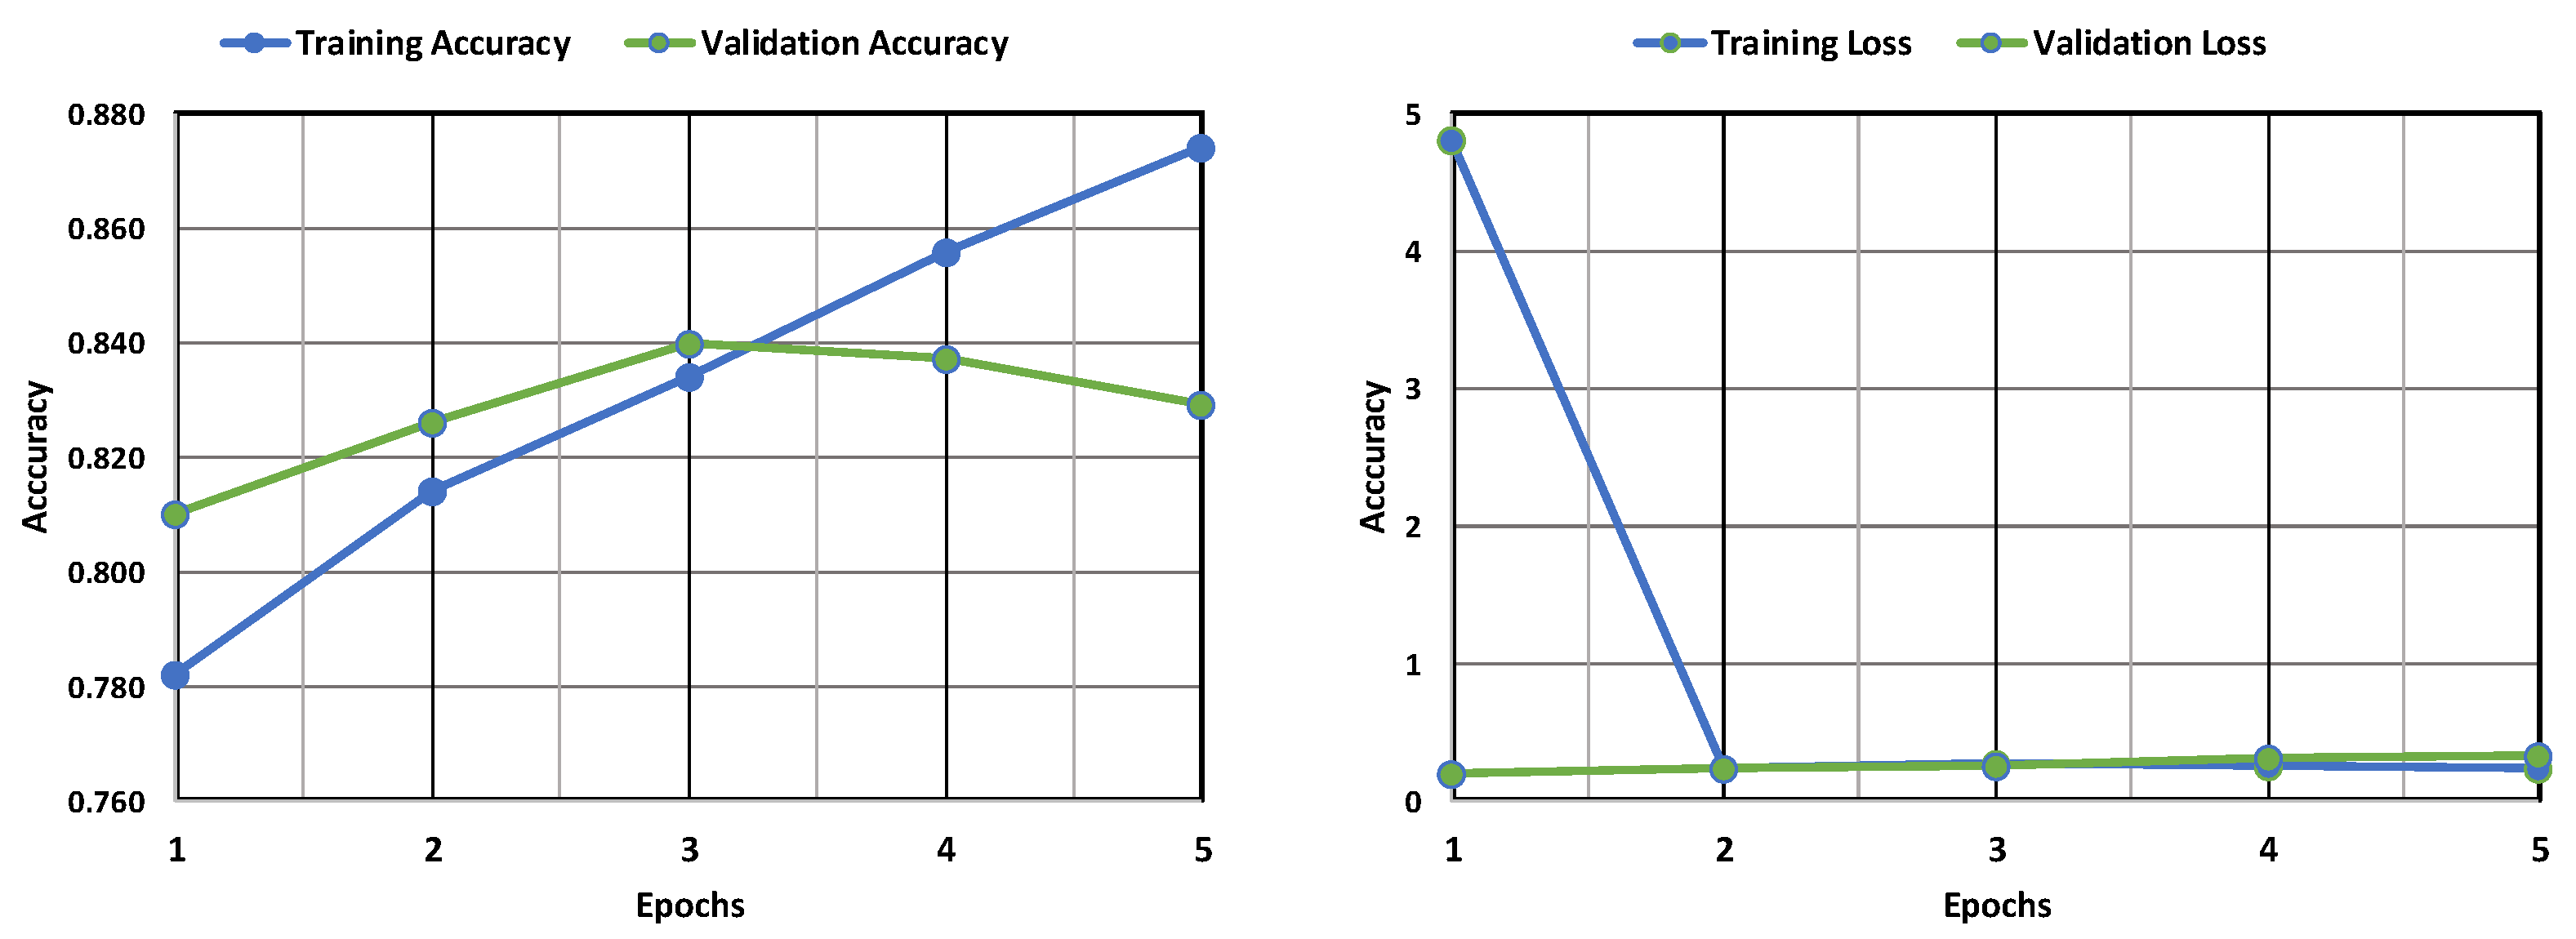
4.2. EfficientNet Model Performance

Figure 4 shows the training and validation accuracy and loss of the EfficientNet model. The accuracy of the training model is found to increase with an increase in epochs, while the validation accuracy is lower than that of the former and sees a dip. The loss is found to be less in the training phase as compared to the validation phase, which sees a slight increase in its loss after decreasing with an increase in epochs. This indicates that the model performed better in its training phase, with more accuracy and less loss than in the validation phase. Figure 5 depicts the confusion matrix obtained after training the EfficientNet model. The model achieved good results, correctly identifying 1085 positive cases and 278 negative cases. There were a few errors: only 6 false positives (predicting leukemia when absent) and 231 false negatives. While the overall performance is promising, minimizing these false negatives remains crucial for accurate diagnosis.

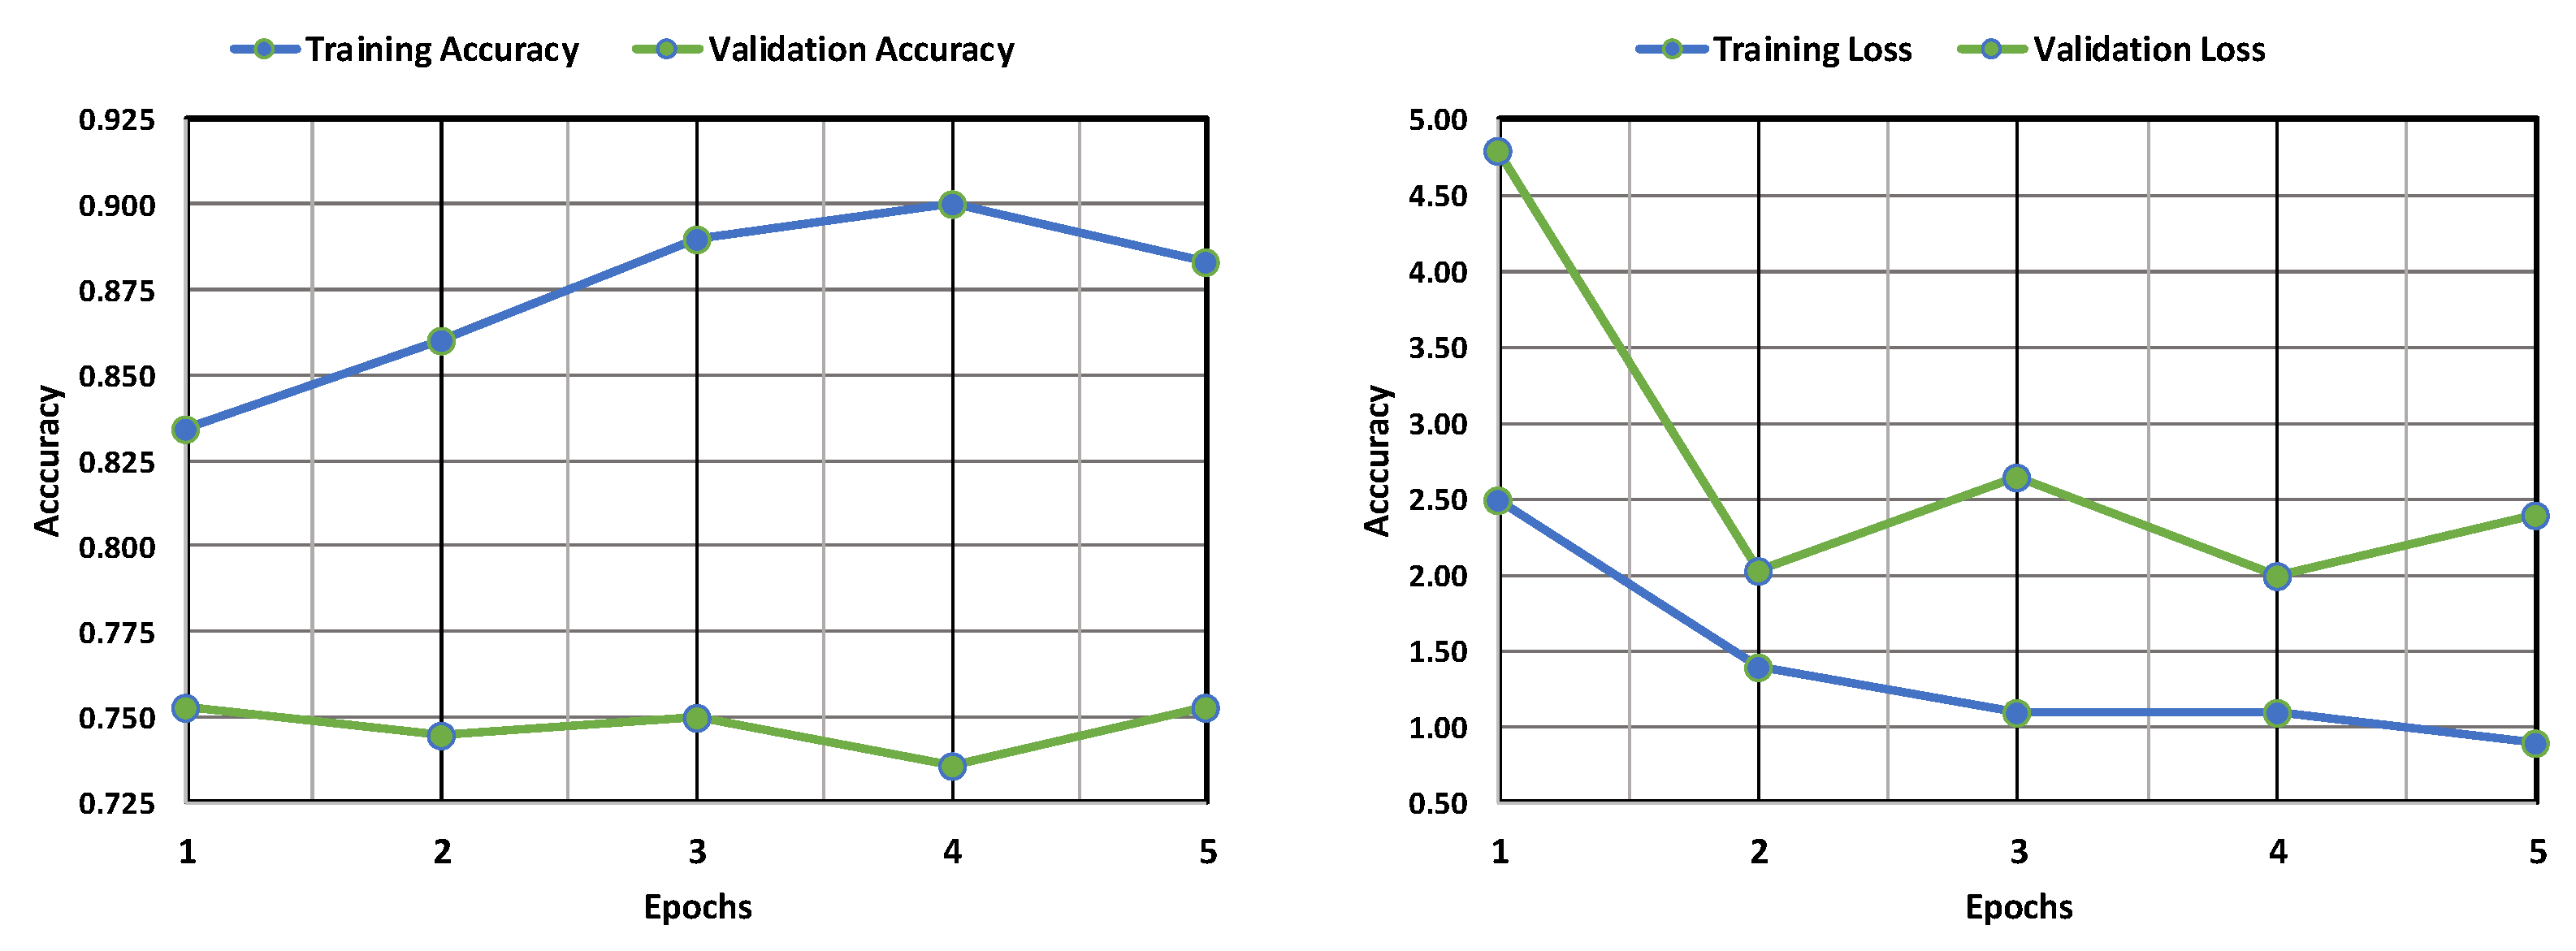
4.3. LeNet Model Performance

Figure 6 displays the accuracy and loss of the LeNet model. The training accuracy sees an increase and is found to be much higher than the validation accuracy, which shows a dip with an increase in the number of epochs. The training loss is found to be less than the validation loss, but the validation loss is found to experience a decrease by a large margin with an increase in epochs. It can be inferred that the model has more accuracy and less loss in the training phase than the validation phase, but the loss of the validation phase is minimized with an increase in epochs. Figure 7 shows the confusion matrix obtained after training the LeNet model. The model identified most cases accurately (1079 positive, 319 negative). However, there were some errors. The model incorrectly flagged 12 patients for leukemia (false positives) and missed 19 actual cases (false negatives).

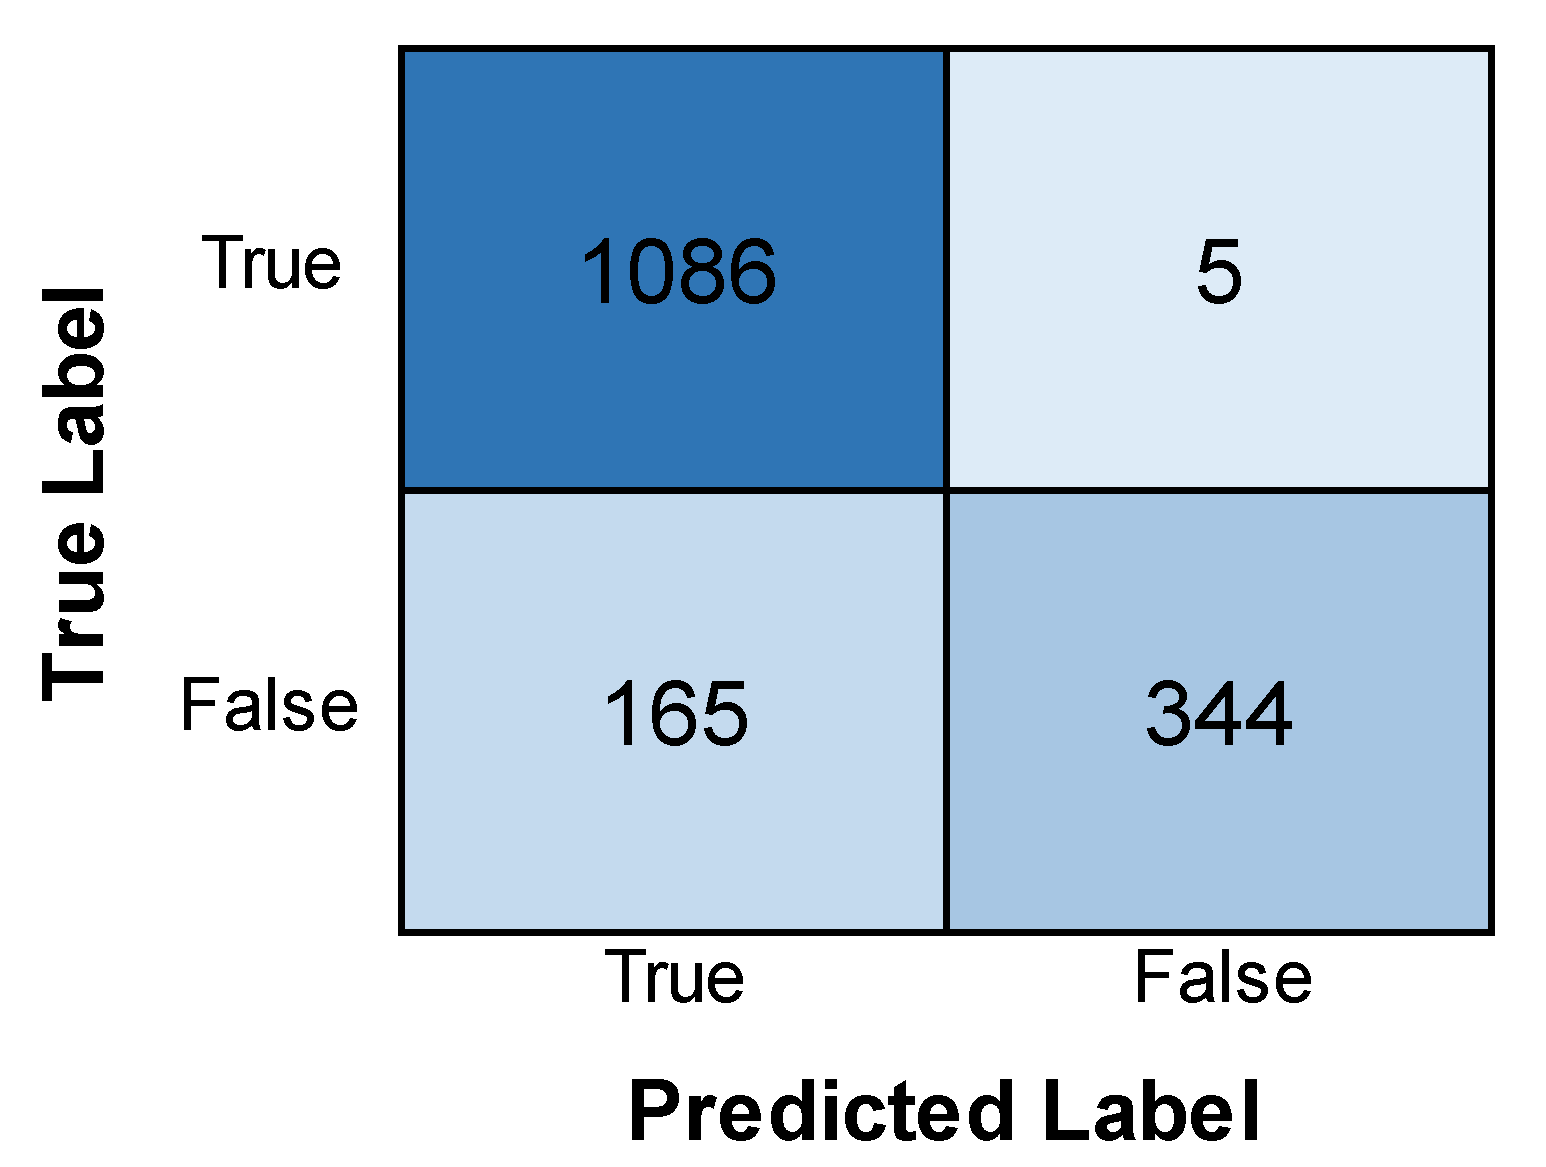
4.4. AlexNet Model Performance

The AlexNet model’s training and validation accuracy and loss are shown in Figure 8. Both the training and validation accuracy are found to increase with an increase in epochs, although the validation accuracy remains less than the training accuracy. Similarly, both the training and validation losses are found to decrease with an increase in epochs, but the training loss remains far less than the validation loss. This implies that the model is more accurate in its training phase than in its validation phase. Figure 9 depicts the confusion matrix obtained after training the AlexNet model. The model performed well, correctly identifying 1086 positive cases and 344 negative cases. There were minimal errors, with only 5 false positives (incorrectly predicting leukemia) and 165 false negatives (missing actual leukemia). While the results are encouraging, further investigation into reducing false negatives can optimize the model’s accuracy.

4.5. CNN Model Performance

Figure 10 depicts the accuracy of training and validation and the loss of the CNN model. From the graph, it can be observed that the validation accuracy experiences an increase and then a decrease with an increase in epochs, while the training accuracy experiences only an increase and remains higher than the former. Also, the validation loss is found to be considerably less than the training loss, indicating minimal errors in the validation phase. The training loss, though initially very high, experiences a stark decrease with an increase in epochs till it becomes less than the validation loss. This implies that although the model still performs better in its training phase, the validation phase shows a better performance in this model than the others, as the loss is much lower. Figure 11 depicts the confusion matrix obtained after training the CNN model. The model successfully identified many cases (946 positives) but also made some errors. It incorrectly flagged 145 patients for leukemia (false positives) and missed 153 actual cases (false negatives). The relatively high number of false positives warrants further examination to improve the model’s precision while also minimizing false negatives for accurate diagnosis.

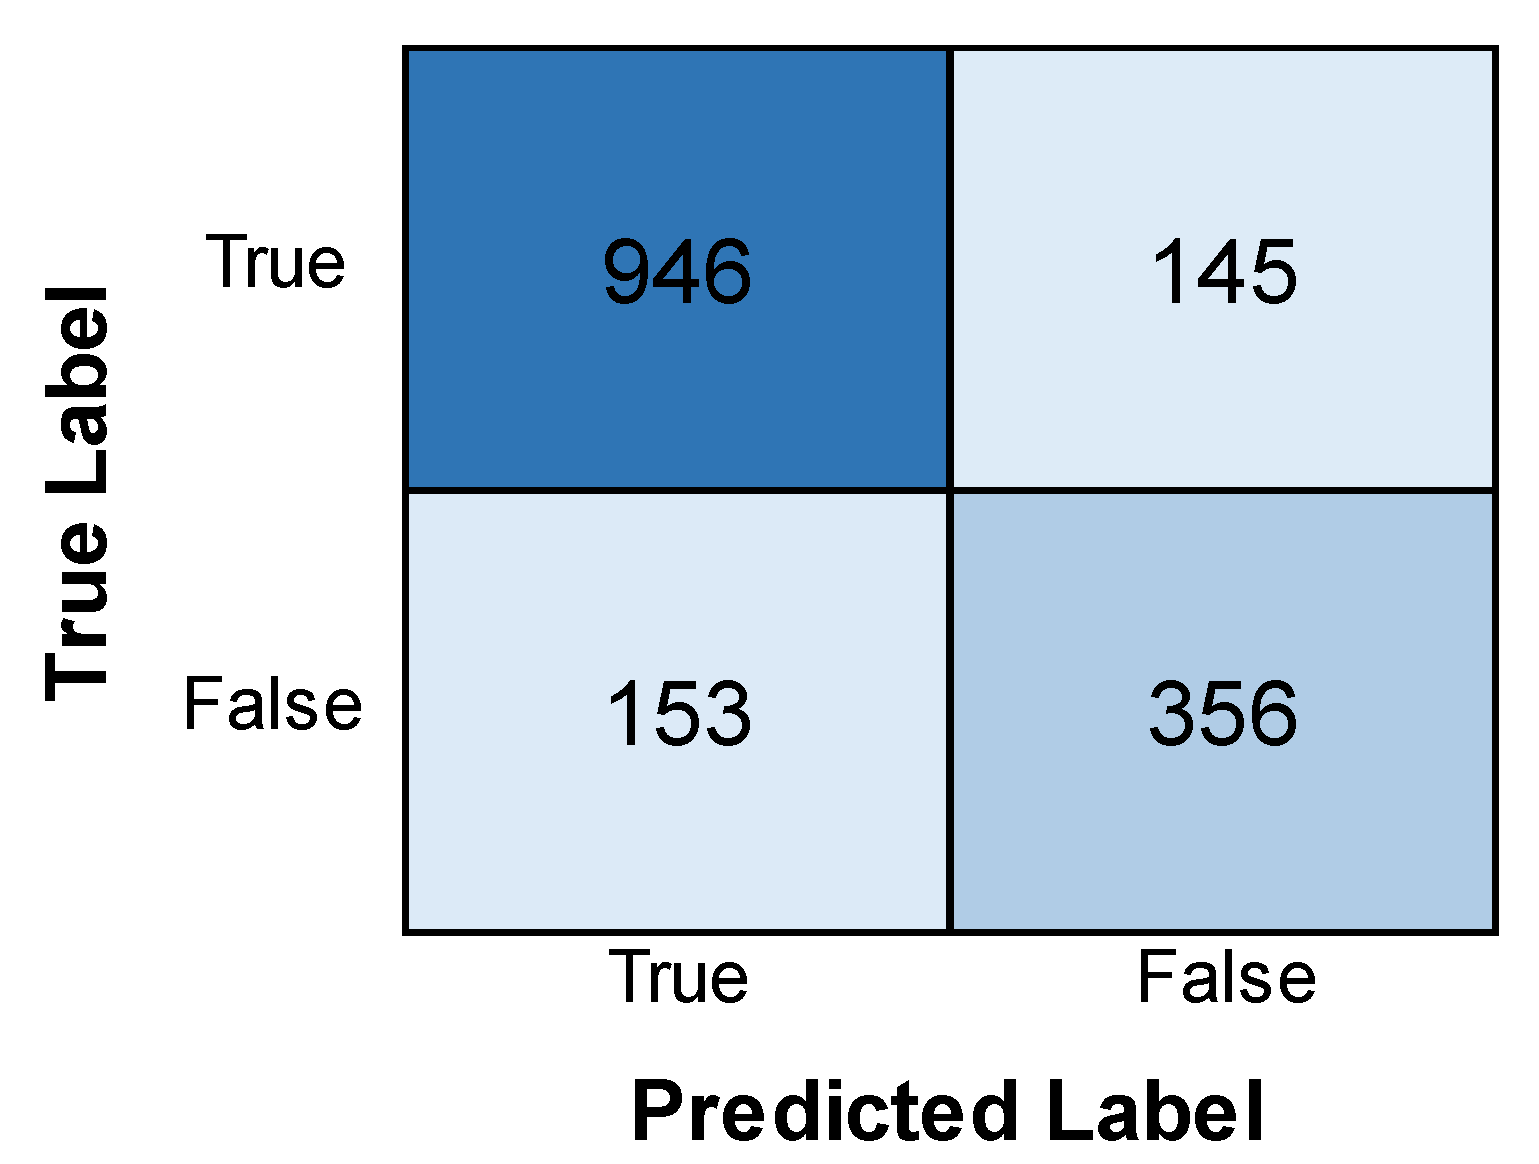
4.6. ResNet Model Performance
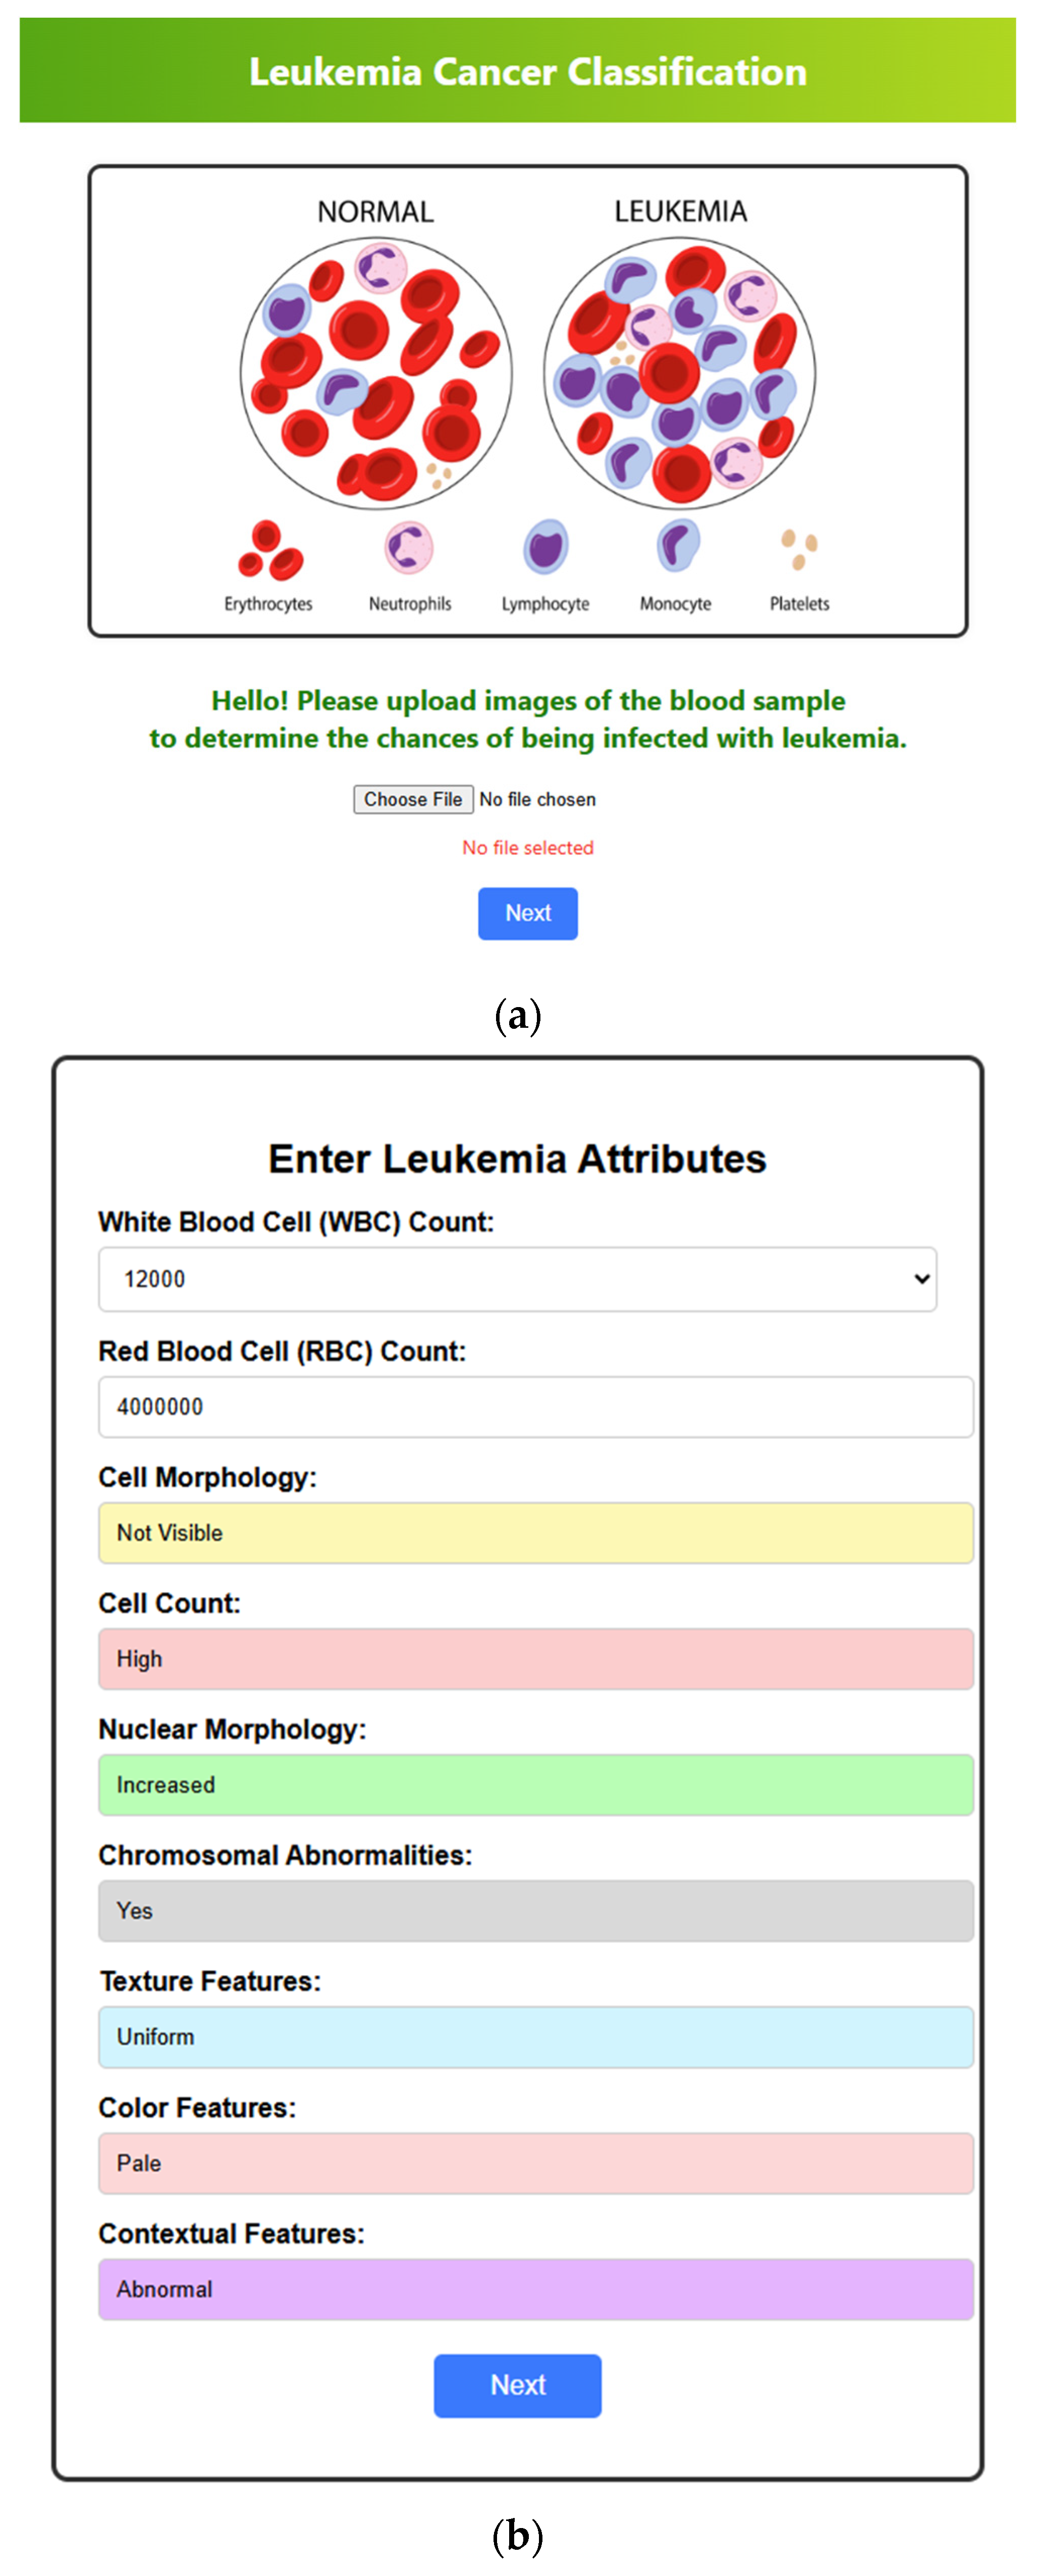
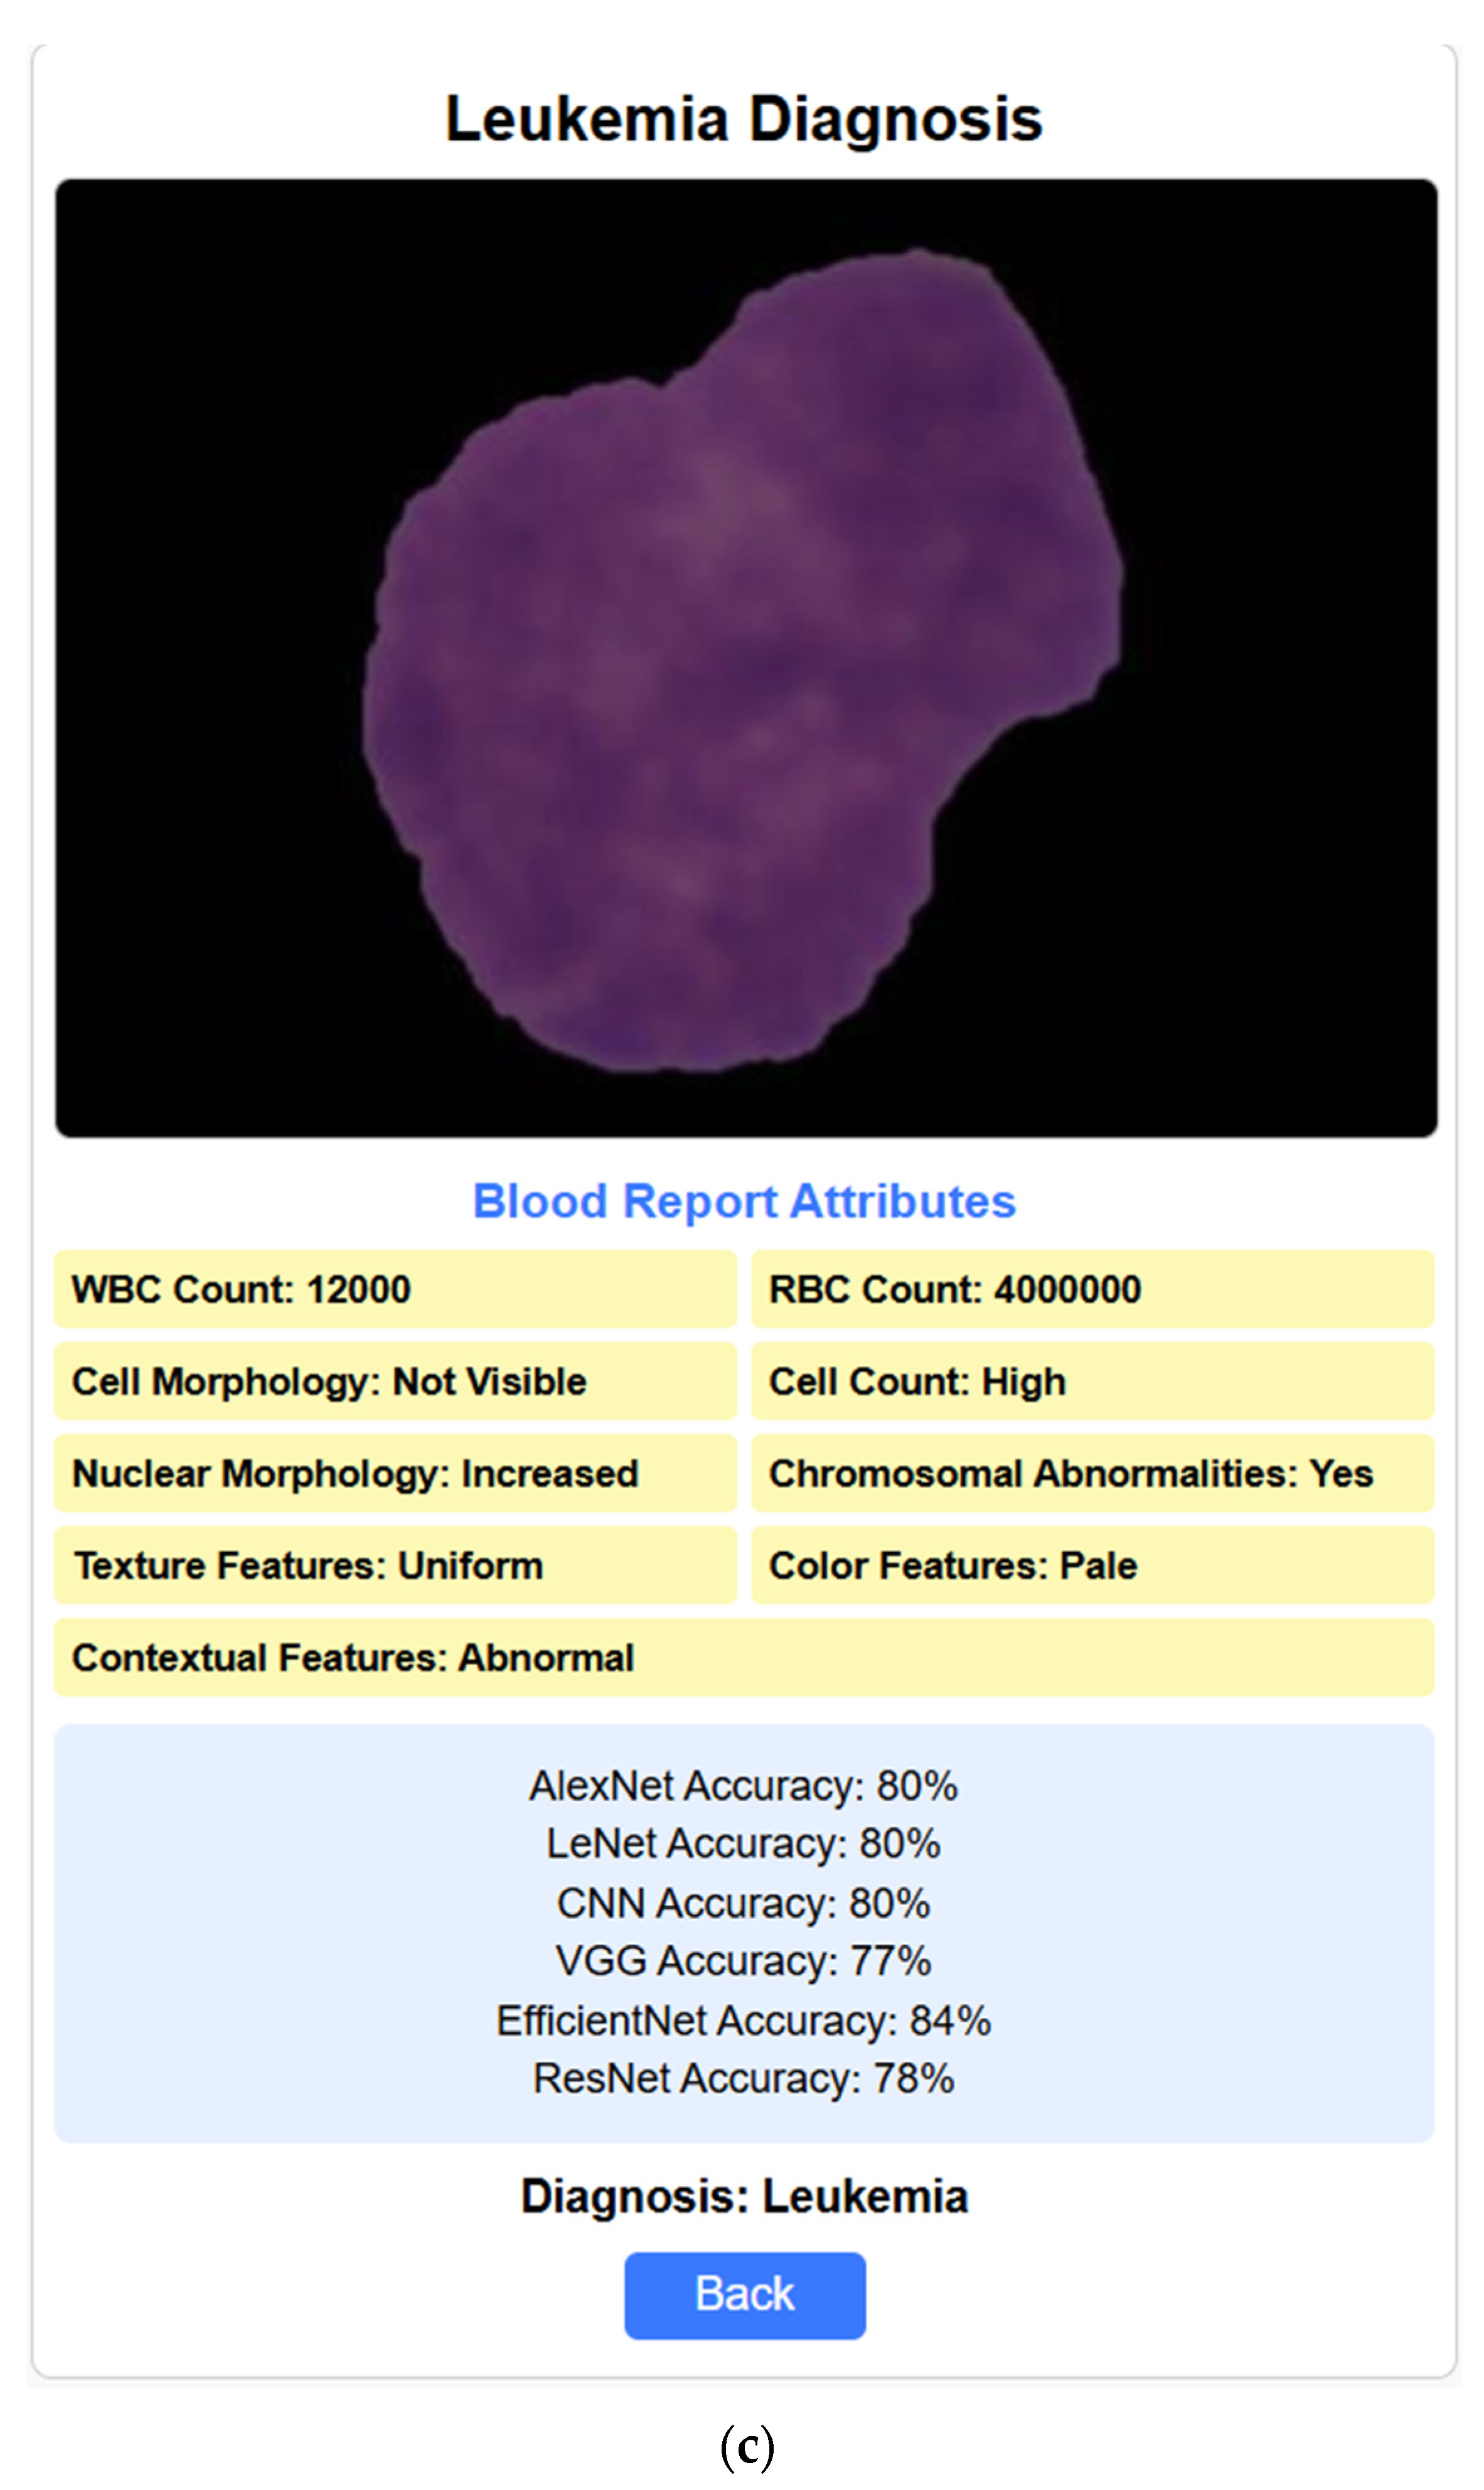
Figure 12 depicts the training and validation accuracy and loss of the ResNet model. The graph shows that while both show an increase with an increase in epochs, the validation accuracy is, in fact, higher than the training accuracy. Also, the validation loss is found to be less than the training loss. The latter, being initially high, is found to experience a stark decrease with an increase in epochs. It can be inferred from this that the ResNet model performs better in its validation phase than in its training phase, with higher accuracy and minimized loss. Figure 13 depicts the confusion matrix obtained after training the ResNet model. The model correctly identified 1034 positive cases and 288 negative cases. However, there were some errors, with 57 false positives (incorrectly predicting leukemia) and 221 false negatives (missing actual leukemia). Minimizing these false negatives is essential for optimizing the model’s effectiveness in real-world diagnosis.
Table 4 describes the evaluation metrics of the six deep learning models. The metrics include accuracy (the rate of correct predictions in the overall model), precision (the ratio of true positive predictions to the total number of positive predictions), recall (the ratio of true positive predictions to the total number of actually positive instances), and F1-score (harmonic mean of precision and recall). The results show that AlexNet is not only superior in terms of accuracy but is also way ahead in terms of precision and recall. AlexNet is followed by LeNet, EfficientNet, ResNet, CNN, and VGG.

4.7. Web Interface

After training and testing the various deep learning models, we have also implemented the web interface to validate the real-time diagnosis of leukemia. The user interface’s home page facilitates uploading blood images for classification. It offers an input field for selecting the image file and a button to initiate the following procedure. The web interface mentioned is currently a prototype developed for demonstration purposes and has not yet been publicly deployed. The layout of the home interface is depicted in Figure 14a. Figure 14b depicts the next section of the interface, which focuses on the attributes of leukemia. Here, based on the image of the blood sample uploaded, details relevant to diagnosing leukemia, such as white blood cell (WBC) count, red blood cell (RBC) count, cell morphology, cell count, nuclear morphology, chromosomal abnormalities and texture, color, and contextual features are automatically identified, registered, and recorded. Once complete, a button allows them to proceed to the next section. The leukemia diagnosis section, depicted in Figure 14c, integrates the user’s input and model analysis. It displays the uploaded blood image alongside the entered leukemia attributes (WBC and RBC counts). Here, the system delivers a diagnosis based on the attributes and showcases the accuracy achieved by the various deep learning models (AlexNet, LeNet, CNN, VGG, EfficientNet). Finally, a button allows users to return to the home page to upload more samples if required.
The deep learning models exhibited varying degrees of performance in leukemia classification. Among the architectures tested, AlexNet achieved the highest accuracy of 89.3%, followed by LeNet (87.3%), EfficientNet (85.1%), ResNet (82.6%), CNN (81.3%), and VGG (77.1%). AlexNet also showed the best performance in terms of precision, 99.5%, recall, 86.8%, and F1-score, 92.7%, across different subtypes of leukemia, which indicated its prowess in extracting complex features and patterns from raw data against the other deep learning algorithms used.
The analysis of the experimental results brought to light several critical insights into leukemia classification: Deep learning models show that unprocessed and unstructured data could, by themselves, learn the hierarchical representations capturing the low-level features and patterns indicative of different leukemia subtypes. High accuracy and discriminative power in those models underline their promising potential for the improvement of diagnosis and treatment in leukemia patients. The results presented also reveal the effectiveness of deep learning techniques in classifying leukemia. Equipped with better architecture and larger datasets, the performance of such models is superior to that of traditional machine learning techniques. Deep learning models are bound to revolutionize leukemia diagnosis and treatment if integrated into clinical practice, allowing accurate and personalized health interventions.

5. Conclusions

In this study, the effectiveness of deep learning models is explored in the classification of leukemia cancer. Extensive experimentation and testing proved that the proposed model outperformed traditional machine learning algorithms in the areas of accuracy, robustness, and efficiency. These results highlight the potential of deep learning models, such as AlexNet, LeNet, ResNet, CNN, VGG, and EfficientNet, in correctly classifying leukemia subtypes based on diverse features extracted from cell images, genomic data, and clinical records. The application of deep learning methods may bring a paradigm shift in diagnosis and treatment options for leukemia. However, challenges and limitations remain, which future studies will need to address. In particular, the interpretability of deep learning models, the availability and accessibility of annotated datasets, and the integration of multi-omics data pose significant challenges that necessitate collaboration between researchers, clinicians, and data scientists.

Author Contributions

Methodology, H.M.R., B.O.L.J., N.T.R., T.K.M., N.A., H.A.A., and S.A.; conceptualization, H.M.R., B.O.L.J., N.T.R., T.K.M., N.A., H.A.A., and S.A.; visualization, H.M.R., B.O.L.J., N.T.R., T.K.M., N.A., H.A.A., and S.A.; writing—original draft preparation, H.M.R., B.O.L.J., N.T.R., T.K.M., N.A., H.A.A., and S.A.; writing—review and editing, H.M.R., B.O.L.J., N.T.R., T.K.M., N.A., H.A.A., and S.A. All authors have read and agreed to the published version of the manuscript.

Funding

Princess Nourah bint Abdulrahman University Researchers Supporting Project number (PNURSP2025R749), Princess Nourah bint Abdulrahman University, Riyadh, Saudi Arabia.

Institutional Review Board Statement

Not applicable.

Informed Consent Statement

Not applicable.

Data Availability Statement

The dataset utilized in this work is freely available and may be freely downloaded from the given link: https://www.cancerimagingarchive.net/collection/c-nmc-2019/ (accessed on 4 January 2025).

Acknowledgments

Princess Nourah bint Abdulrahman University Researchers Supporting Project number (PNURSP2025R749), Princess Nourah bint Abdulrahman University, Riyadh, Saudi Arabia.

Conflicts of Interest

There are no conflicts of interest present in this work.

References

  1. Oybek Kizi, R.F.; Theodore Armand, T.P.; Kim, H.-C. A Review of Deep Learning Techniques for Leukemia Cancer Classification Based on Blood Smear Images. Appl. Biosci. 2025, 4, 9. [Google Scholar] [CrossRef]
  2. Garg, R.; Garg, H.; Patel, H.; Ananthakrishnan, G.; Sharma, S. Role of Machine Learning in Detection and Classification of Leukemia: A Comparative Analysis. In GANs for Data Augmentation in Healthcare; Springer International Publishing: Cham, Switzerland, 2023; pp. 1–20. [Google Scholar] [CrossRef]
  3. Rai, H.M.; Yoo, J.; Razaque, A. Comparative analysis of machine learning and deep learning models for improved cancer detection: A comprehensive review of recent advancements in diagnostic techniques. Expert Syst. Appl. 2024, 255, 124838. [Google Scholar] [CrossRef]
  4. Mallick, P.K.; Mohapatra, S.K.; Chae, G.-S.; Mohanty, M.N. Convergent learning–based model for leukemia classification from gene expression. Pers. Ubiquitous Comput. 2023, 27, 1103–1110. [Google Scholar] [CrossRef]
  5. Tan, M.; Le, Q.V. EfficientNet: Rethinking model scaling for convolutional neural networks. In Proceedings of the 36th International Conference on Machine Learning, ICML 2019, Long Beach, CA, USA, 9–15 June 2019; pp. 10691–10700. [Google Scholar]
  6. Krizhevsky, A.; Sutskever, I.; Hinton, G.E. ImageNet classification with deep convolutional neural networks. Commun. ACM 2017, 60, 84–90. [Google Scholar] [CrossRef]
  7. Rai, H.M.; Yoo, J.; Razaque, A. A depth analysis of recent innovations in non-invasive techniques using artificial intelligence approach for cancer prediction. Med. Biol. Eng. Comput. 2024, 62, 3555–3580. [Google Scholar] [CrossRef]
  8. Raina, R.; Gondhi, N.K.; Chaahat Singh, D.; Kaur, M.; Lee, H.-N. A Systematic Review on Acute Leukemia Detection Using Deep Learning Techniques. Arch. Comput. Methods Eng. 2023, 30, 251–270. [Google Scholar] [CrossRef]
  9. Khan, S.; Sajjad, M.; Hussain, T.; Ullah, A.; Imran, A.S. A review on traditional machine learning and deep learning models for WBCs classification in blood smear images. IEEE Access 2020, 9, 10657–10673. [Google Scholar] [CrossRef]
  10. Kanimozhi, N.; Nayak, S.; Kumar K, K.; Manjramkar, V.; Kumar, R.; Suganthi, D. Blood Cancer Detection and Classification using Auto Encoder and Regularized Extreme Learning Machine. In Proceedings of the 2023 8th International Conference on Communication and Electronics Systems (ICCES), Coimbatore, India, 1–3 June 2023; pp. 1122–1127. [Google Scholar] [CrossRef]
  11. Anilkumar, K.K.; Manoj, V.J.; Sagi, T.M. A review on computer aided detection and classification of leukemia. Multimed. Tools Appl. 2023, 83, 17961–17981. [Google Scholar] [CrossRef]
  12. Nautiyal, U.; Bhatt, A.; Chauhan, R.; Rawat, R.; Gupta, R. A Modified Conventional Neural Network for Detecting and Classifying Leukemia. In Proceedings of the 2024 International Conference on Intelligent and Innovative Technologies in Computing, Electrical and Electronics (IITCEE), Bangalore, India, 24–25 January 2024; pp. 1–7. [Google Scholar]
  13. Abirami, M.; Revathy, S.; Swathika, R.; Rajheshwari, K.C.; Mohanaprakash, T.A. An Extensive Study of Different Types of Leukemia using Image Processing Techniques. Int. J. Intell. Syst. Appl. Eng. 2024, 12, 586–596. [Google Scholar]
  14. Singh, R.; Sharma, N.; Aggarwal, P.; Singh, M.; Chythanya, K.R. Revolutionary Changes in Acute Lymphoblastic Leukaemia Classification: The Impact of Deep Learning Convolutional Neural Networks. In Proceedings of the 2024 2nd International Conference on Computer, Communication and Control (IC4), Indore, India, 8–10 February 2024; pp. 1–6. [Google Scholar]
  15. Al-Hussaini, I.; White, B.; Varmeziar, A.; Mehra, N.; Sanchez, M.; Lee, J.; DeGroote, N.P.; Miller, T.P.; Mitchell, C.S. An Interpretable Machine Learning Framework for Rare Disease: A Case Study to Stratify Infection Risk in Pediatric Leukemia. J. Clin. Med. 2024, 13, 1788. [Google Scholar] [CrossRef]
  16. Huérfano-Maldonado, Y.; Mora, M.; Vilches, K.; Hernández-García, R.; Gutiérrez, R.; Vera, M. A comprehensive review of extreme learning machine on medical imaging. Neurocomputing 2023, 556, 126618. [Google Scholar] [CrossRef]
  17. Bodzas, A.; Kodytek, P.; Zidek, J. Automated Detection of Acute Lymphoblastic Leukemia From Microscopic Images Based on Human Visual Perception. Front. Bioeng. Biotechnol. 2020, 8, 1005. [Google Scholar] [CrossRef]
  18. Mirmohammadi, P.; Ameri, M.; Shalbaf, A. Recognition of acute lymphoblastic leukemia and lymphocytes cell subtypes in microscopic images using random forest classifier. Phys. Eng. Sci. Med. 2021, 44, 433–441. [Google Scholar] [CrossRef]
  19. Shahin, A.I.; Guo, Y.; Amin, K.M.; Sharawi, A.A. White blood cells identification system based on convolutional deep neural learning networks. Comput Methods Programs Biomed. 2019, 168, 69–80. [Google Scholar] [CrossRef]
  20. Emam Atteia, G. Latent Space Representational Learning of Deep Features for Acute Lymphoblastic Leukemia Diagnosis. Comput. Syst. Sci. Eng. 2023, 45, 361–376. [Google Scholar] [CrossRef]
  21. Elhassan, T.A.M.; Rahim, M.S.M.; Swee, T.T.; Hashim, S.Z.M.; Aljurf, M. Feature Extraction of White Blood Cells Using CMYK-Moment Localization and Deep Learning in Acute Myeloid Leukemia Blood Smear Microscopic Images. IEEE Access 2022, 10, 16577–16591. [Google Scholar] [CrossRef]
  22. Deshpande, N.M.; Gite, S.; Pradhan, B.; Alamri, A.; Lee, C.-W. A New Method for Diagnosis of Leukemia Utilizing a Hybrid DL-ML Approach for Binary and Multi-Class Classification on a Limited-Sized Database. Comput. Model. Eng. Sci. 2024, 139, 593–631. [Google Scholar] [CrossRef]
  23. Claro, M.; Vogado, L.; Veras, R.; Santana, A.; Tavares, J.; Santos, J.; Machado, V. Convolution Neural Network Models for Acute Leukemia Diagnosis. In Proceedings of the 2020 International Conference on Systems, Signals and Image Processing (IWSSIP), Niteroi, Brazil, 1–3 July 2020; pp. 63–68. [Google Scholar] [CrossRef]
  24. Jusman, Y.; Riyadi, S.; Faisal, A.; Kanafiah, S.N.A.M.; Mohamed, Z.; Hassan, R. Classification System for Leukemia Cell Images based on Hu Moment Invariants and Support Vector Machines. In Proceedings of the Proceedings—2021 11th IEEE International Conference on Control System, Computing and Engineering, ICCSCE 2021, Penang, Malaysia, 27–28 August 2021; pp. 137–141. [Google Scholar]
  25. Anil, B.C.; Nikitha, B.A.; Supriya, N.H.; Koushal, B.; Suhas, S.; Dayananda, P. Detection of WBC Cancer Using Image Processing. J. Inst. Eng. (India) Ser. B 2023, 104, 141–152. [Google Scholar] [CrossRef]
  26. More, P.; Sugandhi, R. Automated and Enhanced Leucocyte Detection and Classification for Leukemia Detection Using Multi-Class SVM Classifier. Eng. Proc. 2023, 37, 36. [Google Scholar]
  27. Hasanaath, A.A.; Mohammed, A.S.; Latif, G.; Abdelhamid, S.E.; Alghazo, J.; Hussain, A.A. Acute lymphoblastic leukemia detection using ensemble features from multiple deep CNN models. Electron. Res. Arch. 2024, 32, 2407–2423. [Google Scholar] [CrossRef]
  28. Hameed, S.M.; Ahmed, W.A.; Othman, M.A. Leukemia Diagnosis using Machine Learning Classifiers based on MRMR Feature Selection. Eng. Technol. Appl. Sci. Res. 2024, 14, 15614–15619. [Google Scholar] [CrossRef]
  29. Talaat, F.M.; Gamel, S.A. Machine learning in detection and classification of leukemia using C-NMC_Leukemia. Multimed. Tools Appl. 2023, 83, 8063–8076. [Google Scholar] [CrossRef]
  30. Jawahar, M.; Anbarasi, L.J.; Narayanan, S.; Gandomi, A.H. An attention-based deep learning for acute lymphoblastic leukemia classification. Sci. Rep. 2024, 14, 17447. [Google Scholar] [CrossRef]
  31. Zhang, C.; Wu, S.; Lu, Z.; Shen, Y.; Wang, J.; Huang, P.; Lou, J.; Liu, C.; Xing, L.; Zhang, J.; et al. Hybrid adversarial-discriminative network for leukocyte classification in leukemia. Med. Phys. 2020, 47, 3732–3744. [Google Scholar] [CrossRef]
  32. Zare, L.; Rahmani, M.; Khaleghi, N.; Sheykhivand, S.; Danishvar, S. Automatic Detection of Acute Leukemia (ALL and AML) Utilizing Customized Deep Graph Convolutional Neural Networks. Bioengineering 2024, 11, 644. [Google Scholar] [CrossRef]
  33. Ul Ain, Q.; Akbar, S.; Hassan, S.A.; Naaqvi, Z. Diagnosis of Leukemia Disease through Deep Learning using Microscopic Images. In Proceedings of the 2022 2nd International Conference on Digital Futures and Transformative Technologies, ICoDT2. Rawalpindi, Pakistan, 24–26 May 2022; Institute of Electrical and Electronics Engineers Inc.: New York, NY, USA, 2022. [Google Scholar]
  34. Jha, K.K.; Dutta, H.S. Mutual Information based hybrid model and deep learning for Acute Lymphocytic Leukemia detection in single cell blood smear images. Comput. Methods Programs Biomed. 2019, 179, 104987. [Google Scholar] [CrossRef] [PubMed]
  35. Jiang, Z.; Dong, Z.; Wang, L.; Jiang, W. Method for Diagnosis of Acute Lymphoblastic Leukemia Based on ViT-CNN Ensemble Model. Comput. Intell. Neurosci. 2021, 2021, 7529893. [Google Scholar] [CrossRef]
  36. Rahman, W.; Faruque, M.G.G.; Roksana, K.; Sadi, A.H.M.S.; Rahman, M.M.; Azad, M.M. Multiclass blood cancer classification using deep CNN with optimized features. Array 2023, 18, 100292. [Google Scholar] [CrossRef]
  37. Sampathila, N.; Chadaga, K.; Goswami, N.; Chadaga, R.P.; Pandya, M.; Prabhu, S.; Bairy, M.G.; Katta, S.S.; Bhat, D.; Upadya, S.P. Customized Deep Learning Classifier for Detection of Acute Lymphoblastic Leukemia Using Blood Smear Images. Healthcare 2022, 10, 1812. [Google Scholar] [CrossRef]
  38. Islam, M.M.; Rifat, H.R.; Shahid MdSBin Akhter, A.; Uddin, M.A. Utilizing Deep Feature Fusion for Automatic Leukemia Classification: An Internet of Medical Things-Enabled Deep Learning Framework. Sensors 2024, 24, 4420. [Google Scholar] [CrossRef]
  39. Asar, T.O.; Ragab, M. Leukemia detection and classification using computer-aided diagnosis system with falcon optimization algorithm and deep learning. Sci. Rep. 2024, 14, 21755. [Google Scholar] [CrossRef] [PubMed]
  40. Lecun, Y.; Bottou, L.; Bengio, Y.; Haffner, P. Gradient-based learning applied to document recognition. Proc. IEEE 1998, 86, 2278–2324. [Google Scholar] [CrossRef]
  41. Rai, H.M.; Yoo, J.; Atif Moqurrab, S.; Dashkevych, S. Advancements in traditional machine learning techniques for detection and diagnosis of fatal cancer types: Comprehensive review of biomedical imaging datasets. Measurement 2024, 225, 114059. [Google Scholar] [CrossRef]
  42. Simonyan, K.; Zisserman, A. Very deep convolutional networks for large-scale image recognition. In Proceedings of the 3rd International Conference on Learning Representations, ICLR 2015—Conference Track Proceedings, San Diego, CA, USA, 7–9 May 2015. [Google Scholar]
  43. Esteva, A.; Kuprel, B.; Novoa, R.A.; Ko, J.; Swetter, S.M.; Blau, H.M.; Thrun, S. Dermatologist-level classification of skin cancer with deep neural networks. Nature 2017, 542, 115–118. [Google Scholar] [CrossRef]
  44. Russakovsky, O.; Deng, J.; Su, H.; Krause, J.; Satheesh, S.; Ma, S.; Huang, Z.; Karpathy, A.; Khosla, A.; Bernstein, M.; et al. ImageNet Large Scale Visual Recognition Challenge. Int. J. Comput. Vis. 2015, 115, 211–252. [Google Scholar] [CrossRef]
  45. Szegedy, C.; Wei Liu Yangqing Jia Sermanet, P.; Reed, S.; Anguelov, D.; Erhan, D.; Vanhoucke, V.; Rabinovich, A. Going deeper with convolutions. In Proceedings of the 2015 IEEE Conference on Computer Vision and Pattern Recognition (CVPR), Boston, MA, USA, 7–12 June 2015; pp. 1–9. [Google Scholar] [CrossRef]
  46. He, K.; Zhang, X.; Ren, S.; Sun, J. Deep Residual Learning for Image Recognition. In Proceedings of the 2016 IEEE Conference on Computer Vision and Pattern Recognition (CVPR), Las Vegas, NV, USA, 27–30 June 2016; pp. 770–778. [Google Scholar] [CrossRef]
  47. Sandler, M.; Howard, A.; Zhu, M.; Zhmoginov, A.; Chen, L.-C. MobileNetV2: Inverted Residuals and Linear Bottlenecks. In Proceedings of the 2018 IEEE/CVF Conference on Computer Vision and Pattern Recognition, Salt Lake City, UT, USA, 18–23 June 2018; pp. 4510–4520. [Google Scholar] [CrossRef]
  48. Duggal, R.; Gupta, A.; Gupta, R.; Mallick, P. SD-Layer: Stain Deconvolutional Layer for CNNs in Medical Microscopic Imaging. In Medical Image Computing and Computer Assisted Intervention—MICCAI 2017; Springer: Berlin/Heidelberg, Germany, 2017; pp. 435–443. [Google Scholar]
  49. Gupta, A.; Gupta, R. (Eds.) ISBI 2019 C-NMC Challenge: Classification in Cancer Cell Imaging; Singapore: Springer, 2019. [Google Scholar] [CrossRef]
  50. Gupta, A.; Duggal, R.; Gehlot, S.; Gupta, R.; Mangal, A.; Kumar, L.; Thakkar, N.; Satpathy, D. GCTI-SN: Geometry-inspired chemical and tissue invariant stain normalization of microscopic medical images. Med. Image Anal. 2020, 65, 101788. [Google Scholar] [CrossRef]
  51. Gupta, R.; Mallick, P.; Duggal, R.; Gupta, A.; Sharma, O. Stain Color Normalization and Segmentation of Plasma Cells in Microscopic Images as a Prelude to Development of Computer Assisted Automated Disease Diagnostic Tool in Multiple Myeloma. Clin. Lymphoma Myeloma Leuk. 2017, 17, e99. [Google Scholar] [CrossRef]
  52. Duggal, R.; Gupta, A.; Gupta, R.; Wadhwa, M.; Ahuja, C. Overlapping cell nuclei segmentation in microscopic images using deep belief networks. In Proceedings of the Tenth Indian Conference on Computer Vision, Graphics and Image Processing, Guwahati, India, 18–22 December 2016; ACM: New York, NY, USA, 2016; pp. 1–8. [Google Scholar] [CrossRef]
Figure 1. The block diagram of the proposed methodology for leukemia detection using deep learning techniques.
Fractalfract 09 00337 g001
Figure 2. Evaluation of the VGG model’s accuracy and loss during training and following validation.
Fractalfract 09 00337 g002
Figure 3. Confusion matrix obtained after evaluating the VGG model.
Fractalfract 09 00337 g003
Figure 4. Evaluation of the EfficientNet model’s accuracy and loss during training and following validation.
Fractalfract 09 00337 g004
Figure 5. Confusion matrix obtained after evaluating the EfficientNet model.
Fractalfract 09 00337 g005
Figure 6. Evaluation of the LeNet model’s accuracy and loss during training and following validation.
Fractalfract 09 00337 g006
Figure 7. Confusion matrix obtained after evaluating the LeNet model.
Fractalfract 09 00337 g007
Figure 8. Evaluation of the AlexNet model’s accuracy and loss during training and following validation.
Fractalfract 09 00337 g008
Figure 9. Confusion matrix obtained after evaluating the AlexNet model.
Fractalfract 09 00337 g009
Figure 10. Evaluation of the CNN model’s accuracy and loss during training and following validation.
Fractalfract 09 00337 g010
Figure 11. Confusion matrix obtained after evaluating the CNN model.
Fractalfract 09 00337 g011
Figure 12. Evaluation of the ResNet model’s accuracy and loss during training and following validation.
Fractalfract 09 00337 g012
Figure 13. Confusion matrix obtained after evaluating the ResNet model.
Fractalfract 09 00337 g013
Figure 14. Web interfaces. (a) Home page where the blood sample image is uploaded. (b) The attributes section is where all the attributes are filled out automatically based on the given blood cell sample image. (c) The diagnosis section includes the blood report, the rate of accuracy predicted by each deep learning model regarding the diagnosis result, and the outcome of the diagnosis (here, the blood sample and the attributes indicate that the person is diagnosed with leukemia).
Fractalfract 09 00337 g014aFractalfract 09 00337 g014b
Table 1. Traditional machine learning-based literature for the detection of leukemia.
S.N.YearTechniques UsedFindingsChallengesRef. No.
12019SVM with shape, texture, and complex featuresAchieved 0.9610 accuracy, 0.9890 specificity, and 0.9120 precision on ALL_DB1 and ALL_DB2.Limited sensitivity may impact rare class detection; dataset skew is not addressed.[19]
22020ANN with morphological and statistical featuresAchieved 0.9752 accuracy, 1.000 sensitivity, and 0.9531 specificity.A limited dataset (private hospital data) reduces generalizability and lacks the interpretability of ANN.[17]
32020AlexNet with deep featuresAchieved 0.9718 accuracy and 0.9723 sensitivity across 16 public datasets.Lack of clarity on dataset harmonization; computation-heavy model (AlexNet).[23]
42021Random Forest (RF) with geometric and statistical featuresReported 0.9800 accuracy.No additional metrics (like specificity or precision) were provided; dataset diversity was not verified.[18]
52021SVM using Hu invariant momentsAccuracy of 0.9500.The dataset source is unknown; it lacks robustness verification and deep feature comparison.[24]
62022RF with CNN-based features from the AML-C-LMU datasetAchieved 0.9757 accuracy, 0.9782 F1-score, and 0.9848 precision.Dataset imbalance might influence findings; RF’s scalability to larger datasets is unclear.[21]
72023SVM with deep featuresPerfect scores: 1.0000 accuracy, sensitivity, precision, and specificity on ALL-IDB dataset.Exceptional results suggest potential overfitting or insufficient dataset variability.[20]
82023MLP with cell-based featuresReported 0.9840 accuracy on the ALL-IDB dataset.The model’s overfitting risk was not discussed, and feature scalability was not evaluated.[25]
92023SVM with intensity variation featuresAchieved 0.9885 accuracy, 0.9900 precision, and 0.9880 sensitivity on the ALL-IDB1 dataset.Dataset reliance on intensity variations may not generalize to other imaging modalities.[26]
102024Linear SVM with deep featuresAccuracy of 0.9163 and F1-score of 0.9014 on the C-NMC-2019 dataset.Limited performance on larger datasets indicates the need for improved feature engineering.[27]
112024KNN, SVM, and ANN on microarray attributesAchieved 1.000 accuracy using attribute data.Microarray data may limit the application to an image-based leukemia diagnosis.[28]
122024RF with DenseNet-based deep featuresAchieved 0.9600 accuracy, 0.9700 precision, and 0.9700 sensitivity on ALL-IDB1 and ALL-IDB2 datasets.Limited dataset size for DenseNet features may restrict findings; interpretability challenges of deep learning remain.[22]
Table 2. Deep learning-based literature for the detection of leukemia.
S.N.YearTechniques UsedFindingsChallengesRef. No.
12019SCA-CNN with statistical and local directional pattern (LDP) featuresAchieved 0.9870 accuracy, 0.9800 sensitivity, and 0.9800 specificity.The small dataset size (260 samples) limits generalizability.[34]
22020CNN + HOG with SVMReported 0.9593 accuracy, 0.9611 sensitivity, and 0.9457 specificity on MIC modality.Dependency on handcrafted HOG features; limited validation on other modalities.[31]
32021ViT-CNNAchieved 0.9903 accuracy and 0.9914 precision on MIC.Lack of clarity on utilized features; training complexity due to ViT.[35]
42022ResNet-34 with DCNNReported 0.9840 accuracy for BSI modality.Limited metric diversity (no specificity or precision reported); lacks interpretability.[33]
52023AlexNet with OCNNAchieved nearly perfect metrics: 0.9999 accuracy, 1.0000 sensitivity, and 0.9998 specificity for LYI.Dataset diversity (C-NMC 2019) might not cover other blood conditions, possibly overfitting due to high results.[29]
62023ResNet-50 pre-trainedAchieved 0.9984 accuracy, 0.9981 F1, 0.9975 precision, and 0.9987 sensitivity on MIC modality.Performance depends on pre-trained weights; it may not generalize well to new datasets.[36]
72023CNNReported 0.9554 accuracy, 0.9600 precision, and 0.9591 sensitivity on BSI modality.Performance is lower compared to other approaches; it lacks deep feature representation.[37]
82024DG-CNNAchieved 0.9940 accuracy, 0.9920 sensitivity, and 0.9730 specificity for BSI.The dataset was sourced from a private hospital; it was not tested on public datasets.[32]
92024VGG16 and DenseNet-121 with DFFMReported 0.9989 accuracy, 0.9980 precision, and 0.9972 sensitivity on BSI modality.With the high computational cost of DenseNet-121, performance validation on larger datasets is required.[38]
102024DDRNetAchieved perfect results: 0.9999 accuracy, 1.0000 F1, MCC, precision, and sensitivity for BSI modality.The unrealistically high performance suggests possible overfitting; it requires extensive cross-validation.[30]
112024ShuffleNetv2 with FOADCNN-LDCReported 0.9962 accuracy, 0.9978 specificity, and 0.9714 sensitivity for BSI.The sample size is limited (518 samples); it may not be generalized well to other modalities.[39]
Table 3. Comparison of deep learning techniques used.
ModelArchitecture DescriptionAdvantagesDisadvantages
VGGDeep CNN with 16 convolutional layers and 3 × 3 filters, followed by max-pooling and fully connected layers. ReLU activation and dropout regularization mitigate overfitting.Captures intricate spatial patterns and textures.It is computationally intensive due to its deep architecture.
EfficientNetScalable CNN architecture prioritizing efficiency and performance through compound scaling of depth, width, and resolution. EfficientNet-B0 balances efficiency and accuracy.Efficient utilization of computational resources.It may sacrifice some model expressiveness for efficiency.
LeNetShallow CNN has two convolutional layers, max-pooling layers, and fully connected layers. It is the baseline model for comparison with deeper architectures.Lightweight design suitable for low-resolution images.Limited capacity to capture complex features due to shallow architecture.
AlexNetDeep CNN architecture introduces ReLU activation functions and dropout regularization. Facilitates the extraction of complex features from leukemia images.Pioneering the use of innovative activation functions.Requires substantial computational resources for training.
CNNFlexible and scalable architecture for image classification tasks, featuring convolutional and pooling layers followed by fully connected layers.Adaptable to a wide range of image classification tasks.It may require extensive hyperparameter tuning for optimal performance.
ResNetDeep CNN architecture featuring residual connections to address vanishing gradients. Enables the extraction of highly abstract features, improving classification performance.Mitigates challenges
associated with training deep networks.
Increased model
complexity may lead to overfitting on smaller datasets.
Table 4. Evaluation metrics.
Model/MetricAccuracyPrecisionRecallF1-Score
VGG0.771250.875340.805910.83919
EfficientNet0.851870.994500.824460.90153
LeNet0.873750.989000.850270.91440
AlexNet0.893750.995410.868110.92741
CNN0.813750.867090.860780.86392
ResNet0.826250.947750.823900.88149
Disclaimer/Publisher’s Note: The statements, opinions and data contained in all publications are solely those of the individual author(s) and contributor(s) and not of MDPI and/or the editor(s). MDPI and/or the editor(s) disclaim responsibility for any injury to people or property resulting from any ideas, methods, instructions or products referred to in the content.

