Article

Multifractal Characterization of Pore Heterogeneity and Water Distribution in Medium- and High-Rank Coals via Nuclear Magnetic Resonance

1
The Prevention and Control Genter for the Geological Disaster of Henan Geological Bureau, Zhengzhou 450003, China
2
State Key Laboratory Cultivation Base for Gas Geology and Gas Control (Henan Polytechnic University), Jiaozuo 454003, China
3
College of Safety Science and Engineering, Henan Polytechnic University, Jiaozuo 454003, China
4
School of Resources and Enviroment, Henan Polytechnic University, Jiaozuo 454003, China
*
Author to whom correspondence should be addressed.
Fractal Fract. 2025, 9(5), 290; https://doi.org/10.3390/fractalfract9050290
Submission received: 27 February 2025 / Revised: 14 April 2025 / Accepted: 23 April 2025 / Published: 28 April 2025
(This article belongs to the Special Issue Multiscale Fractal Analysis in Unconventional Reservoirs)

Abstract

Comprehensive assessment of pore structure and multiphase water distribution is critical to the flow and transport process in coalbed methane (CBM) reservoirs. In this study, nuclear magnetic resonance (NMR) and multifractal analysis were integrated to quantify the multiscale heterogeneity of nine medium- and high-rank coals under water-saturated and dry conditions. By applying the box-counting method to transverse relaxation time (T2) spectra, multifractal parameters were derived to characterize pore heterogeneity and residual water distribution. The influencing factors of pore heterogeneity were also discussed. The results show that pore structures in high-rank coals (HCs) exhibit a broader multifractal spectrum and stronger rightward spectrum than those of medium-rank coals, reflecting micropore-dominated heterogeneity and the complexity induced by aromatization in HCs. The vitrinite content enhances micropore development, increasing the heterogeneity and complexity of pore structure and residual water distribution. Inertinite content shows opposite trends compared to vitrinite content for the effect on pore structure and water distribution. Volatile yield reflects coal metamorphism and thermal maturity, which inversely correlates with pore heterogeneity and complexity. Residual water mainly distributes to adsorption pores and pore throats, shortening T2 relaxation (bound water effect) and reducing spectral asymmetry. The equivalence of the multifractal dimension and singularity spectrum validates their joint utility in characterizing pore structure. Minerals enhance pore connectivity but suppress complexity, while moisture and ash contents show negligible impacts. These findings provide a theoretical reference for CBM exploration, especially in optimizing fluid transportation and CBM production strategies and identifying CBM sweet spots.

1. Introduction

Coalbed methane (CBM), a critical component of global energy transitions, offers a cleaner alternative to conventional fossil fuels and contributes to greenhouse gas reductions through methane recovery and CO2 sequestration [1,2,3]. As a dual-porosity medium, coal reservoirs comprise two distinct yet interconnected pore–fracture networks and are characterized by complex geological conditions, with methane mainly stored in adsorbed and free states. Hodot [4] categorized the pore system as micropores (<10 nm), transitional pores (10–100 nm), mesopores (100–1000 nm), and macropores (>1000 nm) by size. The inherent heterogeneity in the pore system suggests that pores exhibit spatial non-uniformity in terms of random pore size distribution, complex pore structure, pore space connectivity, and pore shape due to coalification degree, mineral components, maceral composition, reservoir characteristics, and brittleness, which strongly control the fluid flow and gas production [5,6,7,8]. The water distribution in pores can affect the mechanical properties, gas evaluation, and CBM production [9]. Therefore, the pore heterogeneity and water distribution in coal reservoirs are pivotal to understanding gas storage, transport mechanisms, and recovery efficiency, particularly for middle- and high-rank coals that dominate many energy-rich basins [10,11,12,13,14].
Traditional characterization techniques include qualitative and quantitative testing methods. Qualitative methods typically employ 2D imaging or 3D reconstruction to visualize pore characteristics, but they have certain limitations, such as a restricted field of view and insufficient resolution for nanopores. Quantitative methods often use fluid injection, gas adsorption, and radiation to analyze pore structure [15]. Mercury intrusion porosimetry (MIP) and low-pressure gas adsorption (LPGA) have been widely employed for characterizing pore size distributions [16,17,18,19,20]. However, these techniques often fail to capture dynamic water distributions or quantify multiscale pore heterogeneity under varying hydration states. Nuclear magnetic resonance (NMR), with its unique capability to noninvasively quantify both pore geometry and water distributions, has emerged as a powerful tool for providing valuable insights into CBM exploration [11,15,21,22,23]. Residual water retention in pores may reduce effective permeability and affect gas migration, while previous studies largely focused on pore structures and water migration through the T2 spectral area under water-saturated and centrifuged conditions [24,25]. In contrast to the improvements in coal seam reformability methods, the centrifugal method overestimated the amount of bound water due to the poor pore connectivity and the presence of ink bottle pores in middle- and high-rank coals, misunderstanding CBM’s recovery ability. Thus, the residual water distribution and pore structure variations in complex coal matrices need to be further studied.
Monofractal models characterize simple fractal behavior with fractal dimension (D), which simplifies complex pore systems into single scaling exponents, failing to explain types of erratic variation [15,26]. Multifractal analysis has been applied in pore structure characterization due to its capacity to quantitatively characterize the heterogeneity of samples across multiple scales, overcoming the limitations of monofractal methods that oversimplify complex pore systems into single scaling exponents [16,26,27,28]. Unlike monofractal models, multifractal parameters (e.g., Hurst exponent H, dimension span D−10D10, singularity spectrum width α10− − α10+) precisely quantify the coexistence of diverse pore structures: adsorption-dominated micropores, capillary-controlled mesopores, and fracture-dominated macropores. Recent applications in shale and tight sandstones reveal that multifractal parameters effectively correlate with pore heterogeneity, fluid mobility, and storage capacity [5,29,30,31]. Most studies on coal pore systems mostly combine data from MIP, LPGA, and scanning electron microscopy, while informative, pore structure distribution data may be distored due to methodological artifacts (mercury-induced pore deformation, vacuum-drying effects), particularly the distributions of different fluid phases is ignored. Thus, it is necessary to integrate NMR and multifractal theory to explore the pore heterogeneity and multiphase water distribution of coal at different scales.
Coal’s rank reflects its thermal maturity, determined by geologic conditions (e.g., temperature, pressure, burial history). According to the classification of coal’s metamorphism degree, coal can be divided into low-rank coal (LC: Ro,max < 0.65%), medium-rank coal (MC: 0.65% < Ro,max < 2.00%), and high-rank coal (HC: 2.00% < Ro,max < 4.00%) [32]. Yunnan is one of the regions with the richest CBM resources in China and the coal rank distribution is dominated by medium and high coal ranks [33]. This study systematically investigates pore structure heterogeneity and multiphase water distribution in medium- and high- rank coals under water-saturated and dry conditions through integrated NMR T2 spectral analysis and multifractal theory. The MIP test was used to verify the reliability of the pore size distribution obtained via NMR. The principal objectives of this study are as follows: (1) to address pore structure heterogeneity and the residual water distribution in pore structure by comparing dual-state (water-saturated vs. dried) NMR characteristics of different rank coal samples; (2) to discuss the relationships between the multifractal parameters and T2 spectra; and (3) to identify the key factors influencing pore structure and residual water distribution heterogeneity. Our findings contribute to a more comprehensive understanding of the pore structure heterogeneity at different coalification degrees and provide a reference for water migration in the process of CBM extraction.

2. Experimental Methods and Analyses

2.1. Sample Collection and Preparation

The research area is located in the eastern part of Yunnan province, China, with multiple coal seams in the formation. The nine fresh block coal samples (20 × 20 × 20 cm3) were obtained in the Upper Permian Xuanwei and Longtan formation in the research area. Four samples, including coking coal from Qingping mine (M1), Jinxin mine (M2), Xinxin mine (M3), and lean coal from Xiaoheiqing (M4), were taken from Enhong mining area. The other five anthracite samples were from Dage mine (H1), Xiongda mine (H2), Shewu mine (H3), Hongfa mine (H4), and Danshuo mine (H5) in Laochang mining area. The depth of coal seams is from 500 to 800 m, and the tectonic development is relatively stable. The information on samples is shown in Table 1. The collected samples were then processed into powder (60–80 mesh) in a pulverizer and cylinders (Φ25 mm × 50 mm).

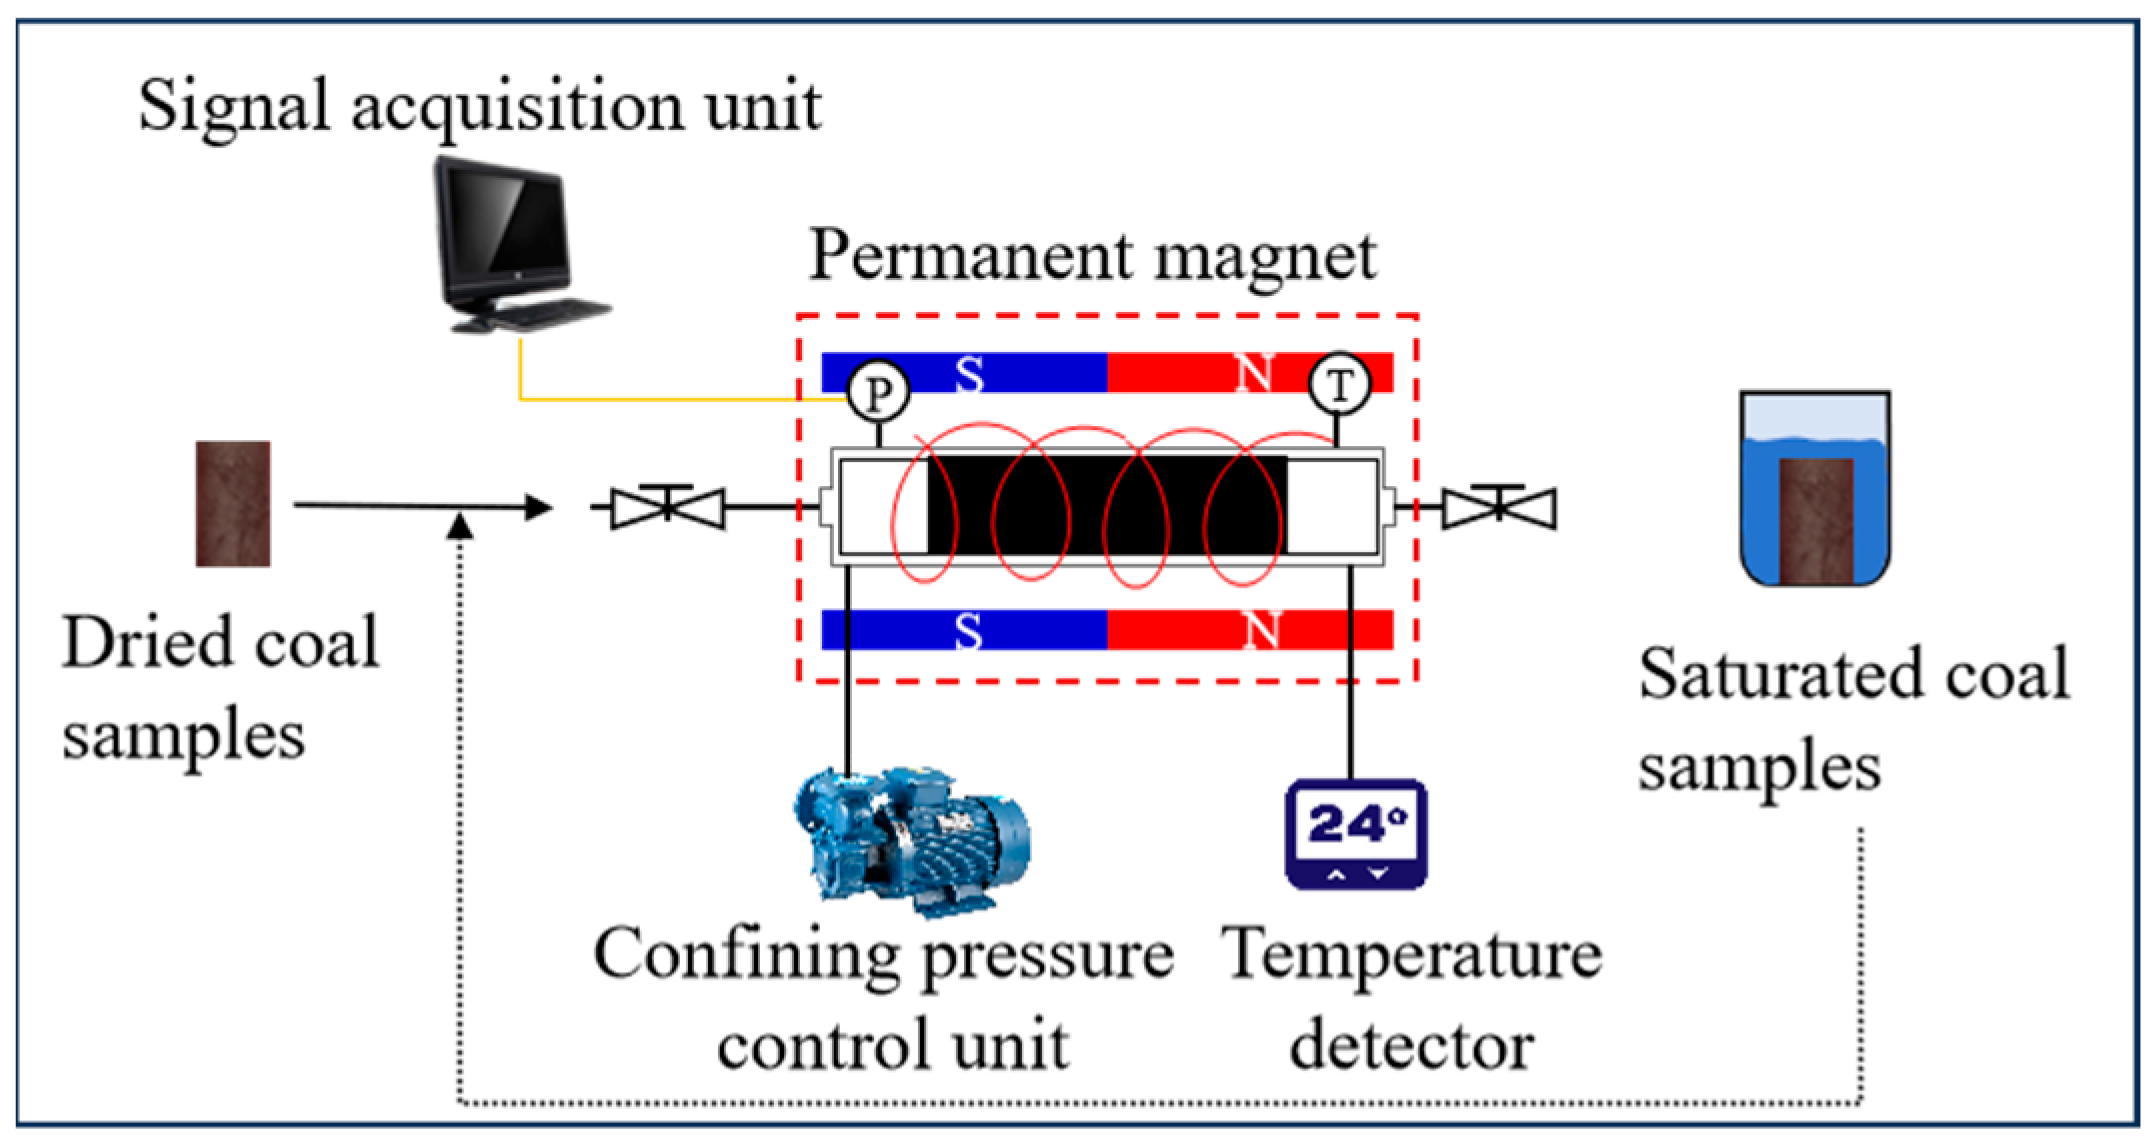
2.2. Experimental Process

The basic properties of the coal samples were determined from proximate and microscopic maceral analysis following the Chinese national standard GB/T 212-2008 [34] and GB/T 8899-2013 [35], respectively. The test results are shown in Table 1.
For the NMR test, the coal samples were firstly dried in a vacuum drying oven at 65 °C until the weight was unchanged. The dried samples were then placed in a core holder cavity of the MesoMR23-60H NMR analyzer (Figure 1). After that, the dry samples were vacuumed in a vacuum device for 12 h and saturated with distilled water under 16 MPa for 48 h. The saturated samples were also placed in the core holder cavity to obtain the transverse relaxation time spectrum. The NMR testing parameters were set as follows: echo time was 0.2 ms, wait time was 3000 ms, number of echoes was 16,000, scanning numbers were 32, and ambient temperature was 22.5 °C. The T2 spectra of dried and saturated coal samples can be used to analyze the residual water distribution and the variation in the pore–fracture system of different coal ranks. For MIP testing, an Autopore IV 9500 (Micromeritics Instrument, Norcross, GA, USA) mercury intrusion tester was utilized. The samples were crushed into granular grains with dimensions of less than 1 cm3 and were dried at 70 °C for 12 h in a drying oven before testing [12].

2.3. NMR and Multifractal Theories

The T2 spectrum is calculated using the SIRT inversion algorithm from the echo attenuation signal. The relaxation time (T2) consists of three parts: volume relaxation time (T2B), diffusional relaxation time (T2D), and surface relaxation time (T2S). Given that T2 has a positive correlation with pore size, T2B and T2D can be neglected in a single fluid and uniform magnetic field [6,10,36]. T2 can be expressed as follows:
1 T 2 = 1 T 2 s = ρ F s r ,
where ρ is the rapid surface relaxation; FS is a geometric form factor; and r is the pore radius (μm). Previous studies have classified that pores with a T2 value of less than 2.5 ms represent adsorption pores (less than 100 nm), those with a T2 value between 2.5 and 100 ms are seepage pores (100–10,000 nm), and those with a T2 value greater than 100 ms are fractures (larger than 10,000 nm) [21,37,38,39].
The fractal method is capable of characterizing the morphological features of the pore–fracture system, while the multifractal method offers more pore heterogeneity information than the fractal method [27,40,41]. In this study, the cumulative T2 spectra curve is divided into N(ɛ) segments, with a scale of ɛ based on the box-counting method, resulting in a mass probability density pi(ɛ) for the ith section. The details of the multifractal theory can be found in previous studies [26,42]. And the multifractal parameters Dq (multifractal dimension), τ(q) (mass distribution function), α(q) (the singularity strength), and f(α) (the multifractal singular spectrum) can be expressed as follows:
{ D q = 1 q 1 l i m ε 0 l o g 10 i = 1 N ( ε ) p i ( ε ) q l o g ( ε ) q [ 10 , 1 ) ( 1 , 10 ] D 1 = l i m ε 0 i = 1 N ( ε ) p i ( 1 , ε ) l o g [ p i ( 1 , ε ) ] l o g ( ε ) q = 1 ,
τ ( q ) = ( q 1 ) D q
{ α ( q ) = d τ ( q ) d q f ( α ) = q α ( q ) τ ( q )
H = 1 2 ( D 2 + 1 )
where q represents an order of the box matrix (−∞ < q < +∞). In this study, the value of q ranges from −10 to 10, with an interval of 0.1. Ni(ε) represents the cumulative pore volume of the ith section, and H represents the Hurst exponent, which can be used to specify the pore connectivity.

3. Results

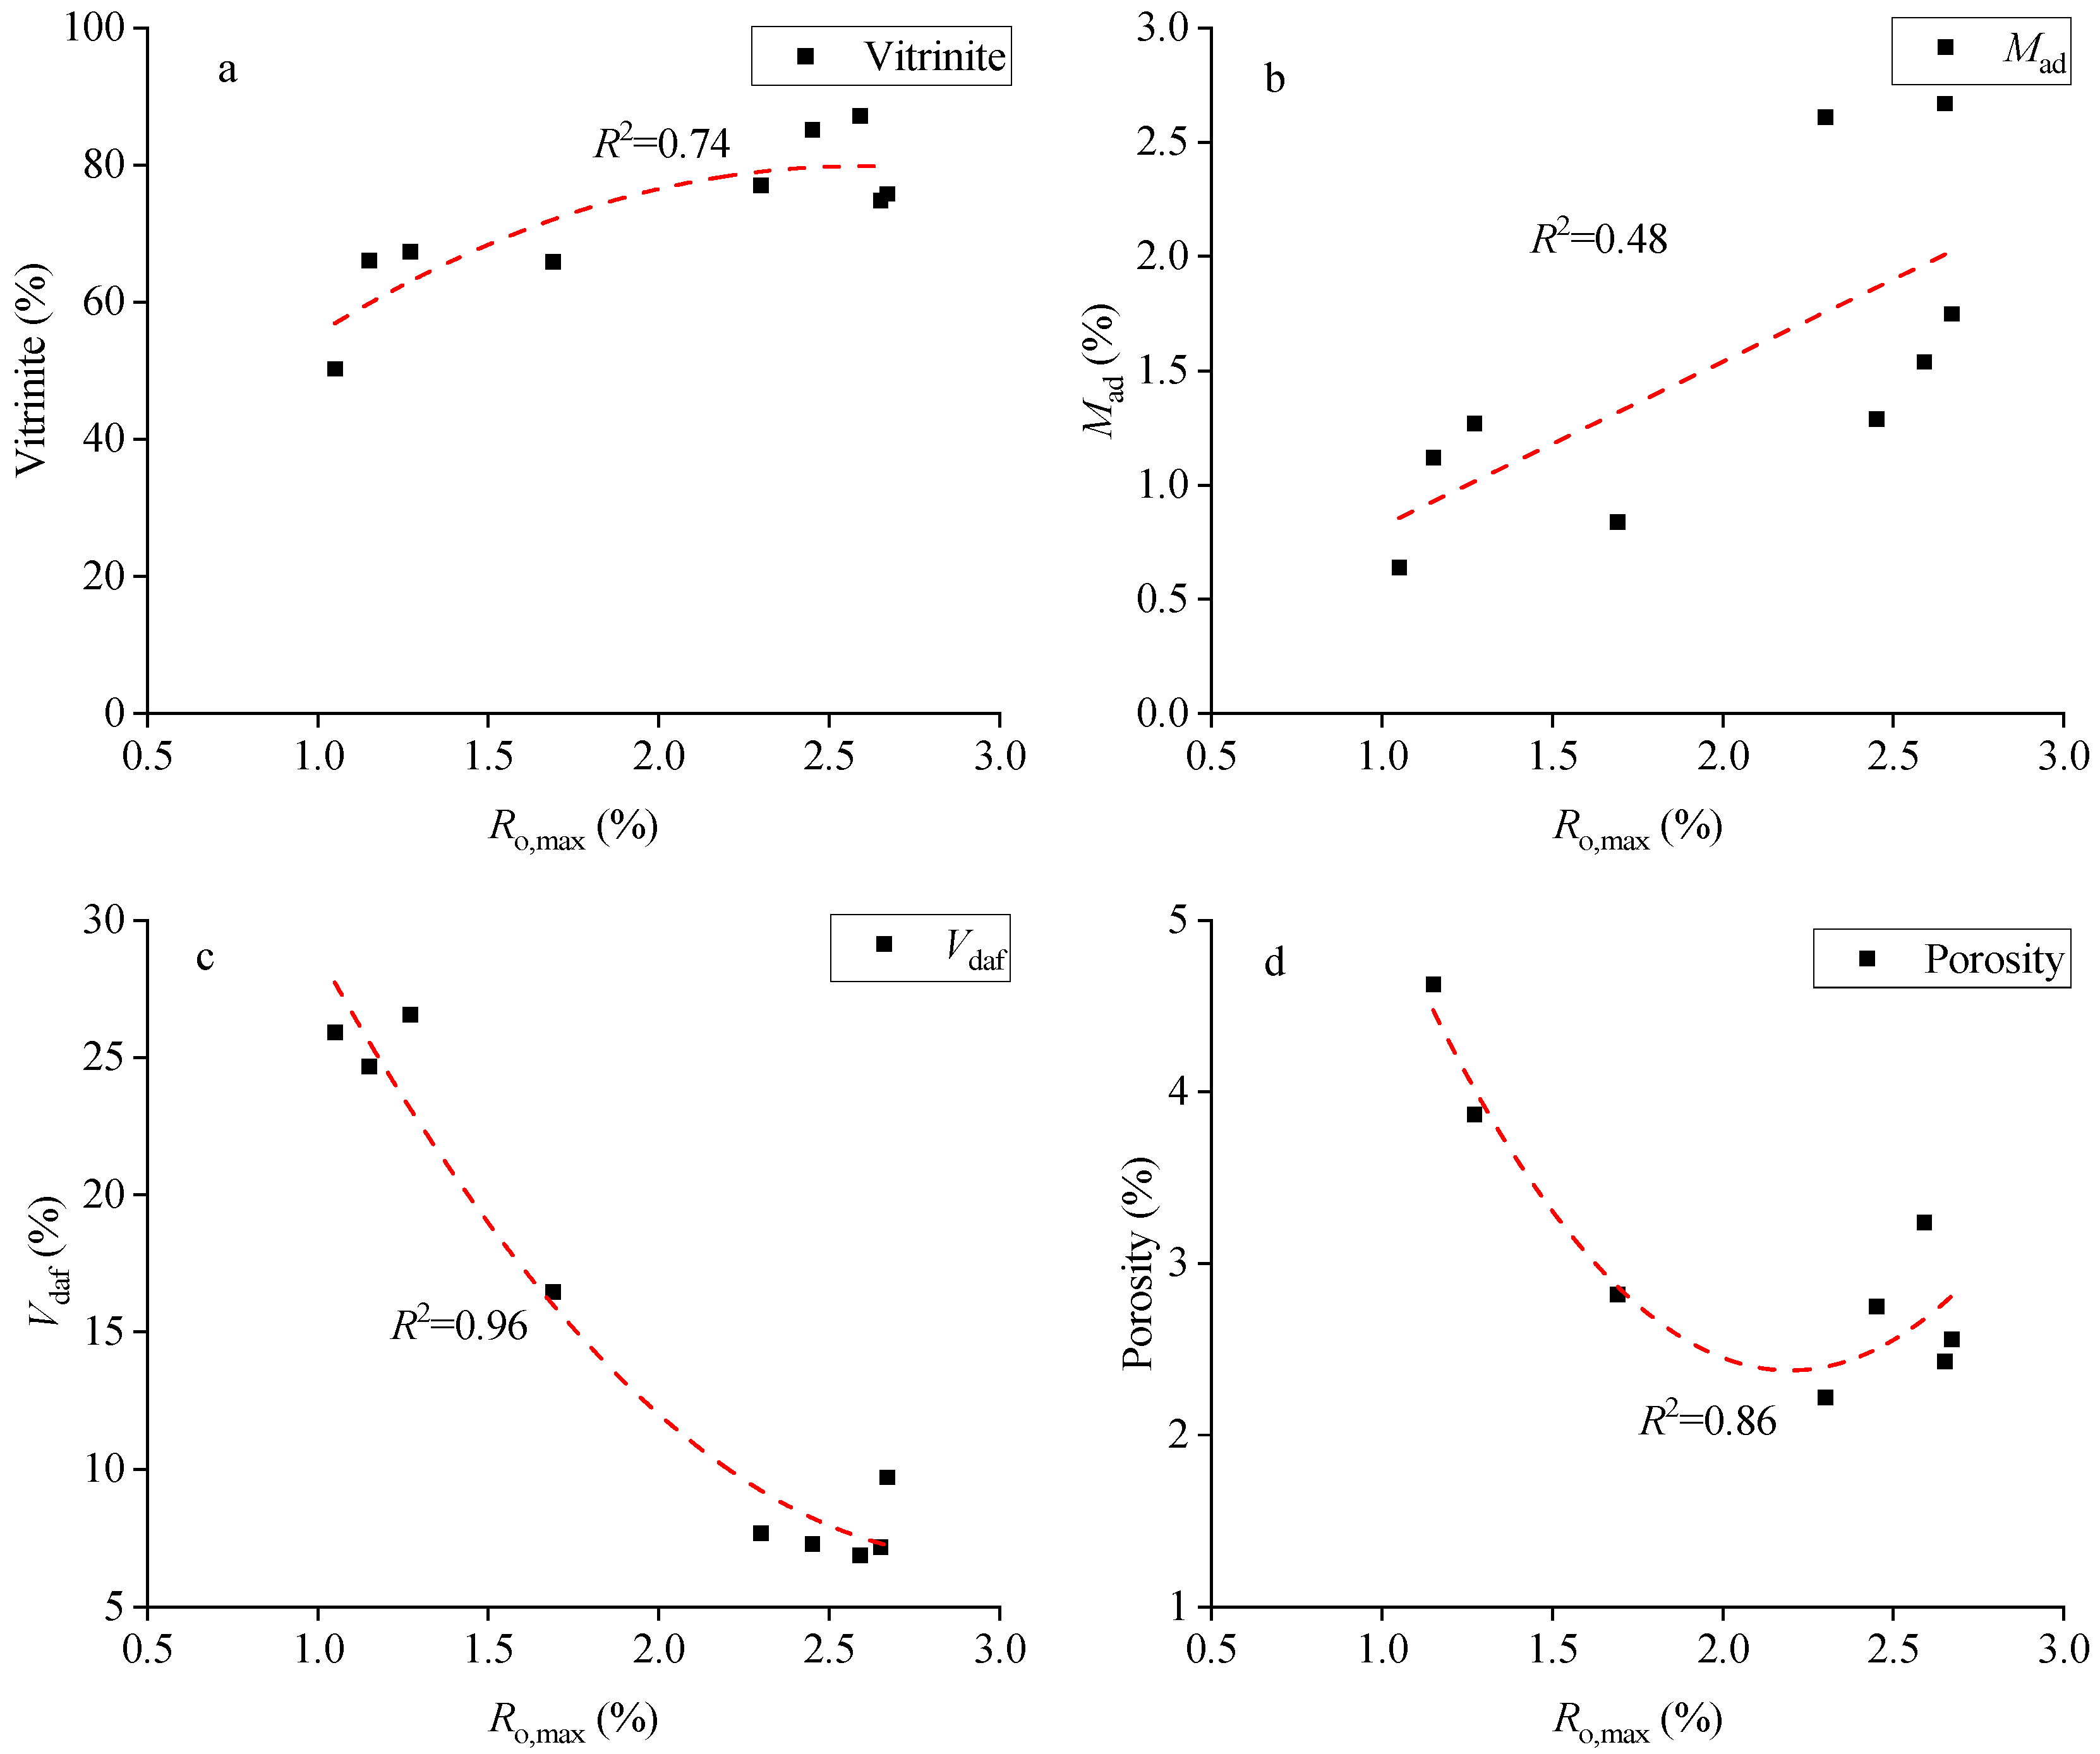
3.1. Coal Characteristics

Four coal samples from Enhong mining area are classified as medium-rank coal, with Ro,max ranging from 1.05 to 1.69%. The other five coal samples from Laochang mining area are classified as high-rank coal, with Ro,max ranging from 2.30 to 2.67% (Table 1). For the maceral composition, vitrinite constitutes the predominant maceral group across all samples, accounting for 50.30–67.40% in MC and 74.87–87.18% in HC. In addition, there is a positive relationship between Ro,max and the vitrinite content (Figure 2a). The content of inertinite varies between 50.30% and 67.40% in MC, whereas in HC, it varies from 74.87 to 87.18%. Minerals range from 0.64% to 9.49%, with an average of 5.62%, predominantly composed of clay minerals, carbonates, and oxides. Notably, some middle-rank coal samples contain exinite, with a minor proportion of approximately 3% (Table 1).
Proximate analyses demonstrate that the moisture content (Mad), ash yield (Ad), volatile yield (Vdaf), and fixed carbon (FCd) of all samples are in the range of 0.64–2.67% (average 1.53%), 8.23–14.94% (average 11.54%), 6.88–26.58% (average 14.71%), and 62.74–84.06% (average 75.50%), respectively (Table 1). A slight positive relationship (R2 = 0.48) exists between the Ro,max and Mad content (Figure 2b). Volatile matter displays a significant decrease (R2 = 0.96) with the increase in the coalification degree (Figure 2c). The porosity content exhibits a bimodal distribution, initially decreasing then slightly increasing at higher maturation stages (Figure 2d), potentially indicating the structural reorganization of micropores during thermal evolution.

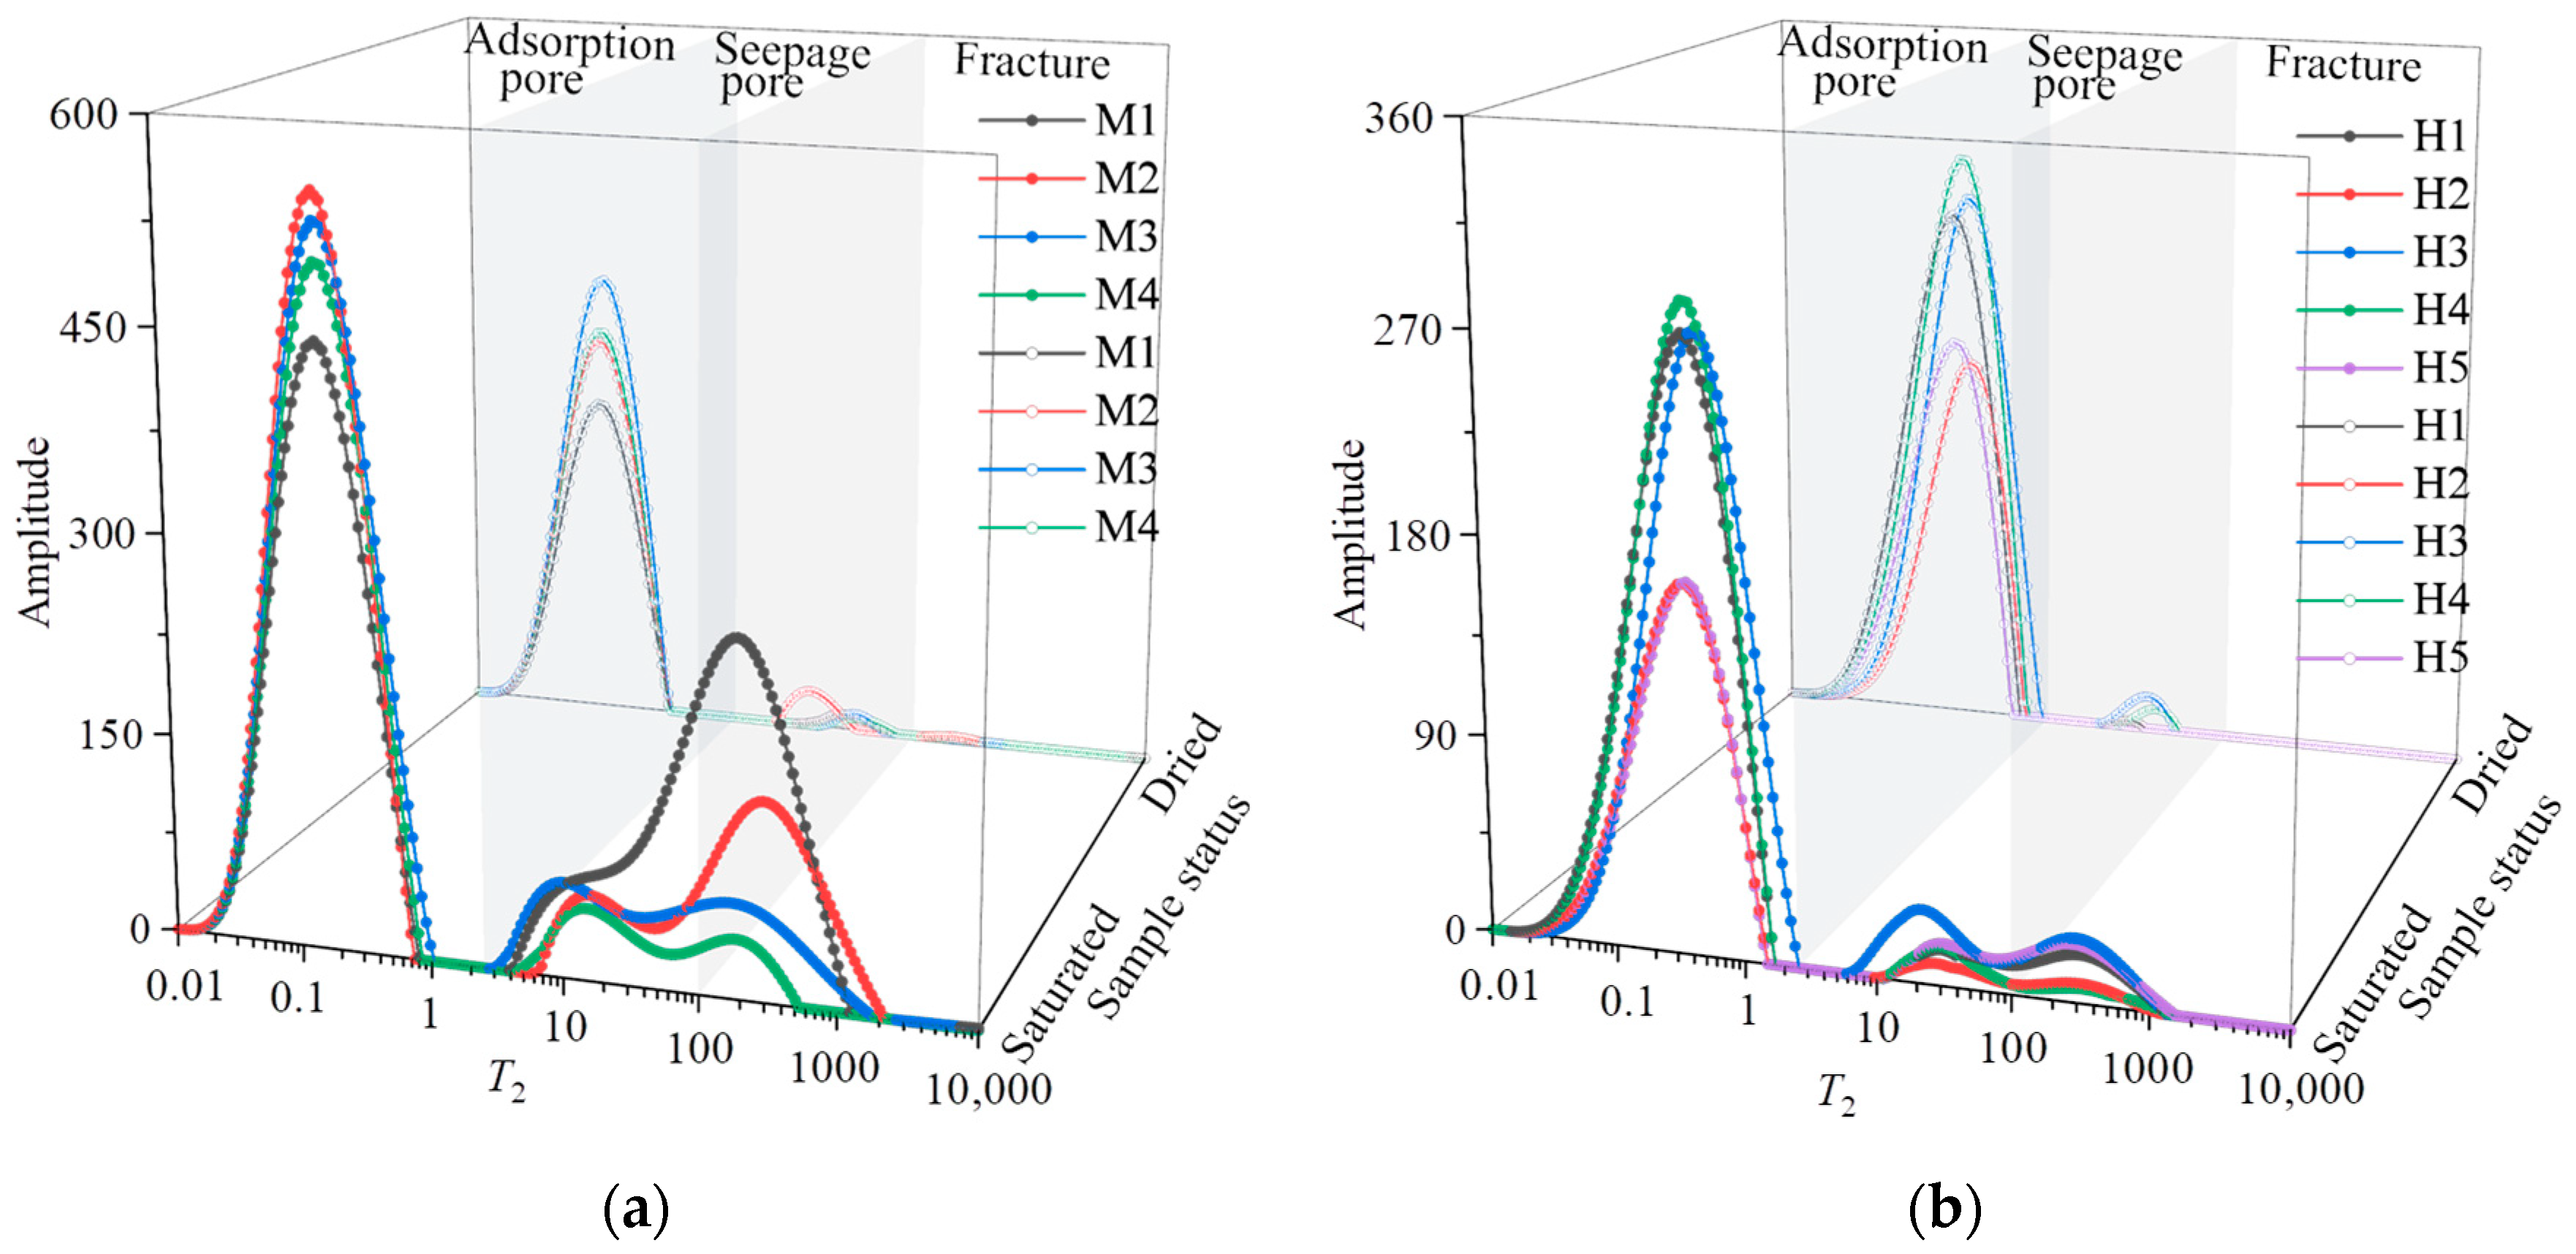
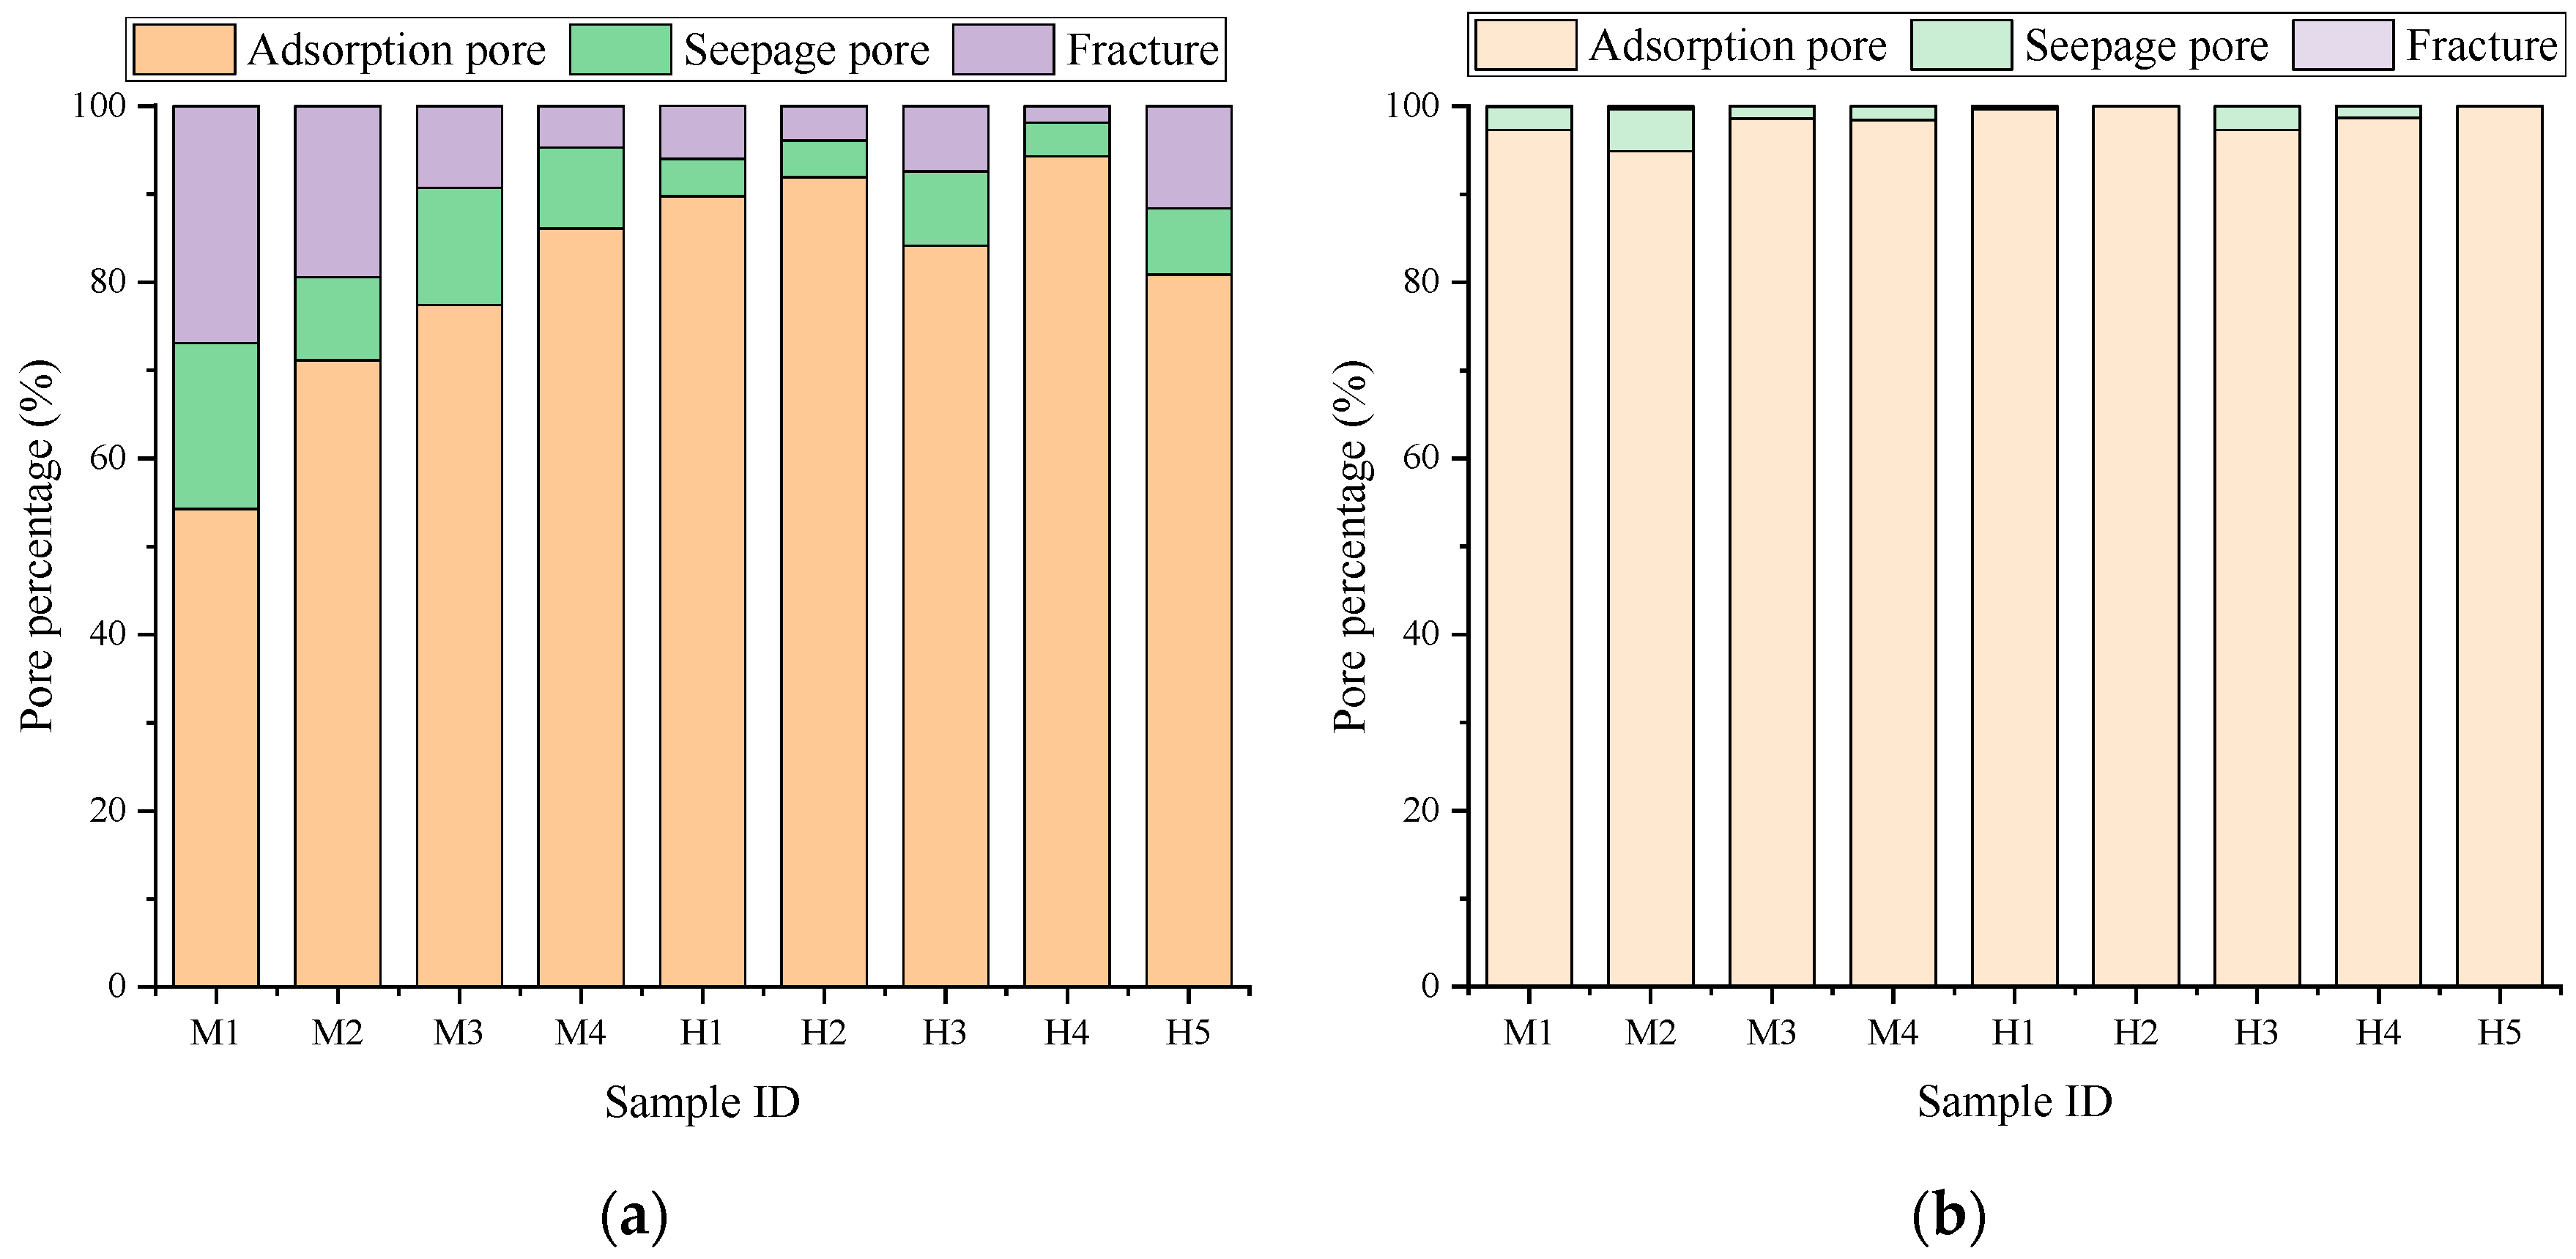
3.2. T2 Spectrum Distribution and Validation

3.2.1. T2 Characteristics of Saturated and Dried Coal Samples

The T2 spectrum distributions under water-saturated and dry conditions of different coal samples are shown in Figure 3. In a water-saturated state, T2 distributions of all samples exhibit three peaks. Among them, peak 1 (P1) from 0.01 to 2.5 ms is dominant and independent of the other two peaks (peak 2 from 2.5 to 100 ms and peak 3 larger than 100 ms), indicating a high content of micropores for gas adsorption and poor connectivity with other pore types. There is no obvious boundary between peak 2 (P2) and peak 3 (P3), demonstrating partial pore connectivity between seepage pores and fractures. In addition, the absolute volume of pore space in high-rank coal samples decreases compared with medium-rank coal samples, especially in seepage space and fractures.
The residual water distribution under dry conditions highlights fluid mobility differences. The T2 spectrum exhibits only two leftmost peaks (P1 and P2), with P1 predominating in the dried samples, indicating the complete evaporation of water from fractures (Figure 3). The persistence of P1 across all samples underscores the dominance of capillary-bound water in adsorption pores, which restricts the fluid flow. Dried T2 spectra of all samples retain distinct peak boundaries, confirming poor connectivity between adsorption pores and seepage pores.
The proportions of different pore types in all samples in water-saturated and dry states are calculated, as plotted in Figure 4. The adsorption pores, which predominate in all samples in water-saturated conditions, account for 54.27–86.08% (with an average of 72.22%) and 80.86–90.31% (with an average of 88.20%) of the total pore volume in medium- and high-rank coals, respectively. Seepage pores in medium-rank coals occupy 9.22–18.82% (mean of 12.70%) of the total volume, contrasting with a narrower and lower range in high-rank coals (3.77–8.42%, mean of 5.62%). Fractures in medium-rank coals vary widely (4.7–26.91%, mean of 15.08%), whereas high-rank coals show reduced fracture proportions (3.91–11.63%, mean of 6.17%) (Figure 4a). Notably, in dry conditions, fractures and seepage pores retain negligible moisture, with adsorption pores dominating the pore network, particularly in high-rank coals (Figure 4b). The variation in results indicates the heterogeneity and complexity of the coal pore structure and water migration, which are crucial for understanding the occurrence potential and flow characteristics of CBM.

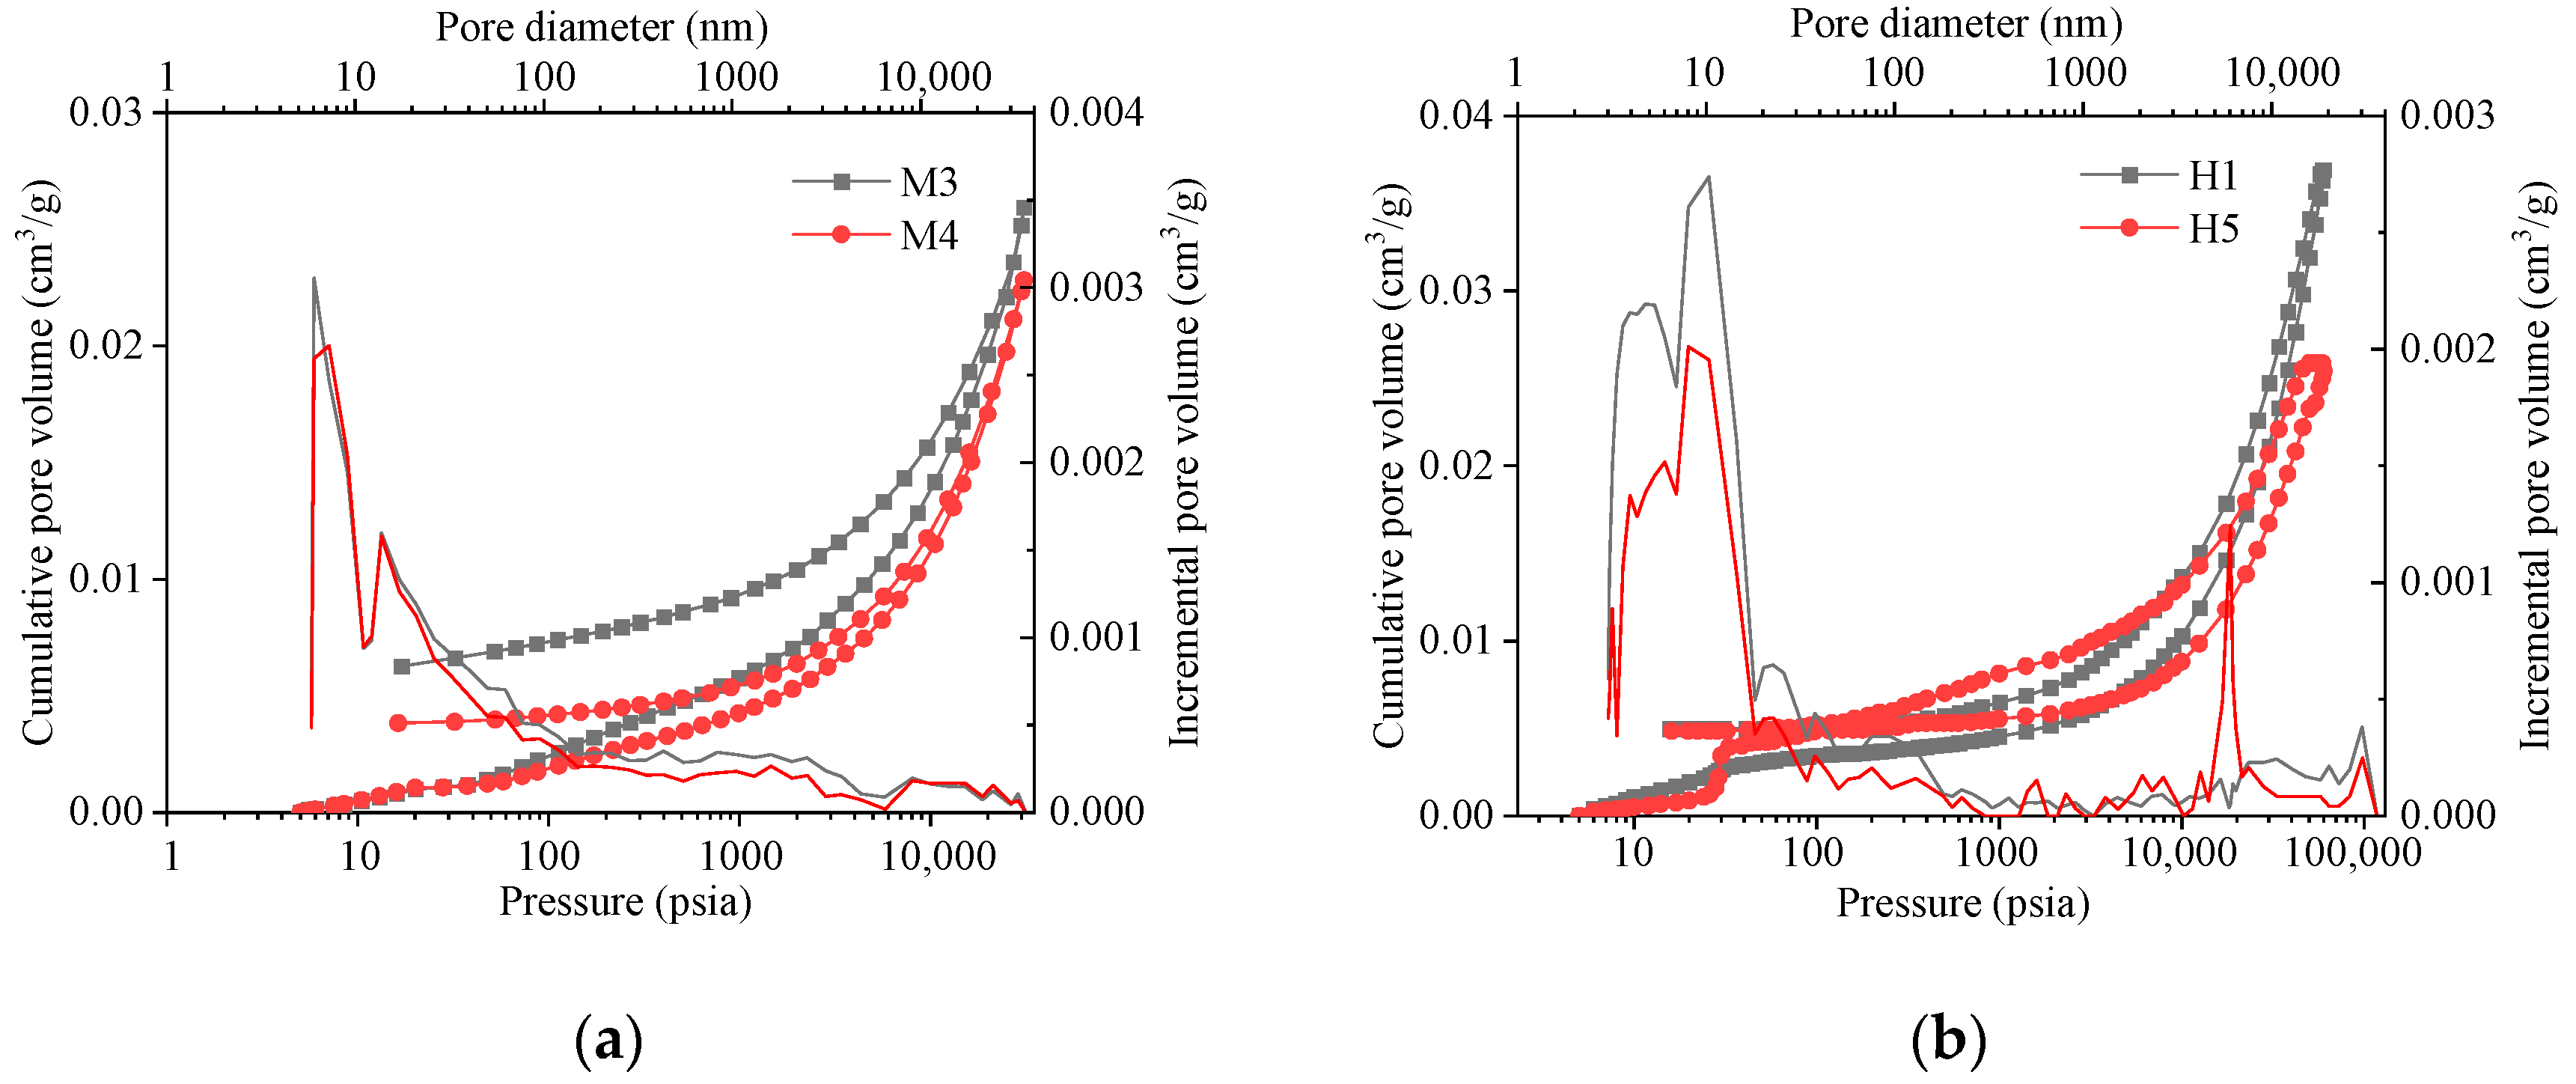
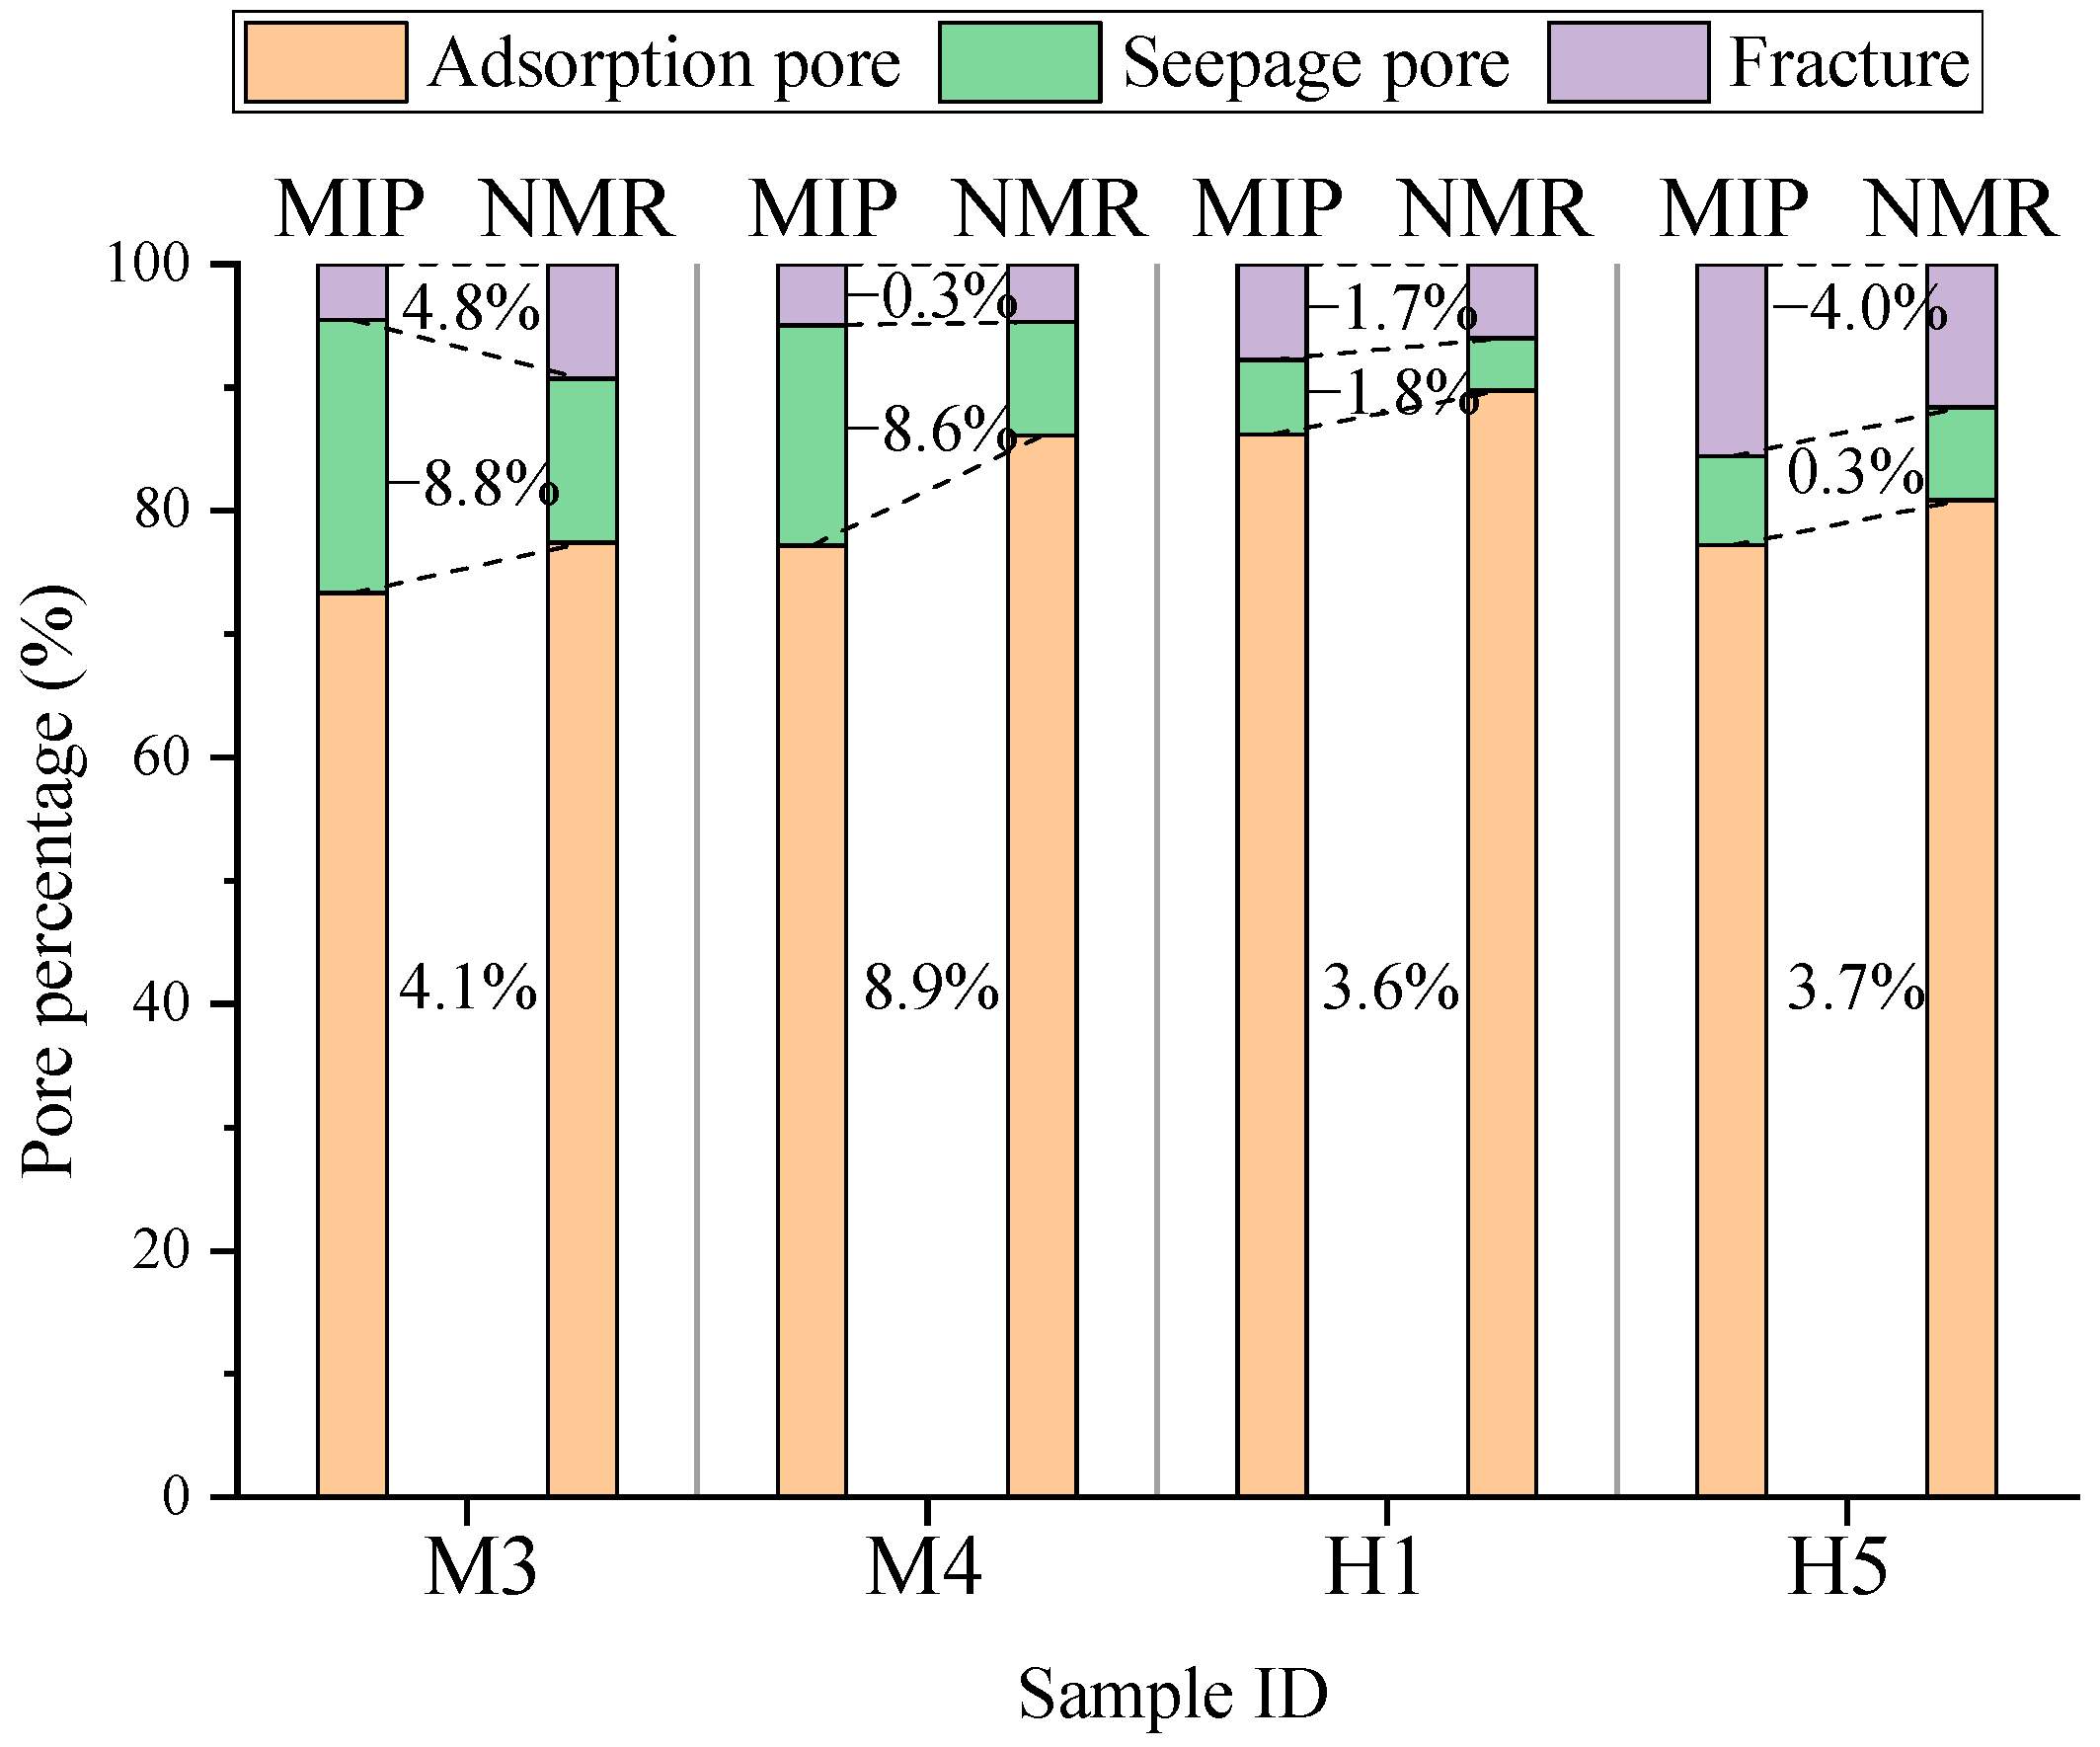
3.2.2. Validation of Pore Size Distribution Between NMR and MIP

Parallel MIP measurements are conducted on four representative samples (M3, M4, H1, and H5) to verify the pore size distribution derived from NMR testing. The hysteresis loops between the injection and ejection curves in samples M3 and M4 are wider than those of H1 and H2 (Figure 5), indicating more open or connected pores in medium-rank coals [12]. The curves of incremental pore volumes are multi-peaked, and the main peak values are located in adsorption pores (Figure 5). In addition, the peaks in the range of seepage pores in M3 and M4 are greater than those of H1 and H2, suggesting that more seepage pores exist in MC.
Figure 6 shows the comparison of the percentages of different pore types obtained via the MIP and NMR methods. Data from MIP testing underestimated the adsorption pore fractions by 3.6–8.9%, while overestimating seepage pores by 1.8–8.8% compared to the NMR results. Fracture proportions showed variable deviations, with MIP underestimating fractures in M3 by 4.8%, but overestimating them in H5 by 4.0%. These variations are mainly caused by two factors: Firstly, MIP testing can only identify pores with a diameter larger than 3.6 nm, leading to an underestimation of adsorption pores. Secondly, granular samples used in MIP testing may disrupt natural fracture networks, while cylindrical samples (2.5 cm × 5 cm) used in NMR preserve in situ pore structures. Overall, the differences between the two methods are less than 9%, which verifies the reliability of the NMR method.

3.3. Multifractal Characteristics

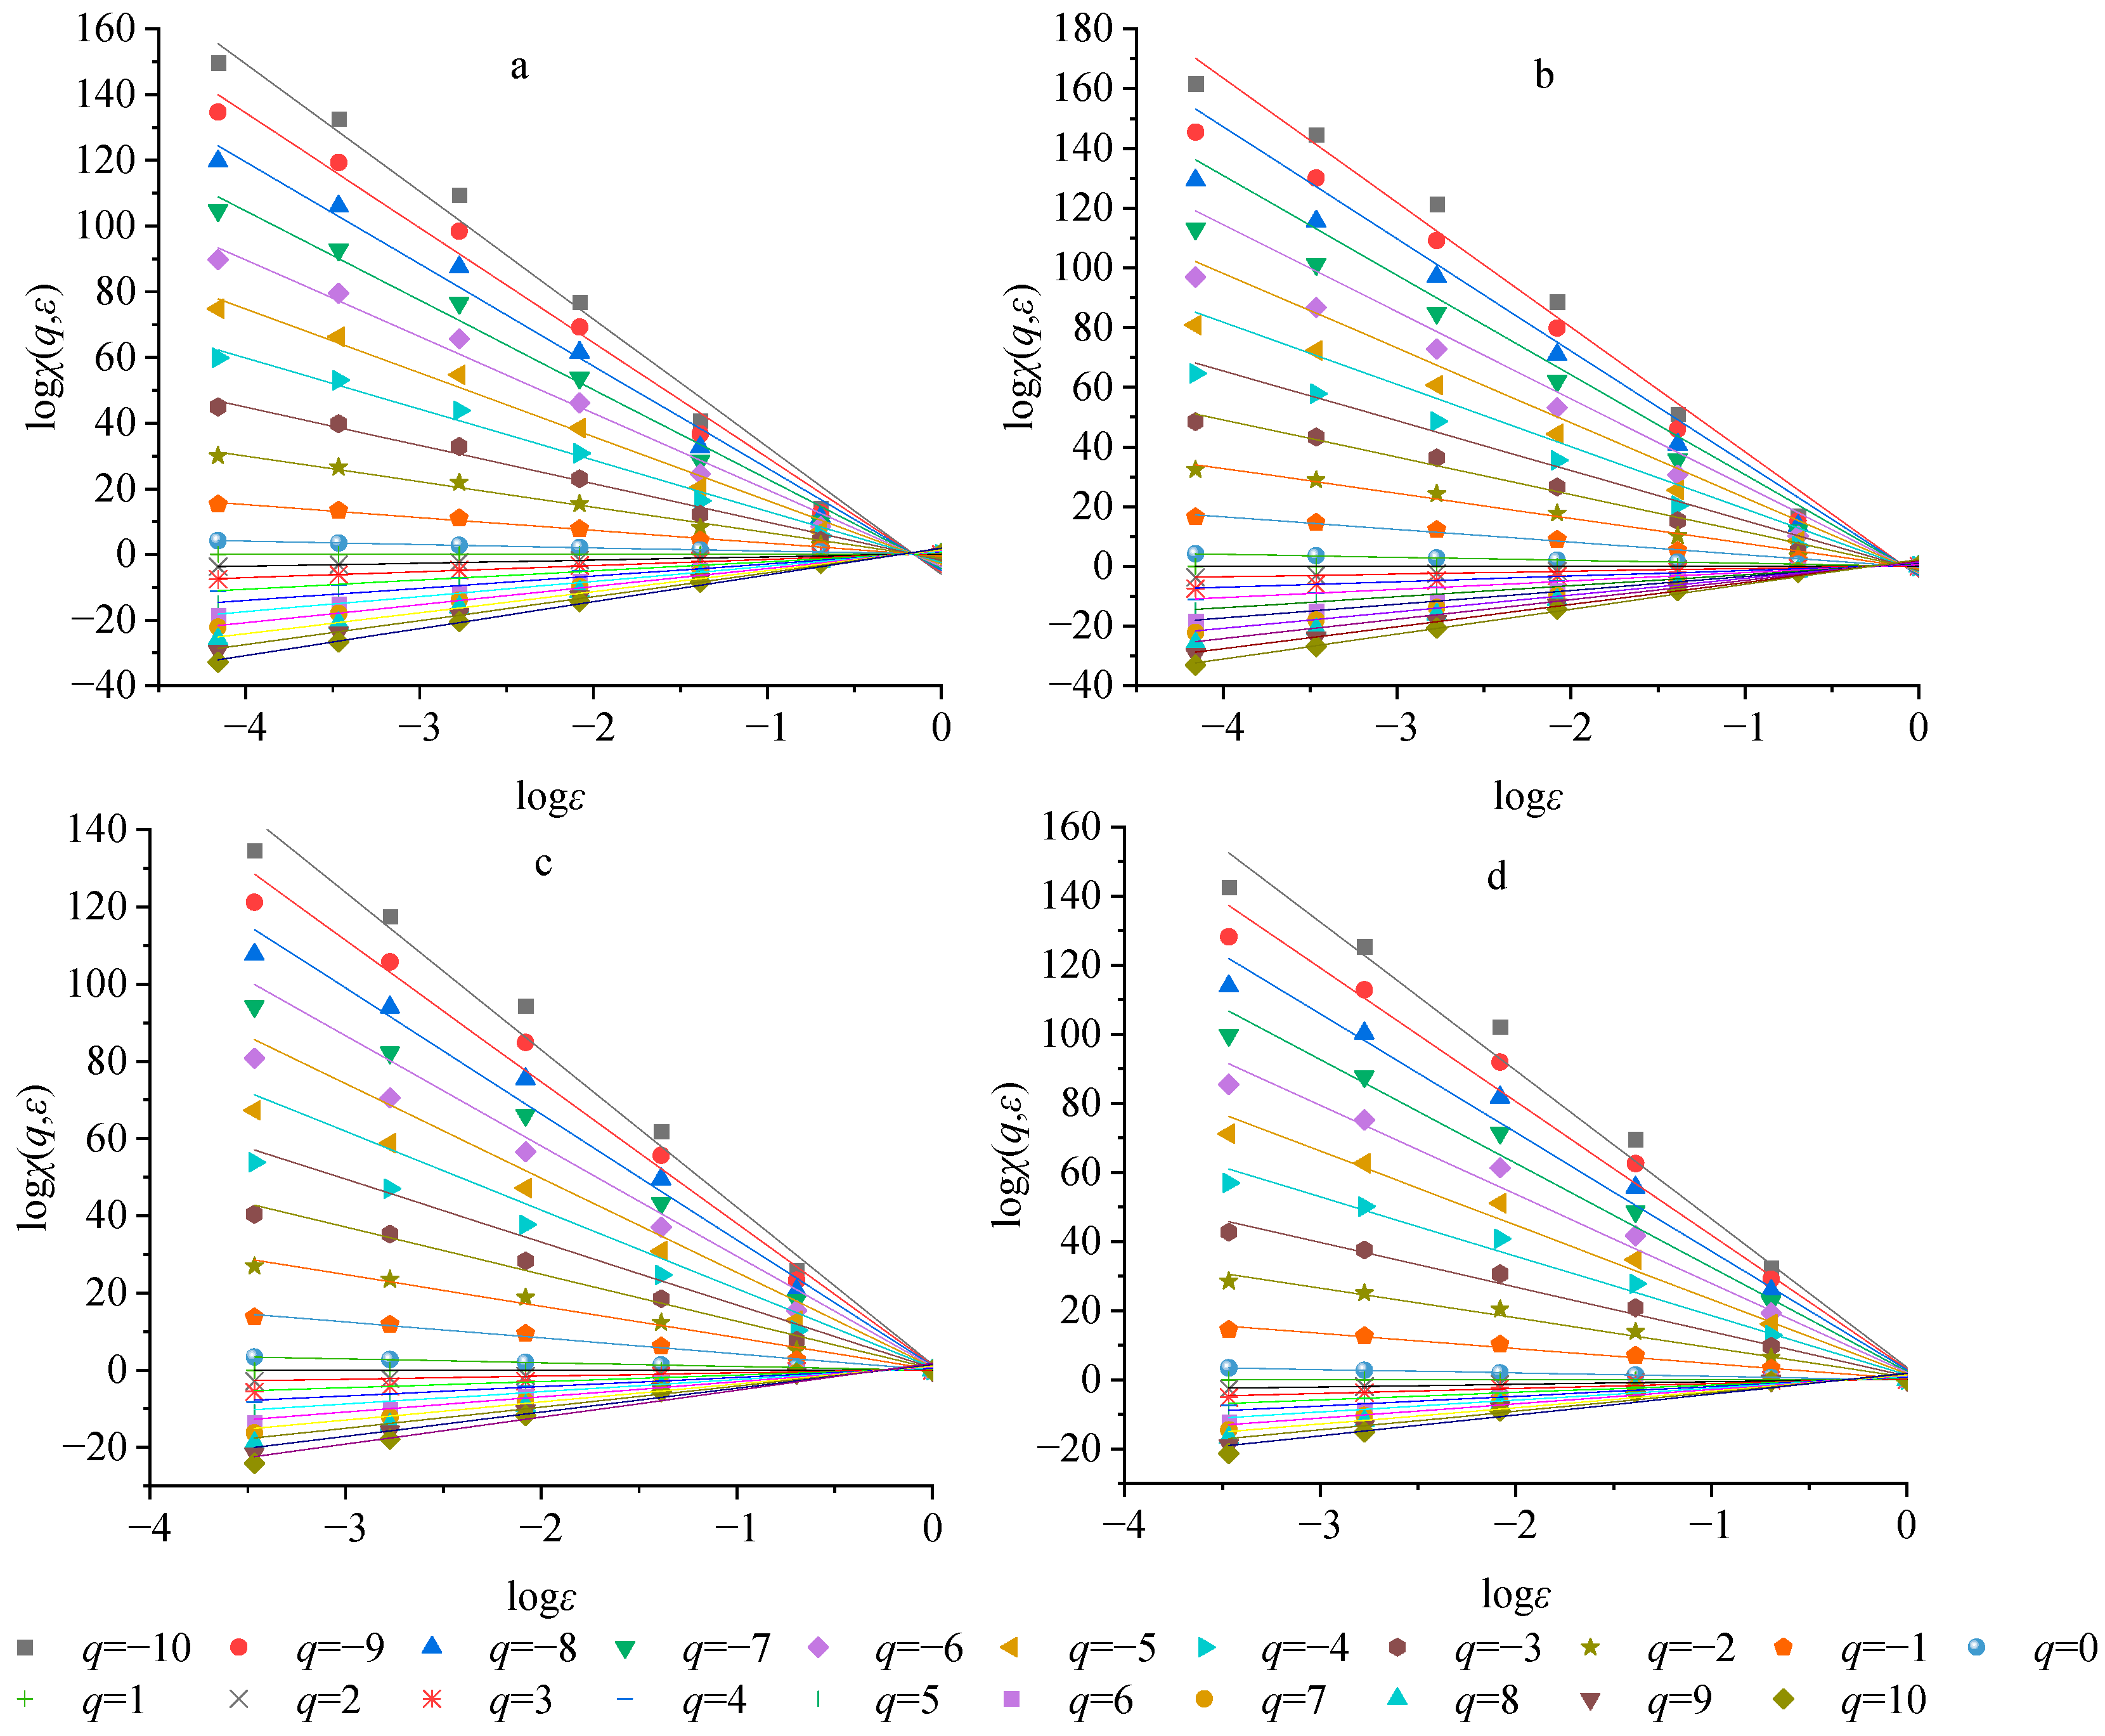
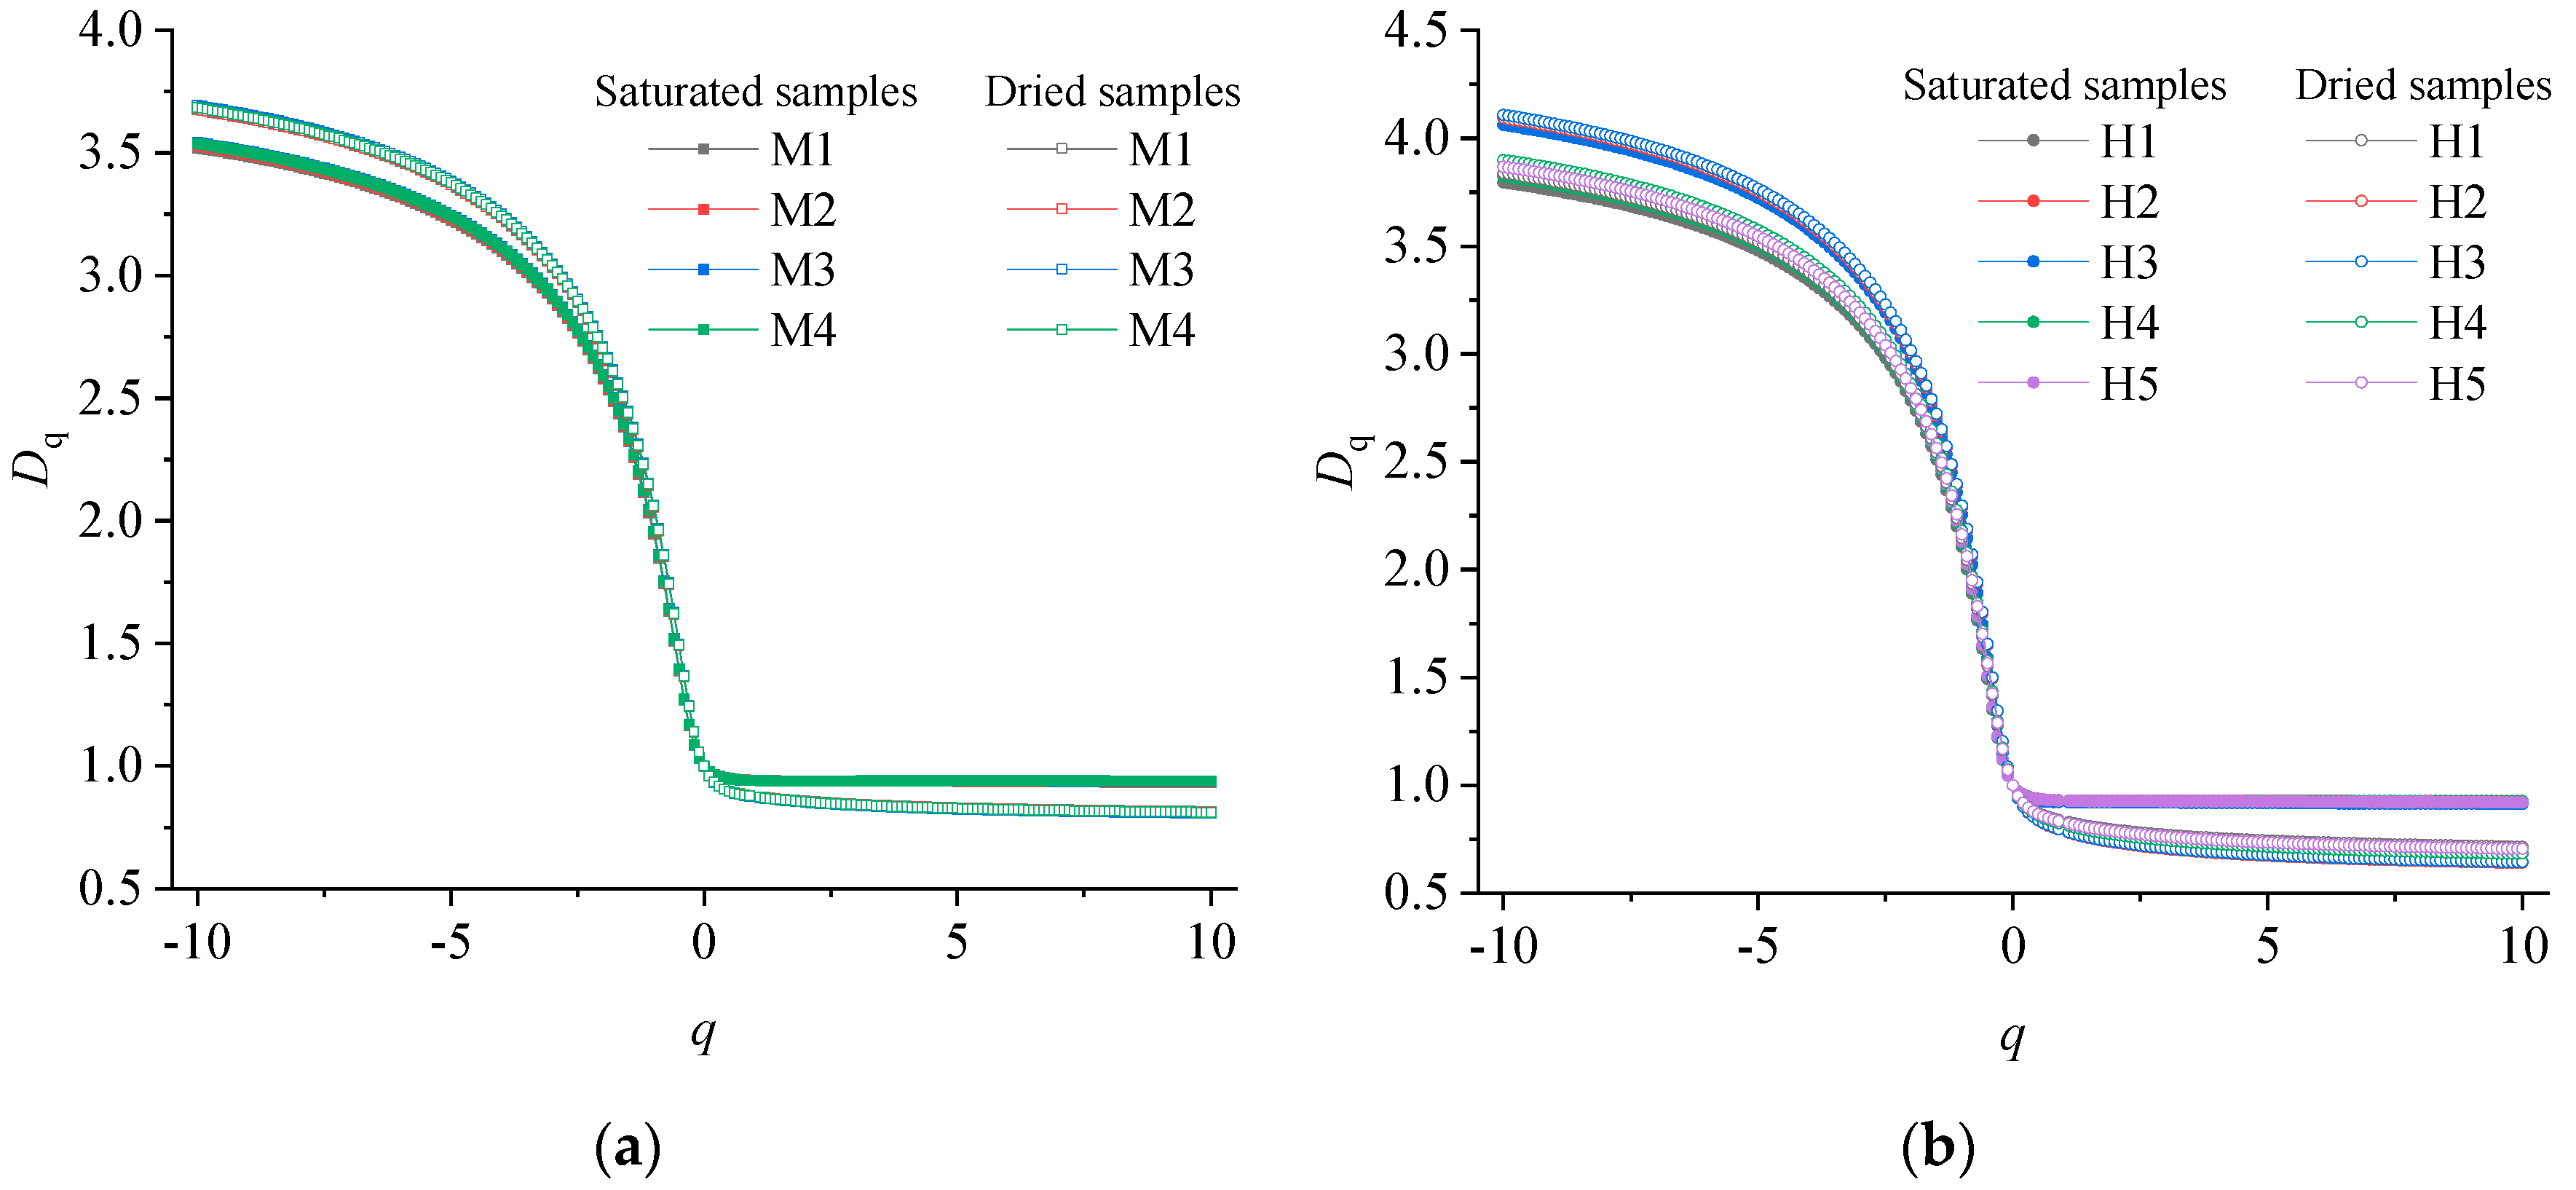
3.3.1. The Generalized Dimensional Spectrum Characteristics

The double logarithm plots between the partition function χ(q,ε) and the box scale ε for samples in different situations are shown in Figure 7. Strong linear relationships (R2 > 0.94) between log χ(q,ε) and logε imply that the pore structure distribution and residual water distribution correspond to multifractal features [43]. The characteristics of a negative relationship between log χ(q,ε) and logε when q < 0, and a positive relationship between them when q > 0 under water-saturated conditions indicate that micropores are relatively concentrated in smaller pore spaces (Figure 7a,b). Similar characteristics of log χ(q,ε) and logε in dry conditions suggest that the residual water is more concentrated in smaller pores and struggles to migrate (Figure 7c,d).
Figure 8 illustrates the generalized dimensions Dq of MC and HC under varied conditions, where Dq exhibits a pronounced inverted S-shape, with steep declines in Dq at negative q values (q < 0, low-probability regions corresponding to micropores) and gradual decreases at positive q values (q > 0, high-probability regions linked to macropores) [6,10,40,44]. This asymmetry underscores the enhanced heterogeneity in low-probability regions. In addition, compared with the water-saturated samples, for the dried samples, the value of Dq increases when q < 0 and decreases when q > 0. The increasing trend in D−10 and the decreasing trend in D10 is due to the increasing proportion of residual water in adsorption pores in dry conditions and the significant difference between residual water in adsorption pores and seepage pores, respectively. Moreover, the trend is more pronounced in HC, indicating that the distribution of residual water in the pores has stronger heterogeneity, especially in HC.
Table 2 lists the multifractal parameters of Dq under varied conditions. When the multifractal matrix q = 0, 1, 2, Dq represents the capacity dimension, information dimension, and the correlation dimension, respectively. Specifically, D0 offers an overall assessment of the space—filling capacity of the pore system. D1 is associated with the entropy value of the system and can effectively indicate the heterogeneity of pore distribution. A higher D1 value suggests a broader range of pore sizes and a more uniform pore distribution [16,45]. Meanwhile, D2 reflects the inter-relationship between different components of the pore structure. Dmin (corresponding to D−10) and Dmax (corresponding to D10) represent the generalized dimensions at the extreme values.
For all samples, D0 = 1, thus a common relationship D0 > D1 > D2 can be observed, which is a clear indication of the samples’ multifractal features [46]. As illustrated in Table 2, the D1 values of water-saturated MC range from 0.9420 to 0.9430 (mean of 0.9426), while those of HC range from 0.9219 to 0.9301 (mean of 0.9277), indicating that the pore size distribution of the MC is more uniform than that of HC. The Hurst index (H) calculated from D2 is mainly used to characterize the degree of pore connectivity [5]. The values of H range from 0.9700 to 0.9703 and 0.9607 to 0.9644 for MC and HC, respectively. The results show a better seepage–fracture connectivity for MC, which is consistent with the T2 spectrum. The values of spectrum width D−10D10, D−10D0, and D0D10 provide the heterogeneity of the pore size distribution in the entire range, pore structure within the low-probability measurement area, and pore structure within the high-probability measurement region. The D−10D10 values of the MC range from 2.5849 to 2.6055 (mean of 2.5960) and of the HC range from 2.8695 to 3.1475 (mean of 2.9483) indicate that the heterogeneity of the whole pore distribution in HC is higher than that in MC. In addition, the higher values of D−10D0 indicate the stronger heterogeneity of seepage pores and fractures compared to adsorption pores in the samples, and this phenomenon is more pronounced in HC.
In the dry state, the values of D1 for all samples decrease (Table 2), which is primarily attributed to the evaporation of water from seepage pores and fractures. Subsequently, the residual water predominantly accumulates in the smaller pore spaces, leading to worse connectivity. Furthermore, similar to water-saturated samples, the dried HC samples exhibit smaller D1 values (D1 = 0.7875–0.8339). The lower D1 reflects heightened spatial heterogeneity in the residual moisture distribution, which is related to the poor pore connectivity of HC—a consequence of vitrinite-dominated structures and poorly interconnected micropore networks. The decreased value of H (0.9263–0.9286 for MC and 0.8672–0.8970 for HC) provides further evidence of poor connectivity in residual water distribution. The values of D−10D10 for all samples turned to increase in the dry state, with HC demonstrating more pronounced increments (Figure 9), indicative of enhanced residual moisture heterogeneity in HC. For MC, there is little difference between the increased amplitudes of the left branch D−10D0 and right branch D0D10. In contrast, HC displays significantly larger right branch increments, reflecting preferential micropore heterogeneity amplification (Figure 9, Table 2).

3.3.2. The Multifractal Singular Spectrum Characteristics

The multifractal singularity spectra f(α)-α can also be used to quantify the heterogeneity intensity of the research object, as well as the heterogeneity differences among sparse regions, dense regions, and regions with different densities [47]. The parameter α0 corresponds to the mean singularity strength of pore size distribution, with larger values reflecting a constricted distribution range and more pronounced heterogeneity. Table 3 shows that under water-saturated conditions, α0 values for MC range more narrowly (1.2591–1.2656) than that of HC (1.3437–1.4225), reflecting homogeneous pore networks in MC. Drying induces a systematic α0 increase for all samples (1.4749–1.4838 for MC and 1.5715–1.7172 for HC), which reflects the stronger heterogeneity in residual water distribution. This phenomenon is consistent with the result of Dq observed in Section 3.3.1. Greater values of the f(α) spectra α10−α10+ can be found in HC (Table 3). The broader widths of the f(α) spectra indicate a complex pore structure, indicating greater variability in pore sizes [18,27]. The spectral width also expands in dried samples, particularly for HC. The lengths of the left branch (α0α10+) and the right branch (α10−α0) describe the pore structure in the low-probability and high-probability measurement zone, respectively. Drying amplifies the left branch widths and reduces the right branch widths (Table 3, Figure 10). The asymmetry index Rd = [(α0α10+) –(α10−α0)] quantifies the deviation degrees of the spectrum to the center. When Rd equals 0, the singularity spectra exhibit symmetry around α0. Table 3 and Figure 10 show that all samples exhibit Rd < 0 and that the f(α) spectrum deviates to the right, reflecting preferential control via sparsely distributed regions which corresponded to negative values of q [26,30].
The value of Δf = f(αmin) − f(αmax) was used to represent the vertical difference between the two branches of the spectrum. Δf > 0 indicates that the left branch of the spectrum is shorter than the right branch, suggesting a smaller variation in the geometrical size of points with minimum α exponents [26]. The values of Rd and Δf in water-saturated samples are much larger than those in dry samples (Figure 11), indicating that the rightward deviations of the singular spectrum are stronger, and that the right branches are longer under water-saturated conditions. Overall, the high-rank coal samples are more heterogeneous than the middle-rank coal samples, and the residual water distribution is more complicated and heterogeneous.

4. Discussion

4.1. The Distribution of Multiphase Water Based on NMR

Water in coal can be divided into free water, mainly existing in seepage pores or fractures, and bound water, dominating in adsorption pores [3,48,49]. Figure 12 shows the multiphase water distribution of samples M1 and H1 according to the NMR T2 spectra distributions in water-saturated and dry conditions. After drying, the distributions of the two rightmost T2 spectra show a noticeable reduction (P2) or even disappearance (P3) (Table 4), indicating that almost all the water in the seepage pores and fractures has evaporated (the orange district in Figure 12). Compared with the reduction in P2 and P3, the peaks of adsorption pores (P1) in medium-rank coals demonstrate a declining trend, whereas P1 in high-rank coals remains predominantly unchanged (Figure 3, Figure 12). On the one hand, the distributions of residual water are primarily composed of adsorbed water within micropores due to the strong retention of bound water, and the effect of bound water is stronger in high-rank coals. This is mainly due to the advanced thermal maturation in HC, which enhances capillary forces (retaining bound water via strong surface interactions) and increases the pore-specific surface area for water adsorption, while MC shows better pore structure connectivity, promoting the migration of movable water. On the other hand, the evaporated water from seepage pores and fractures increases the fluid volume to fluid surface area ratio in unsaturated samples, leading to the surface relaxation enhancement effect and making the residual water have a shorter relaxation time [9], which is more obvious in the more heterogeneous HC.
The migration of moisture in coal represents a complex and continuous process, significantly affected by coal pore structures. There are overlapping T2 distributions of absorbed and free water in coal. When samples are undergoing the desiccation process, the free water within specific pore size ranges initially moves towards the coal surface and then evaporates. Once the majority of the free water has been released, the bound water starts to evaporate in succession [49]. Ma et al. [50] found that the adsorption pores exhibit stronger spontaneous imbibition, and that the capillary force enhances the binding effect of water. HC has a relatively high proportion of adsorption pores and significant size variability (evidenced by higher multifractal parameters like D−10D10) than MC, leading to the preferential migration of water through larger throats, and the retention of water in constricted regions, thus, the reduction in P1 in HC decreases less. In contrast, pores with larger sizes, corresponding to higher T2 values, possess a larger pore volume and weaker capillary forces. As a result, these larger pores have less impact on the movement of moisture. Consequently, it is relatively easier for moisture to migrate through larger pores compared to smaller ones. According to the research results of this study and previous studies, the distributions of saturated and residual water in coal are shown in Figure 13.

4.2. The Relationship Between T2 Spectra and Multifractal Parameters

Figure 14 demonstrates the correlations between the T2 spectrum area of different pore types and multifractal parameters (H, D−10D10, α10−α10+, Rd). In water-saturated conditions, the proportion of the adsorption pore spectrum area (Sa) shows a weak negative linear correlation with pore connectivity and the heterogeneity index (Rd), while exhibiting positive correlations with D−10D10 and α10−α10+. These trends suggest that an increase in adsorption pores may weaken the pore connectivity and enhance pore heterogeneity. The positive correlations with D−10D0, D0D10, α10−α0, and α0α10 indicate that adsorption pores simultaneously enhance the heterogeneity of low- and high-probability measurement zones (Table 5). Additionally, the influence of Sa on D−10D0 and α10−α0 is slightly stronger than that on D0D10 and α0α10+, reflecting the dominant role of low-value regions in controlling pore structure heterogeneity. The influencing effects of the sum of the seepage pores and fractures (Ss+f) show an opposite trend compared to the adsorption pores (Figure 14a,c). This indicates that the existence of seepage pores and fractures increases pore connectivity and reduces pore heterogeneity.
In dry conditions, the correlations between the proportions of adsorption pores, the sum of seepage pores and fractures, and multifractal parameters are significantly weaker (Figure 14b,d; Table 5). This can be attributed to inhomogeneous residual water distribution in seepage pores and fractures after evaporation. As discussed in Section 4.1, residual water in coal under dry conditions primarily consists of immobile and bound water stored in unconnected adsorption pores and pore throat corners (Figure 13), resulting in complex and heterogeneous pore structures.

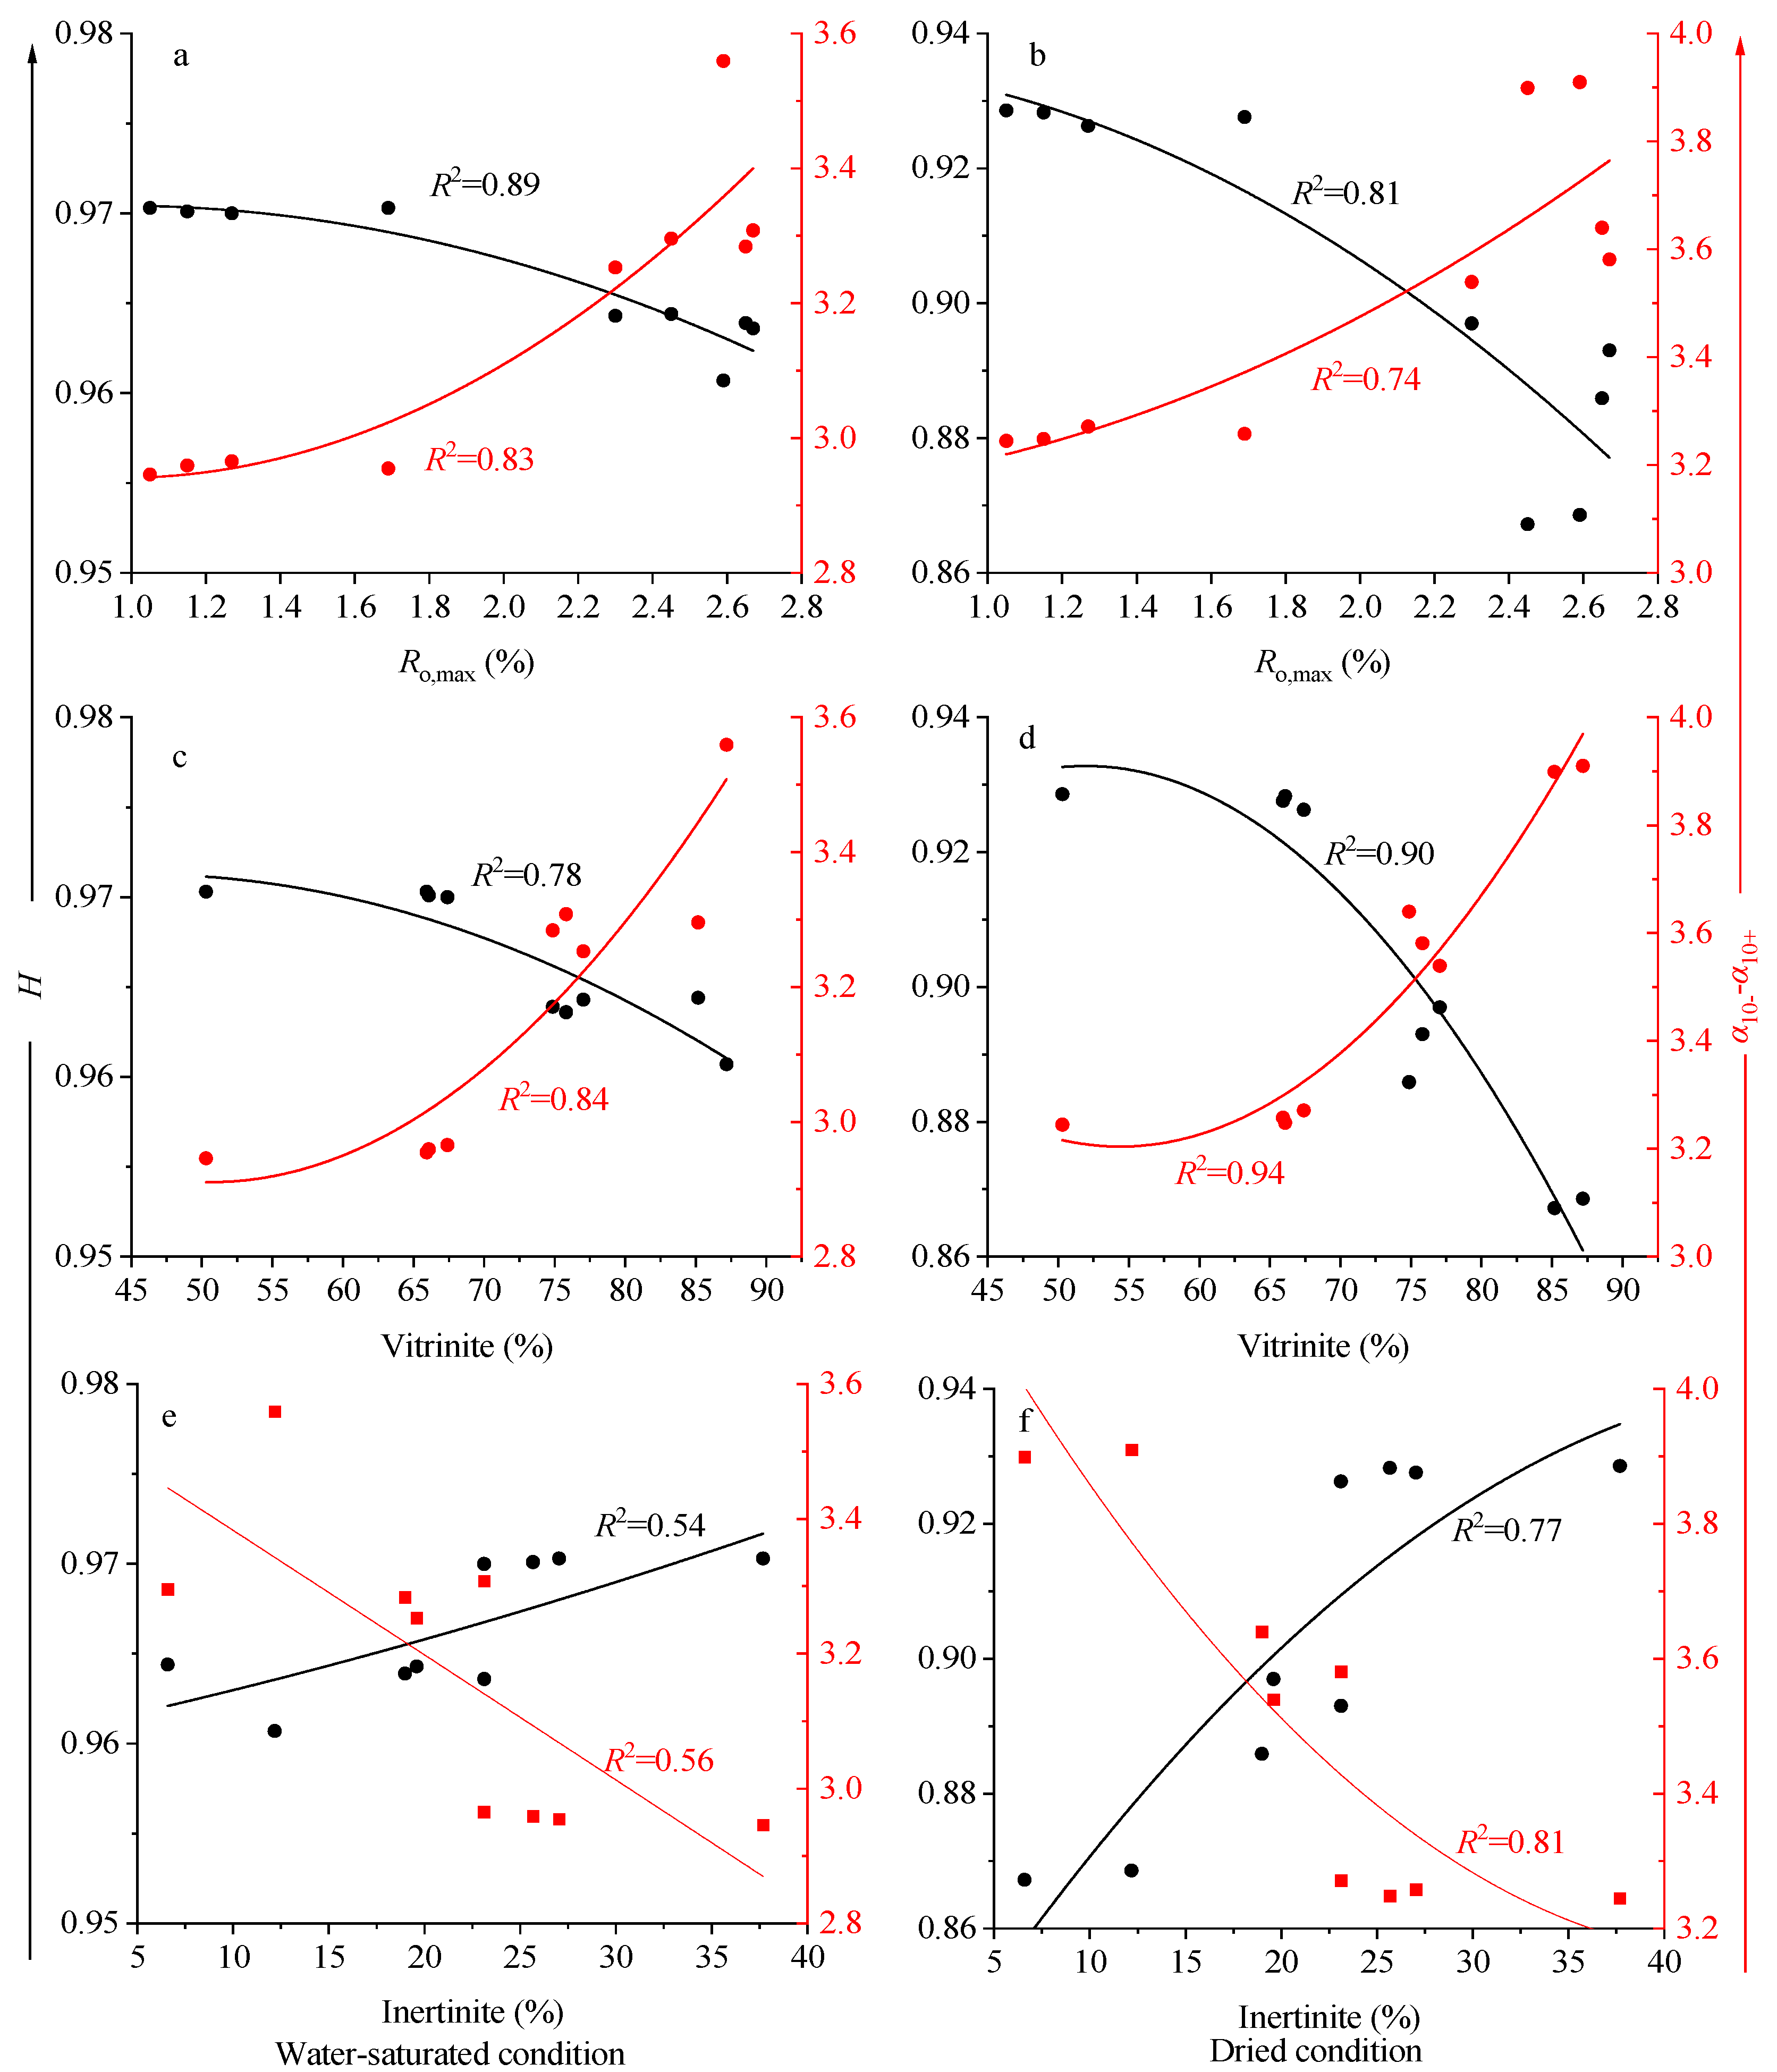
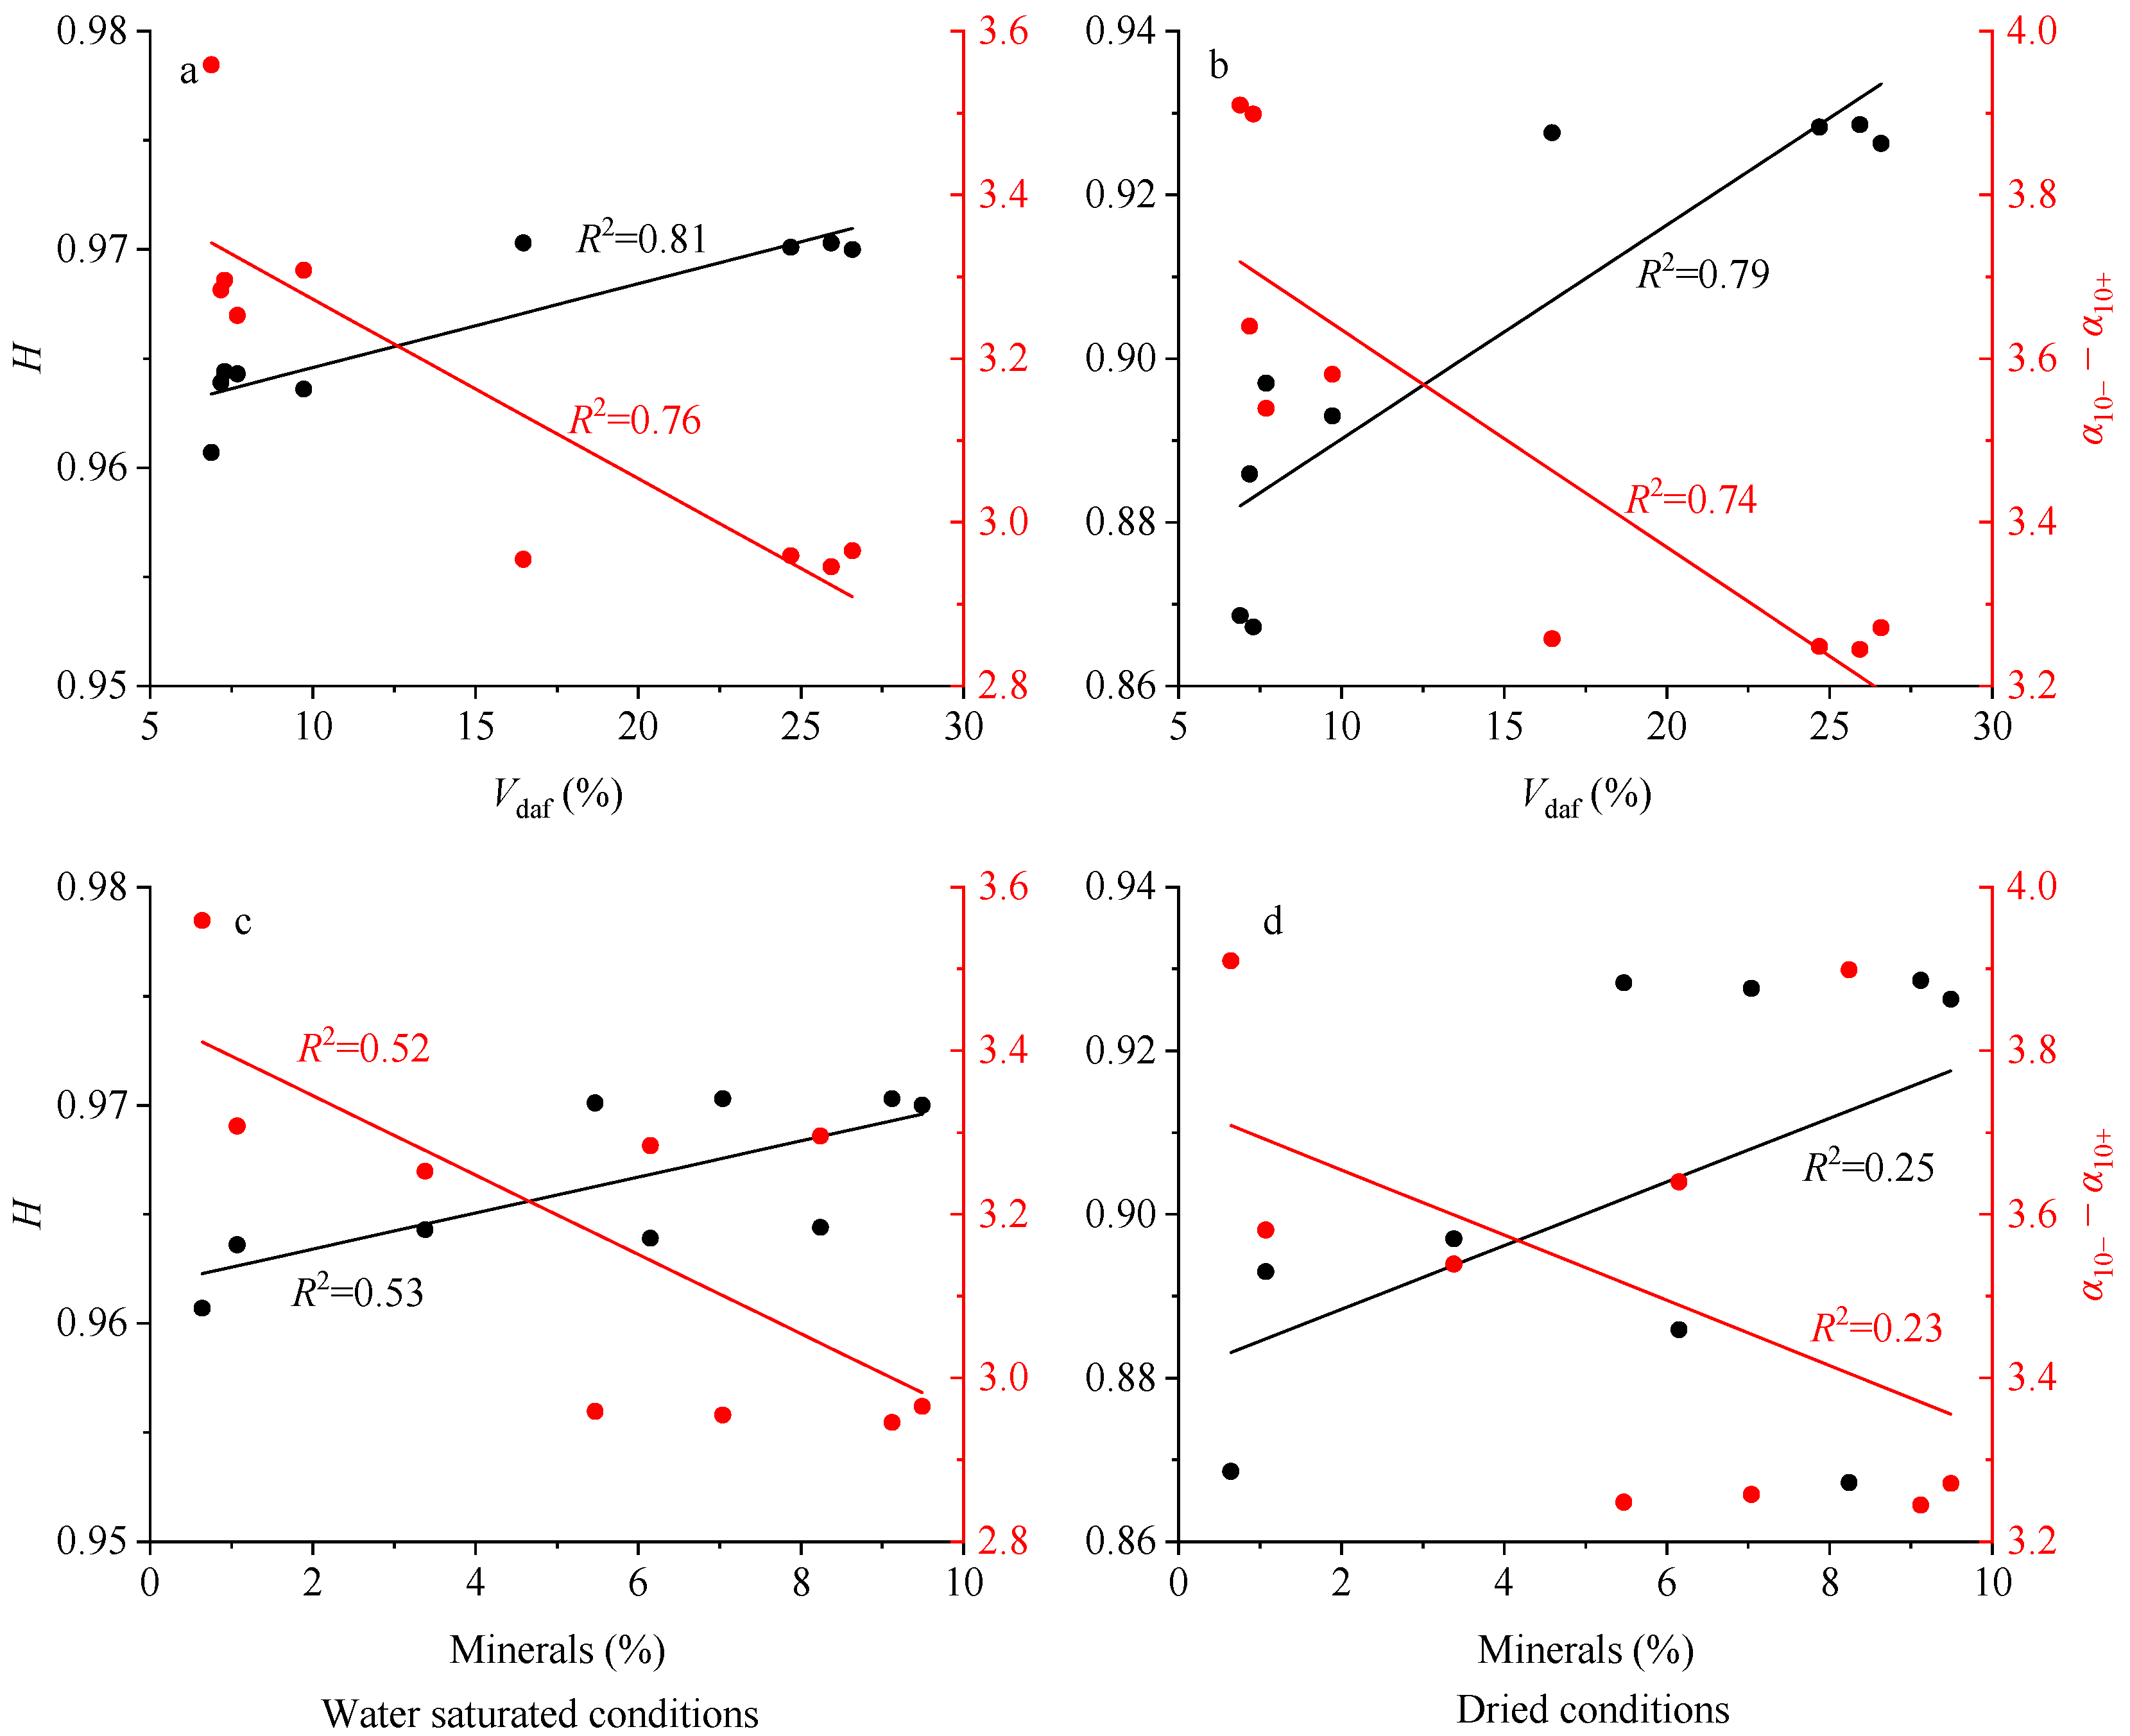
4.3. Influencing Factors of Multifractal Parameters in Coal Samples

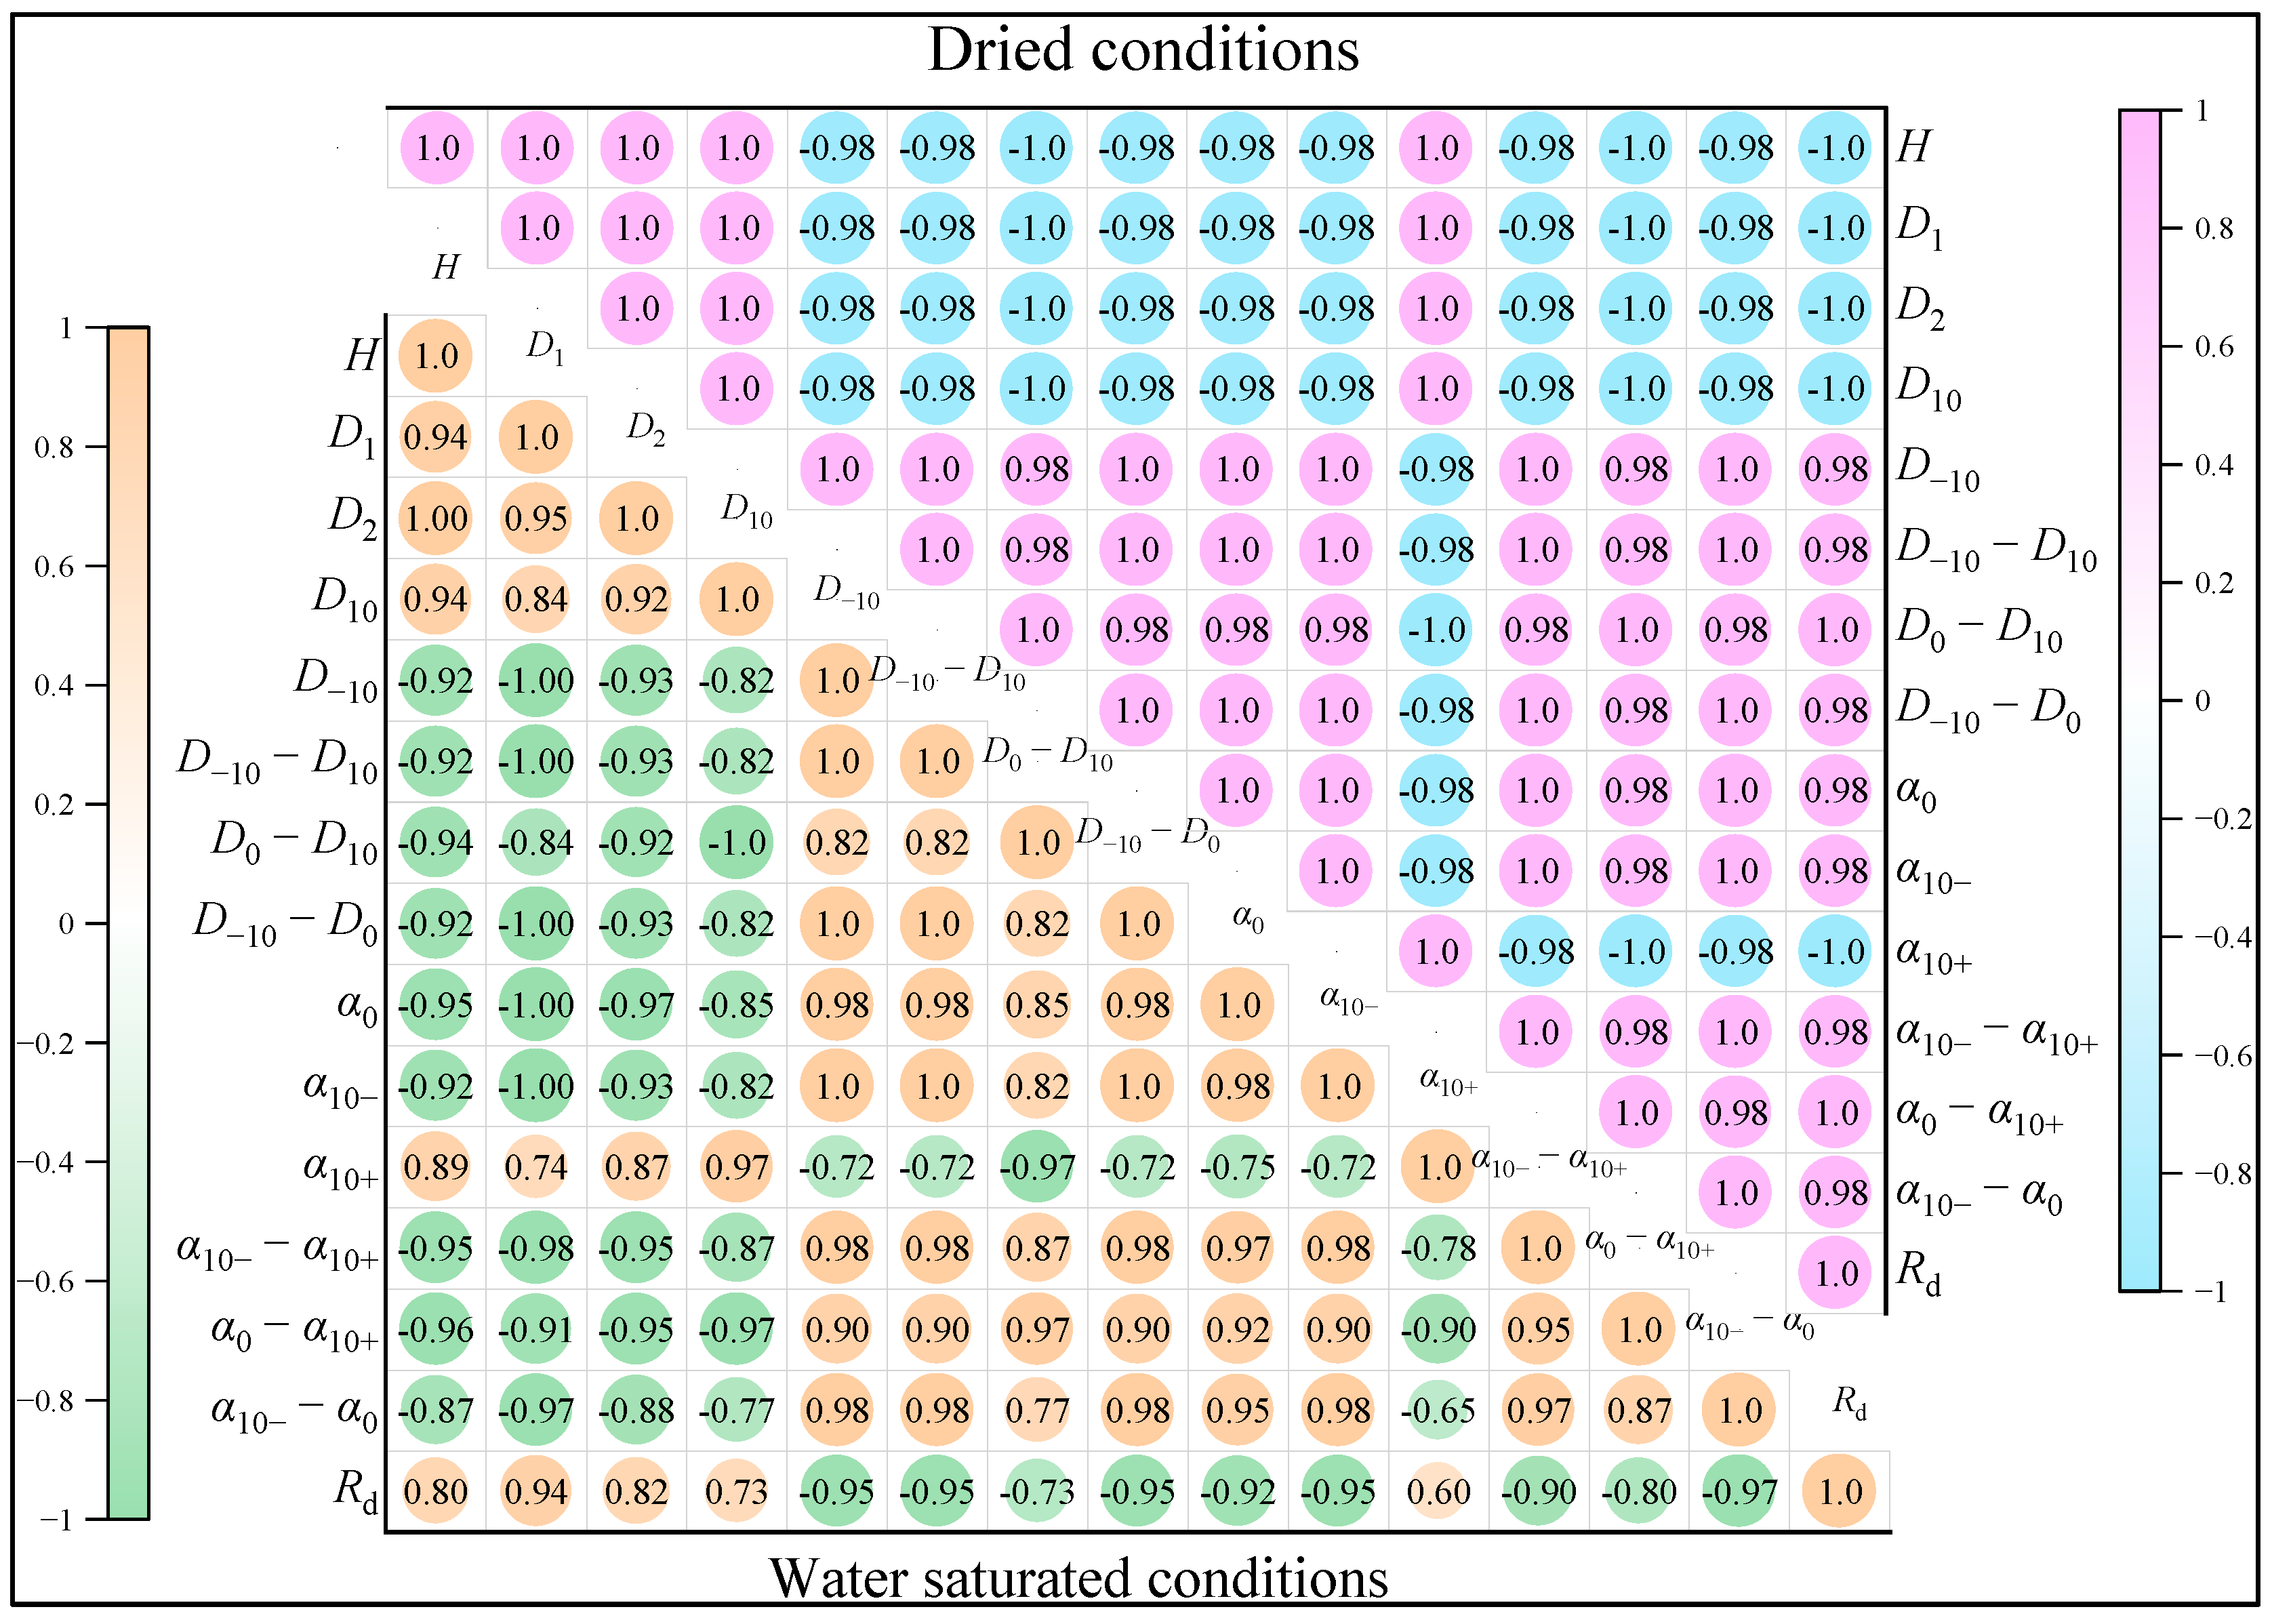
4.3.1. Correlation Analysis of Multifractal Parameters

Spearman correlation analysis was employed to investigate the relationships between multifractal parameters under different conditions (Figure 15). Significantly stronger correlations among multifractal parameters were observed under dry conditions, indicating the complexities of residual water distribution. Moreover, the high degree of consistency among these parameters suggests that they share the same physical meaning in characterizing pores’ structural features. In water-saturated conditions, H exhibits a strong positive correlation with Rd (R2 = 0.80), indicating that systems with good pore connectivity display homogenizing fluid pathways and reduced heterogeneity. D−10D10 shows a negative correlation with Rd (R2 = −0.95), suggesting that broader pore size distributions and irregular spatial clustering remarkably enhance the heterogeneity of pore structures. Notably, D−10D0 exhibit stronger correlations to Rd than D0D10, implying that the heterogeneity is mainly controlled by the low-probability regions. D−10D10, D−10D0, and D0D10 correlate strongly with α10+α10−, α10−α0, and α0α10−, respectively, reflecting the equivalence of the multifractal dimension spectrum q-D(q) and multifractal singularity spectrum α-f(α) in describing the multifractal characteristics of coal’s pore structure. These insights advance the mechanistic understanding of fluid trapping and transport limitations in low-permeability reservoirs, providing a quantitative basis for predicting gas storage capacity and water migration in heterogeneous coal seams.

4.3.2. Influence Factors

The degree of coal metamorphism plays a critical role in determining the pore development characteristics, while the pore structure significantly influences the moisture distribution within coal. Figure 16 shows the impacts of Ro,max, vitrinite content, and inertinite on the multifractal parameters (H and α10−α10+). A strong negative relationship exists between Ro,max and H (R2 = 0.89 under water-saturated conditions; R2 = 0.81 under dry conditions), while Ro,max positively correlates with α10−α10+ (R2 = 0.83 under water-saturated conditions; R2 = 0.74 under dry conditions)(Figure 16a,b). In medium- and high-rank coals, increasing coal metamorphism enhances aromatization and cycle polycondensation, thereby increasing the proportion of micropores [51,52,53]. As discussed in Section 4.2, the proportion of adsorption pores has a positive impact on the heterogeneity of pore structures. High-rank coals exhibit more complex pore structures and reduced connectivity, trapping gas in isolated pores. During the process of CBM production, enhanced recovery techniques are needed. In contrast, medium-rank coals show more developed seepage pores and fractures (Figure 4), where microfractures will increase pore connectivity and reduce heterogeneity, favoring gas diffusion. Under dry conditions, complex pore structures and strong effects of bound water in HC reduce pore connectivity and increase the heterogeneity of residual water distribution (Figure 16b). The vitrinite contents show negative correlations with H (R2 = 0.84 under water-saturated conditions; R2 = 0.90 under dry conditions) and positive correlations with α10−α10+ (R2 = 0.78 and 0.94, respectively) (Figure 16c,d). The impact of inertinite content on H and α10−α10+ is opposite to that of vitrinite (Figure 16e,f). Therefore, as the vitrinite content increases, the connectivity of the pore structure and residual water decreases, and the heterogeneity of pore size distribution increases. A high content of vitrinite in coal promotes the development of micropores, increasing the complexity of the pore structure and reducing pore connectivity, and thus enhancing the heterogeneity [36].
Vdaf exhibits relatively strong positive correlations with multifractal parameters (Figure 17a,b), confirming coal metamorphism as the primary control on multifractal behavior. The impacts of minerals on multifractal parameters are consistent with those of Vdaf (Figure 17c,d), meaning that the minerals have a positive effect on pore connectivity and a negative effect on pore heterogeneity and complexity. This may be caused by pore agglomeration and the connection of pores and microfractures [12]. There are few or no obvious correlations observed between Mad, Ad, and multifractal parameters (Table 6), suggesting the negligible impacts of Mad and Ad on multifractal parameters in this study.

5. Conclusions

To investigate the multifractal characteristics of pore heterogeneity and multiphase water distribution in medium- and high-rank coals, nuclear magnetic resonance experiments were performed on nine medium- and high-rank coal samples under water-saturated and dry conditions. The relationships between the T2 spectra, multifractal parameters, and the influencing factors are also discussed. The conclusions are as follows:
(1)
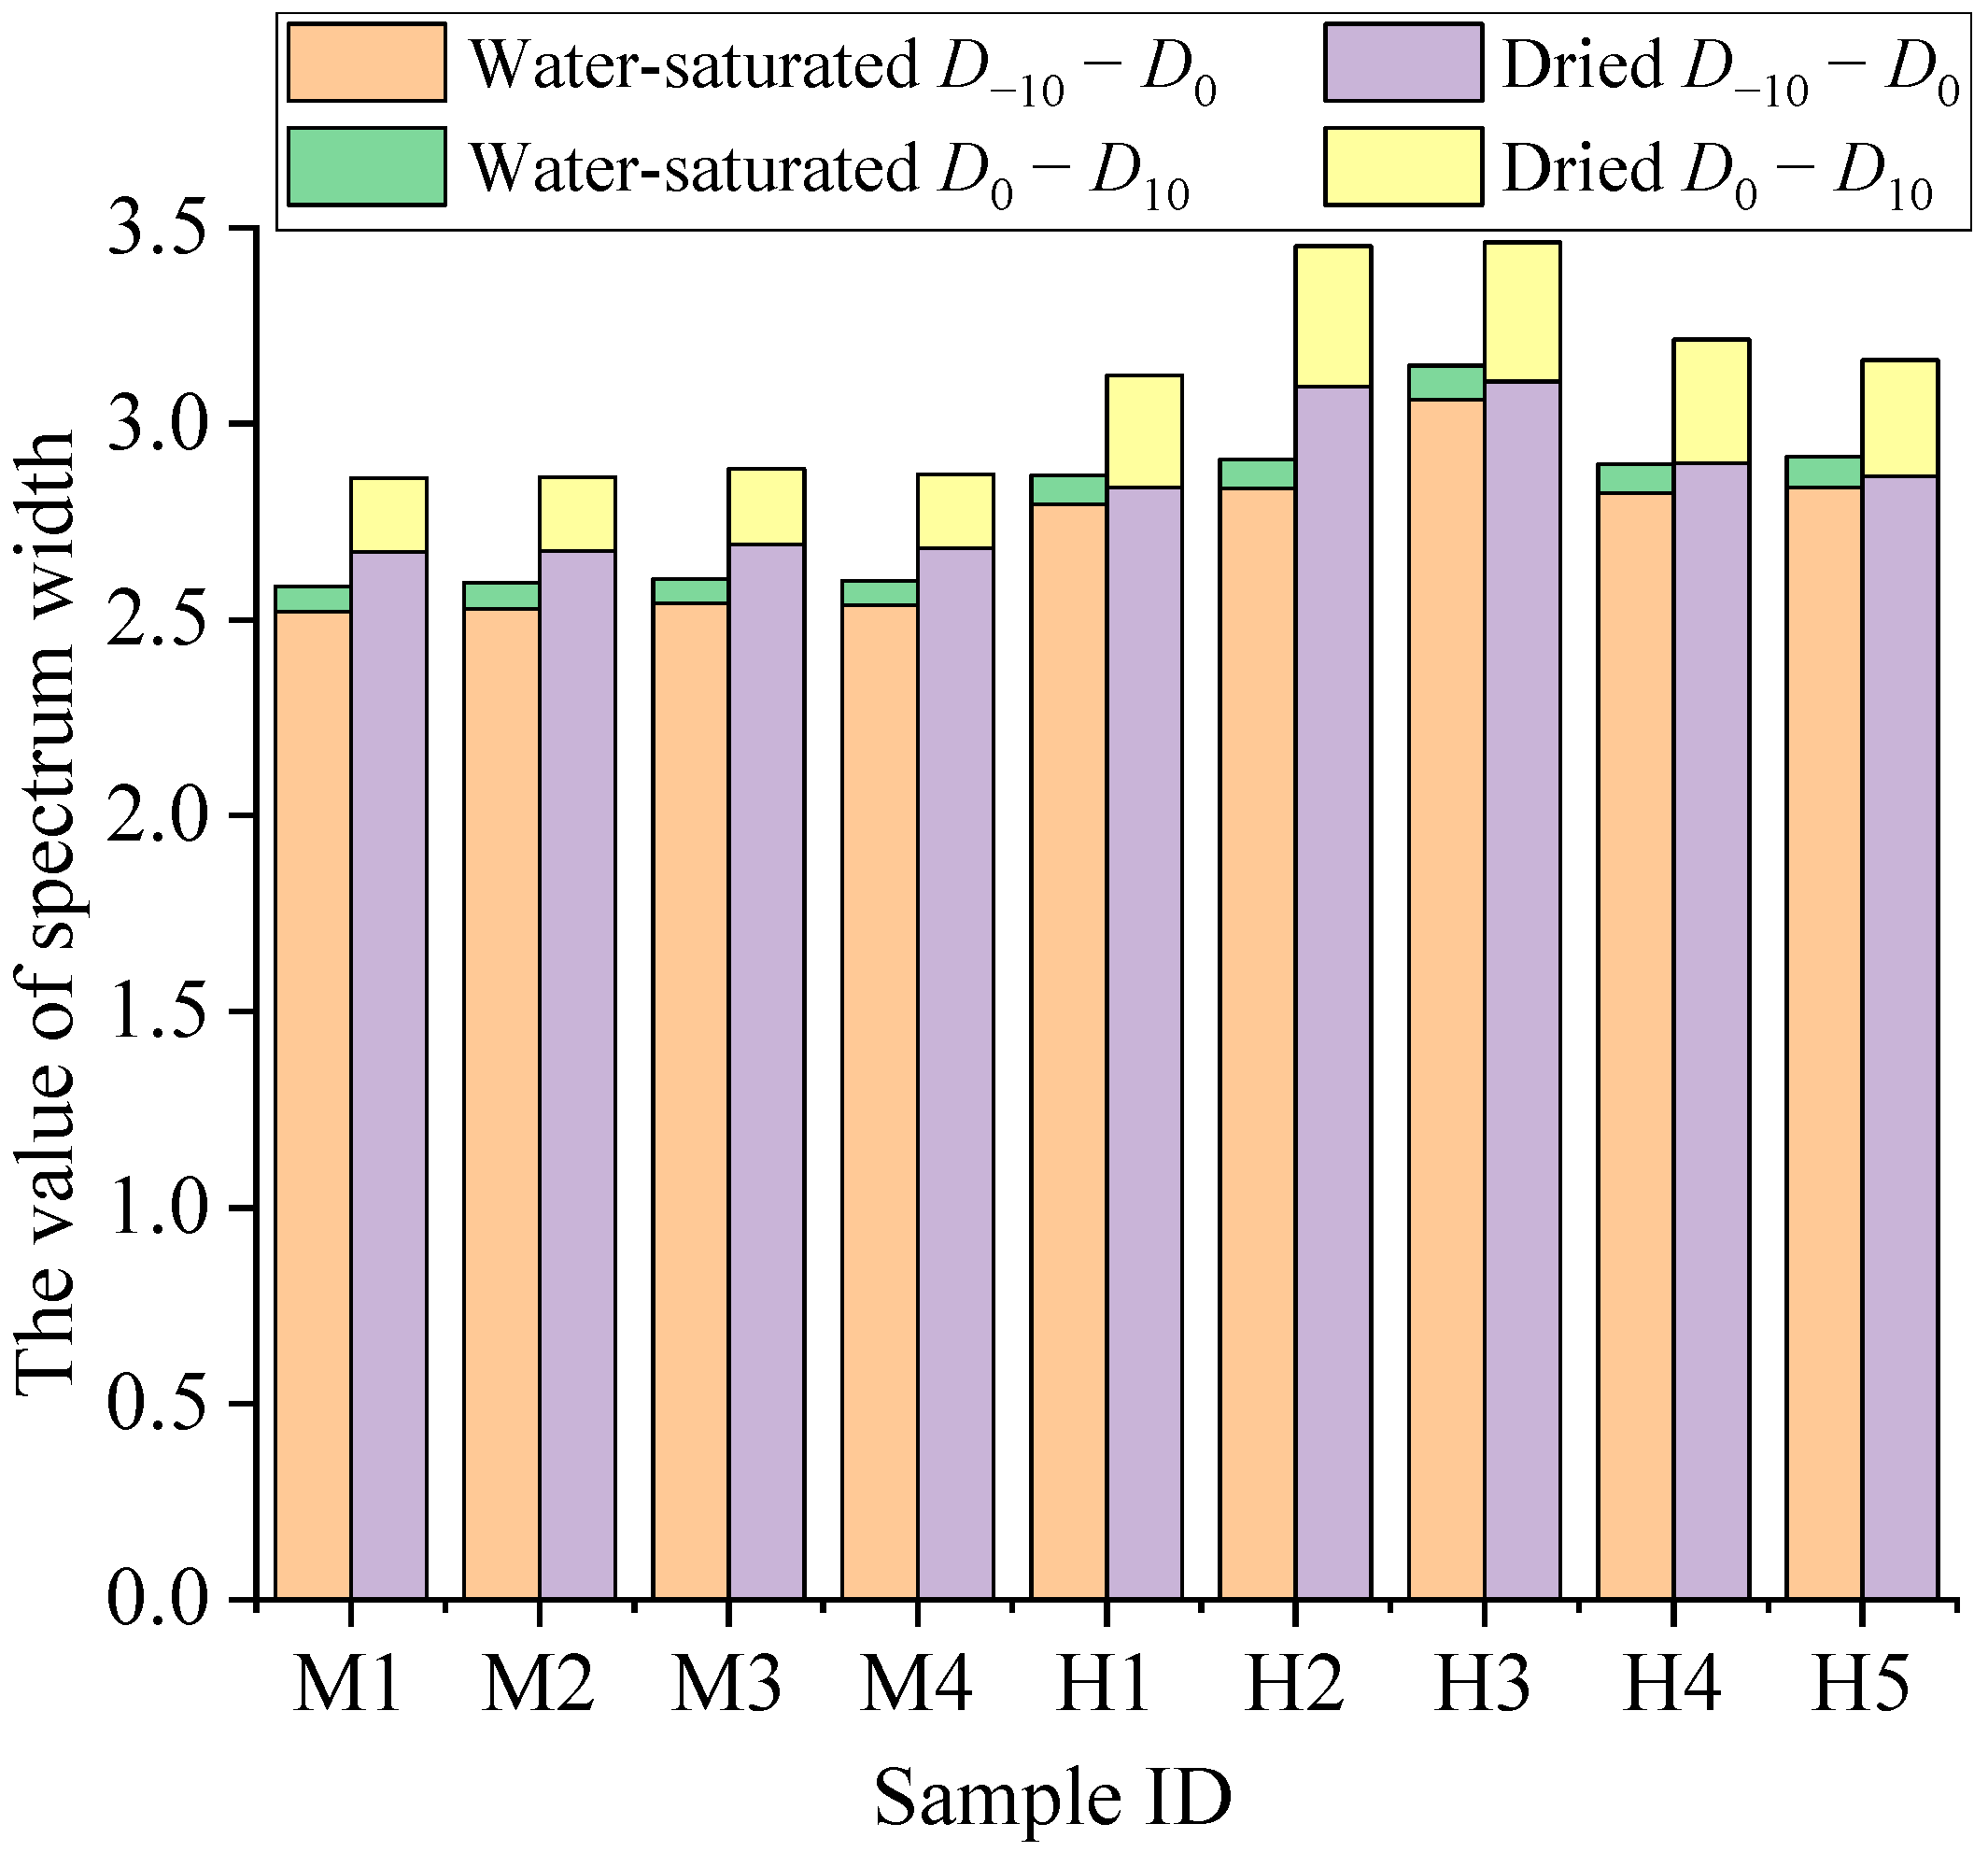
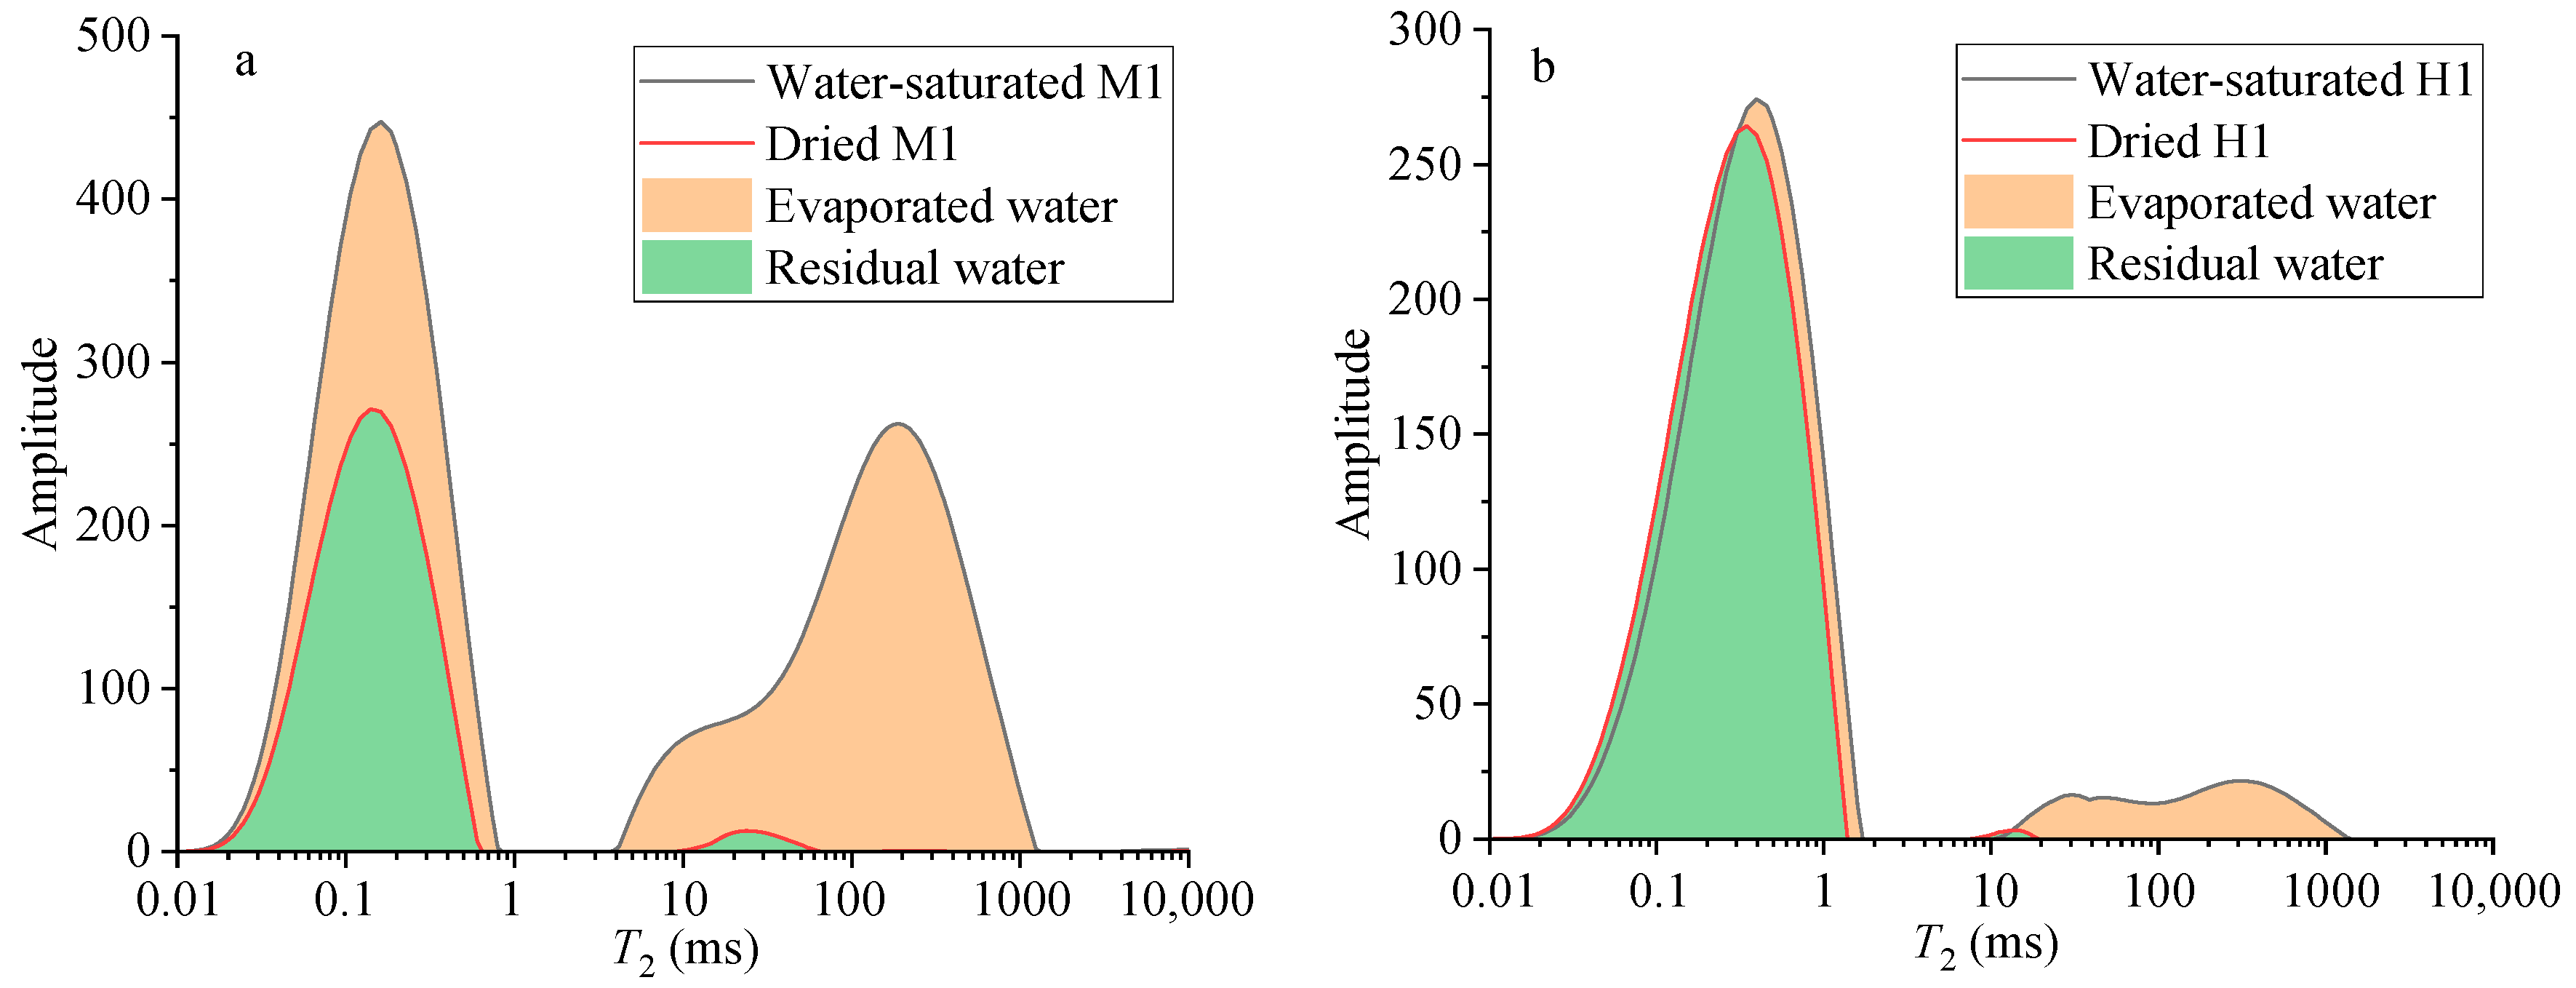
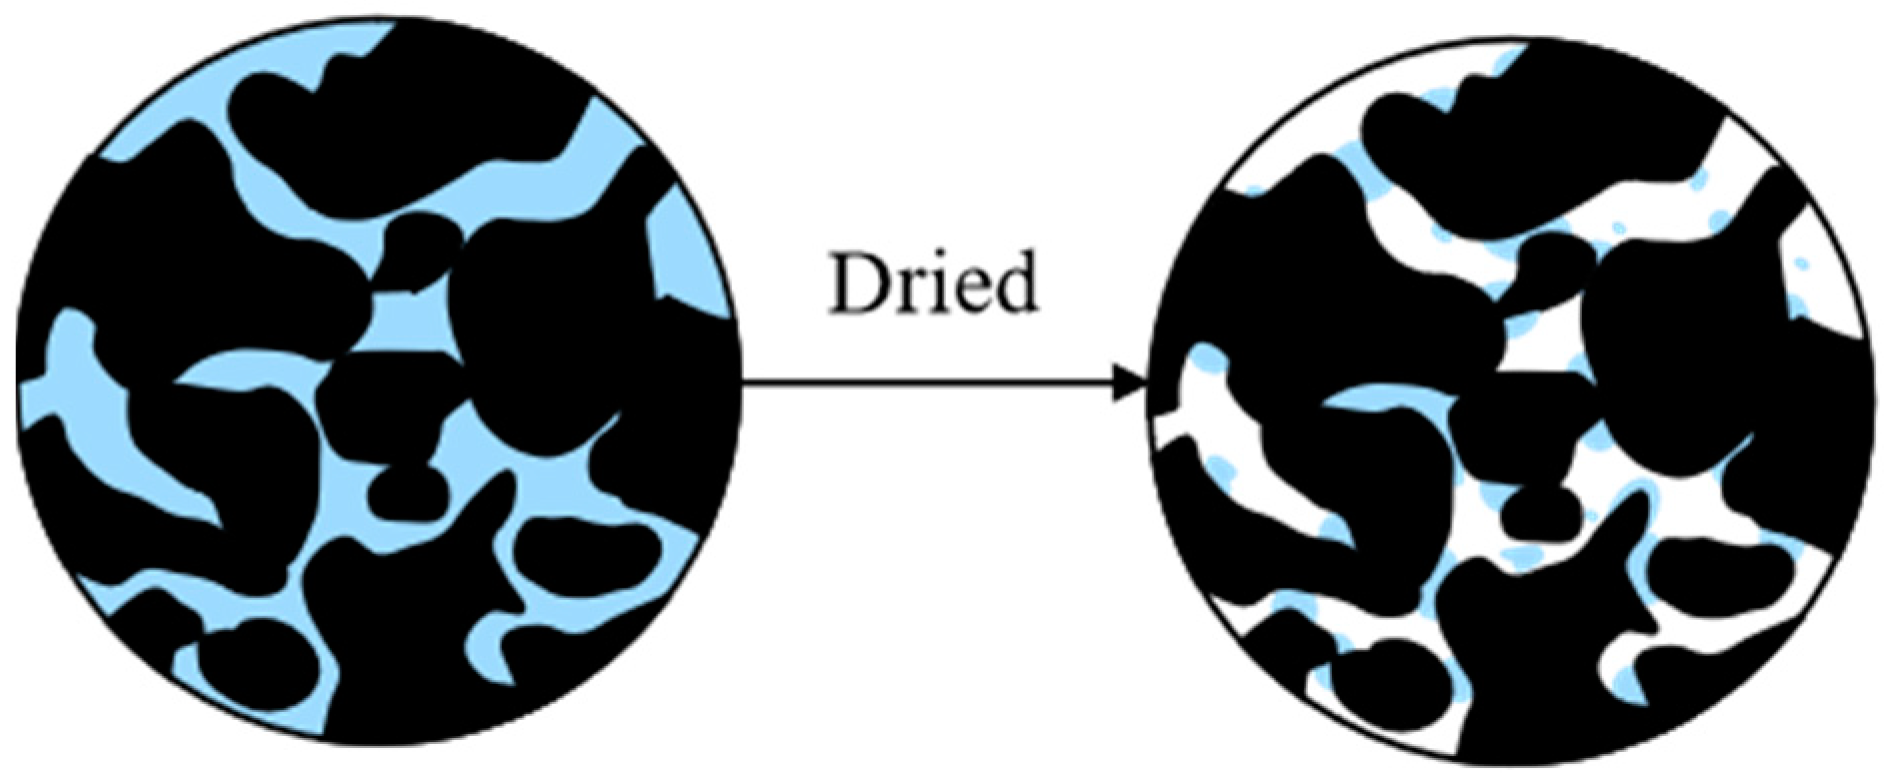
The T2 spectra of water-saturated coal samples exhibit three peaks: an isolated P1 peak (adsorption pores, 0.01–2.5 ms) dominates all samples, followed by overlapping P2 (seepage pores, 2.5–100 ms), and P3 (fractures, >100 ms). Drying preferentially removes free water in P2 and P3 regions, leading to significant reductions in the T2 spectrum, especially in medium-rank coals;
(2)
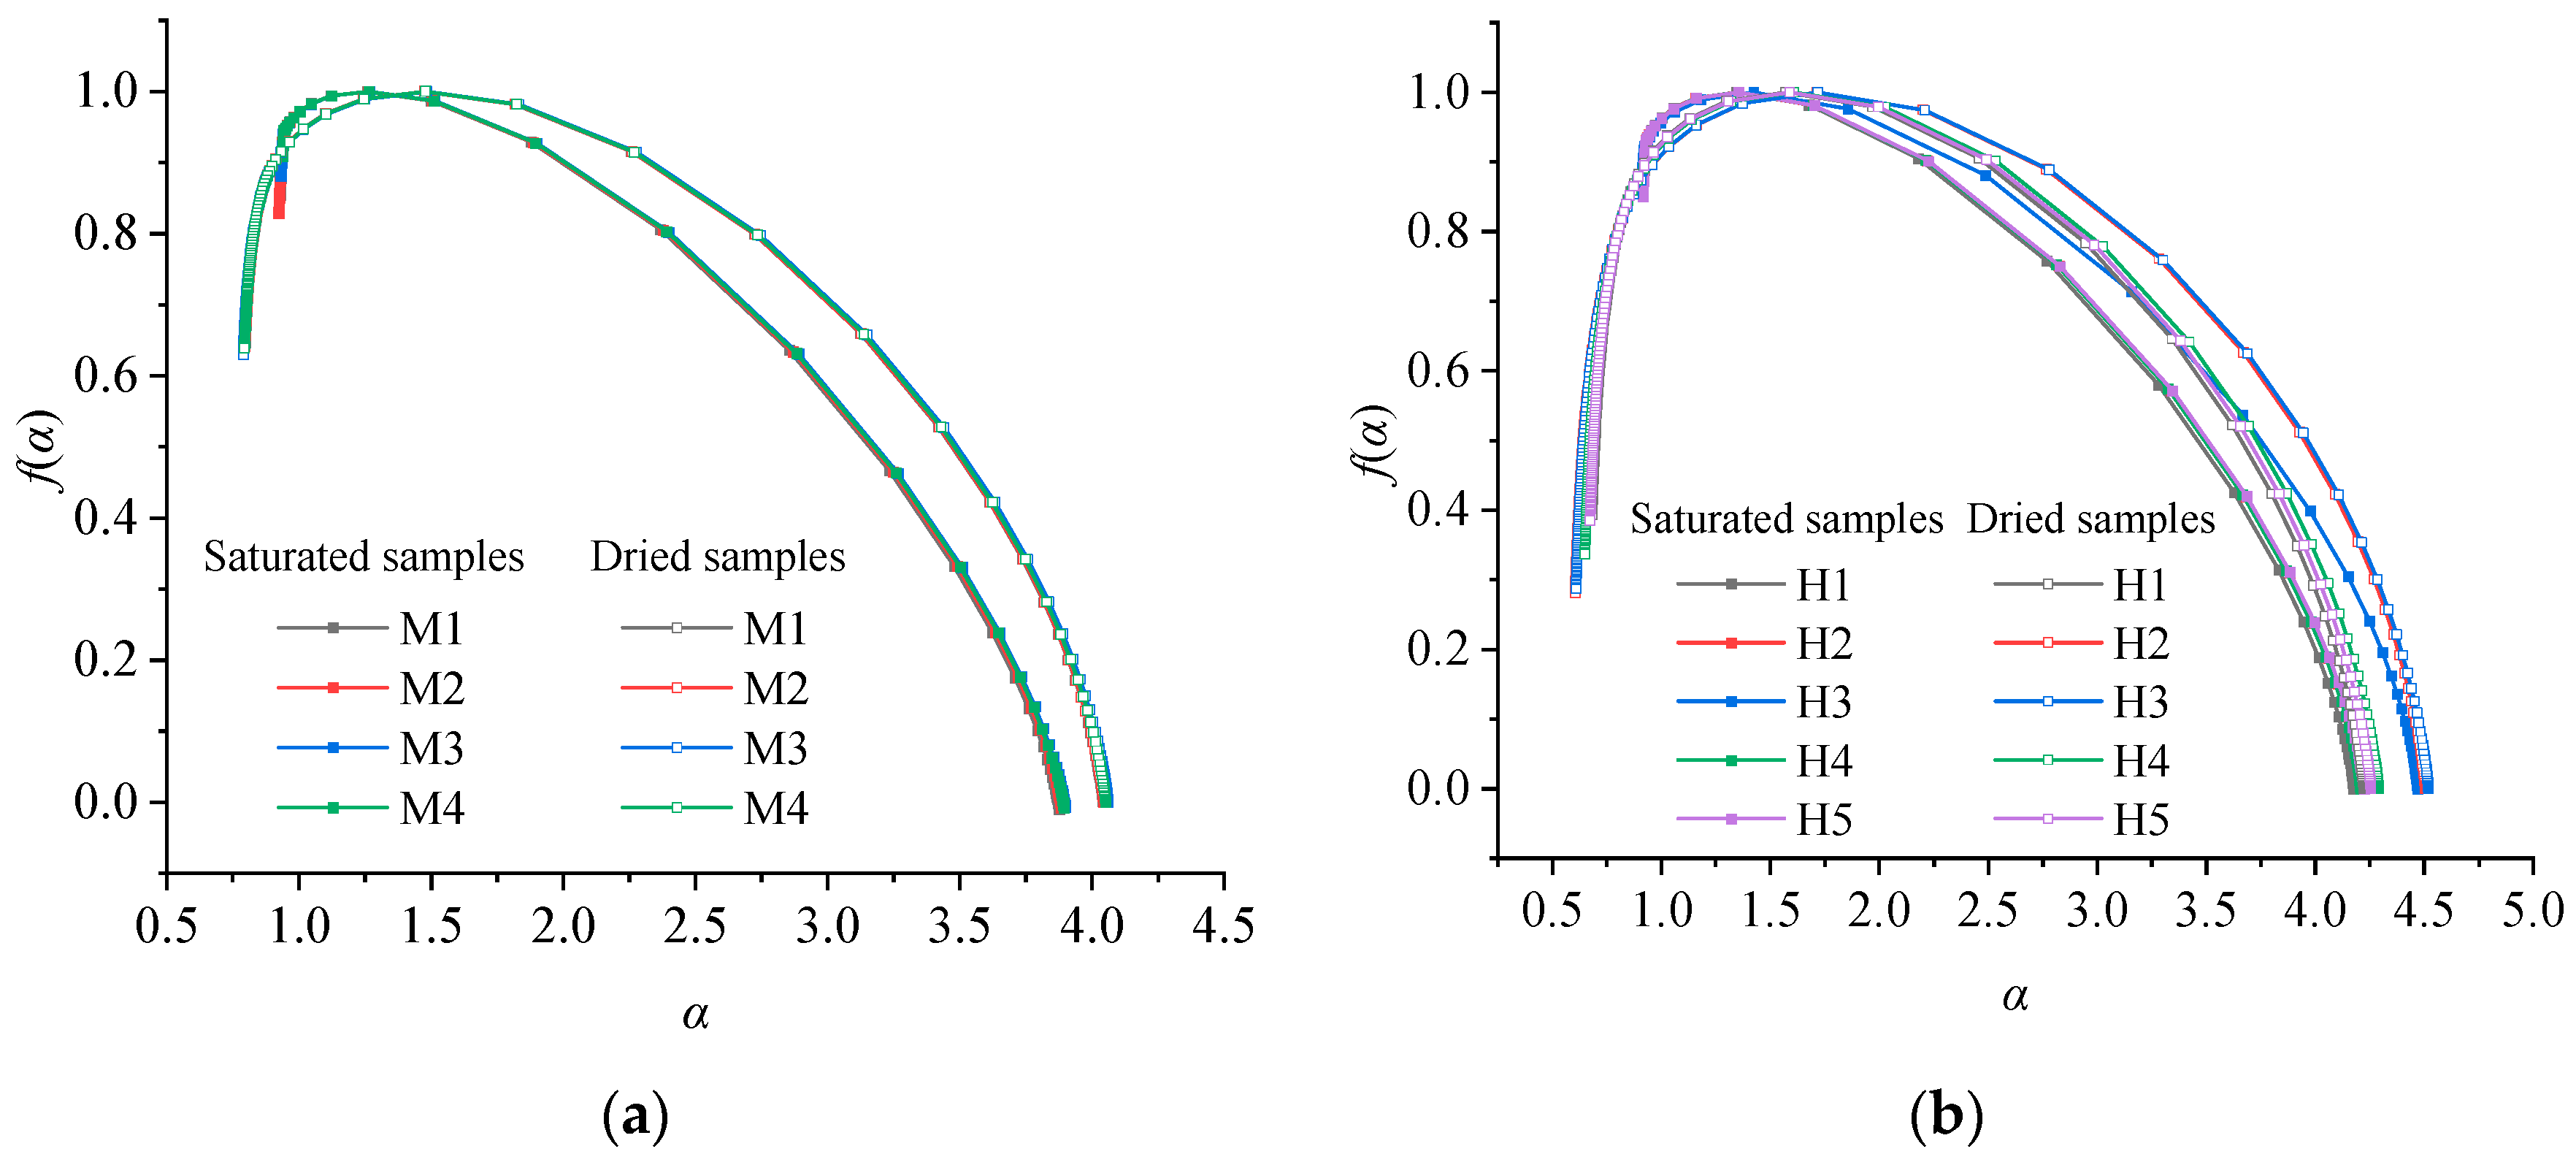
Multifractal characteristics derived from NMR reveal that coal rank dictates pore heterogeneity evolution. High-rank coals exhibit greater pore heterogeneity and complexity and lower pore connectivity due to aromatization-driven micropore dominance. Drying intensifies heterogeneity asymmetrically, with high-rank coals showing pronounced right-branch spectral broadening;
(3)
Free water dehydration in coal follows a size-dependent sequence: fractures/seepage pores → adsorption pores. Under dry conditions, multifractal analysis shows that the distribution of residual water is more complex, primarily occupying the adsorption pores and pore throat corners, which are controlled by the retention of bound water and the surface relaxation enhancement effects;
(4)
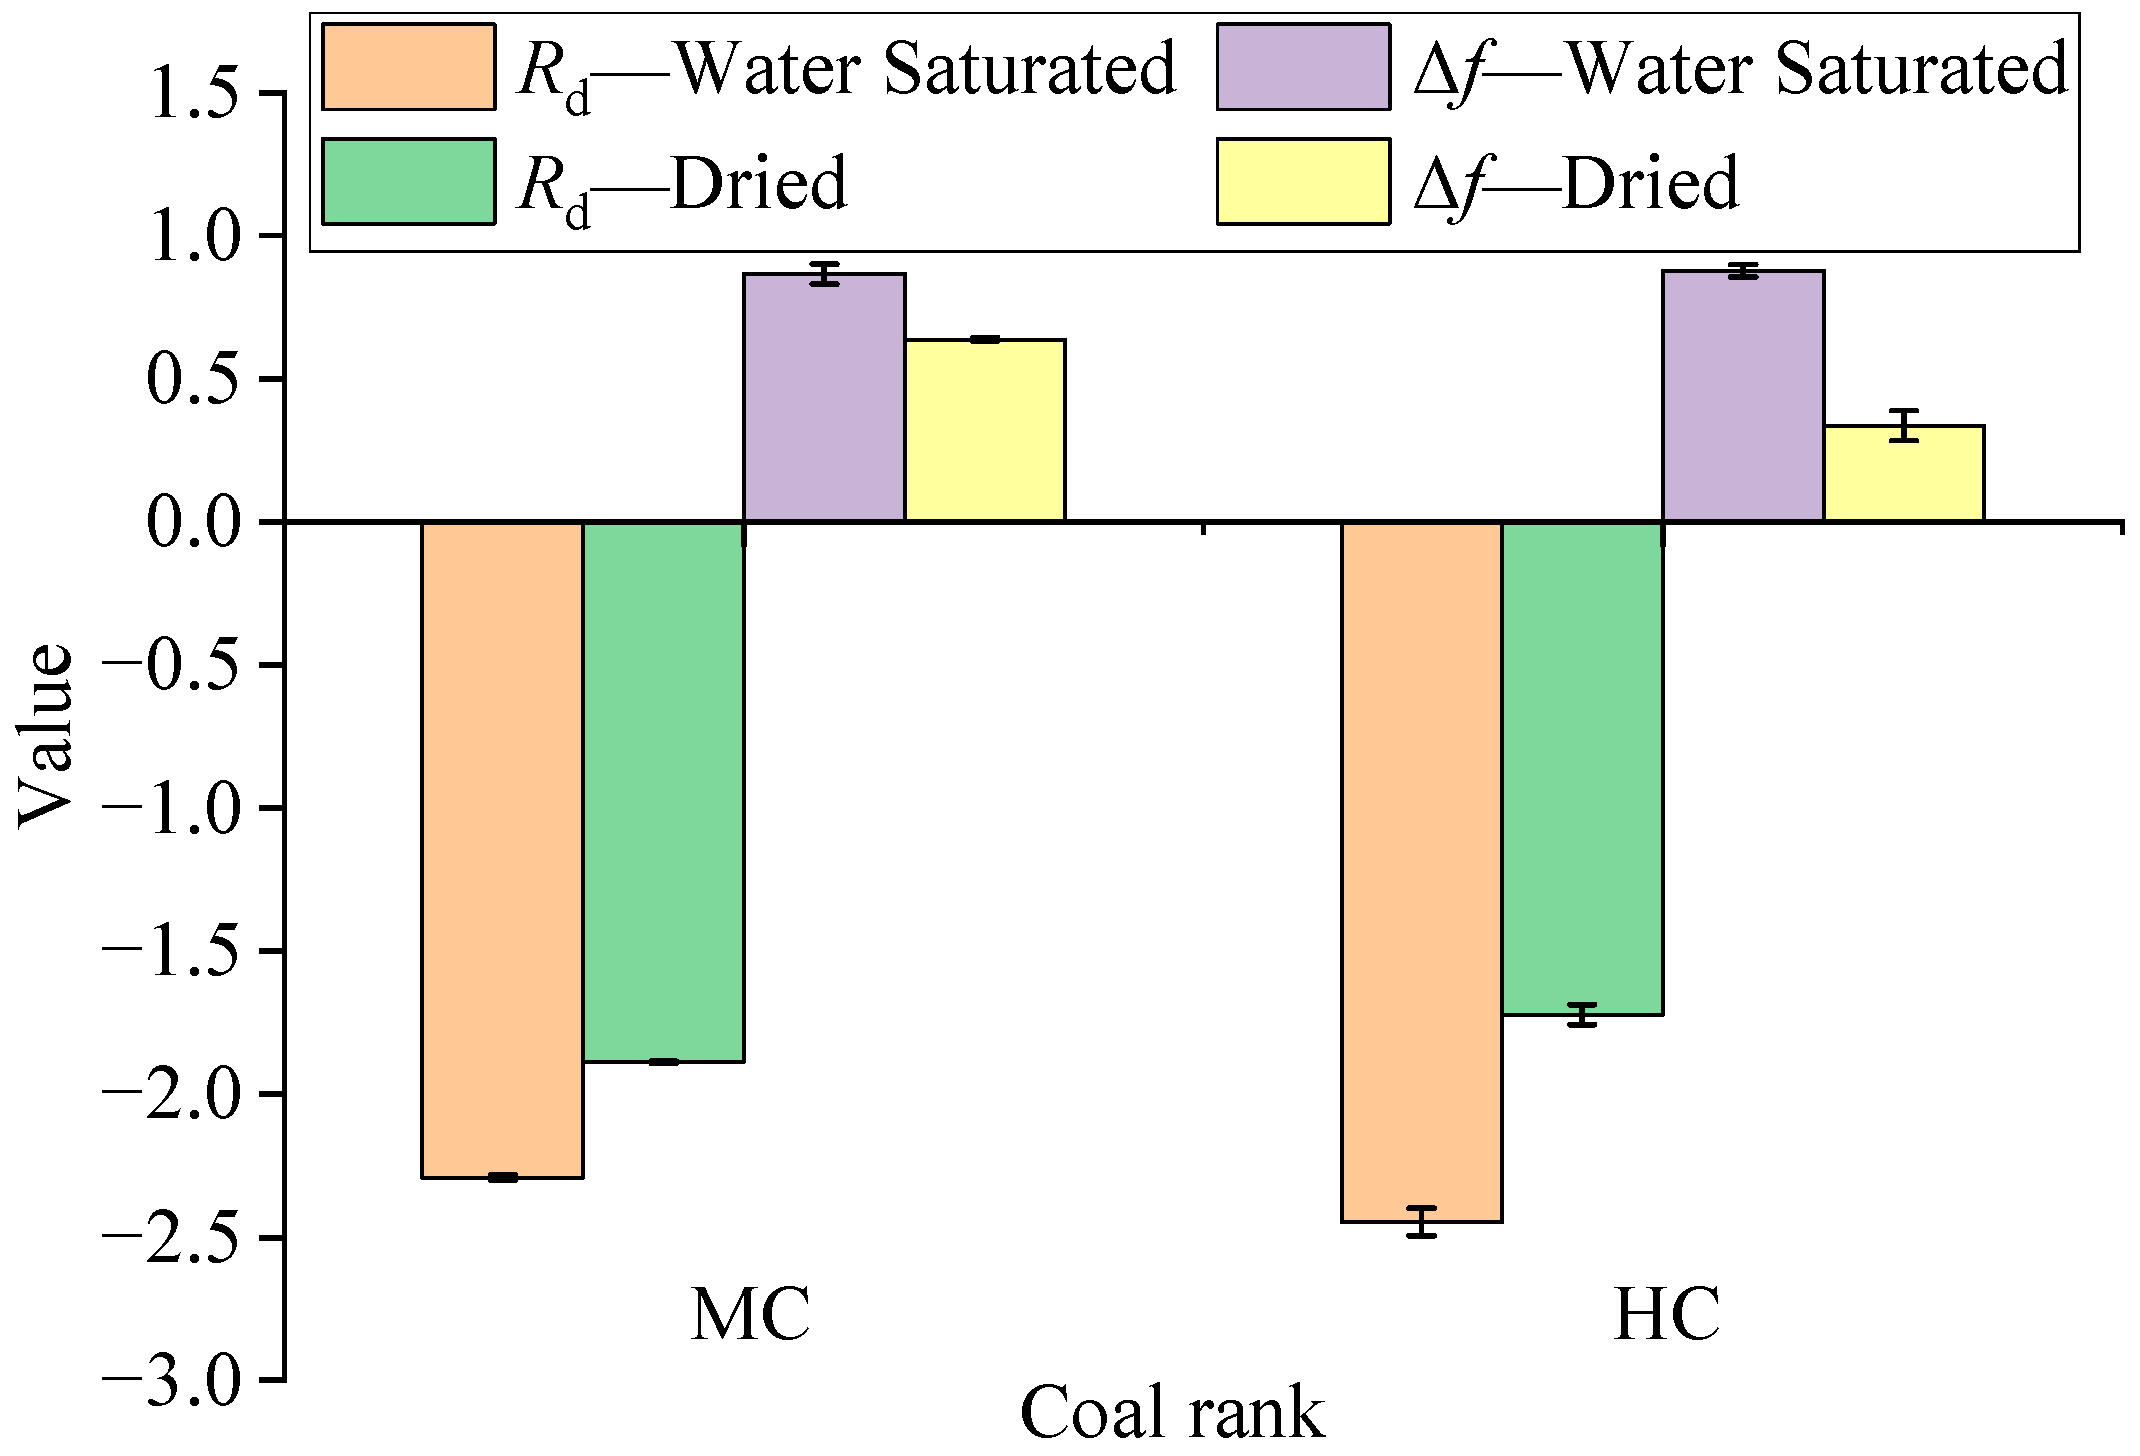
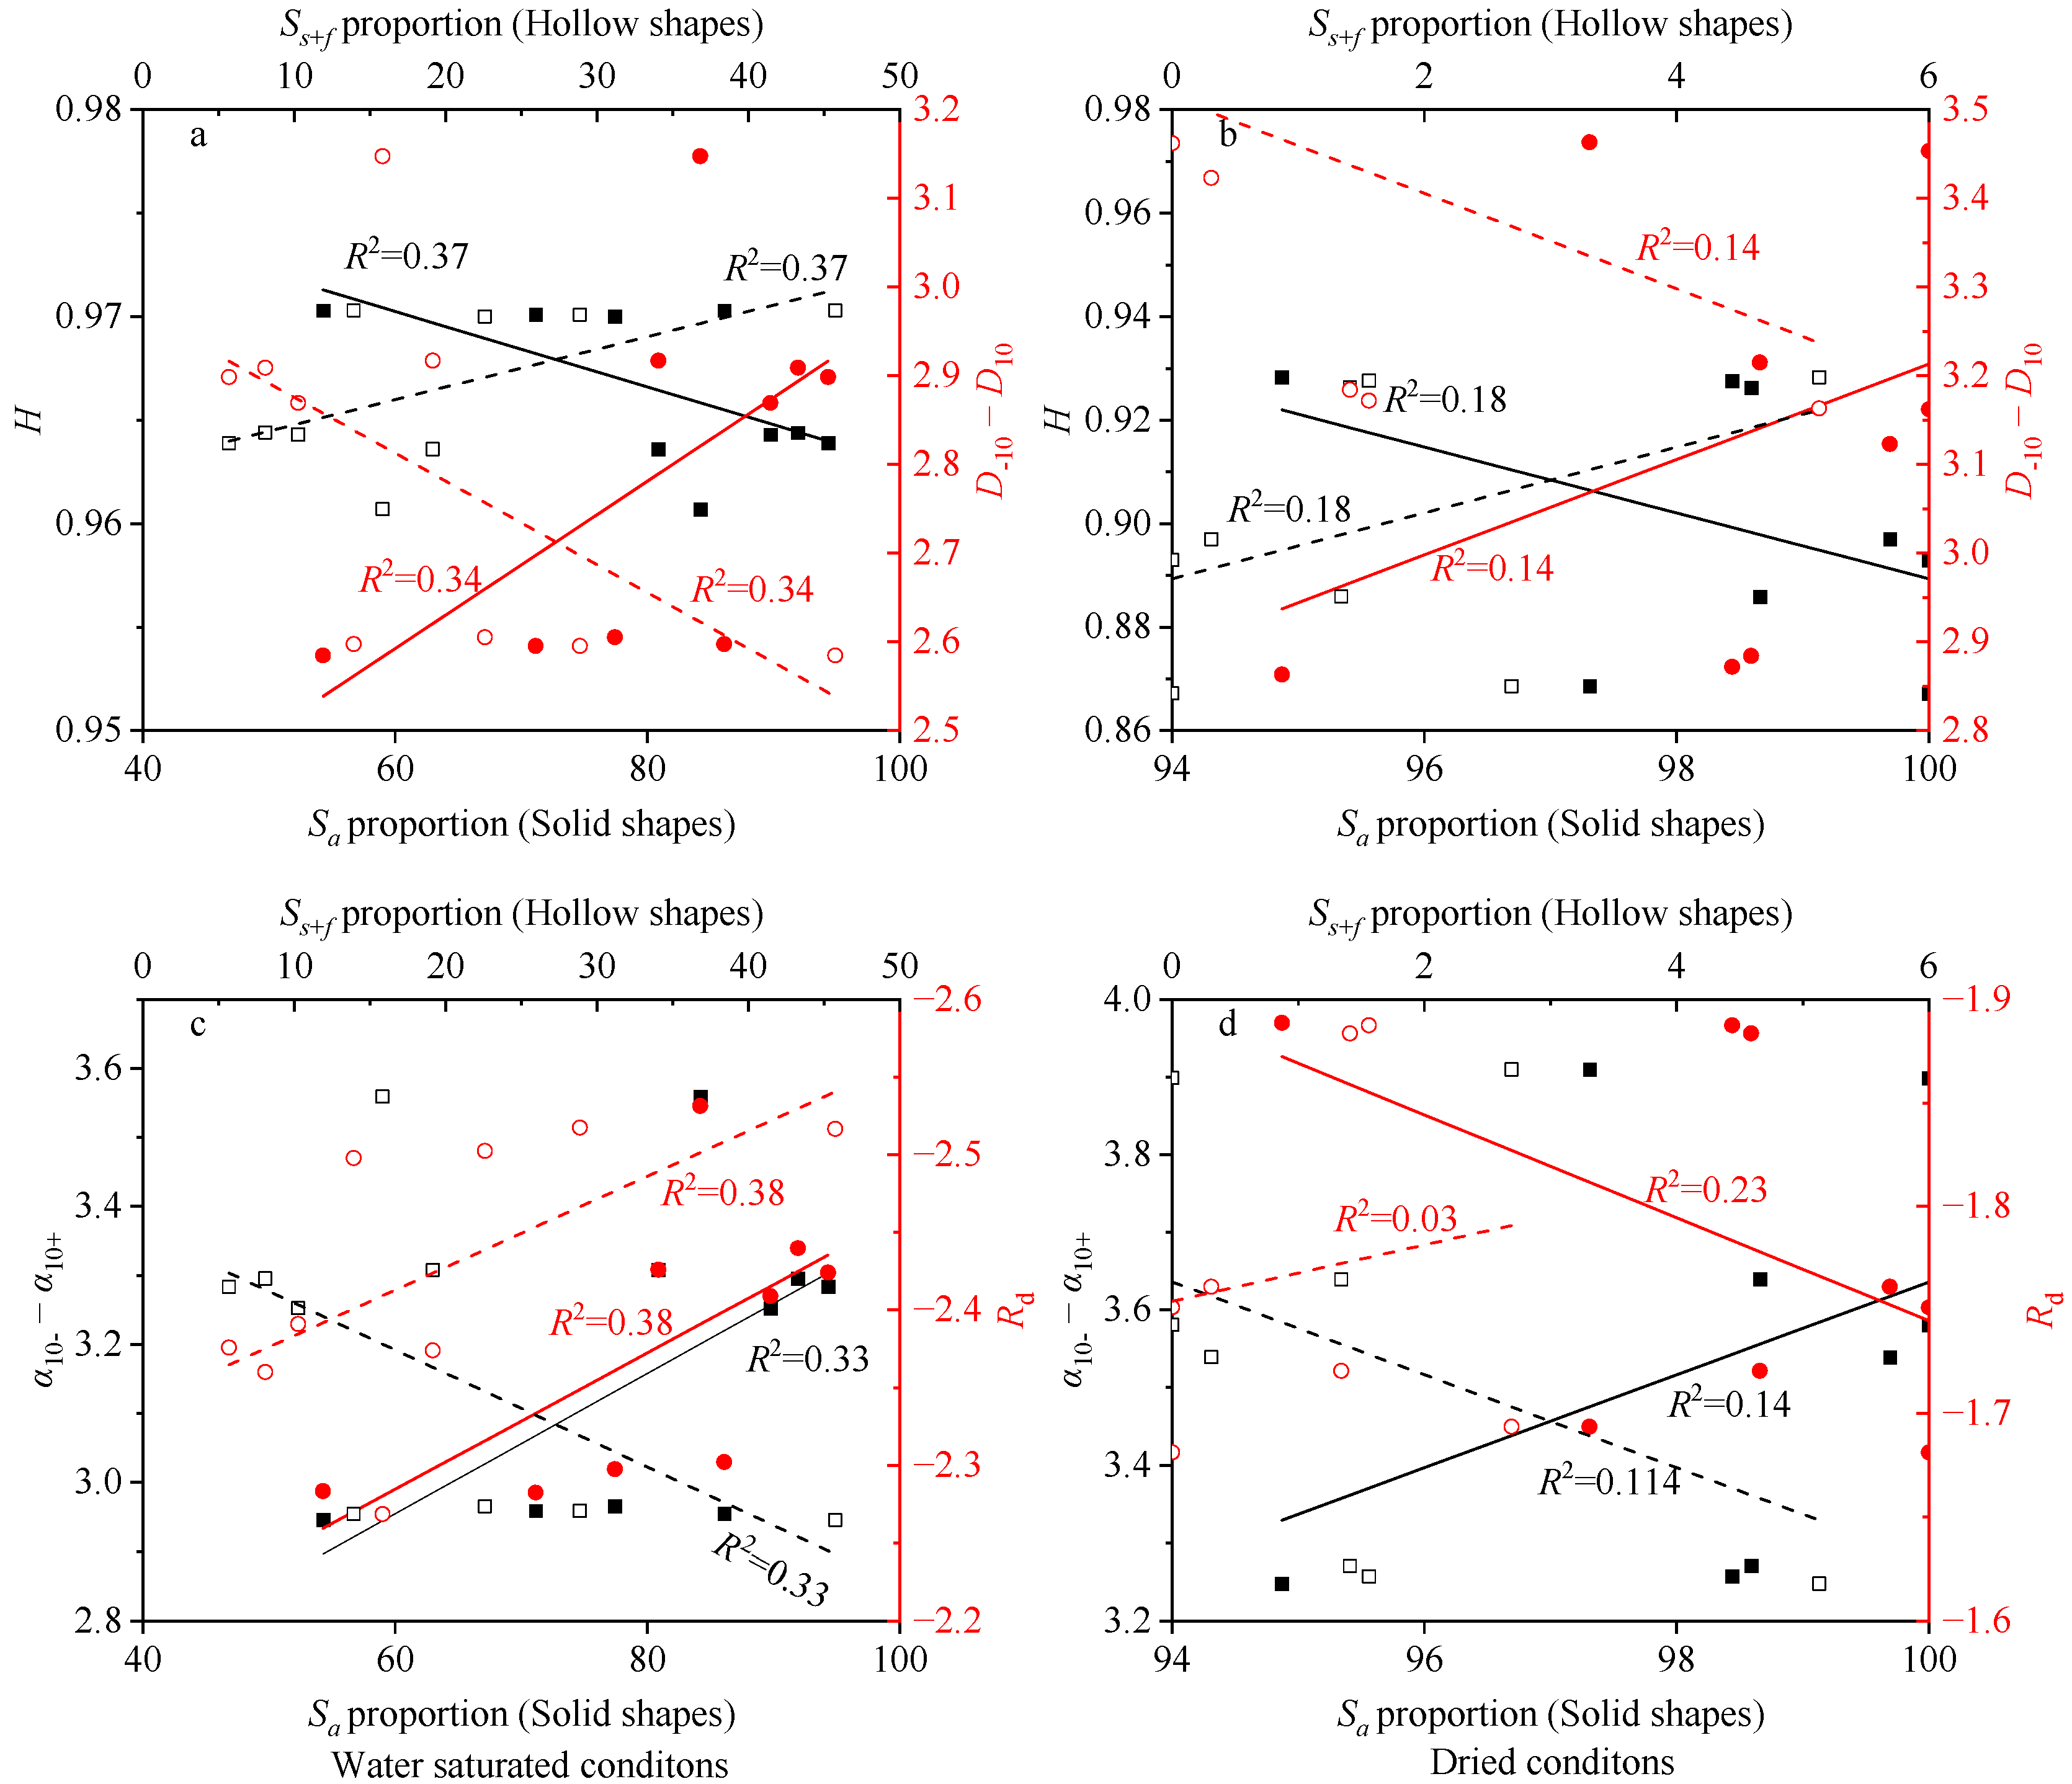
Strong correlations between the multifractal dimension spectrum (q-Dq) and singularity spectrum (f(α)-α) validate dual-spectrum consistency in characterizing pore fluid systems. The degree of coalification, vitrinite content, inertinite content, and Vdaf are the primary factors affecting pore heterogeneity, connectivity, and water distribution. Additionally, no significant correlations exist between multifractal parameters and Mad or Ad, excluding these as key heterogeneity drivers.

Author Contributions

H.L.: methodology and writing—original draft preparation. S.Z.: conceptualization, writing—review and editing, and funding acquisition. Y.Q.: investigation and supervision. D.X.: data curation. L.C.: investigation and formal analysis. All authors have read and agreed to the published version of the manuscript.

Funding

This research was jointly funded by the Scientific and Technological Key Project of Henan Province (No. 242102320338), the Key Scientific Research Projects of Colleges and Universities in Henan Province (No. 24A440010), the Safety Discipline “Double First-Class” Creation Project of Henan Polytechnic University (No. AQ20240710), the State Key Laboratory Cultivation Base for Gas Geology and Gas Control (Henan Polytechnic University) (No. WS2023A06), the Key Laboratory of Coalbed Methane Resources and Reservoir Formation Process of the Ministry of Education (China University of Mining and Technology) (No. 2022-004), the Doctoral Foundation of Henan Polytechnic University (No. B2023-3).

Data Availability Statement

All the data and models generated or used in this study are available from the corresponding author upon request.

Conflicts of Interest

Authors Huan Liu, Danfeng Xie and Long Chang were employed by the company The Prevention and Control Genter for the Geological Disaster of Henan Geological Bureau. The remaining authors declare that the research was conducted in the absence of any commercial or financial relationships that could be construed as a potential conflict of interest.

References

  1. Li, J.; Zhang, J.; Xiao, Q.; Liu, B.; Lin, W.; Li, W. Experimental Study on Differential Thermal Response and Pore-Fracture Structure Evolution Characteristics of Coals under Microwave Irradiation: A Case Study of Five Different Rank Coals. Energy Fuels 2024, 38, 9497–9514. [Google Scholar] [CrossRef]
  2. Yan, M.; Yang, F.; Zhang, B.; Lin, H.; Li, S. Influence of Pore Structure Characteristics of Low Permeability Coal on Gas Nonlinear Seepage. Nat. Resour. Res. 2024, 33, 1209–1225. [Google Scholar] [CrossRef]
  3. Zheng, S.; Yao, Y.; Liu, D.; Sang, S.; Liu, S.; Wang, M.; Zhou, X.; Wang, R.; Han, S.; Liu, T. Re-Evaluating the Accurate Multiphase Water Distribution in Coals: Unifying Experiment and Theory. Chem. Eng. J. 2023, 464, 142637. [Google Scholar] [CrossRef]
  4. Hodot, B.B. Outburst of Coal and Coalbed Gas; National Mining Scientific and Technical Documentation Press: Moscow, Russia, 1961; pp. 60–63. [Google Scholar]
  5. Wang, D.; Hu, H.; Wang, T.; Tang, T.; Li, W.; Zhu, G.; Chen, X. Difference between of Coal and Shale Pore Structural Characters Based on Gas Adsorption Experiment and Multifractal Analysis. Fuel 2024, 371, 132044. [Google Scholar] [CrossRef]
  6. Zhang, N.; Wang, X.; Wang, S.; Wang, R.; Wu, J.; Li, Z.; Song, Y. Multifractal Characteristics on Pore Structure of Longmaxi Shale Using Nuclear Magnetic Resonance (NMR). Geoenergy Sci. Eng. 2024, 241, 213176. [Google Scholar] [CrossRef]
  7. Li, F.; Jiang, B.; Song, Y.; Cheng, G.; Lu, G. Multifractal Behavior of the Micro- and Mesopore Structures of Brittle Tectonically Deformed Coals and Its Influence on Methane Adsorption Capacity. Energy Fuels 2021, 35, 3042–3064. [Google Scholar] [CrossRef]
  8. Wang, P.; Jiang, Z.; Ji, W.; Zhang, C.; Yuan, Y.; Chen, L.; Yin, L. Heterogeneity of Intergranular, Intraparticle and Organic Pores in Longmaxi Shale in Sichuan Basin, South China: Evidence from SEM Digital Images and Fractal and Multifractal Geometries. Mar. Pet. Geol. 2016, 72, 122–138. [Google Scholar] [CrossRef]
  9. Zhou, J.; Zhang, C. How Does Pore Structure Affect the NMR Relaxation in Unsaturated Porous Media: A Simulation Study. Water Resour. Res. 2025, 61, e2024WR038139. [Google Scholar] [CrossRef]
  10. Yu, X.; Xu, H.; Zhai, C.; Regenauer-Lieb, K.; Sang, S.; Sun, Y.; Jing, Y. Characterization of Water Migration Behavior during Spontaneous Imbibition in Coal: From the Perspective of Fractal Theory and NMR. Fuel 2024, 355, 129499. [Google Scholar] [CrossRef]
  11. Yao, P.; Zhang, J.; Lv, D.; Vandeginste, V.; Chang, X.; Zhang, X.; Wang, D.; Han, S.; Liu, Y. Effect of Water Occurrence in Coal Reservoirs on the Production Capacity of Coalbed Methane by Using NMR Simulation Technology and Production Capacity Simulation. Geoenergy Sci. Eng. 2024, 243, 213353. [Google Scholar] [CrossRef]
  12. Zhang, M.; Duan, C.; Li, G.; Fu, X.; Zhong, Q.; Liu, H.; Dong, Z. Determinations of the Multifractal Characteristics of the Pore Structures of Low-, Middle-, and High-Rank Coal Using High-Pressure Mercury Injection. J. Pet. Sci. Eng. 2021, 203, 108656. [Google Scholar] [CrossRef]
  13. Li, Y.; Pan, J.; Cheng, N.; Wang, Z.; Zhang, L.; Liu, W. Relationship Between Micropore Structure of Different Coal Ranks and Methane Diffusion. Nat. Resour. Res. 2022, 31, 2901–2917. [Google Scholar] [CrossRef]
  14. Ye, D.; Liu, G.; Lin, X.; Liu, H.; Li, D. Evaluating Damage Growth and Outburst Trend during Gas Drainage under Coupled Microstructure-Multi-Field Behaviour. Rock Mech. Rock Eng. 2025, 58, 1671–1692. [Google Scholar] [CrossRef]
  15. Guan, W.; Cai, W.; Li, Z.; Lu, H. Microscopic Characterization and Fractal Analysis of Pore Systems for Unconventional Reservoirs. J. Mar. Sci. Eng. 2024, 12, 908. [Google Scholar] [CrossRef]
  16. Zhang, S.; Liu, H.; Wu, C.; Jin, Z. Influence of Particle Size on Pore Structure and Multifractal Characteristics in Coal Using Low-Pressure Gas Adsorption. J. Pet. Sci. Eng. 2022, 212, 110273. [Google Scholar] [CrossRef]
  17. Zhang, S.; Wu, C.; Liu, H. Comprehensive Characteristics of Pore Structure and Factors Influencing Micropore Development in the Laochang Mining Area, Eastern Yunnan, China. J. Pet. Sci. Eng. 2020, 190, 107090. [Google Scholar] [CrossRef]
  18. Guan, M.; Liu, X.; Jin, Z.; Lai, J. The Heterogeneity of Pore Structure in Lacustrine Shales: Insights from Multifractal Analysis Using N2 Adsorption and Mercury Intrusion. Mar. Pet. Geol. 2020, 114, 104150. [Google Scholar] [CrossRef]
  19. Li, Y.; Song, D.; Liu, S.; Ji, X.; Hao, H. Evaluation of Pore Properties in Coal through Compressibility Correction Based on Mercury Intrusion Porosimetry: A Practical Approach. Fuel 2021, 291, 120130. [Google Scholar] [CrossRef]
  20. Yu, Y.; Luo, X.; Wang, Z.; Cheng, M.; Lei, Y.; Zhang, L.; Yin, J. A New Correction Method for Mercury Injection Capillary Pressure (MICP) to Characterize the Pore Structure of Shale. J. Nat. Gas Sci. Eng. 2019, 68, 102896. [Google Scholar] [CrossRef]
  21. Chen, S.; Tang, D.; Tao, S.; Ji, X.; Xu, H. Fractal Analysis of the Dynamic Variation in Pore-Fracture Systems under the Action of Stress Using a Low-Field NMR Relaxation Method: An Experimental Study of Coals from Western Guizhou in China. J. Pet. Sci. Eng. 2019, 173, 617–629. [Google Scholar] [CrossRef]
  22. Liu, X.; Wu, C. Simulation of Dynamic Changes of Methane State Based on NMR during Coalbed Methane Output. Fuel 2017, 194, 188–194. [Google Scholar] [CrossRef]
  23. Cheng, M.; Fu, X.; Kang, J.; Chen, Z.; Tian, Z. Effect of Water on Methane Diffusion in Coal under Temperature and Pressure: A LF-NMR Experimental Study on Successive Depressurization Desorption. Fuel 2022, 324, 124578. [Google Scholar] [CrossRef]
  24. Zhao, Y.; Lin, B.; Liu, T.; Zheng, Y.; Sun, Y.; Zhang, G.; Li, Q. Multifractal Analysis of Coal Pore Structure Based on NMR Experiment: A New Method for Predicting T2 Cutoff Value. Fuel 2021, 283, 119338. [Google Scholar] [CrossRef]
  25. Xue, D.J.; Liu, Y.T.; Zhou, J.; Sun, X.T. Visualization of Helium-Water Flow in Tight Coal by the Low-Field NMR Imaging: An Experimental Observation. J. Pet. Sci. Eng. 2020, 188, 106862. [Google Scholar] [CrossRef]
  26. San José Martínez, F.; Martín, M.A.; Caniego, F.J.; Tuller, M.; Guber, A.; Pachepsky, Y.; García-Gutiérrez, C. Multifractal Analysis of Discretized X-Ray CT Images for the Characterization of Soil Macropore Structures. Geoderma 2010, 156, 32–42. [Google Scholar] [CrossRef]
  27. Duan, R.; Xu, Z.; Dong, Y.; Liu, W. Characterization and Classification of Pore Structures in Deeply Buried Carbonate Rocks Based on Mono- and Multifractal Methods. J. Pet. Sci. Eng. 2021, 203, 108606. [Google Scholar] [CrossRef]
  28. Ge, X.; Fan, Y.; Li, J.; Aleem Zahid, M. Pore Structure Characterization and Classification Using Multifractal Theory—An Application in Santanghu Basin of Western China. J. Pet. Sci. Eng. 2015, 127, 297–304. [Google Scholar] [CrossRef]
  29. Han, Y.; Jiang, Z.; Liang, Z.; Lai, Z.; Wu, Y.; Shi, X.; Duan, X.; Zhang, Y.; Li, Y. Study on the Multifractal Characterization and Seepage of the Shale Matrix: A Case Study of the Longmaxi Formation in Southwestern Sichuan Basin, China. Geoenergy Sci. Eng. 2024, 238, 212924. [Google Scholar] [CrossRef]
  30. Liu, K.; Ostadhassan, M.; Zou, J.; Gentzis, T.; Rezaee, R.; Bubach, B.; Carvajal-Ortiz, H. Multifractal Analysis of Gas Adsorption Isotherms for Pore Structure Characterization of the Bakken Shale. Fuel 2018, 219, 296–311. [Google Scholar] [CrossRef]
  31. Zhong, B.; Zhu, Y.; Feng, G.; Xiang, J.; Wang, Y. Matrix Compression and Pore Heterogeneity in the Coal-Measure Shale Reservoirs of the Qinshui Basin: A Multifractal Analysis. Fractal Fract. 2024, 8, 580. [Google Scholar] [CrossRef]
  32. Yan, J.; Meng, Z.; Zhang, K.; Yao, H.; Hao, H. Pore Distribution Characteristics of Various Rank Coals Matrix and Their Influences on Gas Adsorption. J. Pet. Sci. Eng. 2020, 189, 107041. [Google Scholar] [CrossRef]
  33. Zhang, J.; Wei, C.; Ju, W.; Yan, G.; Lu, G.; Hou, X.; Kai, Z. Stress Sensitivity Characterization and Heterogeneous Variation of the Pore-Fracture System in Middle-High Rank Coals Reservoir Based on NMR Experiments. Fuel 2019, 238, 331–344. [Google Scholar] [CrossRef]
  34. GB/T 212-2008; Proximate Analysis of Coal. Standards Press of China: Beijing, China, 2008.
  35. GB/T 8899-2013; Determination of Maceral Group Composition and Minerals in Coal. Standards Press of China: Beijing, China, 2013.
  36. Ouyang, Z.; Liu, D.; Cai, Y.; Yao, Y. Fractal Analysis on Heterogeneity of Pore–Fractures in Middle–High Rank Coals with NMR. Energy Fuels 2016, 30, 5449–5458. [Google Scholar] [CrossRef]
  37. Chen, H.; Tang, D.; Li, S.; Xu, H.; Tao, S.; Wang, J.; Liu, Y. Dynamic Evaluation of Heterogeneity in Pore-Fracture System of Different Rank Coals under Different Confining Pressure Based on Low-Field NMR. Energy Sources Part A Recovery Util. Environ. Eff. 2021, 43, 1620–1634. [Google Scholar] [CrossRef]
  38. Zhang, J.; Wei, C.; Ju, W.; Qin, Z.; Ji, Y.; Quan, F.; Hu, Y. Microscopic Distribution and Dynamic Variation of Water under Stress in Middle and High Rank Coal Samples. J. Nat. Gas Sci. Eng. 2020, 79, 103369. [Google Scholar] [CrossRef]
  39. Yao, Y.; Liu, D.; Che, Y.; Tang, D.; Tang, S.; Huang, W. Petrophysical Characterization of Coals by Low-Field Nuclear Magnetic Resonance (NMR). Fuel 2010, 89, 1371–1380. [Google Scholar] [CrossRef]
  40. Zhang, S.; Liu, H.; Jin, Z.; Wu, C. Multifractal Analysis of Pore Structure in Middle- and High-Rank Coal by Mercury Intrusion Porosimetry and Low-Pressure N2 Adsorption. Nat. Resour. Res. 2021, 30, 4565–4584. [Google Scholar] [CrossRef]
  41. Fu, H.; Tang, D.; Xu, T.; Xu, H.; Tao, S.; Li, S.; Yin, Z.; Chen, B.; Zhang, C.; Wang, L. Characteristics of Pore Structure and Fractal Dimension of Low-Rank Coal: A Case Study of Lower Jurassic Xishanyao Coal in the Southern Junggar Basin, NW China. Fuel 2017, 193, 254–264. [Google Scholar] [CrossRef]
  42. Wei, Z.; Pang, Y.; Yang, C.; Cao, H.; Zhang, J. Pore Structure Monofractal and Multifractal Characteristics of High-Mature Organic-Rich Shale Using N2 Adsorption–Desorption Measurements. Nat. Resour. Res. 2025, 34, 459–482. [Google Scholar] [CrossRef]
  43. Muller, J. Characterization of Pore Space in Chalk by Multifractal Analysis. J. Hydrol. 1996, 187, 215–222. [Google Scholar] [CrossRef]
  44. Li, W.; Liu, H.; Song, X. Multifractal Analysis of Hg Pore Size Distributions of Tectonically Deformed Coals. Int. J. Coal Geol. 2015, 144–145, 138–152. [Google Scholar] [CrossRef]
  45. Ferreiro, J.P.; Wilson, M.; Vázquez, E.V. Multifractal Description of Nitrogen Adsorption Isotherms. Vadose Zone J. 2009, 8, 209–219. [Google Scholar] [CrossRef]
  46. Posadas, A.N.D.; Giménez, D.; Bittelli, M.; Vaz, C.M.P.; Flury, M. Multifractal Characterization of Soil Particle-Size Distributions. Soil Sci. Soc. Am. J. 2001, 65, 1361–1367. [Google Scholar] [CrossRef]
  47. Cheng, G.; Jiang, B.; Li, M.; Li, F.; Xu, S. Quantitative Characterization of Fracture Structure in Coal Based on Image Processing and Multifractal Theory. Int. J. Coal Geol. 2020, 228, 103566. [Google Scholar] [CrossRef]
  48. Yao, Y.; Liu, D.; Liu, J.; Xie, S. Assessing the Water Migration and Permeability of Large Intact Bituminous and Anthracite Coals Using NMR Relaxation Spectrometry. Transp. Porous Med. 2015, 107, 527–542. [Google Scholar] [CrossRef]
  49. Li, H.; Lin, B.; Hong, Y.; Liu, T.; Huang, Z.; Wang, R.; Wang, Z. Assessing the Moisture Migration during Microwave Drying of Coal Using Low-Field Nuclear Magnetic Resonance. Dry. Technol. 2018, 36, 567–577. [Google Scholar] [CrossRef]
  50. Ma, Y.; Deng, Z.; Yue, J.; Zhao, A.; Hu, M.; Shen, L. Nuclear Magnetic Resonance Experiment on the Influence of Confining Pressure on Spontaneous Imbibition of Water in Coal. Energy Fuels 2022, 36, 4818–4829. [Google Scholar] [CrossRef]
  51. Pan, J.; Lv, M.; Hou, Q.; Han, Y.; Wang, K. Coal Microcrystalline Structural Changes Related to Methane Adsorption/Desorption. Fuel 2019, 239, 13–23. [Google Scholar] [CrossRef]
  52. Wang, T.; Deng, Z.; Hu, H.; Wang, H.; Jiang, Z.; Wang, D. Study on the Pore Structure and Multifractal Characteristics of Medium- and High-Rank Coals Based on the Gas Adsorption Method: A Case Study of the Benxi Formation in the Eastern Margin of the Ordos Basin. Energy Fuels 2024, 38, 4102–4121. [Google Scholar] [CrossRef]
  53. Mathews, J.P.; Sharma, A. The Structural Alignment of Coal and the Analogous Case of Argonne Upper Freeport Coal. Fuel 2012, 95, 19–24. [Google Scholar] [CrossRef]
Figure 1. Schematic of NMR testing instrument.
Fractalfract 09 00290 g001
Figure 2. Relationship between coal rank and coal quality: (a) Ro,max vs. vitrinite content; (b) Ro,max vs. Mad; (c) Ro,max vs. Vdaf; and (d) Ro,max vs. porosity.
Fractalfract 09 00290 g002
Figure 3. T2 spectra of saturated and dried samples: (a) medium-rank coals; (b) high-rank coals.
Fractalfract 09 00290 g003
Figure 4. Percentage of adsorption pores, seepage pores, and fractures in saturated and dried samples: (a) water-saturated conditions; (b) dry conditions.
Fractalfract 09 00290 g004
Figure 5. Intrusion and withdraw curves and distributions of incremental pore volumes of coal samples: (a) M3 and M4; (b) H1 and H5.
Fractalfract 09 00290 g005
Figure 6. Comparison of pore percentage calculated from MIP and NMR.
Fractalfract 09 00290 g006
Figure 7. lgχ (q,ε)−lgε plots of the partition function: (a) M1 in water-saturated state; (b) H1 in water-saturated state; (c) M1 in dry state; and (d) H1 in dry state.
Fractalfract 09 00290 g007
Figure 8. Relationships between generalized dimension Dq and q of saturated and dried coals: (a) water-saturated conditions; (b) dry conditions.
Fractalfract 09 00290 g008
Figure 9. The variation in generalized fractal spectrum width in water-saturated and dry states.
Fractalfract 09 00290 g009
Figure 10. Relationships between f(α) and α of saturated and dried coal: (a) medium-rank coals; (b) high-rank coals.
Fractalfract 09 00290 g010
Figure 11. Symmetry of f(α)-α and Δf for MC and HC in water-saturated and dry states.
Fractalfract 09 00290 g011
Figure 12. Multiphase water distribution in water-saturated and dry conditions: (a) M1; (b) H1.
Fractalfract 09 00290 g012
Figure 13. The schematic illustration of irreducible water distribution.
Fractalfract 09 00290 g013
Figure 14. Relationship between T2 spectra proportion of adsorption pores and seepage pores and fractures and multifractal parameters: (a,c) Relationship between Sa and Ss+f proportion and multifractal parameters under water saturated conditions; (b,d) Relationship between Sa and Ss+f proportion and multifractal parameters under dried conditions.
Fractalfract 09 00290 g014
Figure 15. Spearman correlation analysis of multifractal parameters under water saturated and dry conditions.
Fractalfract 09 00290 g015
Figure 16. Relationships between Ro,max, maceral composition, pore connectivity, and heterogeneity of coal: (a,b) Relationships between Ro,max and heterogeneity of coal under different conditions; (c,d): Relationships between vitrinite and heterogeneity of coal under different conditions; (e,f): Relationships between inertinite and heterogeneity of coal under different conditions.
Fractalfract 09 00290 g016
Figure 17. Relationships between proximate analysis, pore connectivity, and heterogeneity of coal: (a,b) Relationships between Vdaf and H, α10−α10+ under different conditions; (c,d) Relationships between minerals and H, α10−α10+ under different conditions.
Fractalfract 09 00290 g017
Table 1. Basic physical parameters of coal samples.
Sample IDCoal SeamStratigraphicRo,max
(%)
Maceral Composition (%)Proximate Analysis (%)Porosity
(%)
VitriniteInertiniteExiniteMineralsMadAdVdafFCd
M17P3x1.0550.3037.682.909.120.6413.7725.9363.874.19
M28P3x1.1566.0825.672.785.471.128.4124.6968.984.63
M38P3x1.2767.4023.11/9.491.2714.5526.5862.743.87
M421P3x1.6965.9327.03/7.040.8410.9216.4774.412.82
H17P3l2.3077.0319.59/3.382.618.237.6884.732.22
H28P3l2.4585.176.59/8.241.2913.177.2980.502.75
H33P3l2.5987.1812.18/0.641.549.726.8884.063.24
H47P3l2.6574.8718.98/6.152.6710.127.1883.432.43
H53P3l2.6775.8123.12/1.071.7514.949.7276.802.56
Table 2. Parameters of the generalized fractional dimensional spectrum under different conditions.
Sample IDWater-Saturated ConditionsDry Conditions
HD1D2D−10D10D−10D0D0D10HD1D2D−10D10D−10D0D0D10
M10.97030.94300.94072.58492.52140.06340.92860.87800.85732.86022.67490.1853
M20.97010.94280.94032.59562.52940.06630.92830.87670.85662.86322.67670.1865
M30.97000.94200.94002.60552.54280.06270.92630.87400.85272.88422.69200.1922
M40.97030.94260.94062.59772.53830.05950.92760.87580.85512.87192.68360.1883
H10.96430.93010.92862.86952.79510.07440.89700.83390.79403.12322.83800.2852
H20.96440.92890.92872.90912.83620.07290.86720.78750.73453.45363.09450.3591
H30.96070.92190.92143.14753.06170.08580.86860.78860.73733.46323.10810.3551
H40.96390.92890.92782.89862.82400.07460.88590.81920.77173.21512.89920.3159
H50.96360.92850.92732.91702.83830.07870.89300.82600.78603.16212.86780.2943
Table 3. Parameters of multifractal singular spectrum under different conditions.
Sample IDWater-Saturated ConditionsDry Conditions
α0α10−α0α0α10+α10−α10+RdΔfα0α10−α0α0α10+α10−α10+RdΔf
M11.25912.61450.33122.9457−2.28330.8501 1.47492.56740.67733.2447−1.89020.6445
M21.26162.62070.33842.9591−2.28240.8284 1.47592.56850.67973.2482−1.88870.6406
M31.26562.63140.33392.9653−2.29750.8816 1.48382.57740.69383.2711−1.88360.6298
M41.26382.62830.32632.9547−2.30200.9093 1.47942.57260.68503.2576−1.88760.6393
H11.34372.83090.42193.2528−2.40910.8882 1.57152.65020.88903.5392−1.76130.3931
H21.35202.86780.42793.2957−2.43990.8970 1.71392.79011.10893.8990−1.68130.2815
H31.42253.04540.51403.5593−2.53140.8576 1.71722.80171.10823.9099−1.69360.2868
H41.35232.85410.43003.2840−2.42410.8948 1.60892.68020.95963.6397−1.72060.3368
H51.35512.86700.44103.3080−2.42600.8500 1.58842.66620.91483.5810−1.75130.3847
Table 4. T2 spectrum area and variation in M1 and H1.
Sample IDP1P2P3
Water-Saturated ConditionsDry ConditionsVariation Water-Saturated ConditionsDry ConditionsVariationWater-Saturated ConditionsDry ConditionsVariation
M112,804.837396.46−42.24%4294.02196.35−95.43%6502.297.50−99.88%
H18391.268110.20−3.35%384.8525.20−93.45%572.500−100%
Table 5. Impact of T2 spectra area on pore heterogeneity.
ParameterD−10D0D0D10α10−α0α0α10+
Water-saturated conditionsSa0.340.180.340.29
SS+f−0.34−0.18−0.34−0.29
Dry conditionsSa0.150.240.140.20
SS+f−0.15−0.24−0.13−0.20
Table 6. Relationships between Mad, Ad, pore connectivity, and heterogeneity of coal.
ParameterHD−10D10α10−α10+Rd
Water-saturated conditionsMad−0.42460.32240.3189−0.3052
Ad0.0303−0.0295−0.02950.0245
Dry conditionsMad−0.26660.18920.19410.3676
Ad0.0076−0.0065−0.0067−0.0106
Disclaimer/Publisher’s Note: The statements, opinions and data contained in all publications are solely those of the individual author(s) and contributor(s) and not of MDPI and/or the editor(s). MDPI and/or the editor(s) disclaim responsibility for any injury to people or property resulting from any ideas, methods, instructions or products referred to in the content.

