Article

Pore–Fracture Structure and Fractal Features of Carboniferous Taiyuan Formation Hydrocarbon Source Rocks as Investigated Using MICP, LFNMR, and FESEM

1
AnHui Provincial Key Laboratory of Intelligent Underground Detection, Anhui Province Intelligent Underground Exploration and Environmental Geotechnical Engineering Research Center, College of Civil Engineering, Anhui Jianzhu University, Hefei 230601, China
2
School of Earth and Space Sciences, University of Science and Technology of China, Heifei 230026, China
3
Exploration Research Institute, Anhui Province Bureau of Coal Geology, Hefei 230088, China
*
Author to whom correspondence should be addressed.
Fractal Fract. 2025, 9(4), 263; https://doi.org/10.3390/fractalfract9040263
Submission received: 17 March 2025 / Revised: 17 April 2025 / Accepted: 18 April 2025 / Published: 20 April 2025

Abstract

:
The pore structure of reservoir rocks was a crucial factor affecting hydrocarbon production. Accurately characterized the micropore structure of different types of rock reservoirs was of great significance for unconventional natural gas exploration. In this study, multiple observation methods (field emission scanning electron microscope (FESEM) and low-field nuclear magnetic resonance (LFNMR)) and physical tests (mercury injection capillary pressure (MICP)) were employed, and double logarithmic plots for fractal fitting were illustrated. The fractal dimension of 15 samples was calculated using fractal theory to systematically investigate the pore–fracture structure and fractal characteristics of hydrocarbon source rock (limestone, mudstone, and sandstone) samples from the Late Carboniferous Taiyuan Formation in the Huainan coalfield. MICP experiments revealed that sandstone reservoirs had larger and more uniformly distributed pore throats compared to mudstone and limestone, exhibiting superior connectivity and permeability. The T2 spectrum characteristic maps obtained using LFNMR were also consistent with the pore distribution patterns derived from MICP experiments, particularly showed that sandstone types exhibited excellent signal intensity across different relaxation time periods and had a broader T2 spectrum width, which fully indicated that sandstone types possess superior pore structures and higher connectivity. FESEM experiments demonstrated that sandstone pores were highly developed and uniform, with sandstone fractures dominated by large fractures above the micrometer scale. Meanwhile, the FESEM fractal dimension results indicated that sandstone exhibits good fractal characteristics, validating its certain oil storage capacity. Furthermore, the FESEM fractal dimension exhibited a good correlation with the porosity and permeability of the hydrocarbon source rock reservoirs, suggesting that the FESEM fractal dimension can serve as an important parameter for evaluating the physical properties of hydrocarbon source rock reservoirs. This study enriched the basic geological theories for unconventional natural gas exploration in deep coal-bearing strata in the Huainan coalfield.

1. Introduction

In recent years, along with the deepening of unconventional natural gas exploration activities, unconventional natural gas resources have received more and more attention and become the focus of research and practice, and the intensity of the research on them has also shown a trend of continuous increase [1,2,3]. As the core carrier of oil and gas storage and the key path for oil and gas seepage, the pore–fracture structures, with their complex characteristics, have a profound impact on the physical properties of reservoirs, oil and gas transportation, and storage efficiency, as well as the assessment of tight oil and gas resources reserves and the scale development of economic benefits [4,5]. Therefore, an in-depth investigation of the differences in the interlayer structure among multiple reservoirs is of great academic and practical value for the efficient exploration and utilization of coal system unconventional natural gas resources. The pore–fracture structure of hydrocarbon reservoirs refers to the geometric features, size distribution, connectivity, and configuration relationship of pores and throats in the reservoir, which constitutes the general appearance of pores and connected throats [6]. Currently, the study of pore structure in tight reservoirs constitutes a major hotspot and difficulty in the field of tight oil and gas reservoir research [7,8].
In recent years, many scholars have made many research advances through different pore structure characterization techniques [9]. In the field of observational description, the effects of microwave-assisted cyclic oxidation on the internal and surface structures of coal have been investigated based on spectra obtained from nuclear magnetic resonance (NMR) and surface roughness data acquired from atomic force microscopy (AFM). The results indicated that microwave-assisted cyclic oxidation is most effective in altering the internal and surface morphologies of coal [10]. Furthermore, the genesis of clay minerals in glutenite reservoirs and their impact on reservoir quality have been studied using field emission scanning electron microscopy (FESEM) and X-ray diffraction (XRD) methods. The results showed that the genesis of clay minerals is closely related to rock–fluid interactions, and their impact on reservoir quality depends on the intensity of fluid injection and changes in diagenetic environments [3]. Additionally, X-ray computed tomography (XCT) scanning was employed to analyze the structural characteristics of reservoir formations in the Xihu Sag of the East China Sea Shelf Basin and their impact on permeability by scanning two sets of samples. The results revealed that smaller throats (<5 μm) contributed differently to permeability (0% for Sample 1 and 100% for Sample 5). When these throats significantly contribute to permeability, high-resolution XCT and magnified studies become crucial [11]. In the field of physical testing methods, the pore evolution patterns of tar-rich coal have been unveiled through the utilization of mercury intrusion capillary pressure (MICP), low-temperature N2 adsorption, and low-temperature CO2 adsorption techniques. The research identifies three stages of pore development in tar-rich coal, categorized as Stage 1 with RO, max < 0.9%, Stage 2 with RO, max = 0.9 to 3%, and Stage 3 with RO, max > 3%. There is a strong correlation between these pore development stages and the increase in coal maturation [12]. Experimental methods such as optical microscopy, field emission scanning electron microscopy (FESEM), focused ion beam scanning electron microscopy (FIB-SEM), and micro-nano CT scanning can be used to visually and precisely observe the morphology of pore structures [13,14,15]. However, due to the limitations of high resolution, these instruments can only describe local pore structure patterns, leading to highly uniform and non-representative pore information. Gas adsorption, constant-rate/high-pressure mercury injection, and nuclear magnetic resonance (NMR) testing can characterize a broad range of pore areas, making it easy to quantify the characteristics of storage spaces [16,17,18]. Based on previous research, LFNMR, which provides extensive pore area characterization, was selected as the primary method. The spectral information generated by LFNMR is combined with images from MICP, which has advantages in characterizing macropores, serving as verification and auxiliary checks. According to the aforementioned characterization methods, this study employed a comprehensive and scientific approach combining MICP, LFNMR, and FESEM to characterize the pore and fracture structure of the source rocks from the HN-1 well in the Late Carboniferous Taiyuan Formation.
Fractal geometry is a mathematical discipline that emerged in the late 1970s, focusing on describing irregular shapes and random phenomena [19]. This theory defines irregular structures with self-similarity as fractals, characterized by a certain degree of similarity between their parts and the whole, which is quantitatively described by the fractal dimension. Currently, fractal theory has been widely applied in the field of geology [20]. In the study of source rocks, the FESEM fractal dimension can effectively distinguish the modification of pore structures by different diagenetic processes. For instance, sandstone with a large pore throat system exhibits a low fractal dimension, while clay mineral alignments or organic matter fractures in mudstones display a high fractal dimension [21]. Furthermore, the integrated analysis of FESEM fractal dimensions with MICP and LFNMR data can reveal the synergistic effects of pores across multiple scales. Additionally, the fractal dimension not only describes the pore size and uniformity of distribution in shale but also reflects the complexity of pore morphology. Therefore, the fractal dimension has become an important parameter for quantitatively describing the pore structure of shale, and it can be used to quantitatively characterize the heterogeneity of shale gas reservoirs [22].
In recent years, the exploration of unconventional natural gas in the deep coal measures of the Huainan coalfield has continued to deepen, yet it also faces geological challenges such as fractured and soft coal seams. These challenges have prompted various scholars to conduct research at different levels [23,24]. Furthermore, the predicted geological resource volume of coalbed methane in coal seams shallower than 2000 m in the Huaian–Huaibei region amounts to 8984.69 × 108 m3, accounting for approximately 90% of the deep coalbed methane resources in East China. Regardless of coal seam gas content or coalbed methane resource abundance, the Huainan coalfield exhibits higher resource potential [25], and the aforementioned content is a key focus for future exploration of unconventional natural gas in deep coal measures in Anhui. Based on this, this study selects the HN-1 well in the Taiyuan Formation of the Late Carboniferous in the Huainan coalfield as the research object. Building upon traditional geological exploration methods, multiple cutting-edge experimental techniques are introduced, including MICP, LFNMR, FESEM, and polarized optical microscopy (POM). The aim is to deeply reveal the microstructure characteristics of different types of rocks, such as limestone, sandstone, and mudstone, focusing on key parameters like pore size distribution, pore connectivity, and permeability. Moreover, by calculating the fractal dimension using SEM, combined with pore data obtained from MICP and LFNMR, the heterogeneous evolution of micropores and fractures in the source rocks of the Taiyuan Formation was quantitatively analyzed. Relevant reports have been published on studying rock pore–fracture structures using methods such as FESEM [3], LFNMR [10], and MICP [12]. However, this study is the first to systematically combine these three methods to conduct a comprehensive and in-depth analysis of the pore structure and fracture characteristics of the source rocks of the Taiyuan Formation in the Huainan coalfield. Specifically, MICP technology is utilized to conduct a detailed analysis of the pore structure of source rocks in the Taiyuan Formation, revealing differences in pore morphology and distribution among different rock types. Through LFNMR technology, important information regarding the distribution and fluidity of internal fluids within rocks is obtained. Meanwhile, FESEM and POM allow for direct observation of the micromorphology and mineral composition of rock surfaces. Furthermore, this study delves into the differences and complementarity of various experimental methods in characterizing the internal microstructure of rocks. These findings enrich the fundamental geological theories underlying unconventional natural gas exploration in deep coal seams in the Huainan coalfield.

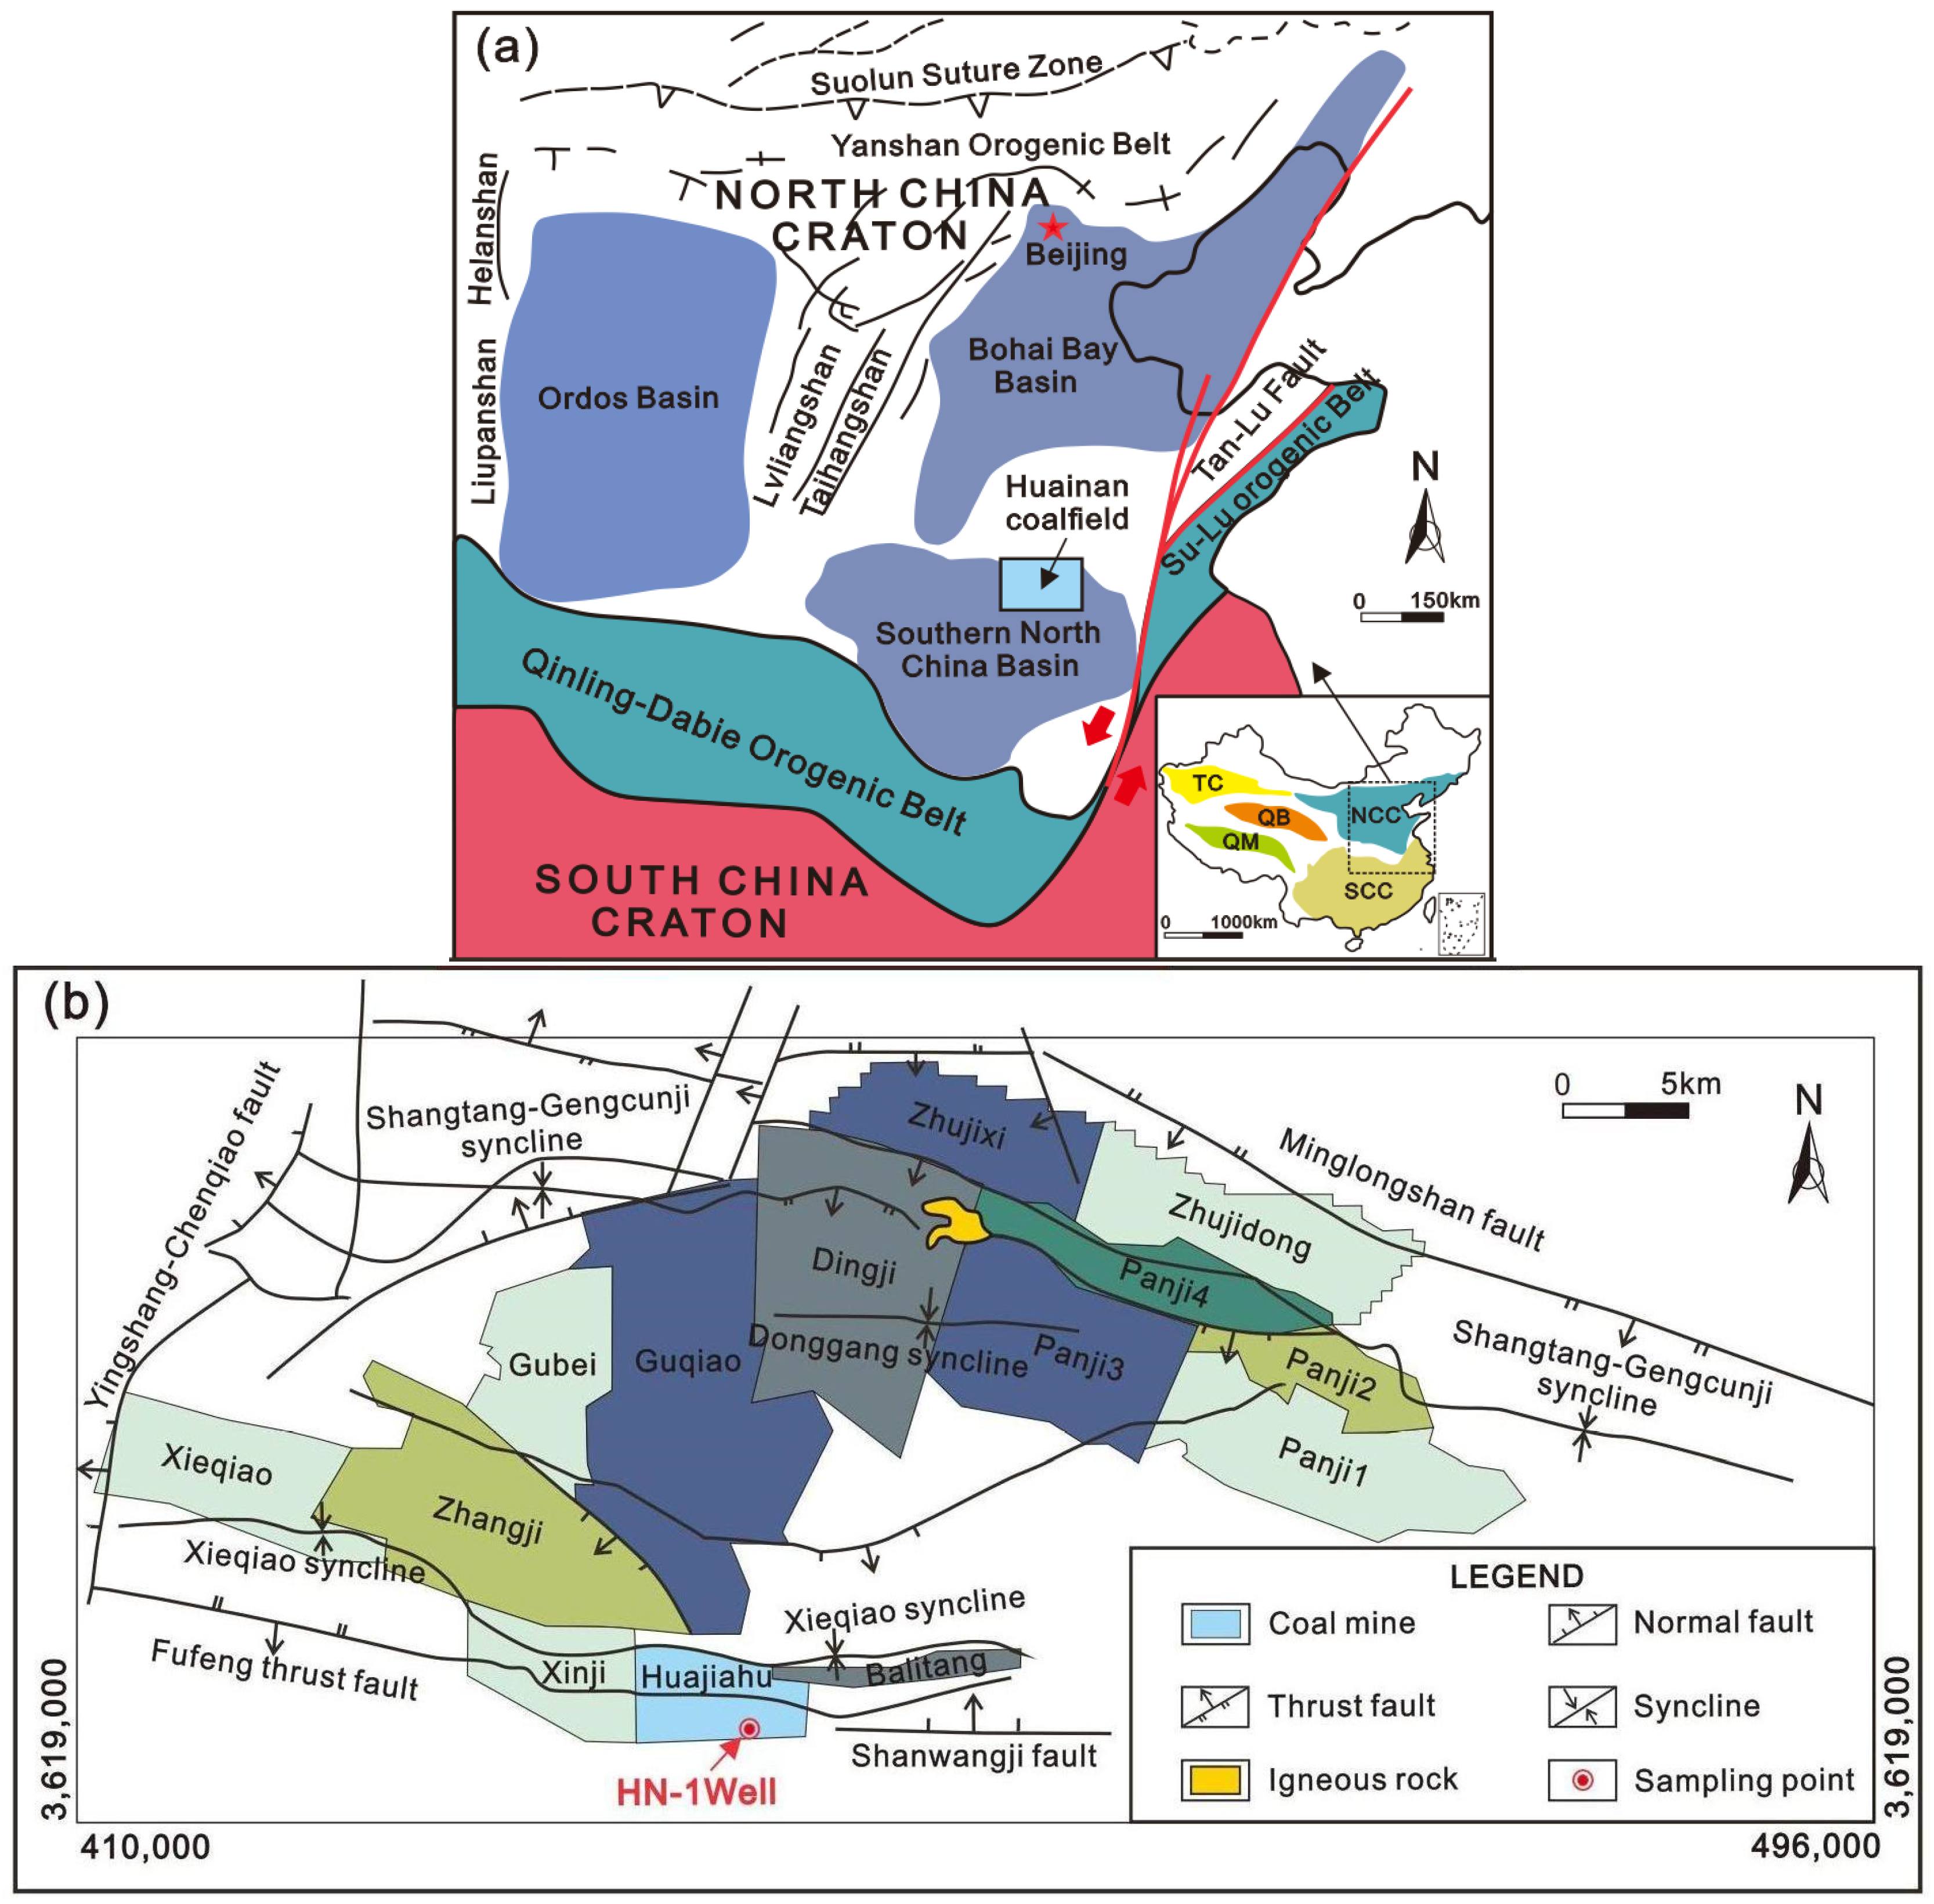
2. Geological Setting

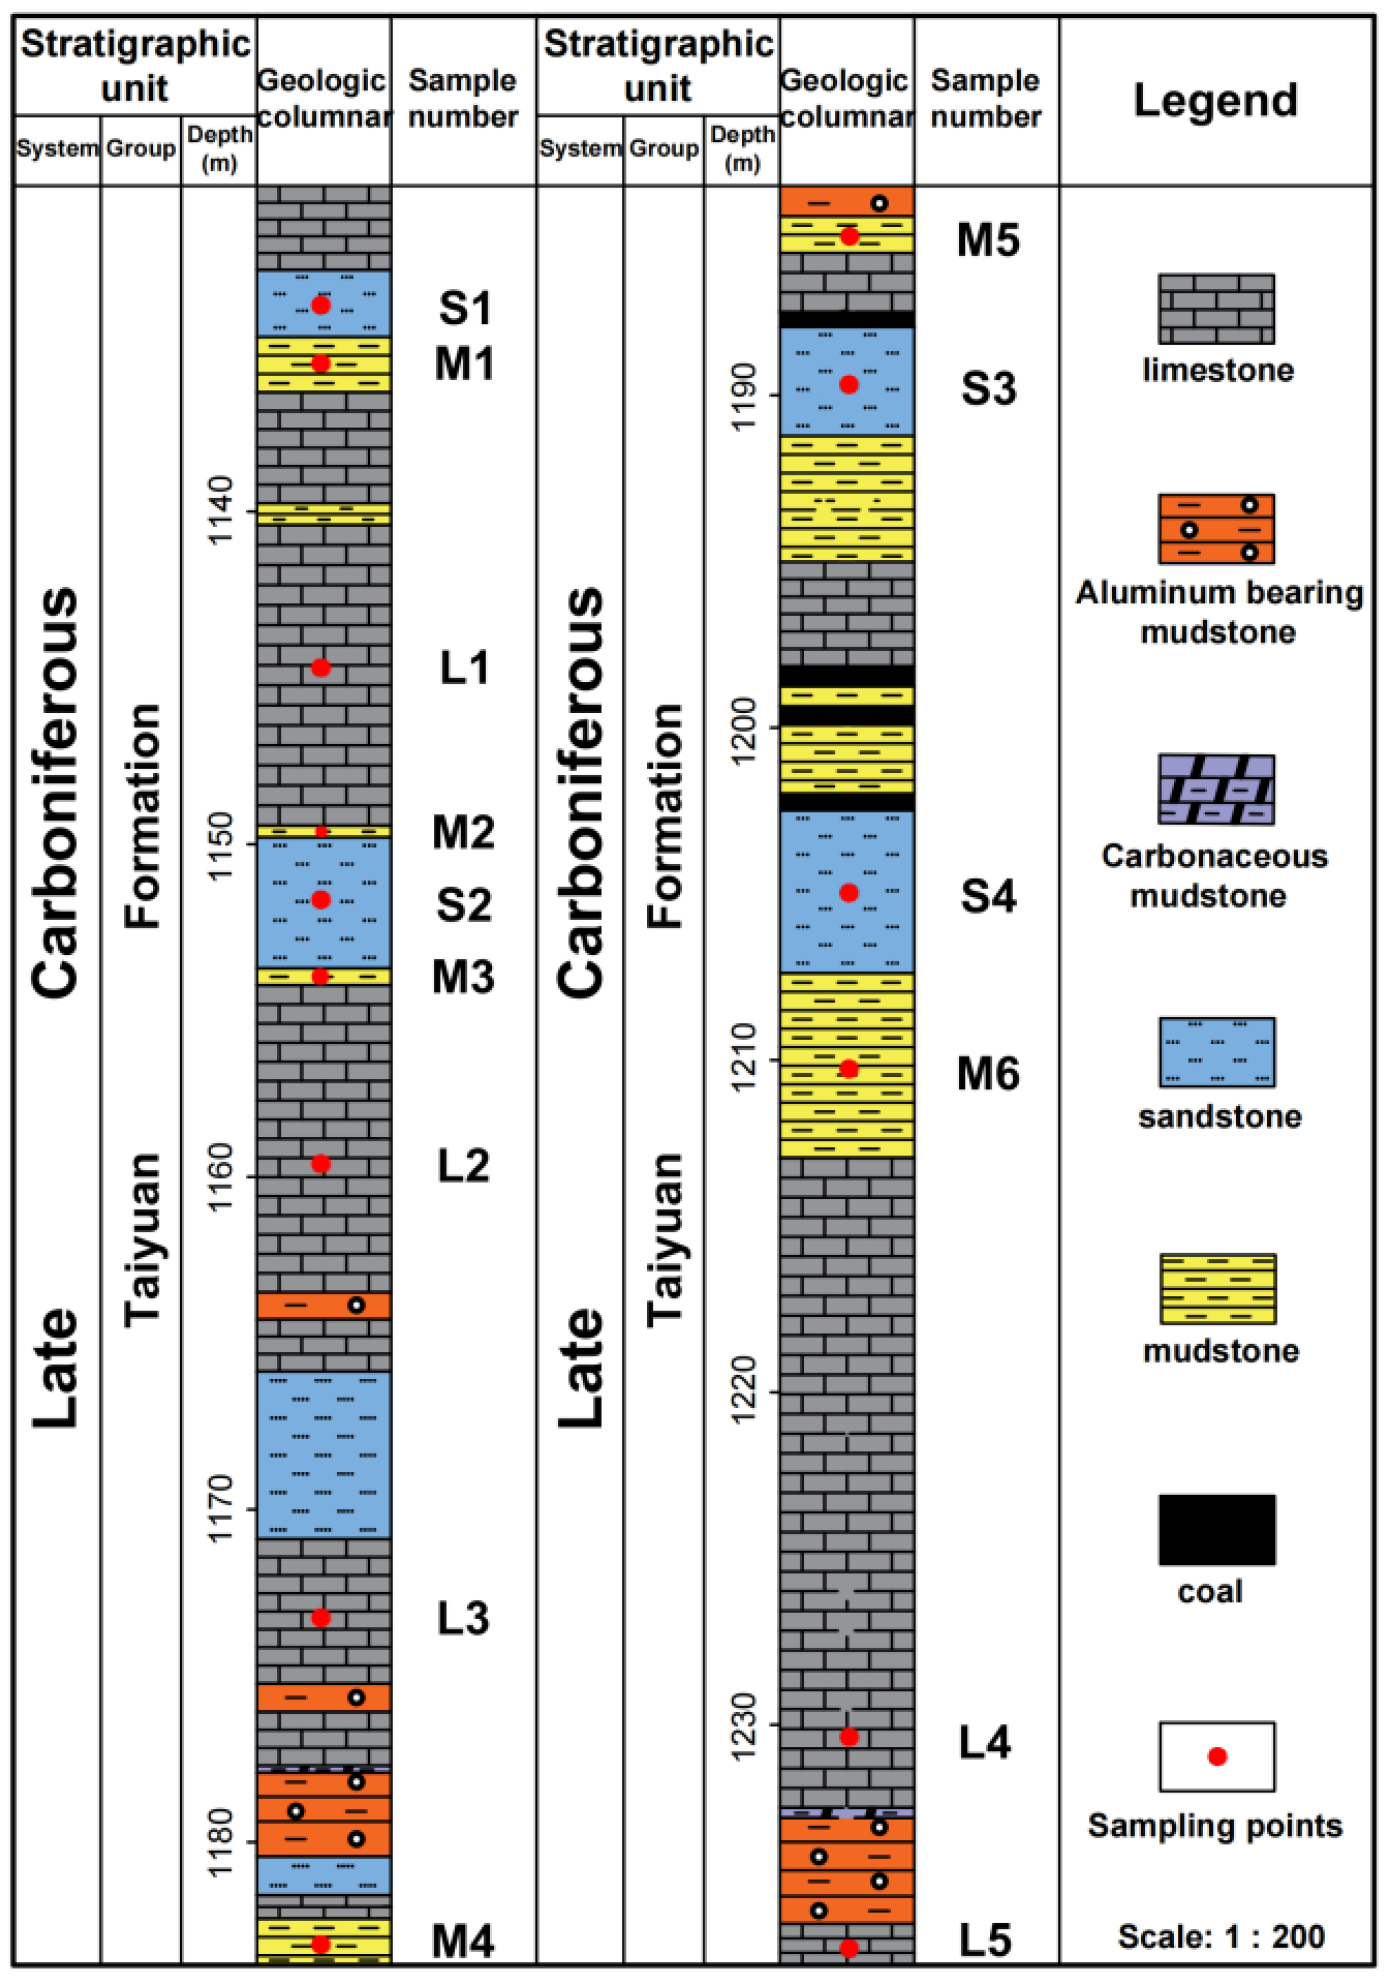
2.1. Stratigraphy of the Study Area

The stratigraphic composition of the Huainan coalfield is primarily dominated by the Upper Paleozoic, with its Lower Paleozoic distributed at the edges of the coalfield, all extensively covered by the Quaternary. Its coal-bearing strata belong to the North China-type Carboniferous–Permian coal measures, encompassing the Benxi Formation and Taiyuan Formation of the Late Carboniferous, as well as the Shanxi Formation, Lower Shihezi Formation, and Upper Shihezi Formation of the Early and Late Permian, respectively [26]. Among them, the Taiyuan Formation overlays the Benxi Formation. The source rocks of the Taiyuan Formation are primarily composed of limestone, sandstone, mudstone, carbonaceous shale, and thin coal seams, which are deposited in a transitional environment from shallow sea to coast [26,27]. Within this, the limestone is stable and relatively thick, with a thickness of 10 to 20 m, accounting for 37% of the total thickness. The sandstone (accounting for approximately 14% of the thickness) is mainly medium- to fine-grained quartz sandstone of marine–terrestrial transitional facies, while the mudstone (accounting for approximately 23% of the thickness) is rich in organic matter [28] (Figure 1). The lithological characteristics primarily reflect the depositional processes of a series of platform–barrier island complex systems at the marine–terrestrial interface. The L1, L3, L4, and L12 limestone horizons within the Taiyuan Formation are stable, especially L4 and L12 limestones, which are not only stable in horizon but also possess significant thicknesses, generally ranging from 10 to 20 m [28]. Based on lithological characteristics, the Taiyuan Formation is further subdivided into three limestone groups: C3I (L1 to L4 limestone), C3II (L5 to L10 limestone), and C3III (L11 to L13 limestone). Additionally, there exists a disconformity contact relationship between the Taiyuan Formation and the underlying Ordovician Majiagou Formation [29].

2.2. Tectonics of the Study Area
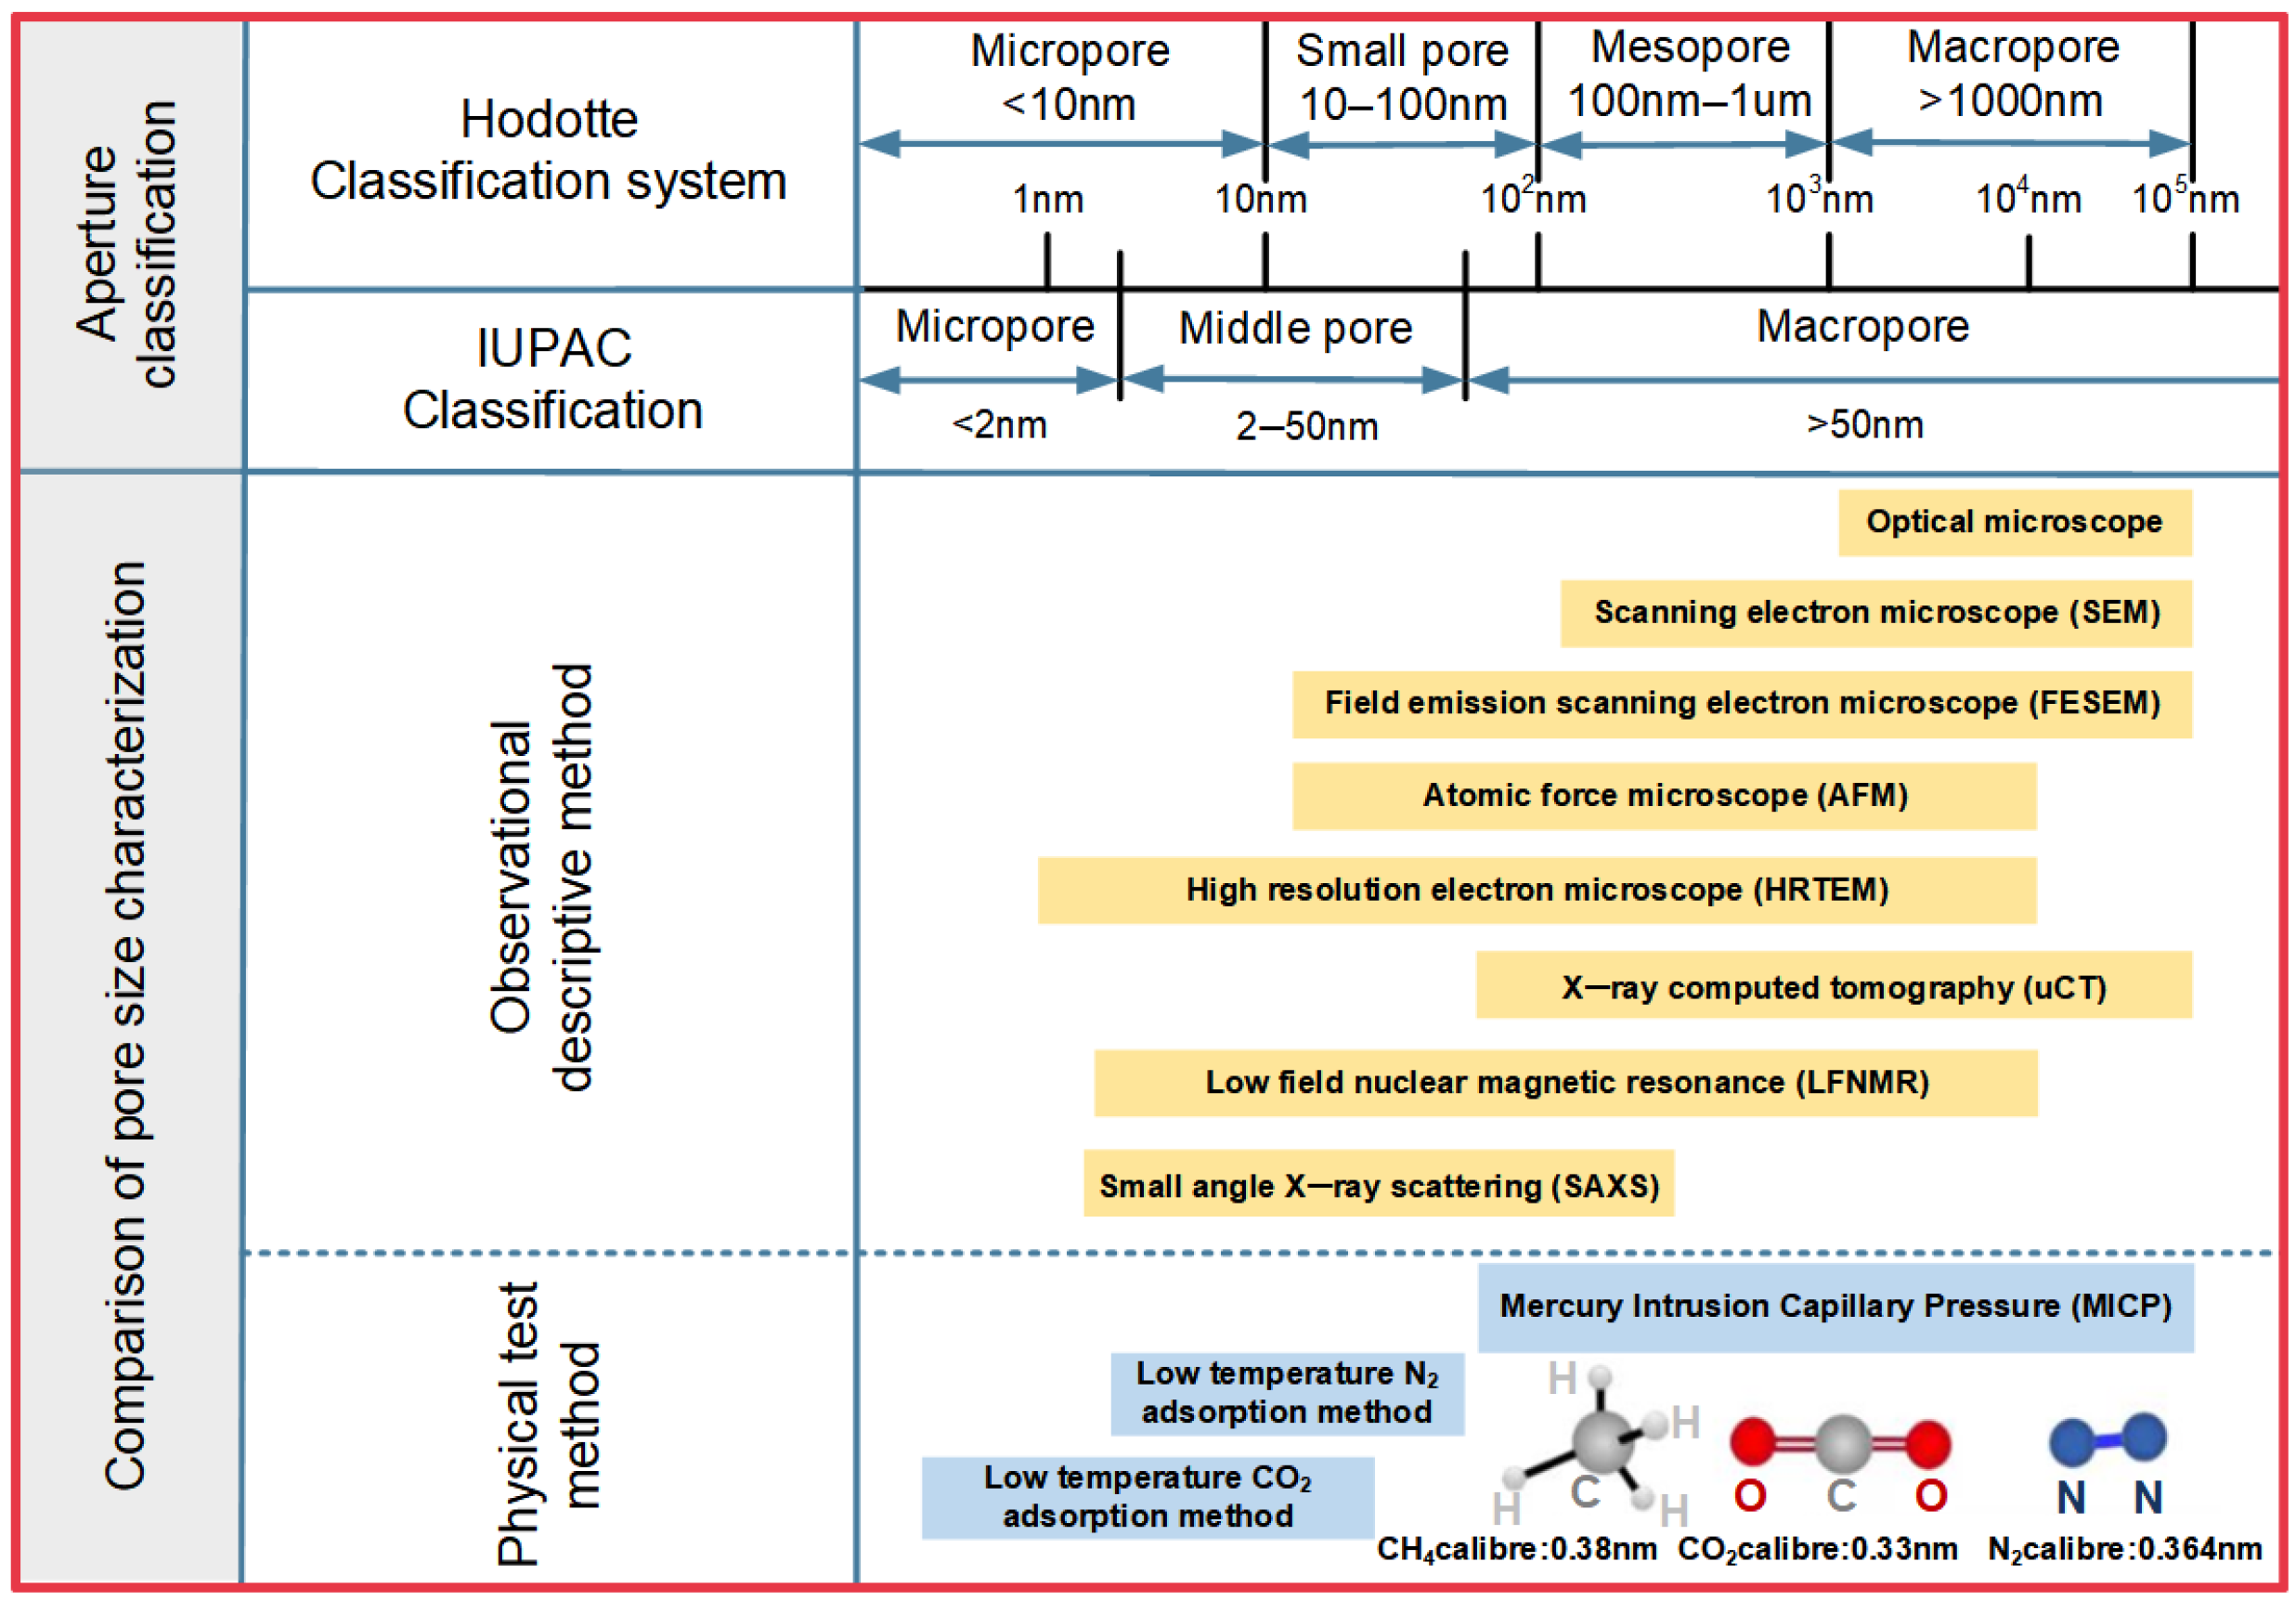
The Huainan coalfield is located in the northern part of Anhui Province, on both sides of the Huai River, spanning the counties (districts) of Fengtai, Yingshang, Lixin, and Mengcheng in the cities of Huainan, Fuyang, and Bozhou. The geographic location is at the southern edge of the North China Craton Basin, and the coalfield extends from Chuxian County in the east to the vicinity of Fuyang in the west, spreading in a northwesterly direction in the plane, with an overall long ellipse shape, a length of about 180 km, a width of about 20–30 km, and a geographic area of about 3654 km2 [27], surrounded by large basins, such as the Ordos Basin and Bohai Bay Basin, and neighboring the Tantanlu Fracture Zone and the Suru Orogenic Belt (Figure 2a). The HN-1 well is located in the alluvial plain of the Huaihe River, with a low relief, generally 22–26 m above sea level, high in the west and low in the east. The stratigraphic strike is from east to west, inclined to north, with a large dip angle of 60° to 90°. Figure 2b shows the geotectonic map of the Panxie mining area of this study, as well as the distribution of faults and folds and the location of the HN-1 well.

3. Methodology

The classification of pore sizes in porous media is fundamental for evaluating pore structure characteristics. In this study, a comprehensive pore size classification scheme proposed by both Hodot and IUPAC was adopted to analyze the pore structure of the rocks (Figure 3). Figure 3 illustrates that various techniques are available for characterizing the pore size distribution in porous media, primarily categorized into observational description methods and physical testing methods. By integrating these two types of methods, a full-scale (macro-meso-micro) characterization of the pore structure in porous media can be achieved. Therefore, in this study, we chose to combine three techniques: MICP, LFNMR, and FESEM. Additionally, we calculated the fractal dimension of images obtained through FESEM to comprehensively characterize the pore–fracture structure and fractal features of the hydrocarbon source rocks from the Late Carboniferous Taiyuan Formation. Firstly, MICP technology was employed to quantitatively assess the pore structure of the rock samples. This method is crucial for understanding the size and morphology of pores in sandstone, mudstone, and limestone, particularly as it reveals that sandstone has larger and more uniformly distributed pore throats compared to other lithologies. Subsequently, the LFNMR technology was used to further verify and refine the MICP results. LFNMR indirectly reflects the pore structure by measuring the relaxation time of fluids within the rocks. The T2 spectrum characteristic plot displays signal intensities across different relaxation time intervals, thereby reflecting the distribution of pore sizes. FESEM offers high-resolution imaging capabilities, enabling the revelation of pore and fracture structures within rock samples. Furthermore, through the calculation of fractal dimensions, it is possible to quantitatively describe the complexity of source rock reservoir structures. Notably, FESEM images also exhibit microstructural differences between various types of rocks, which further underscores the importance of combining multiple techniques for a comprehensive characterization of the internal microstructure of rocks.

4. Samples and Experiments

4.1. Hydrocarbon Rock Sample Collection

The HN-1 well is the first investigation well for the Taiyuan Formation in the Huainan coalfield, and the vast majority of the rock samples were used for physical and chemical analyses and resolved adsorption tests. Therefore, a representative portion of the retained rock samples was utilized in this study for special pore structure testing and analysis. According to the current regulations of the “Coal Rock Sample Taking Program” (GB/T 19222-2003) [31], samples of hydrocarbon source rocks (limestone, mudstone, and sandstone) were collected from the Late Carboniferous Taiyuan Formation strata in the Huainan coalfield. Due to the limited thickness of thin coal seams and carbonaceous shales, which contribute minimally to reservoir capacity and permeability [27], and their low compressive strength and sampling integrity, with a tendency to be fragile, this study focuses on sampling the more critical core lithologies within the source–reservoir system. Specifically, five limestone samples, four sandstone samples, and six mudstone samples were collected (Figure 1).

4.2. Experimental Methods

During a systematic investigation of the pore structure and fracture characteristics of the hydrocarbon source rocks (including limestone, mudstone, and sandstone) from the Late Carboniferous Taiyuan Formation in the Huainan coalfield, an experimental sequence of MICP-LFNMR-FESEM was followed, thereby establishing an in-depth understanding of the microstructure of different types of rocks. Figure 4 presents the cores sampled from the Taiyuan Formation at depths ranging from 1150 to 1156 m, which serve as representative samples for testing the rocks.
Firstly, quantitative analysis of pore structure characteristics was conducted using MICP experiments, with particular attention paid to the size distribution and connectivity of pore throats. Simultaneously, the results from MICP provided crucial clues for uncovering the relationship between pore size distribution and the width of the LFNMR T2 spectrum. Subsequently, the application of LFNMR technology further enhanced the understanding of pore structures. The T2 spectrum characteristic map of LFNMR clearly demonstrated strong signal intensity and a broad T2 spectrum width for sandstone types within different relaxation time periods, which directly reflected the favorable pore structure and high connectivity of the sandstone. The results from LFNMR and MICP can mutually validate each other. Finally, through FESEM observations, high-resolution morphological information (including micro- and nanoscale pore fractures) of the rock sample surfaces was obtained, and through the calculation of fractal dimension, the complexity of the source rock reservoir structure was quantitatively described. This morphological evidence provided an intuitive interpretative framework for the results of MICP and LFNMR. Detailed experimental methods for the aforementioned three experiments will be elaborated on in the following sections.

4.2.1. Mercury Intrusion Capillary Pressure (MICP)

The MICP experiment employed an AutoPore IV 9505 porosimeter manufactured by Micromeritics Instrument Corporation, Norcross, Georgia, USA. This instrument is primarily used to measure key parameters in materials with macroporous structures, such as total pore volume, pore size distribution, and porosity. Its low-pressure analysis range spans from 1.38 to 310 kPa and is capable of analyzing pore size distributions from 3.6 mm to 1000 µm in diameter. Meanwhile, high-pressure analysis can reach pressures up to 227,527 kPa, allowing the instrument to accurately measure pore sizes as small as 0.0050 mm (i.e., 5 µm). The entire experimental process was strictly conducted in accordance with the standard “Method for Measurement of Capillary Pressure Curve of Rocks” (GB/T 29171-2012) [32], and carried out in a constant temperature laboratory environment throughout. During the experiment, the integrated temperature control system of the Micromeritics AutoPore IV 9505 instrument was employed to precisely maintain the ambient temperature within the range of 20.1 °C to 20.3 °C. A high-precision thermocouple was used to monitor the temperature of the sample chamber in real time, ensuring that the error was controlled within ±0.1 °C. Additionally, the relative humidity of the experimental environment was maintained between 66% and 70%. Prior to the experiment, samples underwent preprocessing, including cleaning, drying, and weighing, to ensure the accuracy of the experimental results. Subsequently, the pretreated samples were carefully placed in the instrument’s sample chamber, and appropriate pressure ranges and measurement parameters were set according to the experimental requirements. During the high-pressure mercury injection process, the instrument automatically recorded and analyzed data at different pressure points, thereby obtaining detailed pore structure parameters, including pore diameter, pore size distribution, porosity, and permeability. Throughout the experiment, the instrument’s status and experimental conditions were closely monitored to ensure data accuracy and reliability.

4.2.2. Low-Field Nuclear Magnetic Resonance (LFNMR)

Before conducting the LFNMR experiment, the rock samples must be precisely prepared into a cylindrical plug with a diameter of 25 mm and a length of 4.5 mm, ensuring that its surface is smooth and flawless. Subsequently, a Memmert UN 110 constant temperature drying oven (Schwabach, Bavaria, Germany), equipped with a PID automatic feedback control system, was utilized. Real-time monitoring of temperature fluctuations within the oven was conducted using a high-precision platinum resistance temperature sensor (PT100) manufactured by JUMO GmbH & Co. KG (Fulda, Hesse, Germany). To ensure that the temperature remained stable within the range of 70 ± 0.3 °C. The calibration of the drying oven was strictly performed in accordance with ISO 9001 standards, with periodic verification conducted using an NIST-traceable Type K thermocouple manufactured by JUMO GmbH & Co. KG, Fulda, Hesse, Germany (with an error of ±0.2 °C). Additionally, multipoint temperature distribution tests were conducted to confirm temperature uniformity. After 24 h of drying, the moisture within the samples was thoroughly removed. After drying, the sample was introduced into a vacuum pressure water saturation device and subjected to saturation treatment with distilled water for 72 h under a constant pressure of 20 Mpa. During this process, regular checks are required to maintain stable pressure and water saturation within the device, ensuring thorough saturation and pretreatment of the sample. The instrument used in the experiment was the AVANCE III/WB-400 solid wide-bore superconducting LFNMR spectrometer manufactured by Bruker BioSpin GmbH (Rheinstetten, Baden-Württemberg, Germany). This instrument boasts high precision and is capable of identifying molecular chemical structures, as well as the microscopic morphology of solids or semi-solids. The superconducting magnet was utilized to maintain a constant low temperature through a liquid helium circulation system, with the temperature controlled at 32 ± 0.01 °C. Prior to the experiment, the temperature of the sample chamber was calibrated using a built-in platinum resistance temperature sensor (PT100). Real-time feedback adjustment was performed through the instrument software to ensure temperature stability during the relaxation time measurement. The magnetic field strength was set to 9.4 Tesla, providing sufficient intensity to excite the LFNMR phenomenon. Additionally, an appropriate rotor needs to be selected based on the sample size and experimental requirements. Among them, the 4 mm rotor can reach a maximum rotational speed of 15 kHz, suitable for small-volume samples or high-resolution testing, whereas the 7 mm rotor has a maximum rotational speed of 8 kHz, suitable for larger samples or routine testing. Prior to the experiment, the pore size test range must also be calibrated to ensure that it accurately covers the range of 0.1 to 1000 mm, meeting the needs of testing different types of samples.

4.2.3. Field Emission Scanning Electron Microscopy (FESEM)

To more accurately describe the morphology of the sample surface, the FESEM experimental procedure is outlined as follows: Initially, the rock samples undergo meticulous treatment using an argon ion polisher, model EM TIC 3X, manufactured by Leica Microsystems GmbH (Wetzlar, Hesse, Germany). During the polishing process, the polishing time is strictly controlled to ensure the smoothness of the sample surface; concurrently, the ion beam energy is set to a specific value to avoid damaging the microstructure of the samples. Upon completion of polishing, the sample surface undergoes rigorous inspection to confirm the absence of scratches or residues. The observation surface is not coated with carbon or gold to prevent unnecessary interference or obscuring of the micro-features on the sample surface. Subsequently, the samples are placed on the sample stage of the FESEM, model Zeiss Sigma 500, produced by Carl Zeiss Microscopy GmbH (Oberkochen, Baden-Württemberg, Germany). The position and angle of the samples are meticulously adjusted to achieve optimal observation results. Prior to activating the microscope, the operating parameters of the microscope are preset based on the characteristics of the samples and the intended observation objectives. These parameters include the accelerating voltage (0.02–30 kV), low vacuum range (2–133 Pa), and beam current (3 pA–20 nA), ensuring the acquisition of high-resolution images. With a resolution exceeding 0.8 nm, the Zeiss Sigma 500 microscope can precisely capture and characterize the micro-morphological features of the sample surface. During the experiment, the operating state of the microscope is continuously monitored and adjusted to maintain optimal image quality throughout. This includes periodic checks and calibrations of the microscope’s focus, brightness, contrast, and other parameters to guarantee image clarity and accuracy.

4.2.4. Calculation of Fractal Dimension

Fractal theory was established in the 1970s and has since evolved into various types of fractal dimensions, including topological dimension, Hausdorff dimension, self-similarity dimension, correlation dimension, and information dimension [33]. Based on SEM experimental results, this paper utilizes the Image J tool (version 1.54) and adopts the Hausdorff dimension, specifically the box-counting dimension method, to quantitatively analyze the pore distribution characteristics on the surface of coal. The specific steps are as follows: Starting with the original SEM image, an appropriate threshold is selected to convert the grayscale image into a black-and-white binary image. Boxes of different side lengths (δ) are then used to cover the binary image area, where different δ values correspond to grids of different sizes, typically δ = 2−k. The number of small boxes containing pores is counted, and the fractal dimension is then calculated using Equation (1) [34]. In a log–log coordinate system, the least squares method is employed to perform regression analysis on the number of fractures N(δ) and the grid side length δ. The slope of the regression line represents the fractal dimension of the fracture surface.
D = lim δ 0 log ( N ( δ ) ) log ( δ )
In the equation, D represents the fractal dimension, δ denotes the side length of the box, and N(δ) is the number of boxes required to cover the pore area on the coal surface.

5. Results and Analysis

5.1. Results of MICP Test

5.1.1. Pore Throat Size

The pore throat size in rocks refers to the dimensions of pores or channels within rocks, serving as the primary pathways for fluid flow in underground reservoirs. The size, shape, and distribution of these pore throats influence fluid velocity, flow rate, and permeability [35,36], making it necessary to quantitatively characterize the pore throat size. Studies indicate that a lower displacement pressure corresponds to coarse pore throats, good permeability, and excellent pore structure; conversely, a higher displacement pressure indicates fine pore throats, low permeability, and poor pore structure [17].
Additionally, based on the pore throat interval, pore throat sizes can be categorized as follows: micropores with a radius < 0.05 μm; small pores with 0.05 μm ≤ radius < 0.5 μm; medium pores with 0.5 μm ≤ radius < 5 μm; large pores with 5 μm ≤ radius < 50 μm. The experimental test results of 15 hydrocarbon source rock samples from the HN-1 well in the study area (Table 1) indicate that, in terms of displacement pressure, limestone ranges from 13.78 to 20.66 Mpa, averaging at 17.22 Mpa; sandstone ranges from 5.50 to 13.78 Mpa, averaging at 7.57 Mpa; and mudstone ranges from 11.26 to 16.34 Mpa, averaging at 13.78 Mpa. In terms of average pore throat interval, limestone ranges from 0.009 μm to 0.016 μm, averaging at 0.013 μm; sandstone ranges from 0.015 μm to 0.033 μm, averaging at 0.025 μm; and mudstone ranges from 0.012 μm to 0.015 μm, averaging at 0.013 μm. During the research process, it was observed that pore throat size parameters significantly influence rock porosity. To further analyze this correlation, a linear correlation plotting method was employed (Figure 5).
The results indicate that all three rock types exhibit characteristics of microporosity development. As shown in Figure 5, sandstone has a relatively low entry pressure, reflecting coarser pore throats in the reservoir, which in turn contributes to its better permeability and pore structure. A significant negative correlation exists between the entry pressure and the porosity of source rocks. This is because rocks with low porosity are dominated by small pores, leading to increased capillary resistance. Therefore, higher entry pressure is required to overcome this resistance. Additionally, there is a positive correlation between the average pore throat interval and porosity. In source rocks or reservoirs, the formation of pores is usually accompanied by the expansion of pore throats. Based on this characteristic, entry pressure and average pore throat interval can be utilized to assess porosity.

5.1.2. Pore Throat Sorting Characteristics

The pore throat sorting characteristics refer to the variability and regularity of parameters, such as pore throat size, shape, and distribution [37]. These characteristics reflect the storage and permeability capabilities of rocks, which are of great significance for the formation and development of oil and gas reservoirs. According to related research, parameters such as the relative sorting coefficient (D), uniformity coefficient (α), and pore throat skewness (Skp) have a direct impact on pore throat sorting characteristics. The relative sorting coefficient (D) is a dimensionless coefficient; the smaller its value, the more uniform the pore throat distribution. The uniformity coefficient (α) is also a dimensionless coefficient ranging from 0 to 1; the closer its value is to 0, the more uniform the throat distribution. The Skp indicates a positive skewness if greater than 0, with coarser pore throats; it indicates a symmetrical distribution of coarse and fine pore throats if equal to 0 and a negative skewness if less than 0, with finer pore throats. The experimental test results indicate (Table 1) that for limestone, D ranges from 73.32 to 98.05, with an average of 83.94; α ranges from 0.263 to 0.323, averaging 0.291; and Skp ranges from −0.504 to −0.009, averaging −0.255. For sandstone, D ranges from 52.08 to 77.32, averaging 64.48; α ranges from 0.183 to 0.286, averaging 0.230; and Skp ranges from −0.422 to −0.244, averaging −0.305. For mudstone, D ranges from 76.86 to 89.04, averaging 82.84; α ranges from 0.221 to 0.261, averaging 0.241; and Skp ranges from −0.441 to −0.247, averaging −0.347. During the research, a correlation analysis was also conducted between relevant parameters in pore throat sorting characteristics and porosity (Figure 6).
As can be seen in Figure 6, the pore throat distribution in sandstone is relatively uniform. However, throat distribution in limestone, sandstone, and mudstone exhibits uneven characteristics. The skewness of pore throats in limestone, sandstone, and mudstone is less than 0, indicating that they all belong to the category of negative skewness, with relatively small skewness values. Furthermore, there is a significant negative correlation between the uniformity coefficient and the relative sorting coefficient with porosity. Since rocks with low porosity are dominated by primary pores, which have irregular pore shapes and a wide distribution range of pore throat sizes, the uniformity coefficient and sorting coefficient are relatively high. Based on this characteristic, the uniformity coefficient can be utilized to assess porosity.

5.1.3. Pore–Throat Connectivity and Seepage Performance

Rock pore–throat connectivity refers to the degree of connection between pores and throats within the rock, while permeability describes the ability of fluids to flow through these pores and throats within the rock [35]. Studying rock pore–throat connectivity and permeability aids in determining the reserves and recoverability of oil and gas deposits. Therefore, it is necessary to quantitatively characterize pore–throat connectivity and permeability.
Connectivity and permeability are related to maximum mercury injection saturation, residual mercury saturation, and mercury withdrawal efficiency, with the relevant parameters outlined in Table 1. The maximum mercury saturation (Smax) of limestone ranged from 76.53 to 86.29, with an average of 81.57. The residual mercury saturation (%) ranged from 25.72 to 40.46, with an average of 31.51. The mercury withdrawal efficiency ranged from 52.41 to 66.40, with an average of 61.54. The Smax of sandstone in the study area ranged from 88.25 to 95.26, with an average of 91.04. The Smax of the sandstone in the study area ranged from 88.25 to 95.26, with an average of 91.04. The residual mercury saturation (%) ranged from 27.28 to 42.73, with an average of 32.47, and the mercury withdrawal efficiency ranged from 55.14 to 70.95, with an average of 64.45. The Smax of mudstone in the study area ranged from 79.15 to 90.13, with an average of 86.23. The Smax of the mudstone in the study area ranged from 79.15 to 90.13, with an average of 86.23. The residual mercury saturation (%) ranged from 13.29 to 28.54, with an average of 18.40, and the mercury withdrawal efficiency ranged from 67.85 to 85.07, with an average of 78.80. Correlation plots were made with the same two points as those mentioned above for the purpose of analyzing the results (Figure 7).
As can be seen from Figure 7, in terms of the average maximum mercury saturation and average displacement efficiency, sandstone exhibits characteristics of high maximum mercury saturation and high mercury displacement efficiency. This indicates that the pore structure of sandstone in the study area is more uniform and has better connectivity, followed by mudstone. In terms of pore–throat connectivity and permeability performance, there is a positive correlation between maximum mercury saturation and rock porosity. This is because rocks with low porosity are mainly composed of isolated pores or micropores, with narrow or blocked throat passages, which results in mercury being able to enter only partially connected pores, thereby limiting the maximum mercury saturation. Based on this characteristic, the porosity and connectivity of rocks can be evaluated through maximum mercury saturation.

5.2. Capillary Pressure Curve Characteristics

Figure 8 and Figure 9 show the characteristics of the capillary pressure curves and the distribution of the pore throats in some of the limestones, sandstones, and mudstones in the study area, respectively. The capillary pressure curves show that, overall, the flat section of the capillary pressure curves of limestones, sandstones, and mudstones in the study area is higher, indicating that the pore throats tend to be concentrated in fine pore throats with fine crookedness. The flat section of the mercury feed curve is almost absent and tilted to the lower right, indicating that the pore throat interval is poorly sorted. On the whole, the pore throats of limestone, mudstone, and sandstone in the study area are on the thin side, and the pore structure is poor. The pore throat distribution indicates that the pore throat interval distribution curves of limestone, sandstone, and mudstone in the study area are all of the fine single-peaked type, and the pore throat radii of L1 and L2 are mainly distributed in the range of 0.00404 μm to 0.044 μm. The distribution of pore throat interval of L3 and L4 ranges from 0.00404 μm to 0.0630 μm. The pore throat interval distribution range of sandstone is mainly 0.01 μm to 0.16 μm, and the part larger than 0.1 μm is fine throat. The radius distribution of the pore throat of mudstone mainly ranges from 0.004 μm to 0.063 μm, which is a fine throat. In general, the overall pore throat interval of sandstone is larger.
In addition, the pore throat interval at the peak of limestone ranges from 0.025 μm to 0.040 μm, and the pore throat distribution frequency (PTDF) at the peak is about 15%, and that of sandstone ranges from 0.0634 μm to 0.100 μm, and the PTDF at the peak fluctuates in a small range above and below 10%. The pore throat interval at the peak of mudstone is 0.025 μm to 0.040 μm, and the PTDF at the peak is about 12%. The pore throat interval at the peak is generally low and has a long tail trailing to the end of the fine roar channel, which is poorly sorted. However, their permeability contributions are all greater than 50%, and in the single-peak roar distribution curve, the permeability contribution is always biased toward the coarser roar section, and the pore contribution of the permeability to the finer roar section is small, generally less than 10%.

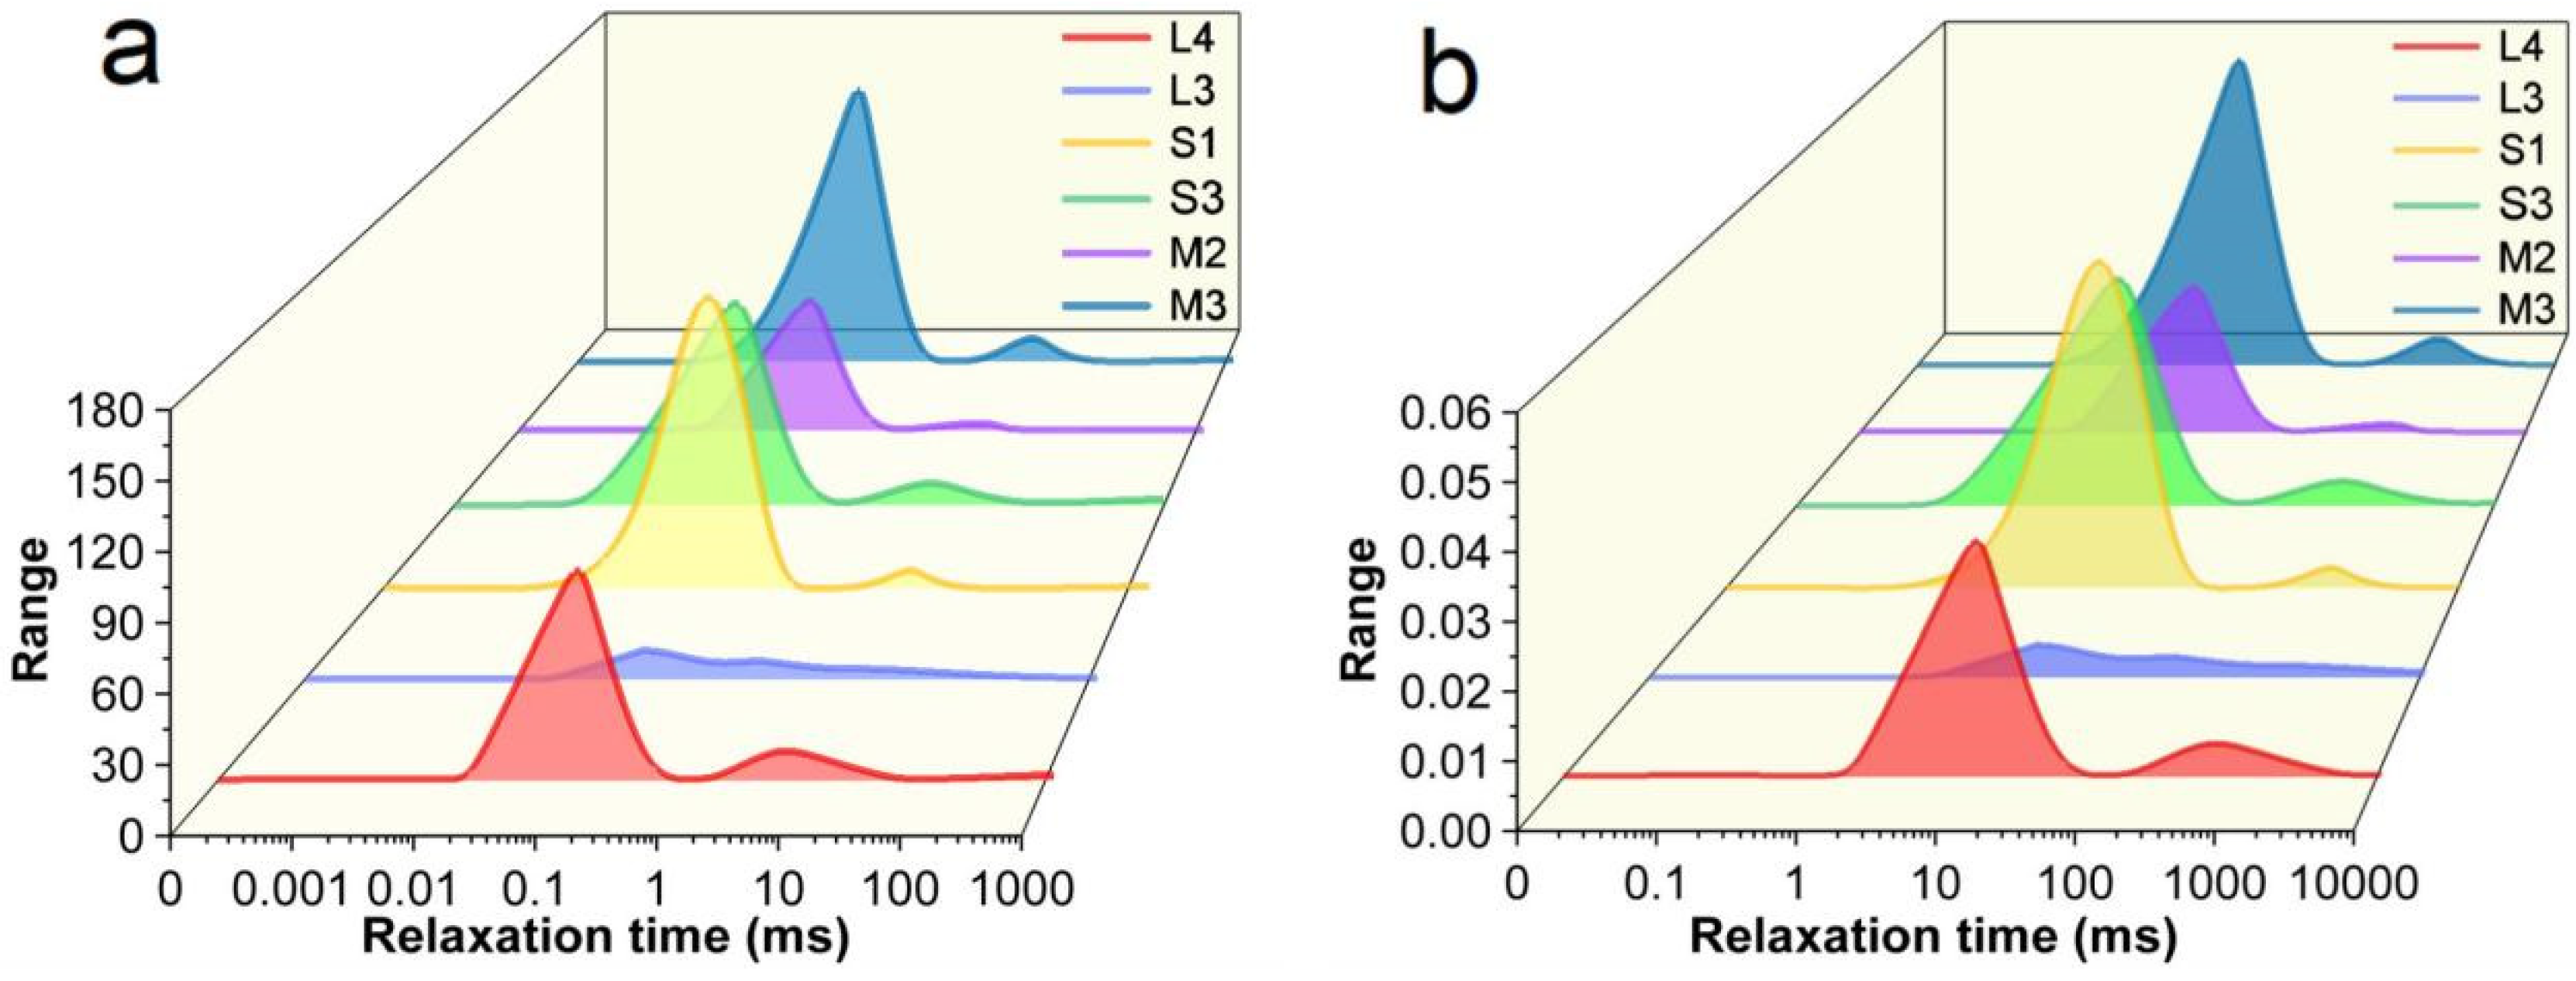
5.3. Results of LFNMR Experiments

The LFNMR T2 spectrum is based on the mathematical inversion of the signal decay process of a multi-segment echo string. The decay of the spin echo string reflects the number and distribution of hydrogen nuclei in the medium, and the echo amplitude decreases with time. This decay information can be utilized to determine the pore content and the pore size distribution [38]. The initial signal amplitude of the echo string is converted to obtain the porosity, and the decay rate reflects the pore size distribution and fluid type. Therefore, samples with high peaks in the T2 spectrum have large porosity, and multiple peaks or broad peak features represent diverse pore structures [39]. During low-field LFNMR experiments, according to Coates et al. [40], the lateral relaxation characteristics of fluids in porous media can be expressed by the following mathematical equation:
1 T = 1 T 2 = ρ 2 S V
where ρ2 is the surface relaxation rate, μm/ms; S is the pore surface area, μm2; and V is the pore volume, μm3.

5.3.1. Low-Field Nuclear Magnetic Resonance Porosity

The results of LFNMR porosity experiments conducted on 15 hydrocarbon source rock samples from the HN-1 well in the study area (Table 2) indicate that the porosity (%) of limestone samples ranges from 1.55 to 2.19, averaging at 1.88%; the porosity (%) of sandstone samples ranges from 1.92 to 4.21, averaging at 3.02%; and the porosity (%) of mudstone samples ranges from 1.03 to 2.77, averaging at 2.01%. Combining these findings with the rock porosity analysis obtained through high-pressure mercury injection, which yields an average porosity of 1.11% for limestone, 2.91% for sandstone, and 1.92% for mudstone, it can be clearly deduced from the integrated results of both the LFNMR and high-pressure mercury injection methods that the porosity distribution patterns among different rock types exhibit a high degree of consistency. Specifically, sandstone samples generally have the highest porosity, followed by mudstone samples, while limestone samples have the lowest porosity. This discovery provides critical insights into the reservoir properties and pore structure characteristics of hydrocarbon source rocks in the study area.

5.3.2. Pore Size Distribution

Figure 10a presents the LFNMR analysis results for six representative rock samples (L3, L4, S1, S3, M2, and M3). The T2 spectrum characteristic maps of these samples were characterized using LFNMR, and the study found that the pore distribution patterns obtained were consistent with those obtained from high-pressure mercury injection tests. The sandstone types exhibited strong signal intensity across different relaxation time periods and had broader T2 spectra, indicating good pore structure and connectivity in sandstone. For limestone, the spectrum relaxation time of L4 is approximately 0.01 ms, with a right peak roughly located between 1 and 10 ms and a maximum relaxation time of 500 to 1000 ms. The T2 spectrum peak shape is a bimodal type dominated by the left peak, with distinct wave troughs, inflection points, and other features, suggesting a tendency for uniform pore distribution. Pores of various diameters are developed, with a wide range of pore sizes, primarily micropores and mesopores, along with a small number of macropores [23,41]. This is consistent with the LFNMR characteristics of the L1 sample. L3 has a smaller amplitude and a maximum relaxation time of less than 1000 ms. The T2 spectrum peak shape can be regarded as a left-converging unimodal type, indicating a narrow range of pore size distribution, primarily micropores, with a small number of mesopores and macropores developed. The signal intensity and T2 spectrum width of limestone types do not perform well, which is consistent with the LFNMR characteristics of the L2 and L5 samples. For sandstone, the spectra of both S1 and S3 are bimodal types dominated by the left peak, with obvious wave troughs and inflection points, indicating a tendency for uniform pore distribution. Pores of different levels are continuously and excessively developed, primarily micropores and mesopores, with a small number of macropores. This is consistent with the LFNMR characteristics of the S2 and S4 samples. Additionally, the good signal intensity across different relaxation time periods and the broader T2 spectrum of sandstone types indicate their superior pore structure and connectivity. For mudstone, the spectra of both M2 and M3 are bimodal types dominated by the left peak, sharing features similar to those of the aforementioned sandstone bimodal types. However, in terms of the signal intensity range across different relaxation time periods and the width of the T2 spectrum, M3 performs most prominently among the 6 samples, while M2 has a lower signal intensity range and T2 spectrum width, indicating uneven pore structure distribution and connectivity within mudstone types.
The characterization of the full pore size distribution of rock samples can be achieved using LFNMR experimental methods [42,43,44]. From Equation (2), it can be seen that there is a certain correlation between LFNMR T2 parameters and pore structure parameters, and ρ2 is an established constant in a single sample; then, the LFNMR T2 spectra can be transformed into pore size distribution curves after the conversion relationship between T2 and (S/V) has been obtained using other experimental or mathematical methods. Based on previous research methods [42,43,44], Equation (2) is deformed as
1 T 2 = ρ 2 F S r
where r is the pore radius (ratio of pore surface area to pore volume), μm; and FS is the pore shape factor. It is usually considered that the pores in shale are mostly cylindrical, and FS can be taken as 2 [43,44]. According to the study of Sonddergeld et al. [45] for the surface relaxation rate of shale, ρ2 can be taken as 0.05 μm/ms. Therefore, Equation (4) can be further transformed into
r = T 2 10
Equation (4) is utilized to calculate the pore size distribution for the six rock samples (Figure 10b). Except for S3, the pore diameters of the remaining samples are mainly distributed within the range of 0 to 300 nm, with peak pore diameters primarily within 1 to 100 nm, indicating that the samples are dominated by nanoscale pores. Based on previous classifications of rock nanoscale pores [46], pores can be categorized as small pores (with diameters less than 10 nm), transitional pores (with diameters between 10 and 100 nm), mesopores (with diameters between 100 and 1000 nm), and macropores (with diameters of 1000 nm or greater). Figure 10b shows that the pore diameters of the rock samples are mainly distributed between 0 and 100 nm, belonging to the joint development of small and transitional pores. Additionally, the pore size distribution curve of S3 exhibits a broader peak shape and a larger peak pore diameter, suggesting that It contains a relatively higher abundance of macropores. However, the pores in S3 are still predominantly contributed by nanopores.

5.4. Pore Types and Their Distribution Characteristics

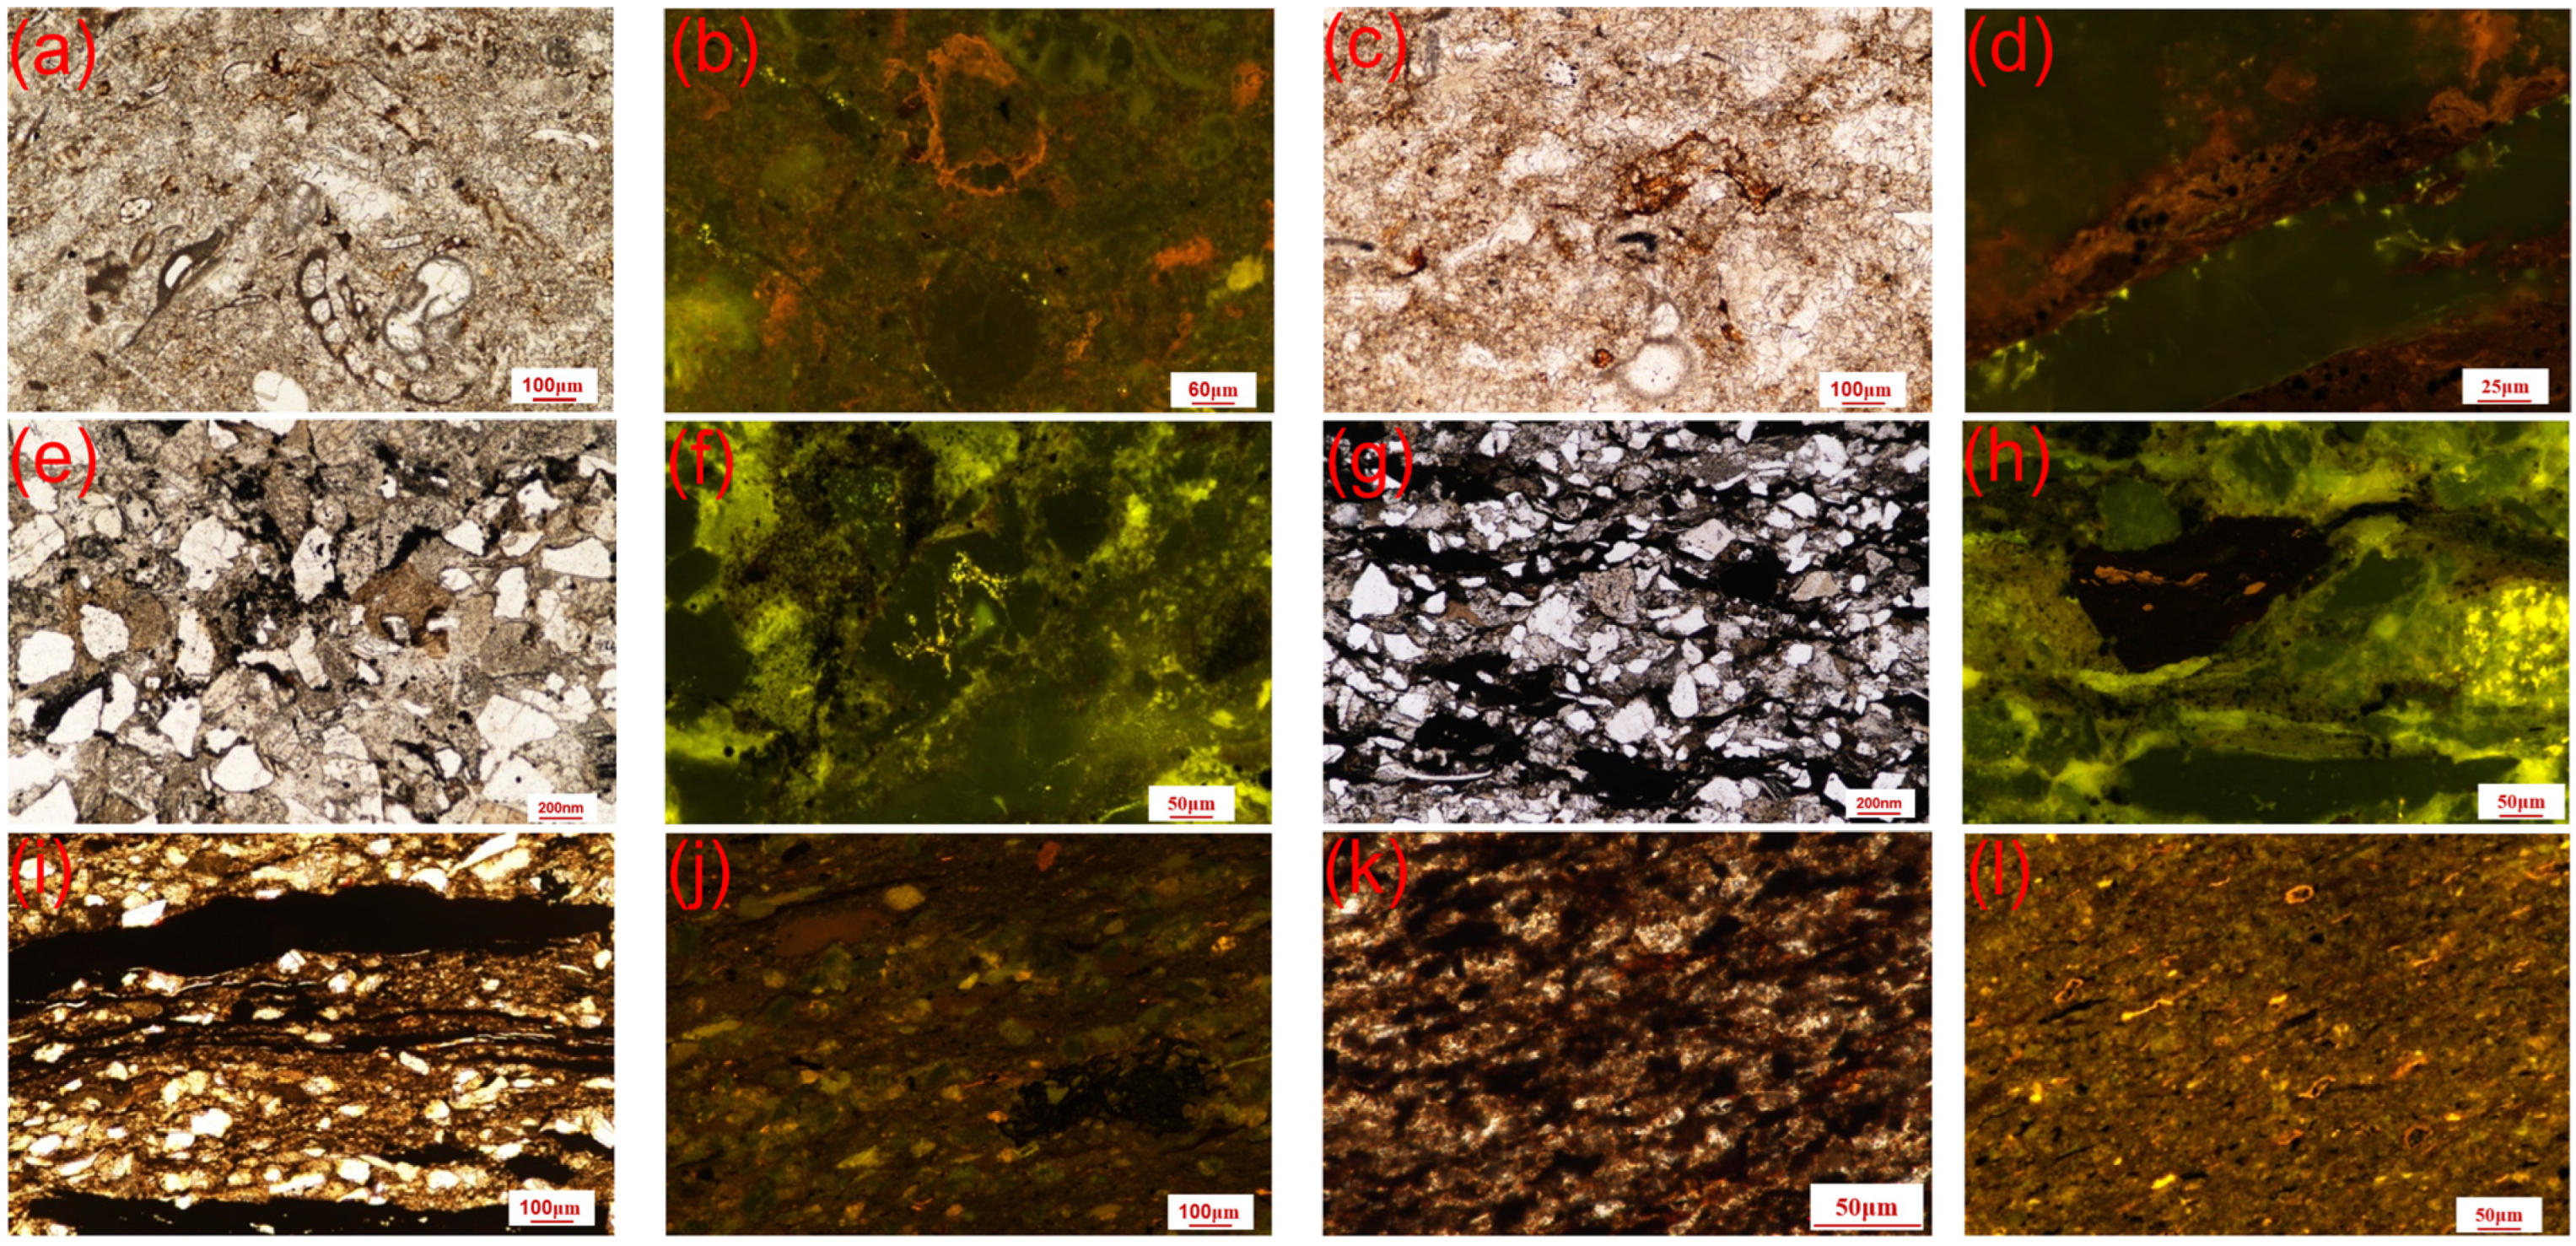
5.4.1. Organic Matter Type and Development of Micropores Based on POM

The observation conditions (both transmitted light and fluorescence) of the polarized optical microscope (POM) for the samples in this study of deep coal-measure hydrocarbon source rocks are shown in Figure 11. Under transmitted light, L1 exhibits a large amount of calcareous skeletal biodebris, with asphaltic organic matter in the limestone appearing as a brownish-yellow color (Figure 11a). In fluorescence mode, it maintains a brownish-yellow hue, with fractures and pores in the limestone filled with abundant brownish-yellow and brown asphaltic organic matter, along with a significant presence of pyrite (Figure 11b). Under transmitted light, L2 contains numerous fractures and pores filled with asphalt, and biodebris also shows significant development of asphaltic organic matter or organic inclusions (Figure 11c). In fluorescence, the asphaltic organic matter exhibits flow traces, and brighter yellow-green fluorescent organic inclusions are visible in calcite veins or fractures and pores of the limestone (Figure 11d). In transmitted light, fine sandstone S1 has grains with distinct angularities, poor rounding, and poor sorting, with calcite and muddy cementation, and pores filled with abundant asphalt (Figure 11e). The fluorescence grade indicates oil stain level, with pores showing a large amount of yellow fluorescent asphaltic organic matter, and quartz grain fractures containing numerous yellow-green fluorescent organic inclusions (Figure 11f). Under transmitted light, fine sandstone S2, containing argillaceous debris, is filled with solid asphalt and abundant organic matter, dominated by vitrinite, with a small amount of inertinite, and a relatively developed exinite content exceeding 5% (Figure 11g). In fluorescence, exinite is visible in the argillaceous debris, and bright yellow fluorescent organic inclusions are seen in quartz secondary enlargement rims or fractures (Figure 11h). Under transmitted light, dark mudstone M1 is characterized by a large amount of mineral asphalt matrix present in pores and fractures of the mudstone, with vitrinite distributed in banded patterns (Figure 11i). In fluorescence, it exhibits a weak yellow fluorescent matrix asphaltic body, containing numerous sporinite bodies and microspore bodies, along with inertinite macerals (Figure 11j). Under transmitted light, M2 mudstone appears brownish-red, with organic matter dominated by vitrinite and being non-fluorescent. Exinite is relatively well developed, typically around 5%, and is mainly composed of microspore bodies, with primarily sporinite bodies making up the remainder (Figure 11k). In fluorescence, it appears yellow, with a small amount of asphaltene bodies or alginite bodies present in pores and fractures of the mudstone, and pyrite filling on the surface or inside (Figure 11l).

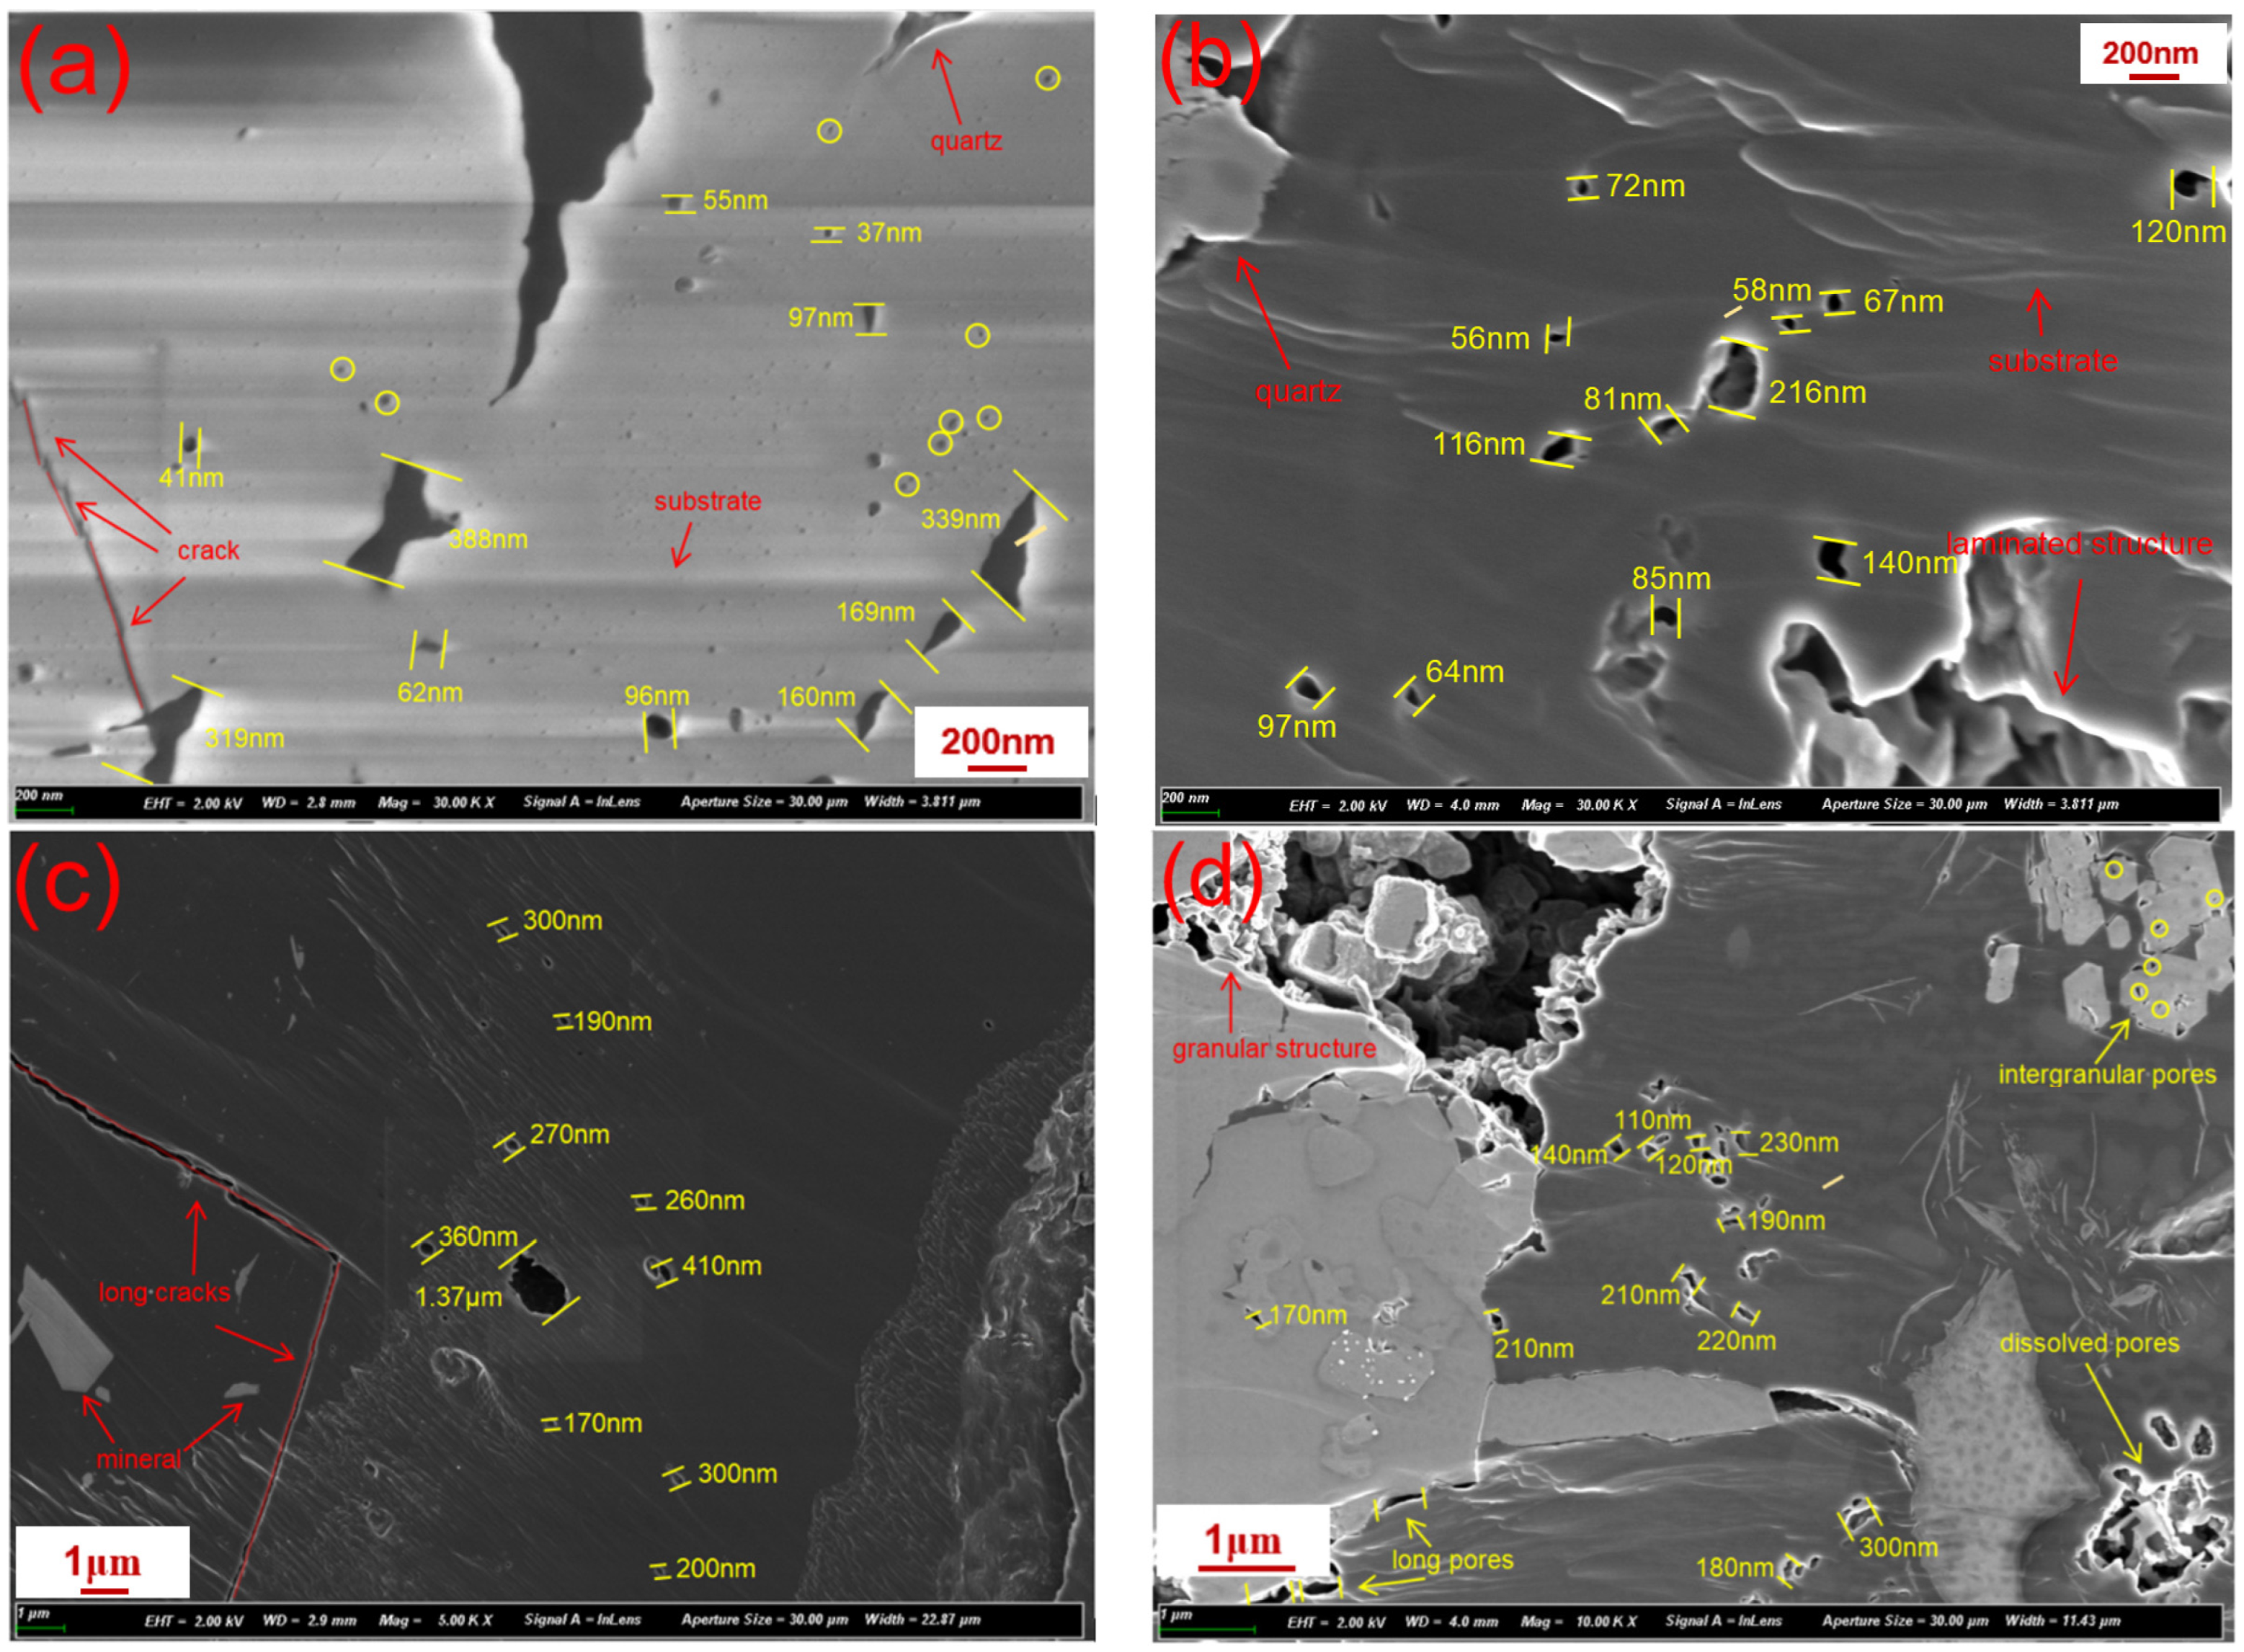
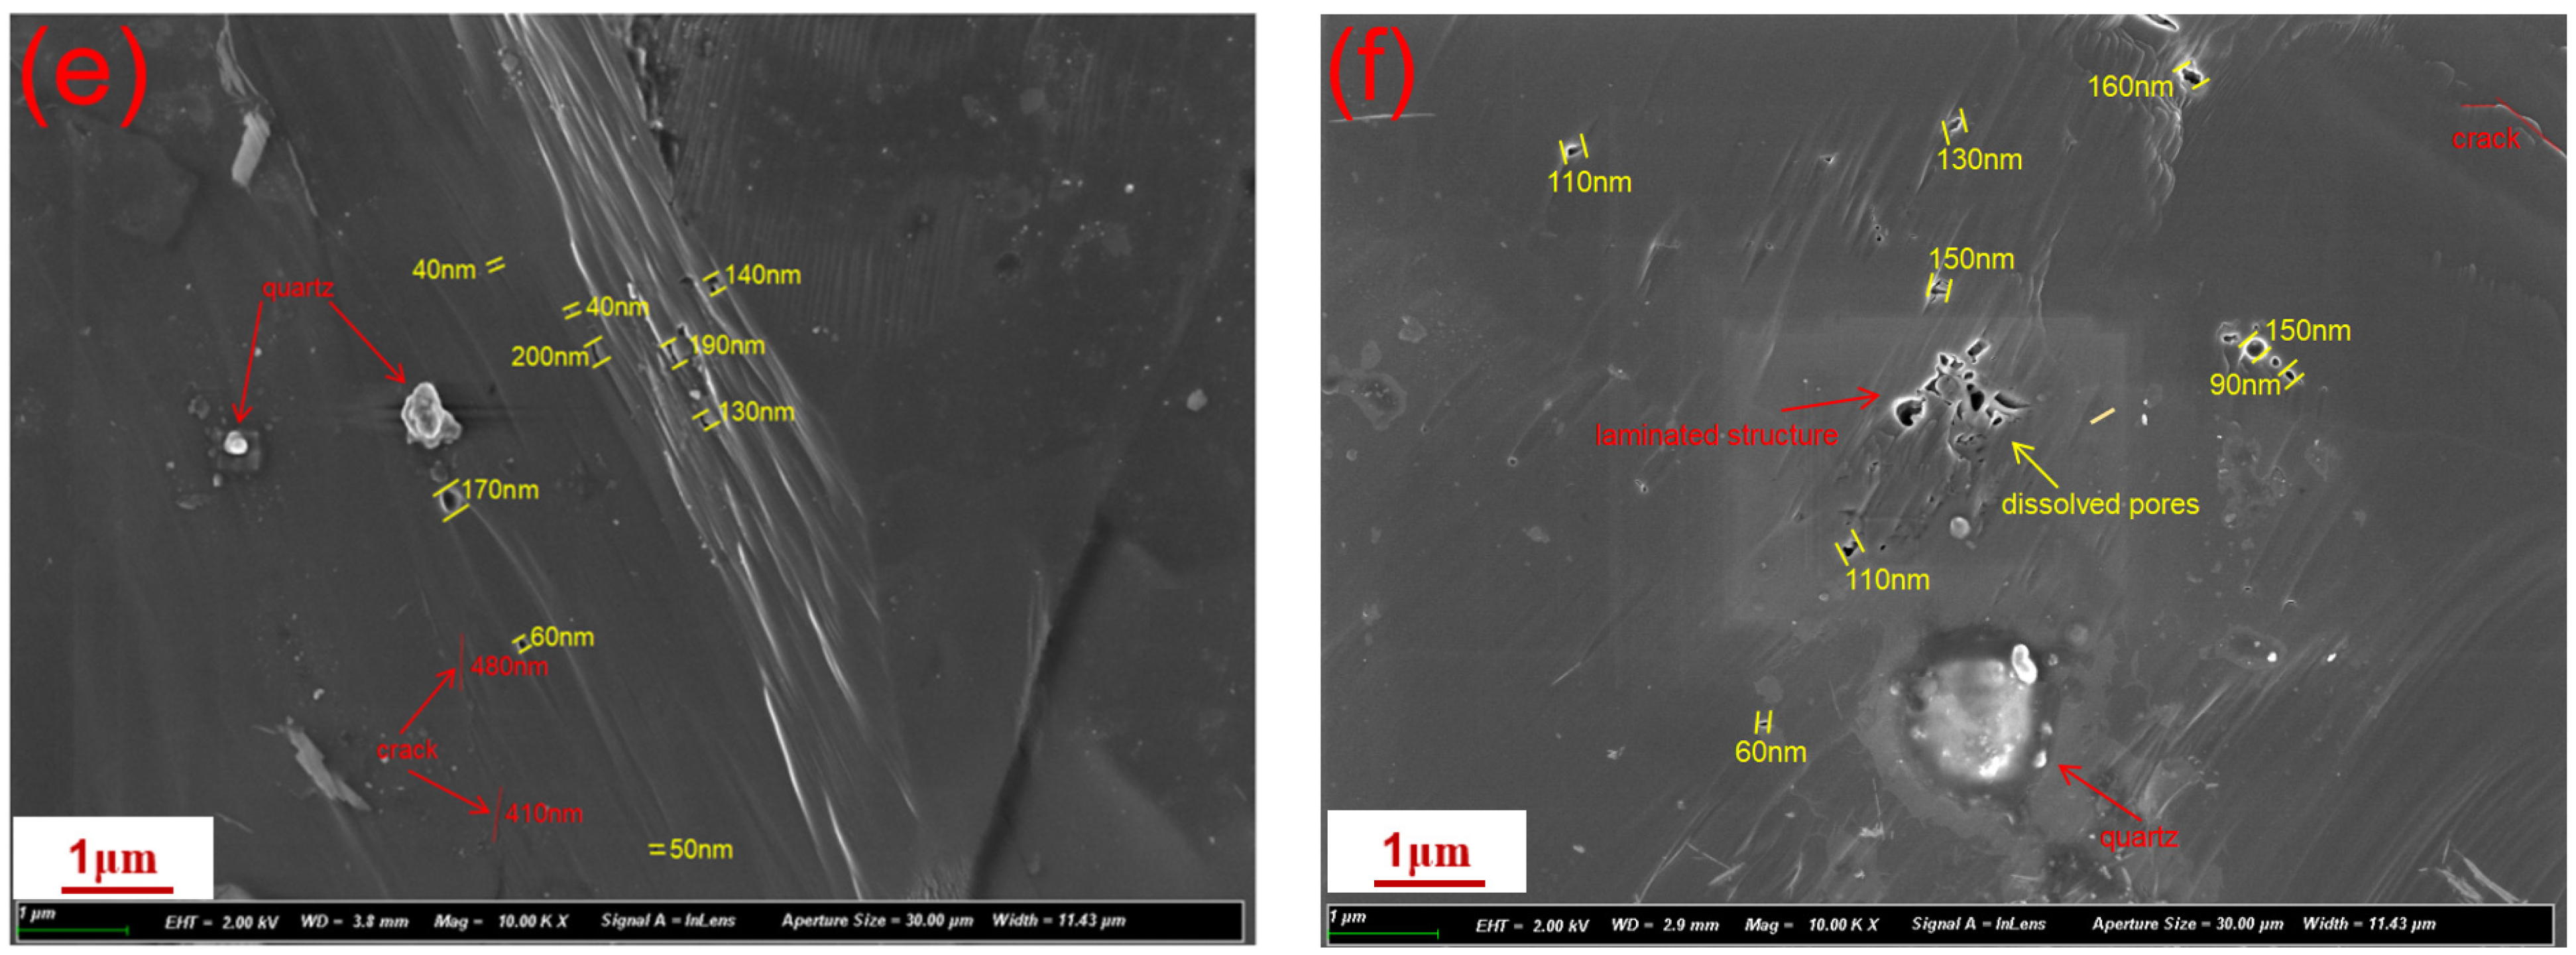
5.4.2. Surface Nanoscale Pore Fracture Characteristics Based on FESEM

The POM results were observed and analyzed, providing preliminary insights into the internal morphology and structural characteristics of various rock samples. However, due to limitations in instrument magnification, resolution, and manual secondary modifications, POM typically only reveals micrometer-scale observations and may also show artifact pores or fractures. Therefore, based on the POM observations, the samples underwent an Ar ion polishing treatment, followed by more detailed observations of typical sections of the rock samples using FESEM, enabling accurate characterization of the internal morphology and structure of different rock samples at the nanoscale. The FESEM experimental results obtained are shown in Figure 12. For the experimental results, Nano measurer software (version 1.2) was utilized to deeply interpret the image content and accurately measure the diameters of some typical pores or fractures depicted. L1 limestone exhibits long pores above 100 nm and dissolved pores below 100 nm (ranging from 339 nm to 37 nm), but the number of developed pores and the average pore diameter are inferior to those in sandstone. Besides quartz mineral filling on the surface, there are also obvious incompletely fractured fissures and a large number of matrix components. The fractures developed in L1 limestone are mainly above the nanoscale (Figure 12a). The pore development in L2 limestone is primarily below 100 nm (ranging from 216 nm to 56 nm) and relatively sparse. Additionally, no obvious fissures were found, but it exhibits a certain mineral composition and layered structure (Figure 12b). In S1 sandstone, no significant dissolved pore development is observed. Although micrometer-scale macropores are present, the pores in S1 are still mainly composed of nanopores. Furthermore, S1 sandstone exhibits two distinct fractures or fissures, possibly caused by deposition or tectonic movements, which are primarily micrometer-scale and serve as important channels for oil and gas migration in the formation, demonstrating a certain oil storage capacity of the sandstone (Figure 12c). The pore development in S2 sandstone is more mature, with highly developed interparticle pores not exceeding 100 nm in size and obviously dissolved pores ranging from nanometers to micrometers. Other pores are above 100 nm, along with a few micrometer-scale macropores (Figure 12d). Additionally, clay minerals within S2 sandstone mostly exhibit granular structures. No fractures develop in S2 sandstone, which may be influenced by the observation location; however, the presence of fractures to some degree in S2 sandstone can be inferred from the observations in S1 sandstone. M1 mudstone, besides quartz mineral filling and the development of nanoscale fractures, also exhibits more nanopore development, with pore sizes ranging from 200 nm to 40 nm (Figure 12e). In M2 mudstone, a large number of dissolved pores are found, with sizes at the micrometer scale and irregular shapes, spreading in a bead-like or floral pattern and exhibiting a layered structure. Besides the development of nanopores (ranging from 160 nm to 60 nm), there are also a large number of pores with even smaller diameters and a few inconspicuous fractures (Figure 12f).
Based on the observation results from FESEM, all hydrocarbon source rock samples exhibited highly developed nanopores at higher magnifications. Additionally, some rocks also developed fractures. In conjunction with related research, it is known that the degree of pore and fracture development can reflect the occurrence of unconventional natural gas in deep coal measures [47]. Therefore, this indicates that the HN-1 well in the Taiyuan Formation of the Late Carboniferous in the Huainan coalfield has favorable unconventional natural gas reservoir conditions. The FESEM results show that the overall pore development in sandstone is relatively good, along with the presence of micrometer-scale fractures, followed by mudstone. The pore development in limestone is poorer, which aligns with the experimental results from LFNMR and MICP. Consequently, the FESEM results also suggest that the combination of LFNMR and MICP is more conducive to characterizing the internal microstructure of different rocks, thereby providing theoretical guidance for revealing the adsorption, diffusion, and seepage mechanisms of unconventional natural gas in deep coal measures.

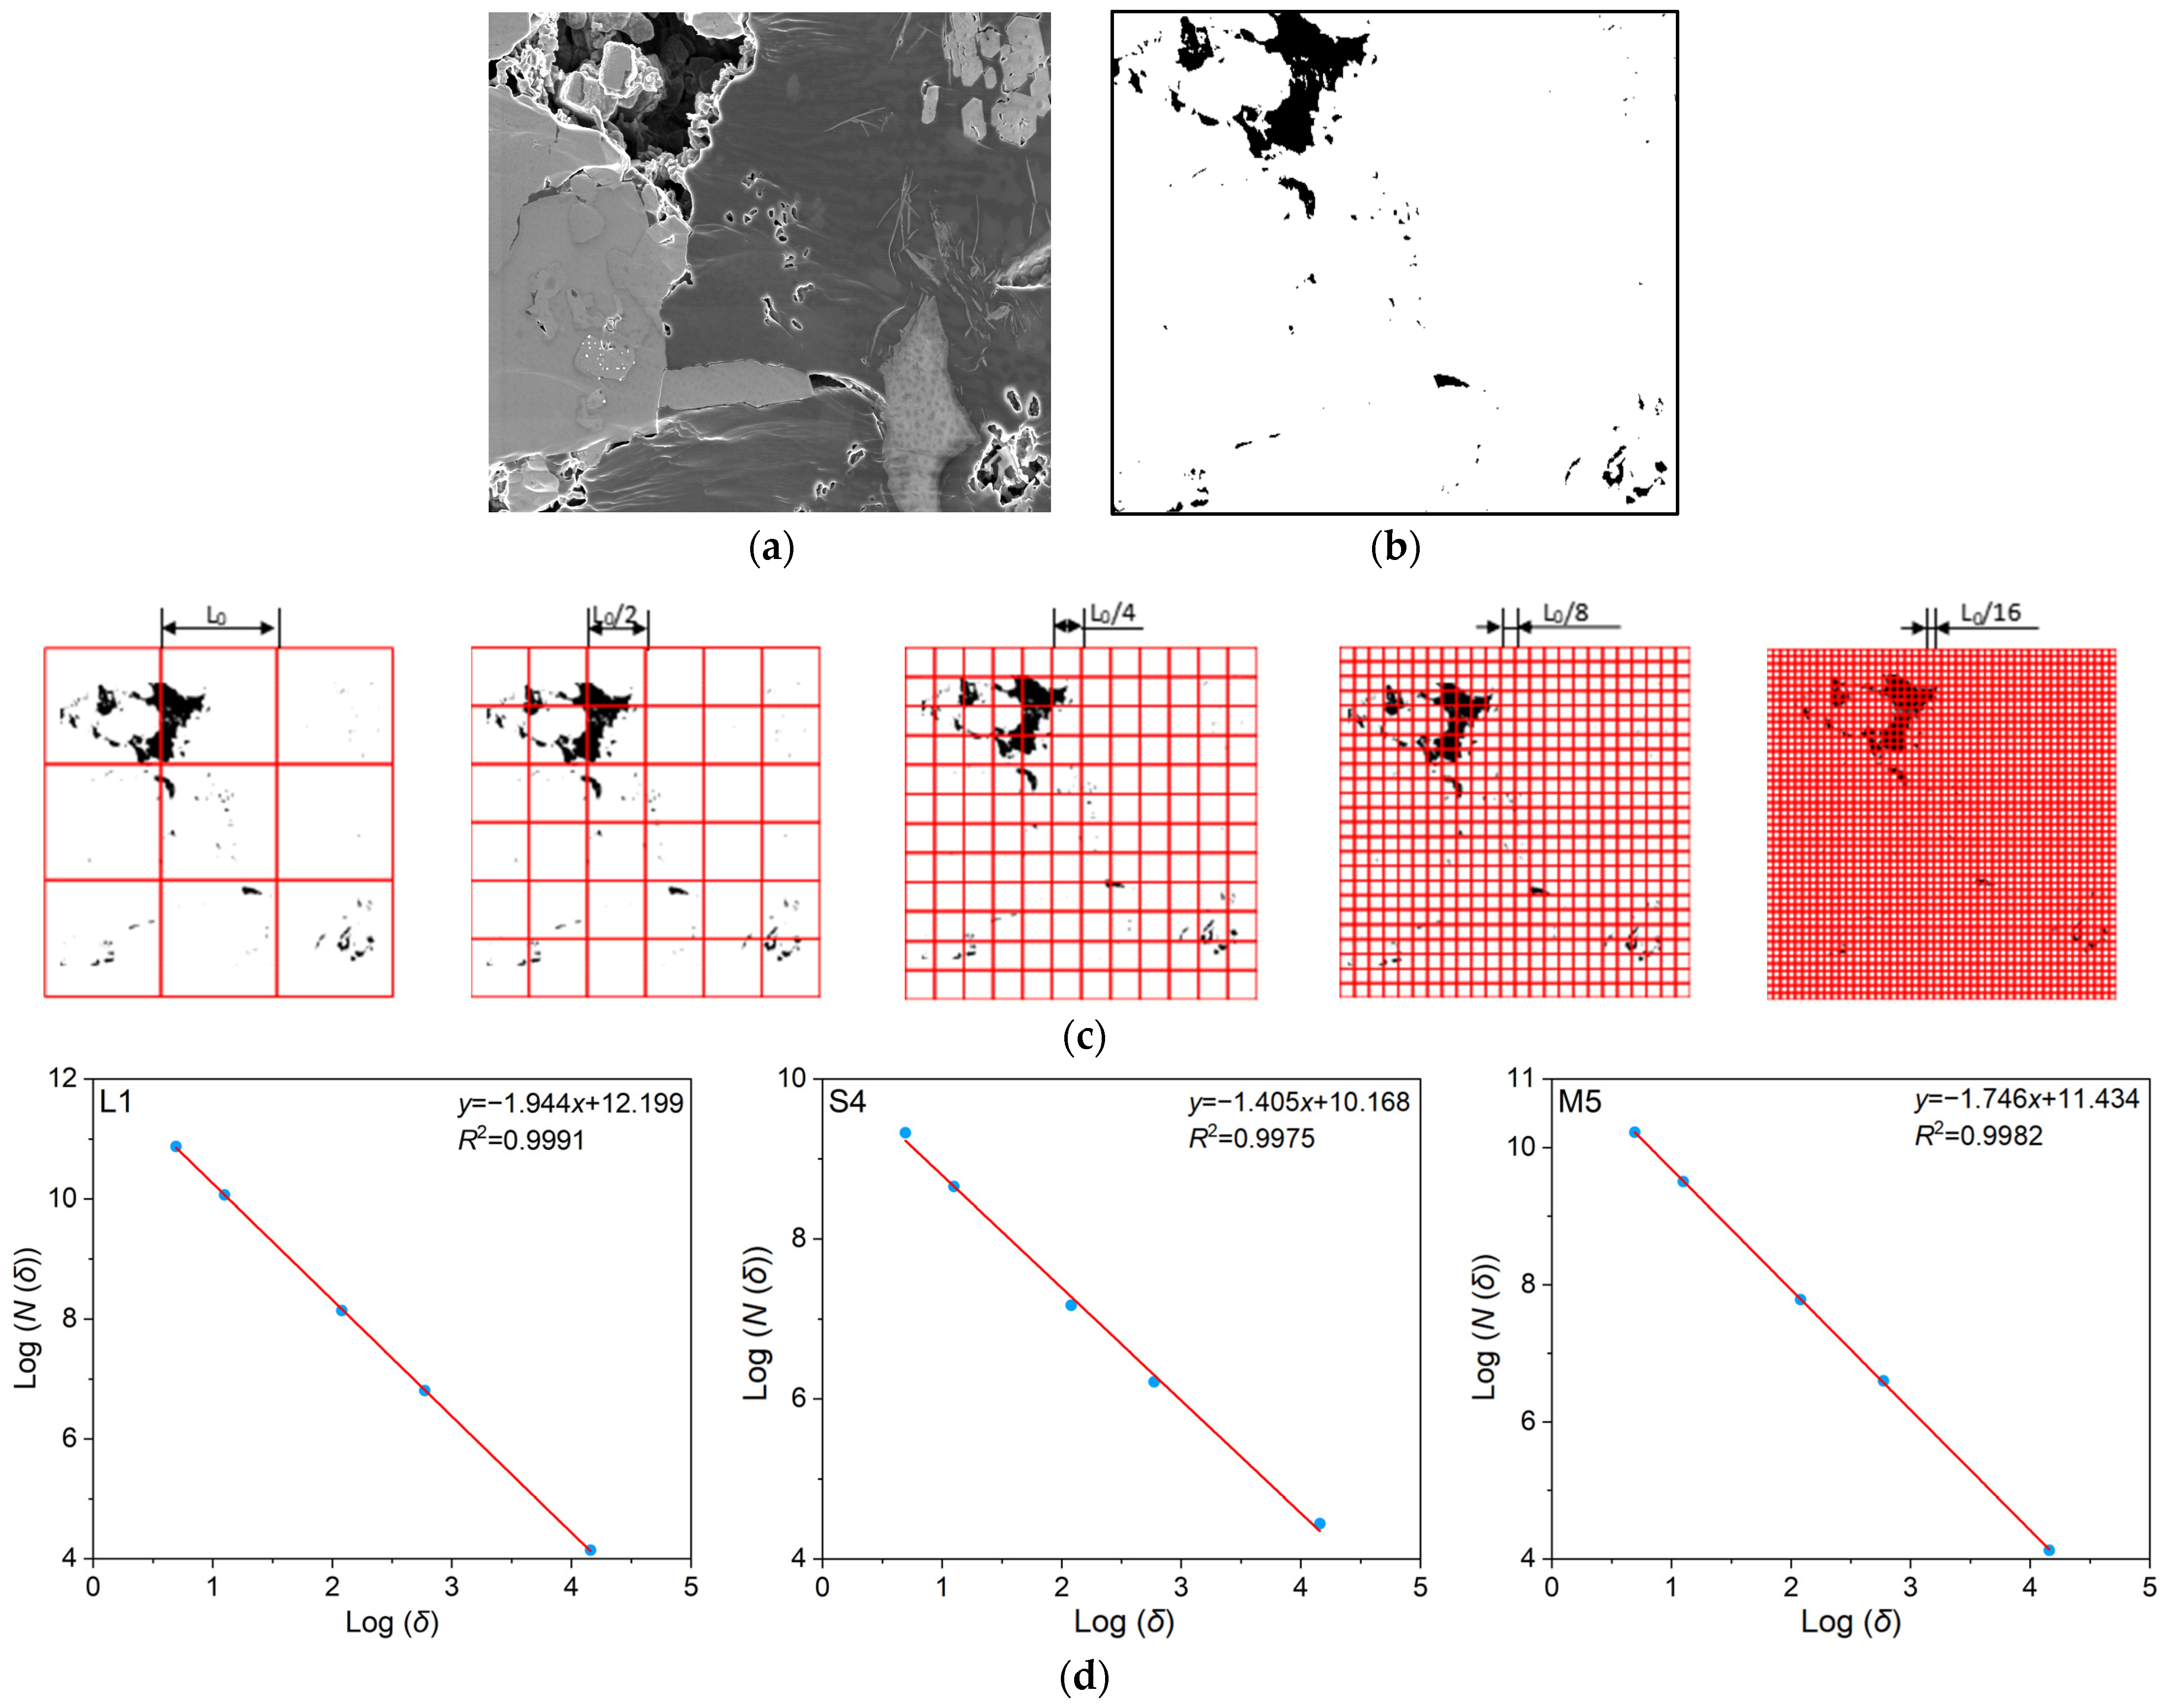
5.4.3. Fractal Dimension Calculation Based on FESEM

According to fractal theory, when the FESEM image captures the two-dimensional projection morphology of the material surface, the fractal dimension of the rock typically lies between 1 and 2 [48]. A higher fractal dimension indicates a more complex pore morphology and poorer permeability; conversely, a lower fractal dimension suggests simpler pore morphology, better permeability, and pore shapes closer to circularity [46]. In this study, based on the image results obtained from FESEM, to more clearly observe the nanoscale micropore structure of the samples, images at a resolution of 1 μm were selected for fractal dimension calculation for all 15 samples. Figure 13 illustrates the process using Sample S4 as an example. Based on the original FESEM image (Figure 13a), a suitable threshold Is selected to convert the grayscale Image Into a black-and-white binary image (Figure 13b). In determining the threshold, a method reported in the related literature is adopted, which involves comparing the original FESEM image with the generated pore extraction image to ascertain the most appropriate threshold. Ultimately, it is observed that a relatively ideal pore extraction effect can be achieved when the threshold is between 70 and 80; hence, 75 is selected as the threshold for this experiment. Subsequently, under five fractal scale conditions for surface cracks, δ = L0, L0/2, L0/4, L0/8, and L0/16, the sample surface is covered with corresponding grids, and the number of cracks N(δ) within each grid is calculated (Figure 13c). Given that the pore and crack sizes of the sample are nanoscale, combined with the size of the observed sample area, L0 is set to 4 μm. Formula 1 is then used to calculate the fractal dimension. In a logarithmic–logarithmic coordinate system, the least squares method is employed for regression analysis of the crack count N(δ) and grid side length δ (Figure 13d). The slope of the regression line represents the fractal dimension of the crack surface.
The fractal dimension calculation results for various types of rock samples are detailed in Table 3. As can be seen from Table 3, the fitting coefficients R2 are all greater than 0.99, indicating that the box-counting method is reasonable for calculating the pore fractals of coal surfaces. In terms of fractal dimensions, limestone samples range from 1.796 to 1.990, with an average of 1.913; sandstone samples range from 1.341 to 1.769, with an average of 1.467; and mudstone samples range from 1.568 to 1.972, with an average of 1.799. The fractal dimension results suggest that sandstone samples have the smallest fractal dimension, implying a more uniform pore structure distribution, relatively better connectivity and permeability, and thus favorable reservoir properties, followed by mudstone. These fractal dimension results are consistent with previous research conclusions [21] and also align with the results obtained from the MICP and LFNMR experiments conducted in this study.

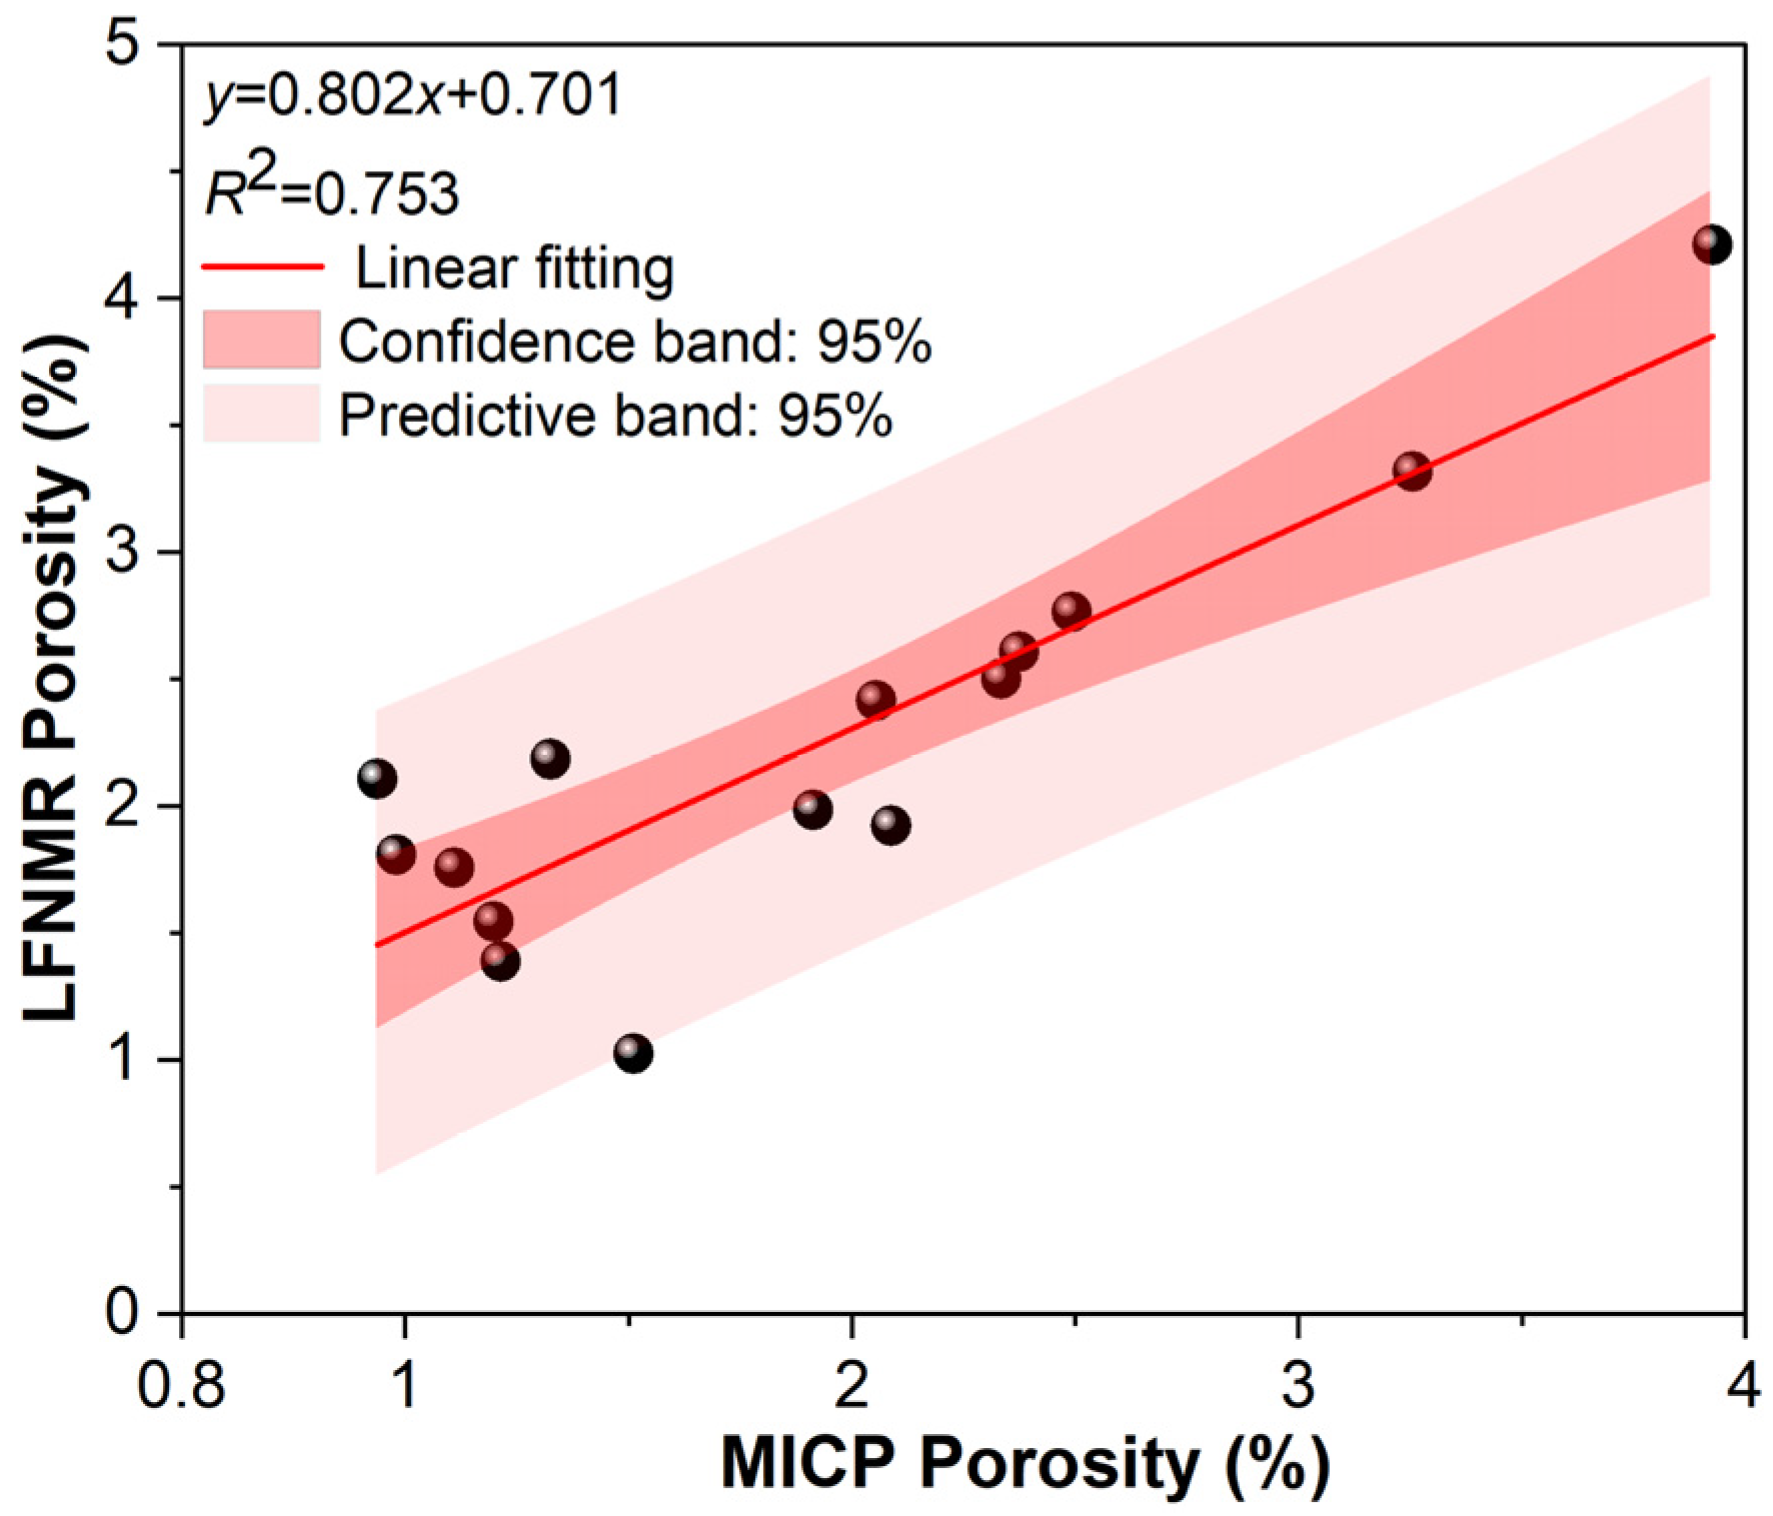
5.5. Differences Between MICP and LFNMR Porosity

In this study, two characterization techniques, MICP and LFNMR, were employed to test and analyze the porosity of 15 samples. While both methods can effectively reveal the pore structure characteristics of the materials, the experimental results showed that there were certain discrepancies in the specific porosity values obtained through MICP and LFNMR. To investigate the overall difference between these two methods in assessing rock porosity, further analyses using the T-test (with a significance level of 0.05 for the t-value) and correlation tests were conducted to determine whether there were statistically significant differences in porosity between the three different types of rocks tested under MICP and LFNMR conditions (Figure 14).
According to Figure 14, the porosity of the three types of rocks studied exhibited distinct characteristics when measured using MICP and LFNMR, indicating that the same sample may yield different experimental results when tested using different methods. As shown in Figure 15, the porosity of rocks obtained through high-pressure mercury injection has good applicability to LFNMR. Combining the information from Figure 14, it is necessary to effectively assess the pore diameter size of the samples to enhance the accuracy of the LFNMR analysis results.
As shown in Figure 3, MICP primarily characterizes pore sizes larger than 50 nm and may not provide accurate representations of smaller pores [47,49]. In contrast, LFNMR characterization covers a pore size ranging from 2 nm to 1000 nm, offering advantages in representing both larger and smaller pores [26,50]. Therefore, it is expected that the average porosity of the different types of rock samples tested using LFNMR in this study is generally higher than that tested using MICP. Furthermore, the experimental results indicate that sandstone has the largest overall pore radius, followed by mudstone, and limestone has the smallest. This characteristic results in relatively smaller porosity values when MICP is used to characterize limestone samples, leading to the largest difference in the average porosity between MICP and LFNMR among the three types of rock samples for limestone, while the difference is the smallest for sandstone.
LFNMR and MICP cover pore size ranges of 2–1000 nm and >50 nm, respectively, and the data from these two methods essentially represent complementary subsets of the same pore system. The geometric mean method integrates the advantages of LFNMR (sensitive to small pores) and MICP (sensitive to large pores) through the nature of mathematical constraints, thus providing a more comprehensive characterization of pore structure. Furthermore, for samples with large data spans (e.g., S4 with an LFNMR value of 4.21% and an MICP value of 3.93%), the geometric mean method can effectively mitigate the influence of extreme values. In summary, this study adopts the algorithm theory of the geometric mean to obtain reasonable values for rock porosity based on both the MICP and LFNMR methods (see Table 4).

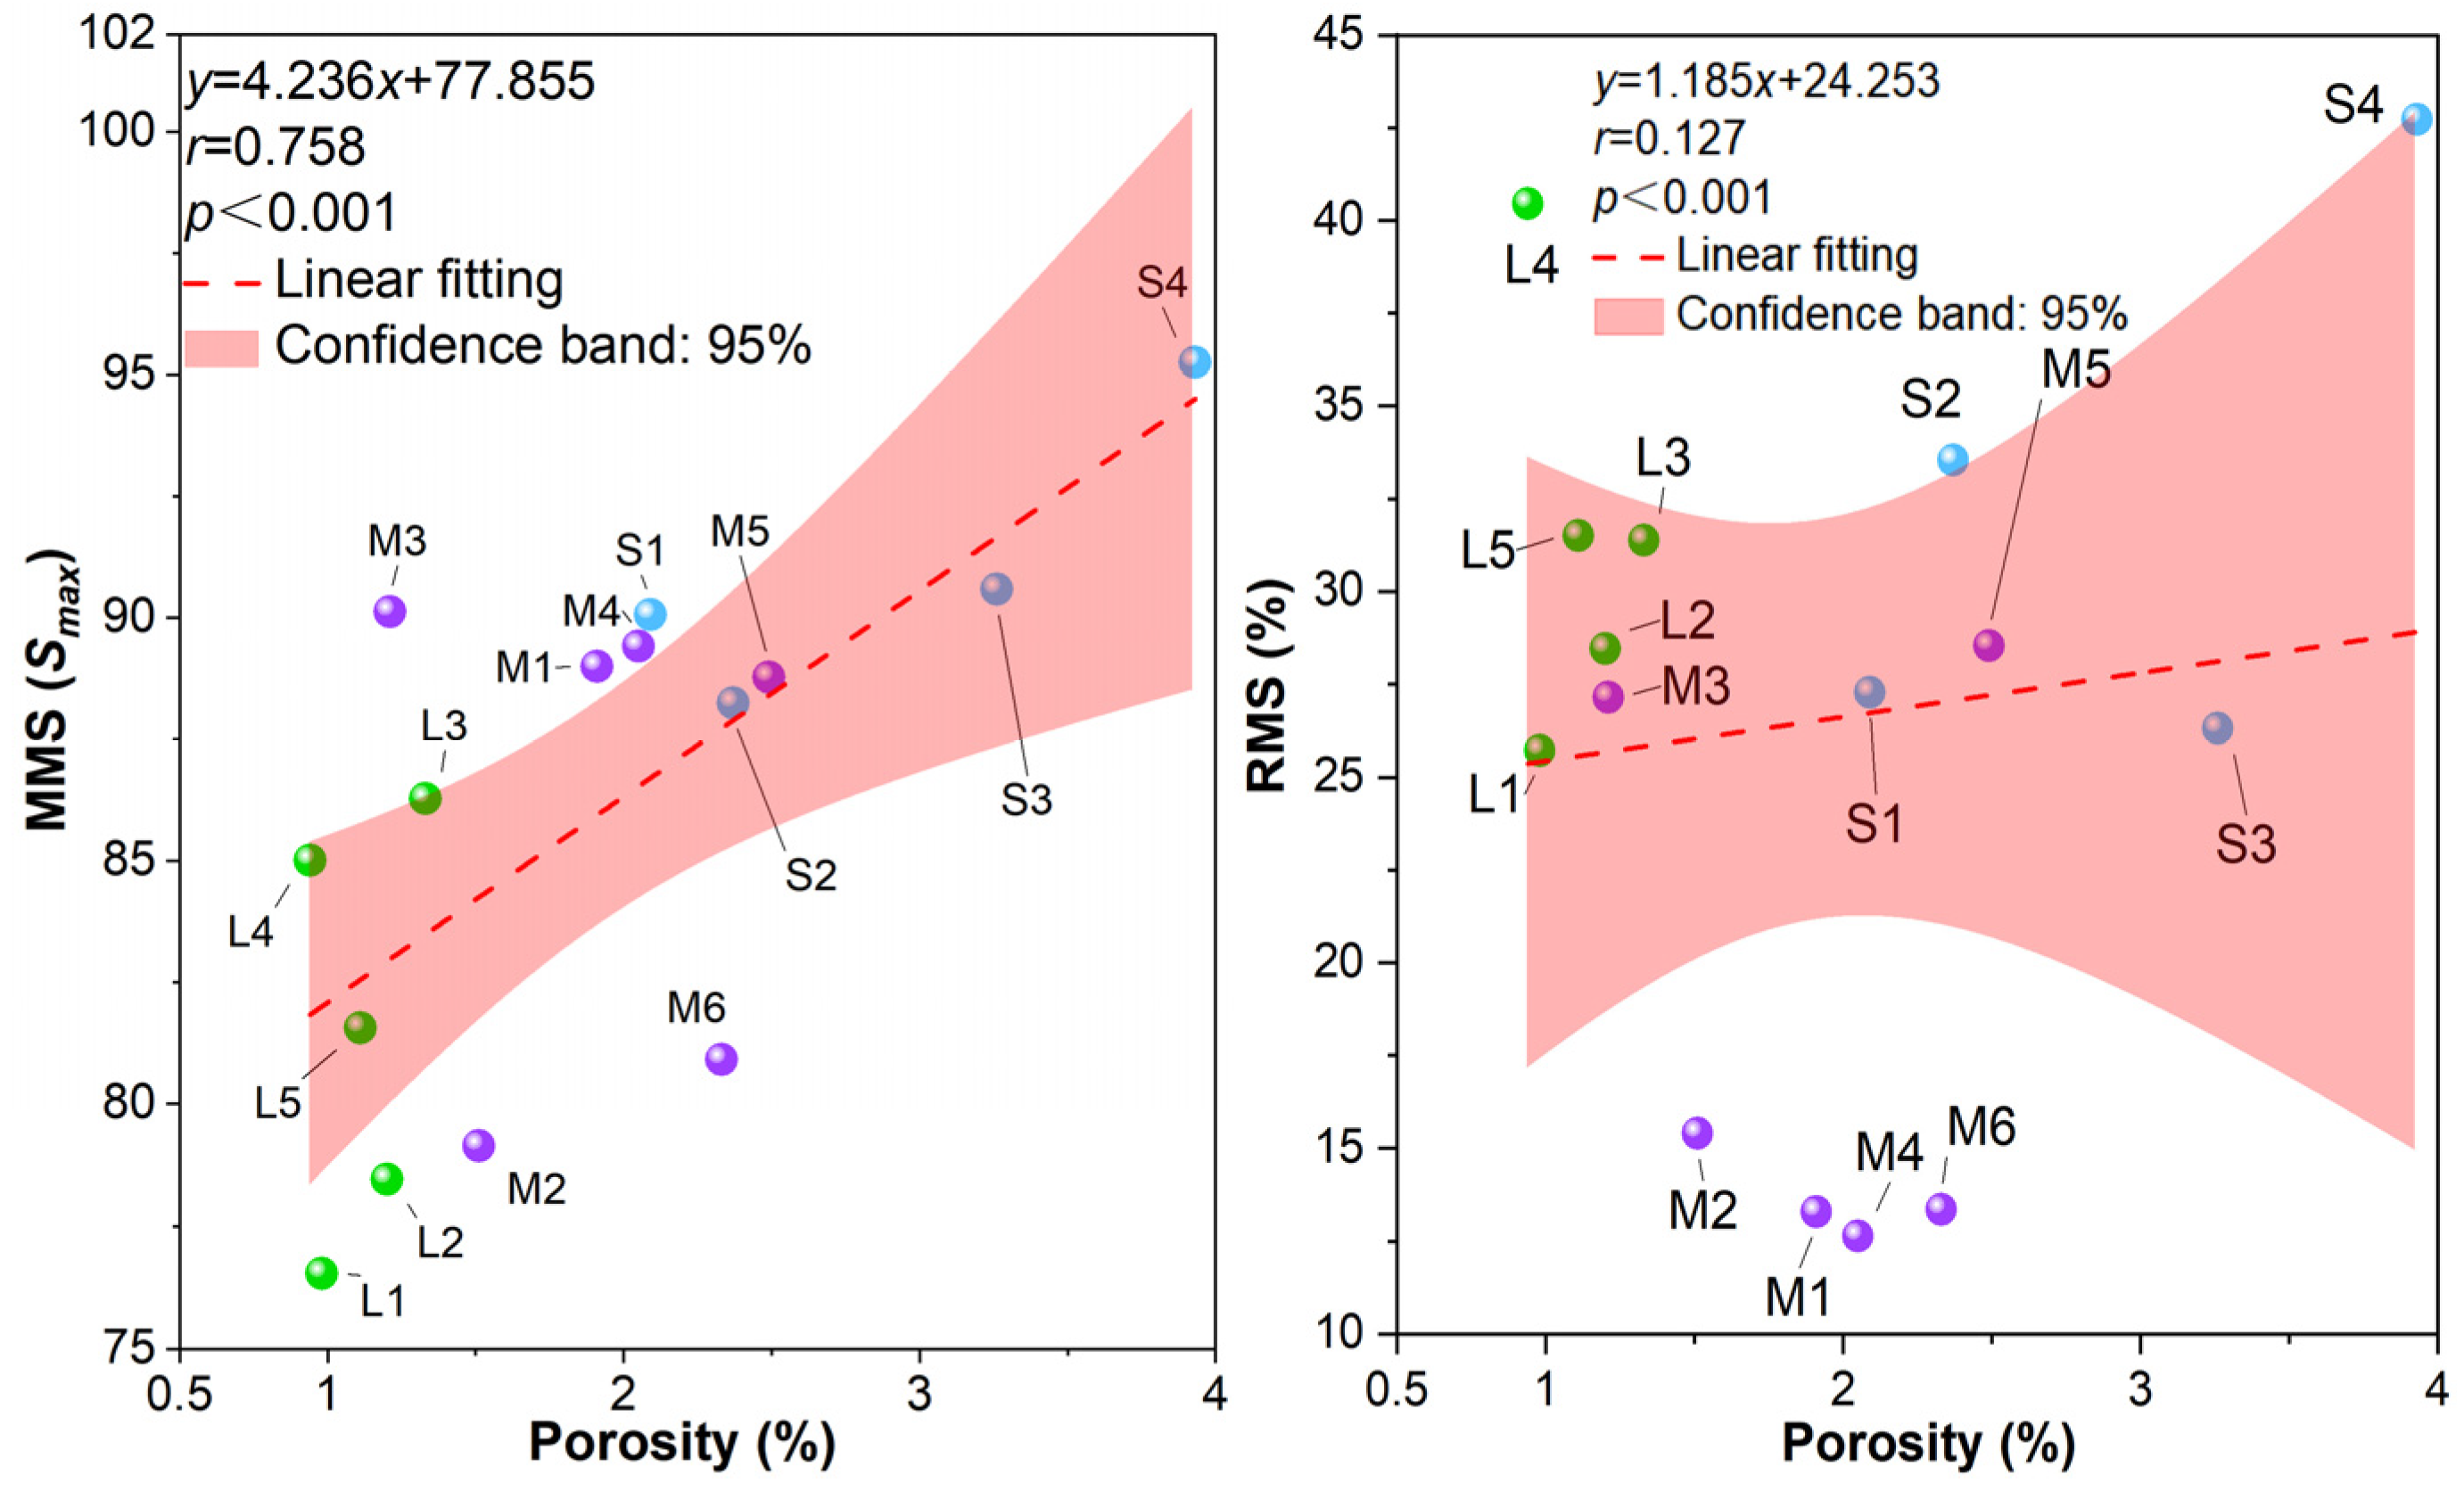
5.6. Relationship Between FESEM Fractal Dimension and Reservoir Physical Properties

Porosity and permeability are crucial parameters for evaluating reservoir physical properties [51]. Exploring the correlation between FESEM fractal dimension and reservoir physical properties holds significant geological importance. For rock reservoirs, the development of pore structures can enhance reservoir porosity, with large-pore structures effectively increasing porosity, while small-pore structures have a relatively weaker impact on porosity. A higher fractal dimension of a sample indicates a more complex pore structure and a larger pore-specific surface area [52]. In this study, the increase in fractal dimension D is primarily attributed to the rise in the number of nanoscale pores. Consequently, as shown in Figure 16, a negative correlation is observed between fractal dimension D and porosity. This finding suggests that FESEM fractal characteristics significantly influence the complexity of the micropore structure in source rocks. Lower displacement pressures are indicative of good permeability and excellent pore structure, whereas higher displacement pressures imply poorer permeability and worse pore structure. Figure 16 also reveals a positive correlation between fractal dimension D and displacement pressure. In summary, the FESEM fractal dimension exhibits a good correlation with porosity and permeability in source rock reservoirs, indicating that it can serve as an important parameter for evaluating the physical properties of source rock reservoirs.

6. Outlook

This paper systematically combines three techniques (MICP, LFNMR, and FESEM) for the first time to characterize the pore structure and fracture features of source rocks (including limestone, mudstone, and sandstone) from the Late Carboniferous Taiyuan Formation in Huainan on a multi-scale and multi-dimensional basis. This study achieves a full-scale pore structure analysis from macro to micro scales, revealing the differences in pore structures among different lithologies and their impacts on reservoir properties. It provides a new technical pathway for the evaluation of unconventional natural gas reservoirs in coal measures and holds significant theoretical value and scientific importance. From this study, it can be observed that MICP, LFNMR, and FESEM yielded abundant experimental results and new discoveries in the characterization of rock pore and fracture structures. However, it is worth noting, with slight regret, that this research only conducted quantitative characterization and differentiated interpretation of the pore and fracture structures of source rocks from a single well (HN-1 well), making it difficult to comprehensively reflect the regional variability and general laws of the pore structures of source rocks from the Taiyuan Formation of the Late Carboniferous in the Huainan coalfield. Additionally, the study overlooked the importance of establishing a unified multi-scale pore structure model for different types of source rocks. Based on current research progress, the authors believe that the following three directions deserve further exploration:
(1)
Deepening the understanding of pore structures and optimizing their practical applications, including expanding the sample size and regional research scope to cover different geological settings to enhance the universality of the data;
(2)
Developing high-resolution multi-scale characterization techniques, such as Nano-CT and FIB-SEM, combined with in situ experiments to simulate dynamic changes in formation environments for multi-factor coupling analysis; at the same time, establishing a comprehensive geological–geochemical–pore evolution model by comprehensively considering mineral composition, organic matter types, and fluid–rock interactions;
(3)
Utilizing experimental data to construct numerical simulation and prediction models, such as pore network models or machine learning algorithms, combining microscopic pore characteristics with macroscopic reservoir properties to optimize unconventional natural gas development strategies and assess the impact of pore structures on efficient unconventional natural gas development.

7. Conclusions

This study employed multiple technical approaches, including MICP, LFNMR, FESEM, and POM, and constructed double logarithmic scatter plots. By integrating fractal theory, the fractal dimensions of 15 samples were calculated, systematically analyzing the pore–fracture structure and fractal characteristics of different lithologies within the deep Taiyuan Formation of the HN-1 well. The results show that sandstone possesses relatively coarse throat passages, good permeability, as well as excellent pore structure, exhibiting the best fluid flow performance. Limestone displays uneven pore development, whereas mudstone falls between these two extremes. Furthermore, the organic matter in the rocks exhibits varying developmental characteristics, significantly impacting the pore structure. The observation results from FESEM further confirm the highly developed porosity and excellent connectivity within the sandstone. Additionally, the fractal dimension analysis using FESEM indicates that the sandstone exhibits good fractal characteristics, validating its certain oil storage capacity.
(1)
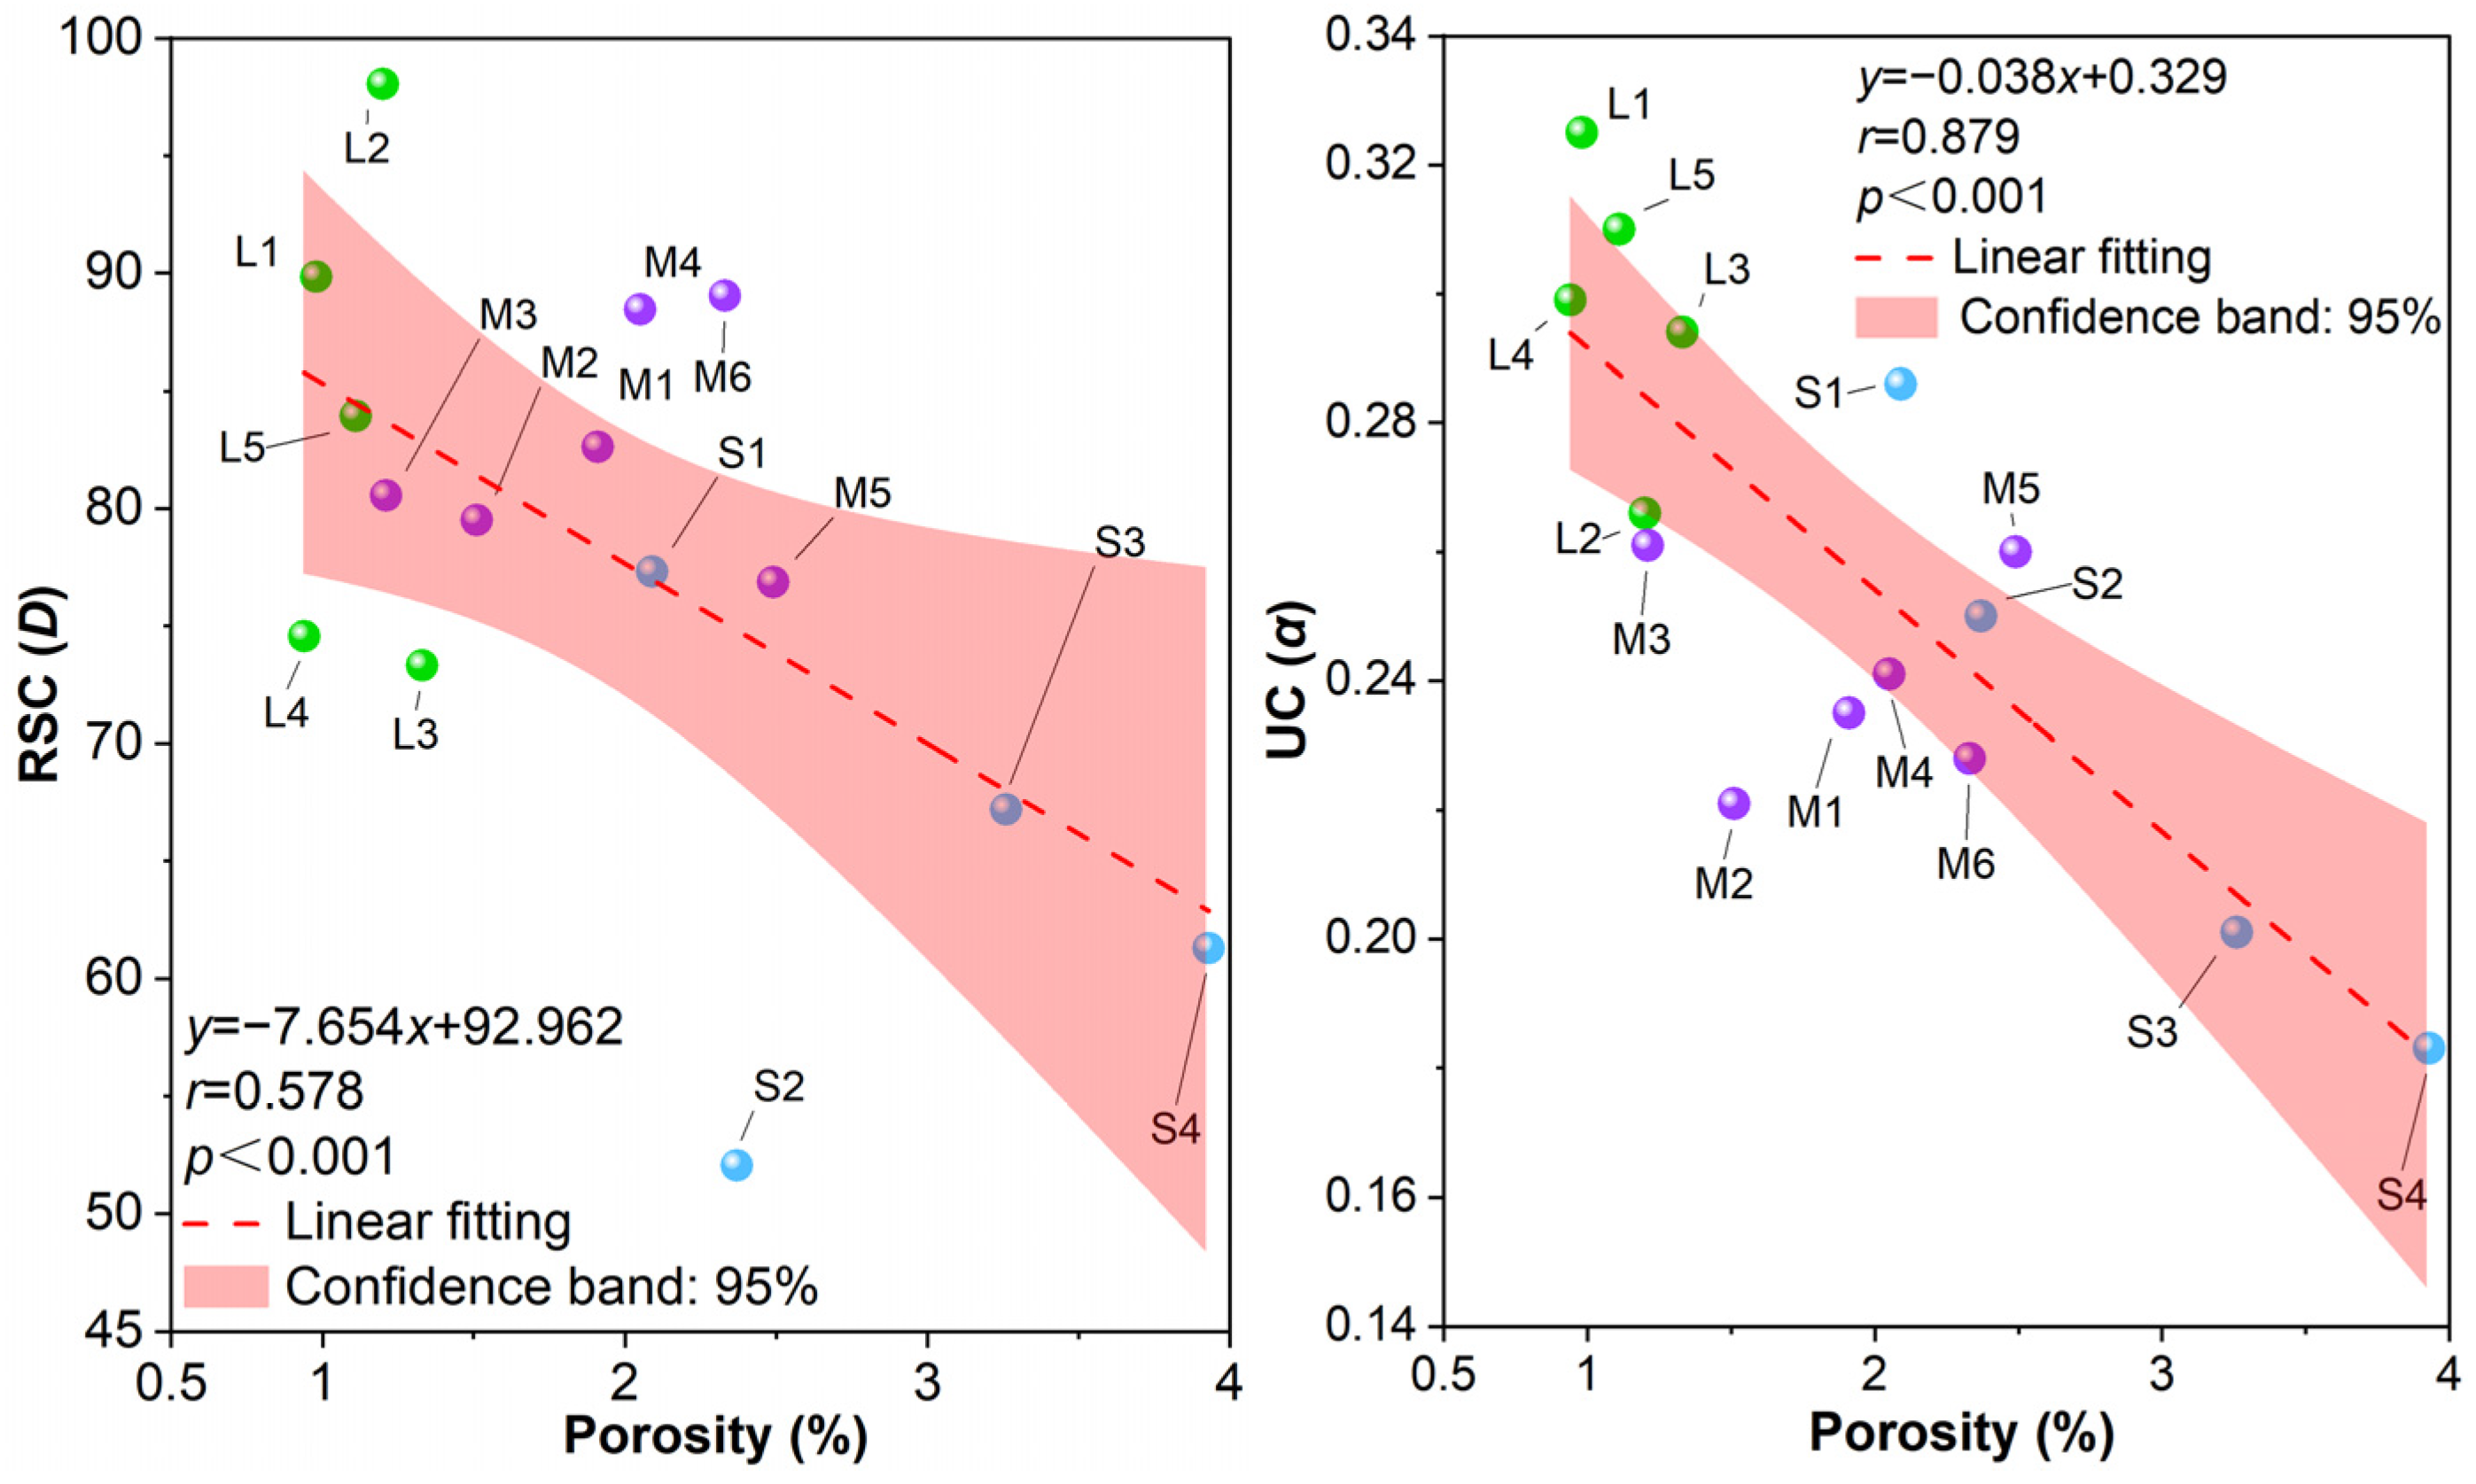
The MICP test results indicate that the displacement pressures for limestone, sandstone, and mudstone in the study area are 17.22 MPa, 7.57 MPa, and 13.78 MPa, respectively. This suggests that sandstone has coarser pore throats, better permeability, and a superior pore structure. Sandstone exhibits the lowest mean D value (64.48), while the mean α values for the three rock types are similar (ranging from 0.2 to 0.3), indicating a uniform distribution of pore throats. The skewness of pore throats in all three rock types is less than 0, and the kurtosis is less than 1, presenting a negatively skewed, fine pore throat distribution with a flat kurtosis curve. Sandstone has an average Smax of 91.04 and a mercury withdrawal efficiency of 64.45%, indicating excellent connectivity and fluid flow properties, followed by mudstone. DP and α are negatively correlated with porosity, while Kp and Smax are positively correlated with porosity.
(2)
The T2 spectrum characteristic maps of six representative samples were characterized using LFNMR, and the study found that the pore distribution patterns were consistent with those obtained from MICP experiments, the signal intensity of sandstone types in different relaxation time segments was better, and the width of the T2 spectra was wider, which indicated that the sandstone types had better pore structure and connectivity. The T2 spectra of different rock types have the double-peak type with the left peak dominant, and the wave valley and inflection point are obvious, which indicates that the pore distribution tends to be uniform, and the pores of different diameters are developed with a wide range of pore diameters, among which micropores and mesopores are dominant, and a small number of macropores are developed at the same time. However, the spectra of the limestones do not show significant characteristics, which indicates that the pore development of limestones is not uniform.
(3)
The results of POM indicate that the rocks are predominantly characterized by organic matter development. Specifically, limestones are dominated by bituminous matter and organic inclusions, sandstones are primarily composed of vitrinite with a small amount of inertinite, and exhibit relatively developed exinite, while mudstones are mainly composed of vitrinite with well-developed exinite and some inertinite macerals. The FESEM results reveal that the pore development in limestones is mostly below 100 nm, with highly developed nanoscale pores in the matrix. Sandstones exhibit good and uniform pore development, with the emergence of microscale macropores; however, the pores in sandstones are still primarily composed of nanopores. Mudstone samples contain numerous pores dissolved in quartz minerals, ranging from nanoscale to microscale in size, with mostly irregular pore shapes. The degree of fracture development varies significantly among the three rock types, but sandstone fractures are dominated by macrofractures above the micron scale, demonstrating a certain oil storage capacity of the sandstone.
(4)
The MICP method mainly characterizes pore sizes larger than 50 nm and may not be accurate enough for smaller pores. In contrast, the LFNMR method mainly characterizes pore sizes from 2 nm to 1000 nm, which is advantageous for both large and small pores. This characteristic leads to the relatively small value of the MICP method in characterizing the porosity of limestone samples, which results in the largest difference between the pressed mercury method and the LFNMR method in the mean porosity values of limestone and the smallest difference in sandstone among the three types of rock samples.
(5)
The results of the fractal dimensions indicate that sandstone samples have the lowest fractal dimension, implying a more uniform pore structure distribution, better connectivity, and relatively higher permeability, thus exhibiting superior reservoir performance, followed by mudstone. These fractal dimension results are consistent with the experimental results obtained from the MICP and LFNMR conducted in this study. Additionally, there is a good correlation between the fractal dimensions derived from field emission scanning electron microscopy (FESEM) and the porosity and permeability of source rock reservoirs, suggesting that FESEM fractal dimensions can serve as an important parameter for evaluating the physical properties of source rock reservoirs.

Author Contributions

Conceptualization, D.W. and G.H.; methodology, D.W.; software, D.W.; validation, D.W. and L.Z.; formal analysis, L.Z.; investigation, G.H.; resources, D.W.; data curation, L.Z.; writing—original draft preparation, L.Z.; writing—review and editing, D.W.; visualization, D.W.; supervision, W.Z.; project administration, D.W.; funding acquisition, D.W. All authors have read and agreed to the published version of the manuscript.

Funding

This research was funded by the National Natural Science Foundation of China (grant number 41972170), the Anhui University of Architecture High-level Talent Introduction Program (grant number 2022QDZ22), and the Anhui Province Public Welfare Geological Work Program (grant number 2016-g-3-33).

Data Availability Statement

Data will be made available on request.

Conflicts of Interest

The authors declare no conflicts of interest.

References

  1. Yan, X.; Dai, C.; Wang, R.; Liu, H.; Meng, S.; Jin, X.; Wu, Y. Experimental study on countercurrent imbibition in tight oil reservoirs using nuclear magnetic resonance and AFM: Influence of liquid–liquid/solid interface characteristics. Fuel 2024, 358, 130026. [Google Scholar] [CrossRef]
  2. Liu, B.; Gao, S.; Mohammadian, E. Comprehensive outlook into critical roles of pressure, volume, and temperature (PVT) and phase behavior on the exploration and development of shale oil. Energy Fuels 2022, 36, 14534–14553. [Google Scholar] [CrossRef]
  3. Yuan, D.E.; Yan, D.T.; Tang, Y. Genesis of clay minerals in gravel reservoirs and their influence on reservoir quality—An example from the Triassic Baikouquan Formation in the western part of the Mahu Depression, Junggar Basin. J. Geol. 2024, 98, 3588–3600. [Google Scholar]
  4. Qin, Y.; Shen, J.; Shen, Y.L. Co-mining compatibility of stacked gas-bearing systems—A common geological problem in coal system “three gases” and deep coalbed methane mining. J. Coal 2016, 41, 14–23. [Google Scholar]
  5. Zhang, X.; Wei, B.; You, J.; Liu, J.; Wang, D.; Lu, J.; Tong, J. Characterizing pore-level oil mobilization processes in unconventional reservoirs assisted by state-of-the-art nuclear magnetic resonance technique. Energy 2021, 236, 121549. [Google Scholar] [CrossRef]
  6. Zhao, X.; Yang, Z.; Zhou, S.; Luo, Y.; Liu, X.; Zhang, Y.; Niu, Z. Research on characterization and heterogeneity of microscopic pore throat structures in tight oil reservoirs. ACS Omega 2021, 6, 24672–24682. [Google Scholar] [CrossRef]
  7. Du, S.; Shi, Y. Nanostructures in tight oil reservoirs: Multiple perspectives. Int. J. Hydrogen Energy 2024, 49, 884–896. [Google Scholar] [CrossRef]
  8. Davoodi Shadfar, S.; Al-Shargabi, M.; Wood, D.A.; Rukavishnikov, V.S.; Minaev, K.M. Experimental and field applications of nanotechnology for enhanced oil recovery purposes: A review. Fuel 2022, 324, 124669. [Google Scholar] [CrossRef]
  9. Wang, Y.; Liu, L.; Zheng, S.; Luo, Z.; Sheng, Y.; Wang, X. Full-scale pore structure and its controlling factors of the Wufeng-Longmaxi shale, southern Sichuan Basin, China: Implications for pore evolution of highly overmature marine shale. J. Nat. Gas Sci. Eng. 2019, 67, 134–146. [Google Scholar] [CrossRef]
  10. He, L.; Cao, J.; Lu, J.; Lin, B.; Lu, Y.; Shi, S.; Liu, M. Effect of microwave-assisted cyclic oxidation on the coal internal and surface structure based on NMR and AFM. Energy 2024, 288, 129872. [Google Scholar]
  11. Zeng, F.; Dong, C.; Lin, C.; Tian, S.; Wu, Y.; Lin, J.; Zhang, X. Pore structure characteristics of reservoirs of Xihu Sag in East China Sea Shelf Basin based on dual resolution X-ray computed tomography and their influence on permeability. Energy 2022, 239, 122386. [Google Scholar] [CrossRef]
  12. Shi, S.; He, J.; Zhang, X.; Yu, Z.; Wang, J.; Yang, T.; Wang, W. Pore structure evolution of tar-rich coal with temperature-pressure controlled simulation experiments. Fuel 2023, 354, 129298. [Google Scholar] [CrossRef]
  13. Zou, C.; Zhu, R.; Bai, B.; Yang, Z.; Wu, S.; Su, L.; Dong, D.; Li, X. The first discovery of nanopores in oil and gas reservoirs in China and its scientific value. Acta Petrol. Sin. 2011, 27, 1857–1864. [Google Scholar]
  14. Kirchofer, A.; Firouzi, M.; Psarras, P.; Wilcox, J. Modeling CO2 Transport and Sorption in Carbon Slit Pores. J. Phys. Chem. C 2017, 121, 21018–21028. [Google Scholar] [CrossRef]
  15. Bernard, S.; Wirth, R.; Schreiber, A. Formation of nanoporous pyrobitumen residues during maturation of the Barnett Shale (Fort Worth Basin). Int. J. Coal Geol. 2012, 103, 3–11. [Google Scholar] [CrossRef]
  16. Li, J.; Hu, L.; Jiang, W.; Cai, M.; He, J.; Wang, Q.; Li, D. Shale pore characteristics and their impact on the gas-bearing properties of the Longmaxi Formation in the Luzhou area. Sci. Rep. 2024, 14, 16896. [Google Scholar] [CrossRef]
  17. Jiang, Z.; Zhu, Y.; Li, P.; Wang, Y.; Xiang, J. Applicability of Nuclear Magnetic Resonance Experiment in Analyzing Pore and Fluid Distribution Characteristics of Tight Sandstone: A Case Study in the Julu Area, Bohai Bay Basin, China. ACS Omega 2023, 8, 43903–43919. [Google Scholar] [CrossRef] [PubMed]
  18. Yang, Q.; Xue, J.; Li, W.; Du, X.; Ma, Q.; Zhan, K.; Chen, Z. Comprehensive evaluation and interpretation of mercury intrusion porosimetry data of coals based on factal theory, Tait equation and matrix compressibility. Fuel 2021, 298, 120823. [Google Scholar] [CrossRef]
  19. Mandelbrot, B.B. The Fractal Geometry of Nature; W.H. Freeman: New York, NY, USA, 1982. [Google Scholar]
  20. Zhang, G.; Guo, J.; Xu, B.; Xu, L.; Dai, Z.; Yin, S.; Soltanian, M.R. Quantitative analysis and evaluation of coal mine geological structures based on fractal theory. Energies 2021, 14, 1925. [Google Scholar] [CrossRef]
  21. Wang, D.; Zeng, Z.P.; Hu, H.Y.; Wang, T.; Zhu, G.G.; Li, S.T.; Li, L. Pore structure fractal characteristics and geological significance of deep terrestrial shales in the Lower Urho Formation, central Junggar Basin. Oil Gas Geol. Recovery 2024, 31, 23–35. [Google Scholar]
  22. Zhong, B.; Zhu, Y.; Feng, G.; Xiang, J.; Wang, Y. Matrix Compression and Pore Heterogeneity in the Coal-Measure Shale Reservoirs of the Qinshui Basin: A Multifractal Analysis. Fractal Fract. 2024, 8, 580. [Google Scholar] [CrossRef]
  23. Li, L.L. Evaluation of Coal System Oil and Gas Combined Exploration and Extraction Potential of Taiyuan Formation in Huainan Area. Master’s Thesis, Nanjing University, Nanjing, China, 2019. [Google Scholar]
  24. Zhang, W.Y.; Dou, X.Z.; Liu, G.J. Geochemical characterization and hydrocarbon potential of hydrocarbon source rocks in the deep coal system of the Panxie Mining Area, Huainan. J. Coal Sci. 2020, 45, 731–739. [Google Scholar]
  25. Sang, S.; Han, S.; Zhou, X.; Liu, S.; Wang, Y. Deep coalbed methane resources and prospects for exploration and development in East China. Reserv. Eval. Dev. 2023, 13, 403–415. [Google Scholar]
  26. Wu, D.; Wu, J.; Hu, G.; Cai, G.; Gao, X. Fine Structure Characterization of Representative Coal-Bearing Rocks of the Late Carboniferous Taiyuan Formation in Huainan Coalfield: Combined SEM, FESEM, and μCT Techniques. ACS Omega 2024, 9, 2850–2865. [Google Scholar] [CrossRef]
  27. Wu, D.; Zhang, W.Y.; Liu, G.J. Characteristics and geological significance of germanium in Taiyuan coal formation of Huainan Coalfield, Anhui, China. Int. J. Coal Sci. Technol. 2020, 7, 662–675. [Google Scholar] [CrossRef]
  28. Wu, D.; Zhang, W.Y.; Liu, G.J.; Zhan, R.; Hu, G.Q. Unconventional oil and gas exploration and development technology of the Taiyuan Formation coal system in Huainan Coalfield. Coalf. Geol. Explor. 2017, 45, 13–18. [Google Scholar] [CrossRef]
  29. Chen, B.Y.; Liu, G.J.; Wu, D.; Sun, R.Y. Elemental geochemical characterization of the Taiyuan Formation aluminous mudstone in Huainan Coalfield. Coalf. Geol. Explor. 2018, 46, 21–27. [Google Scholar]
  30. Yu, K.; Gan, Y.T.; Ju, Y.W.; Shao, C.J. Influence of sedimentary environment on the brittleness of coal-bearing shale: Evidence from geochemistry and micropetrology. J. Pet. Sci. Eng. 2020, 185, 106603. [Google Scholar] [CrossRef]
  31. GB/T 19222-2003. Available online: https://codeofchina.com/standard/GBT19222-2003.html (accessed on 16 March 2025).
  32. GB/T 29171-2012. Available online: https://codeofchina.com/standard/GBT29171-2012.html (accessed on 16 March 2025).
  33. Xie, H.P. Introduction to Fractal-Rock Mechanics; Science Publishing House: Beijing, China, 1997; pp. 18–23. [Google Scholar]
  34. Feder, J. Fractals; Plenum Press: New York, NY, USA, 1988. [Google Scholar]
  35. Yang, X. Research on Rock Pore Imaging Based on Oblique Incident Light Reflection Difference Technique. Master’s Thesis, China University of Petroleum (Beijing), Beijing, China, 2022. [Google Scholar]
  36. Gao, J.D.; Kong, D.B.; Peng, Y.F.; Zhou, Y.Z.; Liu, Y.W.; Zhu, W.Y. Pore-scale mechanisms and hysteresis effect during multi-cycle injection and production process in underground hydrogen storage reservoir. Energy 2023, 283, 129007. [Google Scholar] [CrossRef]
  37. Fang, H.H.; Wang, Z.F.; Sang, S.X.; Liu, S.Q.; Gu, C.C.; Yang, J.; Huang, Y.H. Correlation Evaluation and Schematic Analysis of Influencing Factors Affecting Pore and Fracture Connectivity on the Microscale and Their Application Discussion in Coal Reservoir Based on X-ray CT Data. ACS Omega 2023, 8, 11852–11867. [Google Scholar] [CrossRef]
  38. Liu, X.; Rao, L.; Zhuang, T. Characterization of Micro-nano pore structure of tight sandstone based on nuclear magnetic resonance experiments (NMR). In Proceedings of the International Field Exploration and Development Conference, Wuhan, China, 20–22 September 2023; Springer Nature: Singapore, 2023; pp. 208–224. [Google Scholar]
  39. Yao, Y.B.; Liu, D.M.; Che, Y.; Tang, D.Z.; Tang, S.H.; Huang, W.H. Petrophysical characterization of coals by low-field nuclear magnetic resonance (NMR). Fuel 2009, 89, 1371–1380. [Google Scholar] [CrossRef]
  40. Coates, G.R.; Xiao, L.Z.; Prammer, M.G. NMR Logging Principles and Applications; Gulf Publishing Company: Houston, TX, USA, 1999; in press. [Google Scholar]
  41. Wen, X.; Chen, Y.; Pu, R. Analysis of the factors influencing movable fluid in shale oil reservoirs: A case study of Chang 7 in the Ordos Basin, China. Geomech. Geophys. Geo-Energy Geo-Resour. 2024, 10, 177. [Google Scholar] [CrossRef]
  42. Yao, Y.B.; Liu, D.M. Physical properties and fluid characterization of shale reservoirs based on nuclear magnetic resonance relaxation spectroscopy. J. Coal 2018, 43, 181–189. [Google Scholar]
  43. Li, A.; Ding, W.L.; Wang, R.Y. Petrophysical characterization of shale reservoir based on nuclear magnetic resonance (NMR) experiment: A case study of Lower Cambrian Qiongzhusi Formation in eastern Yunnan Province, South China. J. Nat. Gas Sci. Eng. 2016, 37, 29–38. [Google Scholar] [CrossRef]
  44. Liu, Y.; Yao, Y.B.; Liu, D.M.; Zheng, S.J.; Sun, G.X.; Chang, Y.H. Shale pore size classification: An NMR fluid typing method. Mar. Pet. Geol. 2018, 96, 591–601. [Google Scholar] [CrossRef]
  45. Sondergeld, C.H.; Ambrose, R.J.; Rai, C.S. Microstructural studies of gas shales. In Proceedings of the SPE Unconventional Gas Conference, Pittsburgh, PA, USA, 23–25 February 2010. Paper SPE-131771 MS. [Google Scholar]
  46. Curtis, J.B. Fractured shale-gas system. AAPG Bull. 2002, 86, 1921–1938. [Google Scholar]
  47. Qin, L.; Li, S.G.; Zhai, C.; Lin, H.F.; Zhao, P.X.; Yan, M.; Shi, Y. Joint analysis of pores in low, intermediate, and high rank coals using mercury intrusion, nitrogen adsorption, and nuclear magnetic resonance. Powder Technol. 2020, 362, 615–627. [Google Scholar] [CrossRef]
  48. Li, K.; Jia, Y.; Han, Y.L.; Lei, F.; Lin, F.H.; Wang, T.; Chen, W. Quantitative characterisation of microstructure of coal carbonate rocks in tectonic regions based on MIP and SEM. China Coal 2025, 51, 204–214. [Google Scholar]
  49. Wang, J.; Zhang, J.; Xiao, X.; Chen, Y.N.; Han, D. Pore Structure and Fractal Characteristics of Inter-Layer Sandstone in Marine–Continental Transitional Shale: A Case Study of the Upper Permian Longtan Formation in Southern Sichuan Basin, South China. Fractal Frac. 2025, 9, 11. [Google Scholar] [CrossRef]
  50. Shen, Y.J.; Wang, X.; Zhao, X.; Zhao, C.H.; Wang, S.Q.; Guo, C.; Shi, Q.M.; Ma, W. Characteristics of multiscale pore structure of oil-rich coal in Yushenfu mining area. Coalf. Geol. Explor. 2021, 49, 33–41. [Google Scholar]
  51. Li, J.; Liu, D.; Yao, Y.; Cai, Y.; Qiu, Y. Evaluation of the reservoir permeability of anthracite coals by geophysical logging data. Int. J. Coal Geol. 2011, 87, 121–127. [Google Scholar] [CrossRef]
  52. Liu, L.H.; Hu, H.Y.; Zhan, X.F.; Wang, T.; Tang, T.; Lei, L. Pore structure and NMR fractal characteristics of deep shale in Longmaxi Formation, Luzhou Block. Chin. Sci. Technol. Pap. 2023, 18, 501–511. [Google Scholar]
Figure 1. Geological histogram and sampling point distribution map of the Taiyuan Formation of the HN-1 well in the Huainan coalfield.
Fractalfract 09 00263 g001
Figure 2. (a) Distribution map of major basins in North China (modified from [30]), The red bi-directional arrow in the figure indicates a strike-slip fault in the Tanlu Fault Zone east of the collision zone between the South China Craton and Qinling-Dabie; (b) Geological structure map of Panxie mining area, Huainan coalfield. ((a) shows TC: Tarim Craton; QB: Qaidam Block; QM: Qiangtang Block).
Fractalfract 09 00263 g002
Figure 3. Information summary of different representation methods for multi-scale rock physical structure characterization.
Fractalfract 09 00263 g003
Figure 4. Physical sample image of source rock from the 1150–1156 m interval of the Taiyuan Formation at the HN-1 well.
Fractalfract 09 00263 g004
Figure 5. Relationship between roaring parameters and porosity of three rock samples.
Fractalfract 09 00263 g005
Figure 6. Relationship between pore throat sorting characteristics and porosity of three rock samples.
Fractalfract 09 00263 g006
Figure 7. Relationship between connectivity, permeability, and porosity of three rock samples.
Fractalfract 09 00263 g007
Figure 8. Capillary pressure curves of three rock samples.
Fractalfract 09 00263 g008
Figure 9. Distribution of pore throat interval for three types of rock samples.
Fractalfract 09 00263 g009
Figure 10. (a) LFNMR T2 spectrum characteristics of representative rock samples; (b) LFNMR pore size distribution of representative rock samples.
Fractalfract 09 00263 g010
Figure 11. POM images of different types of rock samples: (a,b) L1 limestone, buried at depths of 1140.45–1149.40 m ((a) transmitted light; (b) fluorescence); (c,d) L4 limestone, buried at a depth of 1231.50 m ((c) transmitted light; (d) fluorescence); (e,f) S2 sandstone, buried at depths of 1149.75–1153.65 m (e) transmitted light; (f) fluorescence); (g,h) S4 sandstone, buried at depths of 1201.80–1206.65 m ((g) transmitted light; (h) fluorescence); (i,j) M2 mudstone, buried at a depth of 1164.10 m ((i) transmitted light; (j) fluorescence); (k,l) M5 mudstone, buried at depths of 1181.95–1183.20 m ((k) transmitted light; (l) fluorescence).
Fractalfract 09 00263 g011
Figure 12. FESEM results of different rock samples: (a) L1 limestone, burial depth 1140.45–1149.40 m; (b) L4 limestone, burial depth 1231.50 m; (c) S2 sandstone, burial depth 1149.75–1153.65 m; (d) S4 sandstone, burial depth 1201.80–1206.65 m; (e) M2 mudstone, burial depth 1164.10 m; (f) M5 mudstone, burial depth 1181.95–1183.20 m.
Fractalfract 09 00263 g012aFractalfract 09 00263 g012b
Figure 13. Schematic diagram for the calculation of fractal dimension of S4 sandstone samples ((a) original FESEM Image, (b) binary black-and-white image, (c) box-covering image, and (d) fractal dimension fitting image of some samples).
Fractalfract 09 00263 g013
Figure 14. Analysis of significant differences in porosity of different rock samples under MICP and LFNMR test conditions ((a) limestone samples, (b) sandstone samples, and (c) mudstone samples).
Fractalfract 09 00263 g014
Figure 15. Porosity correlation between the two testing methods.
Fractalfract 09 00263 g015
Figure 16. Correlation between fractal dimension, porosity, and displacement pressure.
Fractalfract 09 00263 g016
Table 1. Mercury intrusion capillary pressure experimental parameters for rock samples.
Sample NumberPorosity (%)DP
(Mpa)
AMPTR
(μm)
RSC
(D)
UC
(α)
PTD
(Skp)
MMS
(Smax)
RMS
(%)
MRE
(%)
L10.9820.660.01289.850.325−0.28776.5325.7266.40
L21.2020.660.00998.050.266−0.50478.4628.4663.73
L31.3313.780.01573.320.294−0.13186.2931.3963.62
L40.9413.780.01674.560.299−0.09985.0240.4652.41
L51.1117.220.01383.940.310−0.25581.5731.5161.54
Average1.1117.220.01383.940.291−0.25581.5731.5161.54
SD0.183.980.00312.040.2490.1854.806.416.22
S12.0913.780.01577.320.286−0.28990.0727.2869.71
S22.375.500.03352.080.250−0.24488.2533.5561.99
S33.265.500.02767.210.201−0.42290.5926.3270.95
S43.935.510.02461.310.183−0.26595.2642.7355.14
Average2.917.570.02564.480.230−0.30591.0432.4764.45
SD0.844.140.00810.580.0470.0802.987.557.36
M11.9113.780.01382.620.235−0.34589.0013.2985.07
M21.5111.260.01279.510.221−0.24779.1515.4169.26
M31.2116.340.01580.550.261−0.44190.1327.1584.69
M42.0513.730.01288.460.241−0.35389.4212.6482.46
M52.4913.780.01476.860.260−0.27588.7828.5467.85
M62.3313.780.01289.040.228−0.42080.9213.3683.49
Average1.8313.780.01382.840.241−0.34786.2318.4078.80
SD0.300.000.0016.090.0170.0734.608.799.52
DP: Discharge pressure; AMPTR: Arithmetic mean pore throat interval; RSC: Relative sorting coefficient; UC: Uniformity coefficient; PTD: Pore throat distortion; MMS: Maximum mercury saturation; RMS: Residual mercury saturation; MRE: Mercury removal efficiency; SD: Standard deviation (1σ).
Table 2. LFNMR porosity results of 15 rock samples.
Sample NumberPorosity (%)Average Porosity (%)
L11.811.88 (n = 5)
L21.55
L32.19
L42.11
L51.76
S11.923.02 (n = 4)
S22.61
S33.32
S44.21
M11.992.01 (n = 6)
M21.03
M31.39
M42.42
M52.77
M62.50
Table 3. Fractal dimensions of various rock samples.
Sample
Number
Fitting FormulaR2D
L1y = −1.944x + 12.1990.99911.944
L2y = −1.985x + 14.1780.99381.985
L3y = −1.851x + 11.6470.99711.851
L4y = −1.796x + 15.3180.99561.796
L5y = −1.990x + 12.2110.99941.990
S1y = −1.769x + 13.0940.99341.769
S2y = −1.341x + 11.6810.99291.341
S3y = −1.351x + 14.1630.99831.351
S4y = −1.405x + 10.1680.99751.405
M1y = −1.821x + 10.9270.99191.821
M2y = −1.568x + 12.9810.99071.568
M3y = −1.972x + 13.1440.99641.972
M4y = −1.895x + 12.6570.99511.895
M5y = −1.746x + 11.4340.99821.746
M6y = −1.789x + 14.2120.99371.789
Table 4. Porosity of each rock sample calculated using the geometric mean method.
Sample NumberMICP Porosity (%)LFNMR Porosity (%)Geometric Mean Porosity %
L10.981.811.33
L21.201.551.36
L31.332.191.70
L40.942.111.41
L51.111.761.40
S12.091.922.00
S22.372.612.49
S33.263.323.29
S43.934.214.07
M11.911.991.95
M21.511.031.25
M31.211.391.30
M42.052.422.23
M52.492.772.63
M62.332.502.42
Disclaimer/Publisher’s Note: The statements, opinions and data contained in all publications are solely those of the individual author(s) and contributor(s) and not of MDPI and/or the editor(s). MDPI and/or the editor(s) disclaim responsibility for any injury to people or property resulting from any ideas, methods, instructions or products referred to in the content.

