Article

Fractal Analysis of Organic Matter Nanopore Structure in Tectonically Deformed Shales

1
Key Laboratory of Petroleum Geomechanics Chinese Geological Survey, Institute of Geomechanics, Chinese Academy of Geological Sciences, Beijing 100081, China
2
Key Laboratory of Paleomagnetism and Tectonic Reconstruction, Ministry of Natural Resources, Beijing 100081, China
*
Author to whom correspondence should be addressed.
Fractal Fract. 2025, 9(4), 257; https://doi.org/10.3390/fractalfract9040257
Submission received: 17 March 2025 / Revised: 11 April 2025 / Accepted: 14 April 2025 / Published: 18 April 2025

Abstract

Fractal analysis was used to characterize the organic matter nanopore structure in tectonically deformed shales, providing insights into the heterogeneity and complexity of the pore network. Shale samples from different tectonic deformation styles (undeformed, brittle deformed, and ductile deformed) in the Lower Cambrian Niutitang Formation in western Hunan, South China, were collected. By comprehensively applying techniques such as low-temperature gaseous (CO2 and N2) adsorption (LTGA), scanning electron microscopy (SEM), and ImageJ analysis, we accurately obtained key parameters of the pore structure. The results show ductile deformation reduces fractal dimension (DM) by ~0.2 compared to brittle deformed shale, reflecting the homogenization of organic nanopore structures. Brittle deformation leads to a more complex pore network, while ductile deformation reduces the complexity of the organic nanopore structure. The fractal dimensions are affected by various factors, with micropore development being crucial for undeformed shale, clay and pore length–width ratio dominating in brittle deformed shale, and all-scale pores being key for ductile deformed shale. This study provides the first comparative analysis of fractal dimensions across undeformed, brittle deformed, and ductile deformed shales, revealing distinct pore structure modifications linked to deformation styles. These findings not only enhance our understanding of the influence mechanism of tectonic deformation on shale pore structure and fractal characteristics but also provide a theoretical basis for optimizing shale gas exploration and production strategies. These findings offer a framework for predicting gas storage and flow dynamics in tectonically complex shale reservoirs. For instance, in areas with different tectonic deformation styles, we can better evaluate the gas storage capacity and production potential of shale reservoirs according to the obtained fractal characteristics, which is of great significance for efficient shale gas development.

1. Introduction

In recent years, shale gas, an important unconventional natural gas resource, has attracted significant global attention [1,2,3,4,5], and the transformation of shale from traditional source and cap rocks into unconventional reservoirs. Unlike traditional reservoirs, shale is considered a tight reservoir due to its abundance of nano-pores [4,6,7,8]. These pore characteristics play an important role in shale gas exploration and production, as they directly influence the storage and migration of shale gas within the reservoir [6,7,8,9,10]. The pores in shale are highly complex, with a wide range of pore sizes, shapes, and connectivity patterns [7,11]. These pores can be classified into micropores (pore diameter < 2 nm), mesopores (2–50 nm), and macropores (>50 nm) according to the International Union of Pure and Applied Chemistry (IUPAC) classification [12]. Based on their genesis, pores can be classified as intergranular pores, intragranular pores (intergranular pores), organic matter (OM) pores, and microcracks [8,10,13]. OM-host pores make a significant contribution to the pore network of shale reservoirs [14] and are critical in controlling the gas content and methane adsorption capacity of black shales [15,16]. Therefore, the analysis of organic pores is significant for the assessment of reservoir quality and the exploration of shale gas resources.
The presence of organic pores is a key differentiating factor between shale reservoirs and conventional oil and gas reservoirs. It has been demonstrated [14,15,16] that organic matter OM-hosted pores are significant constituents of the pore system of black shales. Understanding the OM pore structure of shale is essential for accurately assessing shale gas reservoirs. Previous studies have shown that the adsorbed gas can account for up to 20–85% of the total gas content [17], and organic matter nanopores are the main contributors to this adsorbed gas storage. Numerous studies have validated the pivotal regulatory impact of organic pores on the enrichment and productivity of shale gas [3,18,19,20,21]. The formation of organic pores is primarily initiated during the process of hydrocarbon generation and expulsion, which is concomitant with the thermal evolution of hydrocarbon source rocks [20]. Analyses of shale samples with different maturity levels indicate that the development of organic pores is controlled by the maturity and type of organic matter in combination [20,22]. The OM pore volume, geometry, pore size distribution, and specific surface area are key parameters for estimating the amount of gas that can be stored in the shale. By analyzing these parameters, geologists can predict the potential productivity of a shale gas reservoir. When examining the detailed organic matter nanopore network within shale reservoirs, using SEM and other high-resolution microscope image analysis techniques can help observe the geometry and pore size in shale [14]. The pore size distribution, pore volume, and specific surface area can be quantitatively characterized using low-pressure N2/CO2 adsorption experiments [23,24,25,26]. Moreover, SEM images can be analyzed using image processing software such as ImageJ to extract quantitative information on pore geometry, roundness, and aspect ratio [27,28].
Fractal theory offers a new scientific method for exploring the complex pore architecture of shales [22,29]. The fractal dimension (D) quantifies the roughness of pore surfaces and structural irregularities, with higher values indicating more complex pore structures. Studies have shown that the pore structure of shales exhibits similarities within a certain scale range, and its spatial spreading pattern is between 2D and 3D. Researchers are examining the fractal properties of shale through image techniques and low-pressure nitrogen adsorption, aiming to connect these properties to OM pore structure. The fractal dimension tends to be greater with smaller pore sizes and higher porosities, whereas the influence of shale composition is unclear, sometimes leading to entirely different findings in different studies. Thus, recognizing the factors that affect OM pore fractal dimension within the geological environment is crucial, making it a primary focus of this research.
The pore structure was controlled by the composition of shales, while the fractal dimension was controlled by the pore specific surface area, pore shape, and pore size [30]. Certainly, the generation and development of shale organic matter pores are mainly controlled by the original sedimentary environment and the basic characteristics of shale organic matter, including total organic content (TOC), types of organic matter, thermal maturity, mineral composition, and rigid framework [6,7,8,10,11]. On the other hand, in the late evolutionary stage of organic matter pores, tectonic stress and structural deformation may also affect the shape and size of organic matter pores, which in turn affects the methane adsorption capacity of shale and shale gas potential [29,31,32,33]. For shales in tectonically complex areas in southern China, researchers have carried out a lot of work to study the effects of tectonic deformation on the pore structure of shale reservoirs, including the organic matter pores. Liang et al. point out that the pore surface area and adsorption capacity of shale are affected by tectonic stress and structural deformation, while the total pore volume and micropores (<2 nm and mainly organic matter pores) content were not significantly affected by tectonic deformation [31]. Fractal analysis by Wang et al. suggests that increased tectonic compression causes organic pores to be predominantly long and slit-shaped, exhibiting high fractal dimensions [29]. Other researchers have argued that organic matter pores are poorly developed in deformed shale samples, but nanopores in organic matter and clay mixtures are well developed in both brittle deformed and ductile deformed shales [32]. Overall, previous studies show evidence that organic matter’s origin dictates the potential for organic pore formation, with tectonic deformation processes having a secondary impact by modifying nanopore structures. These studies indicate the importance of organic matter pore structure and its fractal dimension characteristics as affected by tectonic deformation. However, as different organic matter types have different effects on the primary development of organic matter pores, different tectonic deformation types have different modifications and effects on organic matter pores, but little is known about the interrelationships between different tectonic deformation styles and the fractal characteristics of organic matter pores in shale.
In this study, fractal analysis of organic pore feature investigations is performed using three sets of shale samples (undeformed shale, brittle deformed shale, and ductile deformed shale) collected from the Lower Cambrian Niutitang Formation with different tectonic deformation styles in western Hunan, Middle Yangtze, South China, were selected. The relationship between fractal dimension and geological conditions, including TOC, mineralogical, and structure styles, was investigated. The influence of structural deformation on fractal patterns and pore structure was studied. These results provide new evidence for the evolution of pore structures of shale affected by different tectonic deformations.

2. Samples and Methods

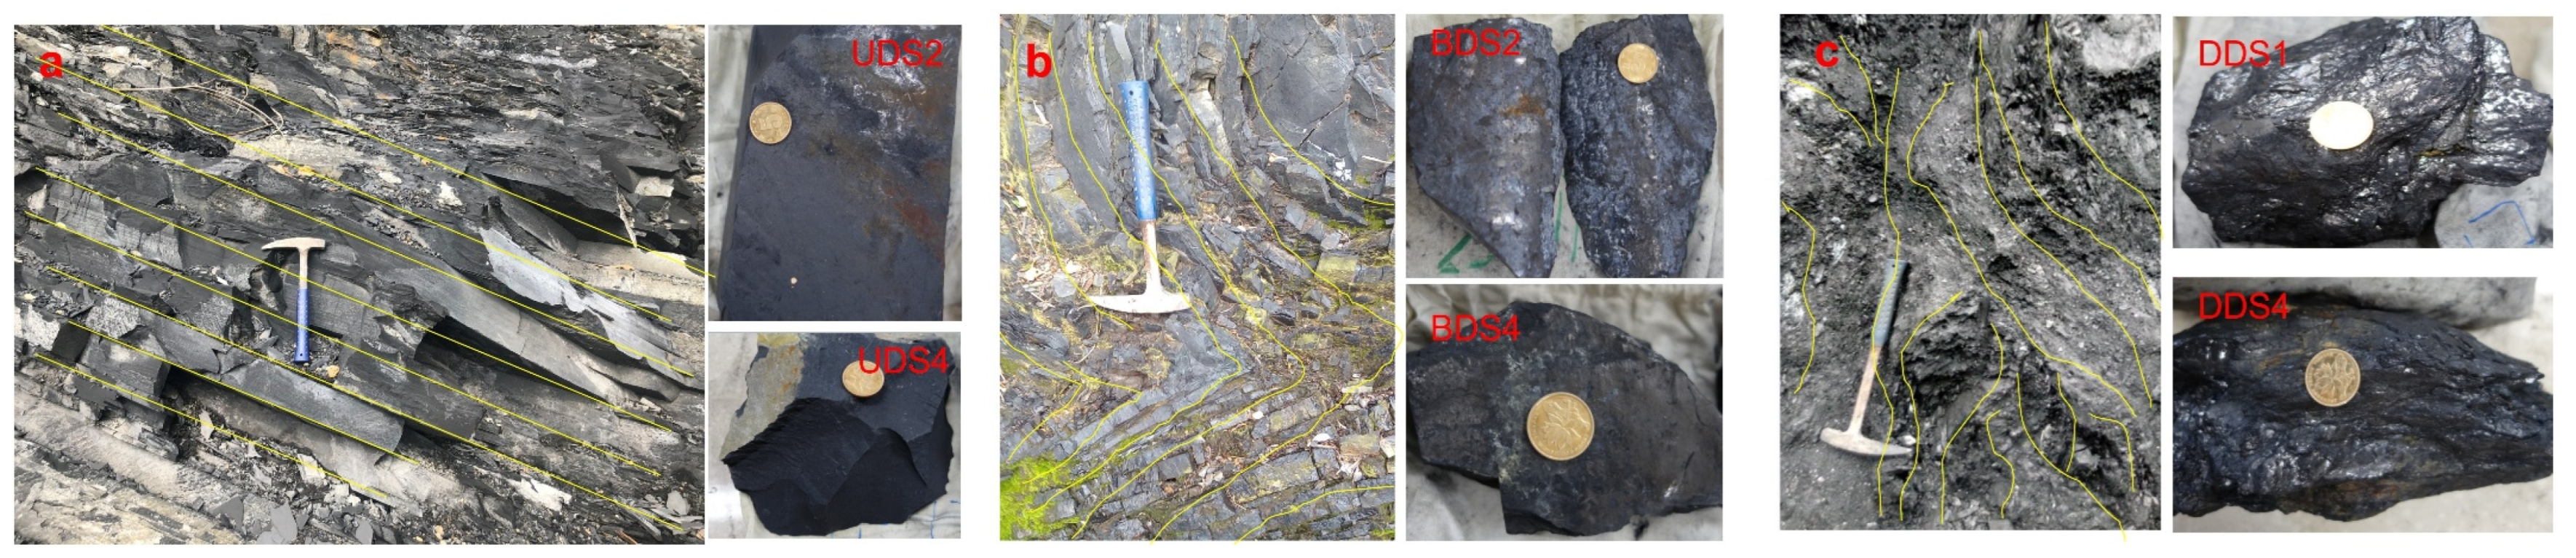
2.1. Sample Collection

The Lower Paleozoic Cambrian strata in the west of Hunan and Hubei have good petroleum geological conditions and huge resource potential for shale gas exploration. It has experienced complex multi-stage tectonic movements, and the differences in shale reservoirs in the area are closely related to the tectonic deformation mechanism [27,31,33,34]. Shale samples were carefully collected from three outcrops with well-documented deformation (undeformation, brittle and ductile deformation) (Figure 1). Samples are sitting at western Hunan, South China, and the detachment structural deformation control across the Niutitang formations shale in this area [27,34]. As the main detachment structure belt [27], the Niutitang formations shale layer developed multi-layer subdivided slip structural deformation. The samples subset is based on detailed geological stratigraphy specimens and thin section characteristics (Figure 1 and Figure 2). A suite of samples was subset to three sets of brittle deformed shale, ductile deformed shale, and undeformed shale for this study due to their variability of texture, fabric, and structure properties (Figure 1 and Figure 2). Undeformed shale (UDS) samples were collected from an outcrop that maintains the original sedimentary stratigraphy (Figure 1a), and samples maintain the original parallel laminations with poorly developed fractures (Figure 2a). Brittle deformed shale (BDS) samples were collected from an outcrop where a folded structure was developed (Figure 1b). BDS development with single-phase cracks was filled with secondary mineral veins (Figure 2b). Ductile deformation shale (DDS) samples were collected from a slip zone where multiple phases of deformation had developed (Figure 1c). The DDS samples have developed multi-angle fault mirrors, multi-phase fracture cross-development, the development of mylonite structures (Figure 2c), and the phenomenon of fragmentation and rearrangement of minerals and organic matter by intense stress (Figure 1 and Figure 2). A total of 12 samples were collected; the sample numbers were abbreviated as UDS1, UDS2, UDS3, and UDS4 (undeformed shale); BDS1, BDS2, BDS3, and BDS4 (brittle deformed shale); and DDS1, DDS2, DDS3, and DDS4 (ductile deformed shale). The pore structure development characteristics of similar fold-development-related brittle deformed shales [33] and slip-related mylonitized ductile deformed shales [35] in different regions and horizons have been analyzed by previous studies. Similar tectonic styles of brittle and ductile deformation are widely developed in shale formations in the outer regions of the Sichuan Basin in South China, which is a typical tectonic deformation style. In this study, two typical brittle and ductile deformation styles are selected for comparative study, which has certain regional significance. The basic features of the experimental samples are shown in Table 1.

2.2. Experimental and Methods

To evaluate the influence of different tectonic deformations on organic matter pore characteristics by comparing the brittle deformed shale, ductile deformed shale, and undeformed sample subsets, 12 shale samples were collected in this study (Table 1). Among these samples, all samples were analyzed to determine the organic geochemistry and mineralogy, refs. [23,26] low-temperature gas (CO2 and N2) adsorption (LTGA) to quantify and determine the pore structure, including the pore-size distribution (PSD), surface area (SA), and pore volume (PV), and scanning electron microscopy (SEM), used for directly observing the microstructure of pore geometry, including the pore morphology, pore size, and the spatial distribution of pores. In addition, Frenkel–Halsey–Hill (FHH) model [29,30,36,37] was used to analyze low-temperature nitrogen adsorption data to obtain fractal dimension characteristics of organic nanopores (0–200 nm). ImageJ software was used [27,28] to analyze the shape, length–width ratio (LWR), and roundness characteristics of organic pores from SEM images. Comprehensively analyzing the above experimental results, the fractal features and pore structure characteristics of organic matter pores in different tectonically deformed shales can be obtained.

2.2.1. Geochemical and Mineralogical

Samples were ground to 180–200 mesh before conducting geochemical and mineralogical analyses. The TOC content was obtained using a Leco C/S-344 Carbon/Sulfur analyzer (Leco, St. Joseph, MI, USA), and the stable carbon isotope was measured with a Finnigan MAT 252 mass spectrometer (Thermo Fisher Scientific, Bremen, Germany). To determine the bitumen reflectance values (VRb) in the samples, a 3Y-Leica DMR XP microscope with a microphotometer was employed, ensuring at least 30 measurements were taken on bitumen particles for each sample. For X-ray diffraction (XRD) analysis, the crushed samples were mixed with ethanol, manually ground with a mortar and pestle, and then mounted on glass slides, using a D/Max-III analyzer (Rigaku, Tokyo, Japan) at 40 kV and 30 mA. A semi-quantitative estimation of mineral contents was achieved by measuring the area under the curve for the peaks.

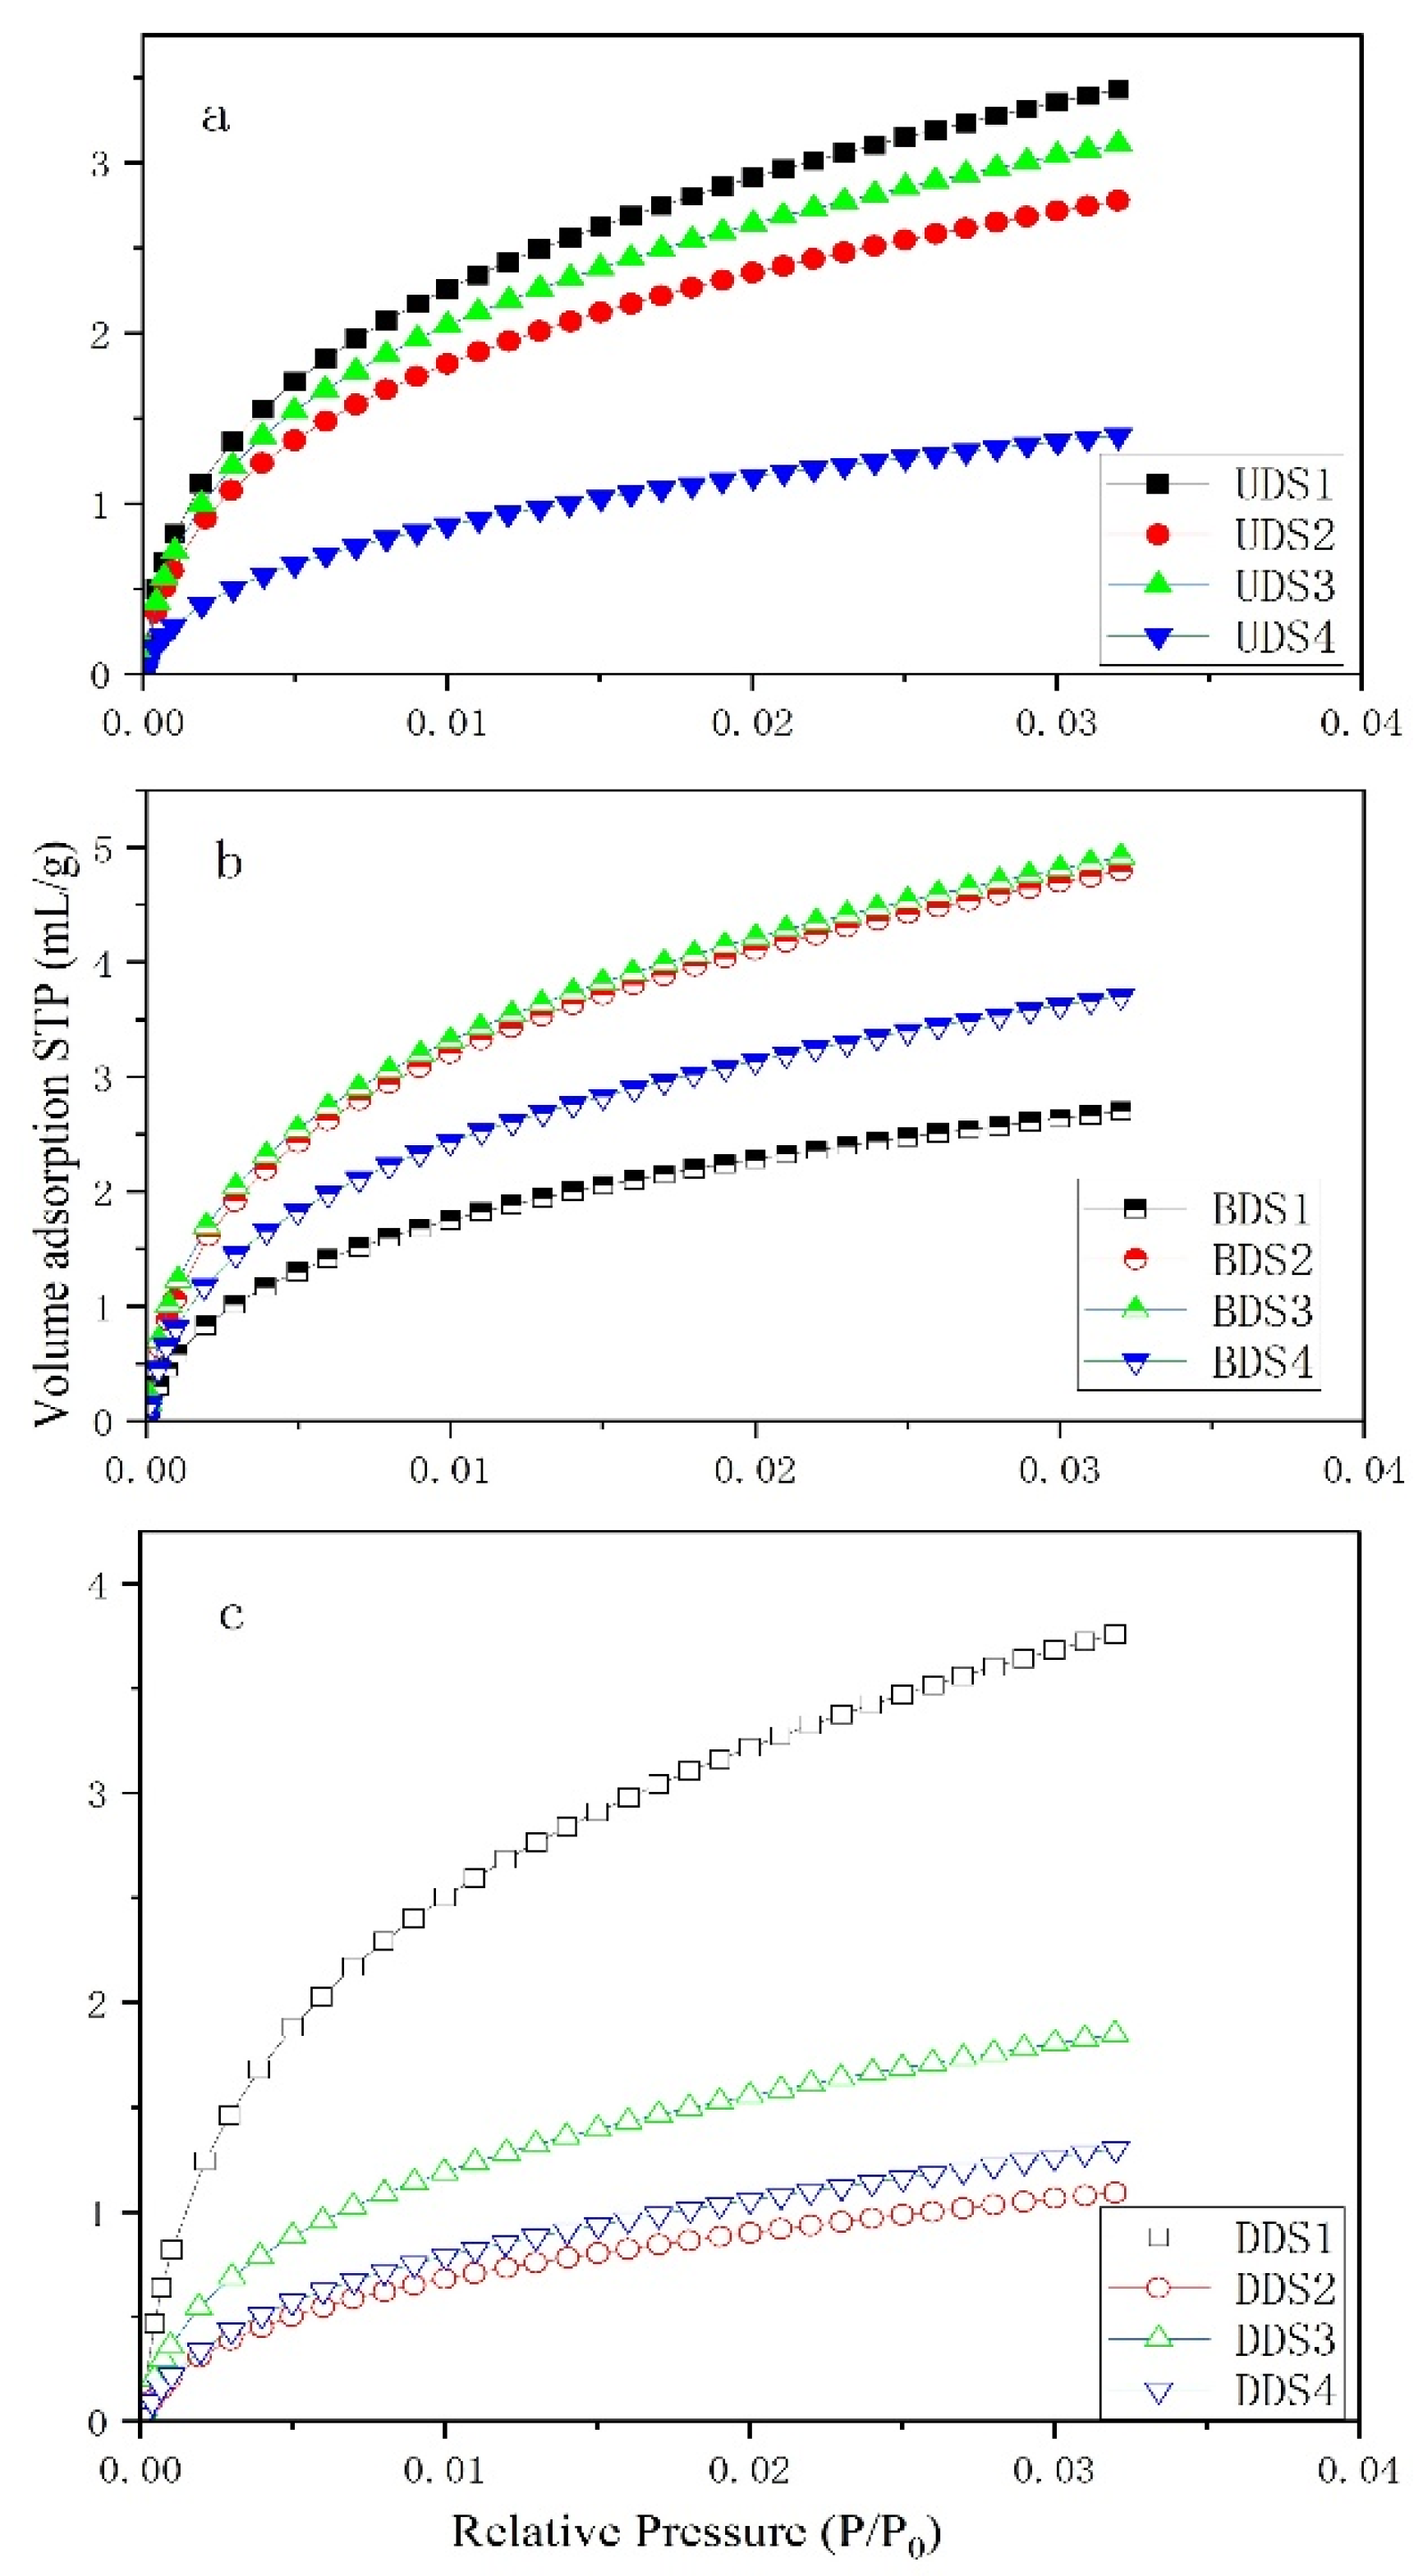
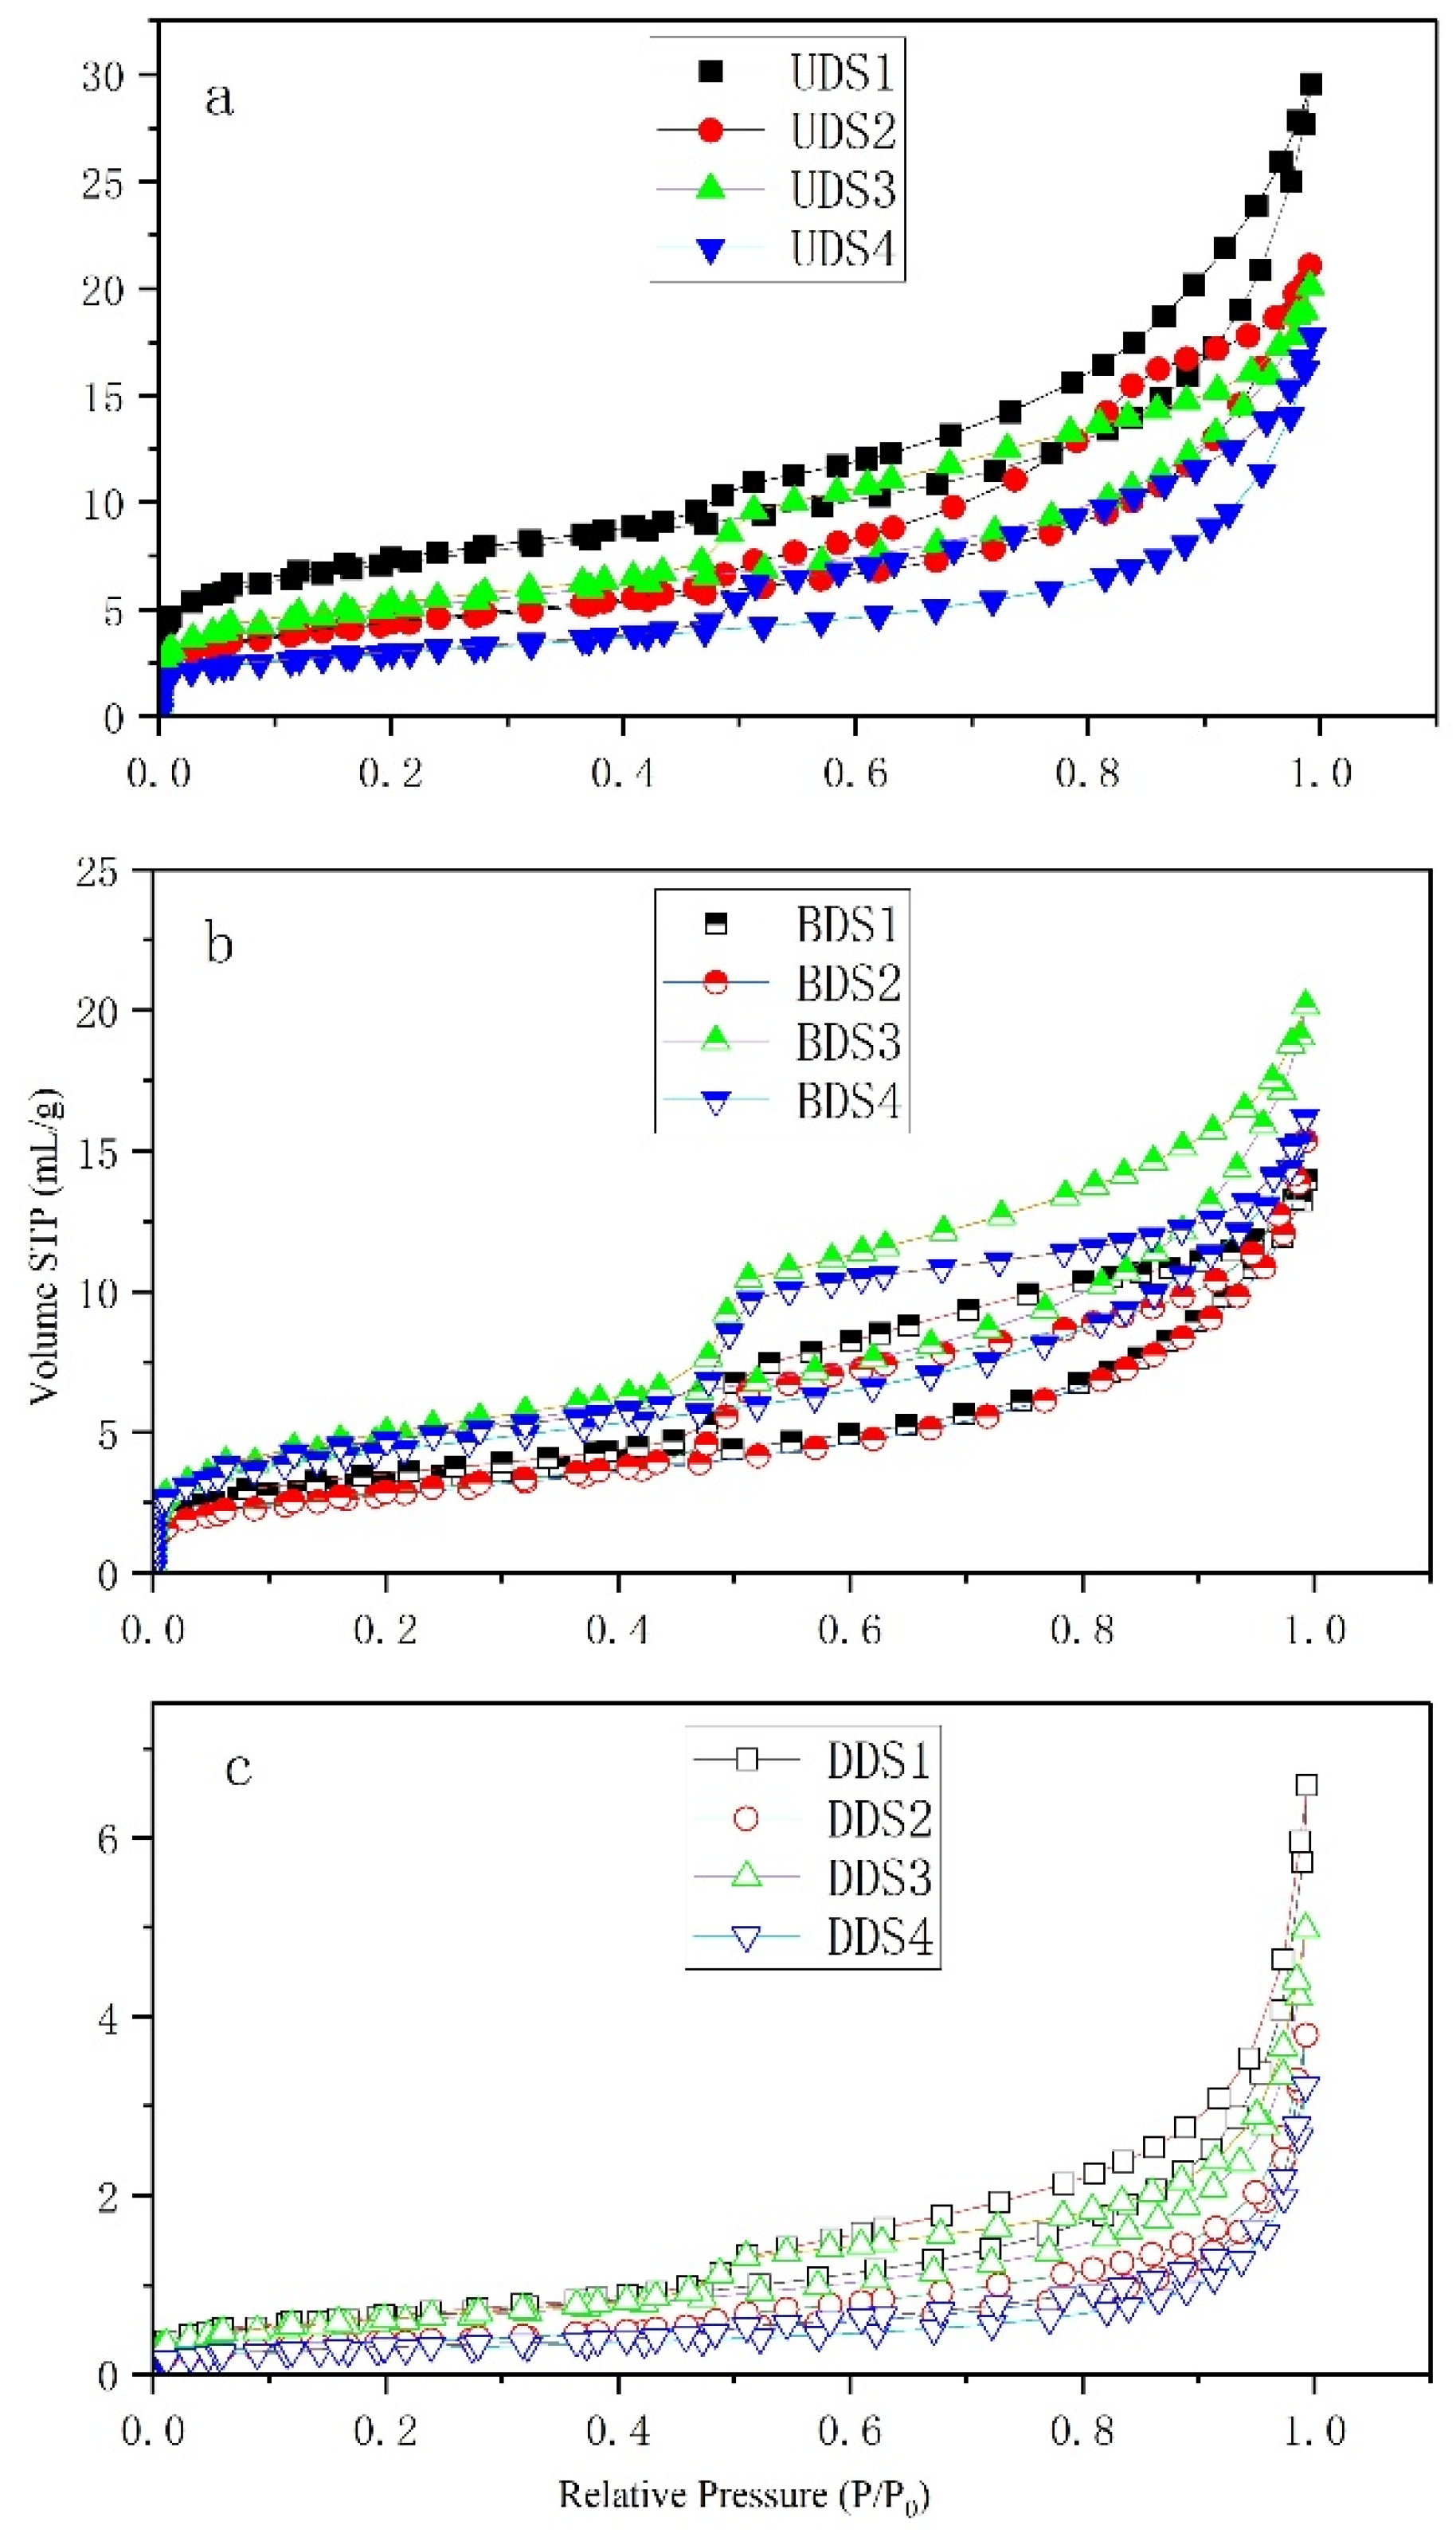
2.2.2. Low-Temperature Gas Adsorption (LTGA)

Low-temperature gas adsorption (LTGA) is a powerful method for characterizing nanopores. To fully evaluate the organic matter nanopore structure, samples were crushed (2–5 mm) and dried at 110 °C and then both CO2 and N2 gas adsorption analyses were performed. Low-temperature gas adsorption (LTGA) analyses have been used to measure the nanopores of pore size distribution from 0.33 nm to 200 nm using both nitrogen adsorption at −196 °C and carbon dioxide adsorption at 0 °C by a Micromeritics ASAP 2020 HD88 analyzer (Micromeritics, Norcross, GA, USA). The PSD, PV, and SA analyses combined the N2 and CO2 gas adsorption by the same calculation models of density function theory (DFT) [31,38,39,40]. The development of DFT models has led to a better understanding of adsorption processes in well-ordered systems compared to the more conventional models [41], used in the present study to quantify the calculation of micropores (0.3–2 nm), mesopores (2–50 nm), and macropores (50–200 nm) parameters by N2 and CO2 gas adsorption data.

2.2.3. Scanning Electron Microscopy (SEM)

Scanning electron microscopy (SEM) is a valuable tool for directly observing the microstructure of shale, including the pore morphology, pore size, and the spatial distribution of pores. In the SEM analysis of shale samples, the samples were first prepared. The shale samples were cut into small pieces and mounted on aluminum stubs using conductive carbon tape. To ensure good electrical conductivity and prevent charging effects during the electron-beam scanning, the samples were coated with a thin layer of gold using a sputter coater. The thickness of the coating was typically around 10–20 nm. After sample preparation, the samples were placed in the SEM chamber. The SEM was operated at an accelerating voltage of 10–20 kV, depending on the sample characteristics and the required resolution. The electron beam was scanned across the sample surface, and the secondary-electron images were collected. The SEM images were then analyzed using ImageJ—analysis software to measure the organic nanopore size and shape.

2.2.4. ImageJ Analysis

SEM images provide a detailed view of the organic pore structure in shale. We mainly use the ImageJ software (v1.52a) to extract and quantitatively count the morphological features (circularity and length/width ratio) of organic matter pores in SEM images in this study. We employed manual adjustment by experts to evaluate the image quality under different thresholds and noise reduction parameters. Multiple evaluation indicators, such as image entropy and edge preservation index, were used to comprehensively assess the quality of the processed images. The optimal settings were selected based on the combination of parameters that maximized the image entropy while maintaining good edge preservation. To clearly distinguish organic matter pores from other features (such as mineral pores), we established a set of strict criteria. First, we considered the morphological characteristics of pores, such as roundness and aspect ratio. Organic matter pores generally have more irregular shapes compared to mineral pores. Second, we analyzed the spatial distribution of pores. Organic matter pores are often associated with organic matter aggregates. In addition, for each sample, we selected multiple SEM images (n ≥ 3) for comparative experiments and calculated the average values of pore morphology characteristic parameters. Considering that the main purpose of this part of the research is to compare the pore morphology characteristics under different deformation styles, all images and threshold selections were carried out under the same experimental conditions and with the same level of manual experience. We believe that this can yield quality data that meets the research objectives. The first stage entailed converting the SEM image of the shale into an 8 bit grayscale image (Figure 3a). Then the threshold is adjusted in the Threshold tool, and then the Median filter is used to reduce the noise of the image; the organic matter region (Figure 3b) and the organic matter pore region (Figure 3c) can be extracted, respectively. The black area in the picture is obtained as organic matter pores (Figure 3d). The quantitative parameters for each pore were derived from ImageJ software, which used the Kraver method [42] to calculate the circularity and length/width ratio (LWR).

2.2.5. Fractal Dimension

The fractal dimension of the pore structure is a key parameter to quantify the complexity of the pore system. Fractal dimension D is a quantitative tool for describing the surface roughness or structural irregularity of shale pore structures. A D value between 2 and 3 can indicate the heterogeneity of the pore structure or surface. D = 2 indicates a completely smooth surface or uniform pore structure, while D = 3 signifies a completely irregular or rough surface or non-uniform pore structure. Frenkel–Halsey–Hill (FHH) method was used to calculate the fractal dimension from low-temperature nitrogen adsorption (LTNA) data [29,43,44]. The FHH equation is as follows:
Ln (V/V0) = K × ln(ln(P0/P)) + C
where V is the volume of N2 adsorbed under equilibrium pressure, V0 is the volume of monomolecular adsorption gas, P is the equilibrium pressure, P0 is the saturation pressure, K is related to the fractal dimension (D = 3 + K), and C is a constant. By fitting the LTNA data to the FHH equation, the fractal dimension D can be calculated.

3. Results

3.1. Geochemical and Mineralogical Characteristics

The samples’ organic geochemistry and mineralogy data are detailed in Table 1. Shale’s composition, comprising organic matter and minerals, is thought to significantly affect organic pore structure [45]. The TOC provides a clear indication of the ability to generate gas hydrocarbons and influences the state and quantity of hydrocarbon gas potential. The TOC of the Niutitang Formation shale ranges from 3.57 wt% to 20.7 wt% in this study. All of the undeformed shales, brittle deformed shales, and ductile deformed shales show high-quality organic matter richness features (TOC > 2%) and are within the gas generation window (VRb values of 3.12% to 3.89%), indicating that the shale samples possess a high richness of organic matter suitable for generating shale gas over geological periods. Tectonically deformed shales appear to have a higher TOC content than undeformed shales, probably because shales with a high TOC content are relatively softer in terms of rock mechanics and are more susceptible to deformation under tectonic stress. Ductile deformed shale samples have VRb values (3.37% to 3.89%) that are higher than those of brittle deformed shale samples (3.12% to 3.30%) and undeformed samples (3.12% to 3.15%), indicating that tectonic stress and deformation affect the maturation process of organic matter [46]. All samples have similar carbon isotope values of −34.3‰ to −32.5‰. These carbon isotopic compositions allow good insights into the provenance of the organic matter, the isotope analysis often used for paleoenvironmental reconstructions [47]. Based on the range of carbon isotope values, we assume that the organic matter in the Niutitang shales is 100% marine organic matter [47]. Consistent with earlier findings, structural deformation slightly raises the maturity level of organic matter in shale. Quartz and clay were the predominant components in all samples (Table 1), with their combined totals exceeding 90%. These were categorized as biogenic siliceous shale because of the quartz content surpassing 60% and a TOC content greater than 3.7%. While the brittle deformed shales contain higher quartz contents (85%), which may be related to fracture development with quartz vein-filling contributions.

3.2. Pore Morphology by SEM

Using ImageJ software for graphic processing (Figure 4), the organic pore in the SEM image consists of a series of pixels, and the pore area is defined as the number of pixels in its block. The organic matter content (OM%) and the organic pore content (OP%) were extracted by the threshold function of ImageJ software, respectively, and then the organic matter pore porosity (OMP%) in this study represents the amount of organic pore space in the organic matter rather than the amount of organic pore space in the whole rock, which was calculated and obtained as follows:
OMP = OP/OM
The perimeter can be obtained by accumulating the distances of the block boundary pixels. The length and width of the pores can be defined by the Feret diameter. With the pore area, perimeter, length, and width parameters, the complexity of the pore shape can be described in terms of roundness (Circ.) and aspect ratio (LWR). The roundness parameter (Circ.) of the pore is calculated from the pore area S and circumference C of the pore with the following equation:
Circ. = 4πS/C2
The shape factor Circ. characterizes the roundness of the pore boundary and has a value between 0 and 1. Circ. values closer to 1 indicate that the pore shape is closer to a regular circle. The LWR is calculated as the ratio of the pore length (maxFeret diameter) to the pore width (miniFeret diameter). LWR indicates the flatness and directionality of the pore shape, with larger LWR values indicating that the pore tends to be narrower and longer. Thus, both Circ. and LWR values are unitless. The pore morphology by SEM of all samples is shown in Table 2.
The box plots (Figure 5) show that ductile deformed shale has the smallest organic matter porosity (OMP) as deformation intensity increases, only 2.39 to 3.82%. Whereas brittle deformed shales have OMPs between 4.16 and 7.77%, undeformed shales have OMPs between 7.57 and 9.56%. Tectonic deformation has had a limited effect on the roundness of the organic matter pores of the shale, with undeformed shale ranging from 0.64 to 0.72, while brittle deformed shales have roundness between 0.71 and 0.77, and ductile deformed shales have roundness between 0.45 and 0.70. However, the effect of tectonic deformation on the aspect ratios of the organic matter pores in shales is significant, with the LWR of undeformed shales ranging from 1.75 to 1.86, while brittle deformed shales have LWR between 1.88 and 1.99, and ductile deformed shales have LWR between 2.34 and 3.45. It suggests that tectonic stresses act on organic pores, making them narrower and more elongated, which is consistent with the previous understanding that strong tectonic deformation develops organic pores dominated by long strip pores and slit-shaped pores [29].

3.3. Gas Adsorption Isotherms from LTGA

CO2 Gas Adsorption analyses have been used to measure the adsorption capacity in micropores of pore size distribution from 0.33 nm to 1.5 nm using carbon dioxide adsorption at 0 °C. Figure 6 presents the CO2 adsorption curves of all shale samples. These curves bear a resemblance to type I adsorption isotherms, suggesting the presence of micropores within the samples. As depicted in Figure 6b, the BDS samples exhibit the highest maximum adsorption capacity, spanning from 2.7 to 4.92 mL/g, with an average value of 4.03 mL/g (Table 2). The DDS samples have a relatively low maximum adsorption capacity, ranging from 1.09 to 3.76 mL/g, with an average of 2.0 mL/g. The UDS samples have medium adsorption capacity, ranging from 1.40 to 3.43 mL/g, with an average of 2.68 mL/g. On the one hand, the CO2 gas adsorption capacity of shale is affected by the content of TOC, and undeformed shale with lower TOC content (3.57–8.44%) has a moderate adsorption capacity. On the other hand, strong ductile tectonic deformation effects may reduce the adsorption capacity of shale micropores, resulting in UDS with low gas adsorption despite high TOC content (11.9–20.7%). In contrast, the organic matter micropores in brittle deformed shale may be limited by tectonic stress and retain a high CO2 gas adsorption capacity. Organic matter content can determine the basis of gas adsorption, and shales with low organic matter content also have low adsorption capacity. The tectonic stress background and deformation style can affect the present adsorption capacity of shale, with brittle deformed shale having little or no effect and ductile deformed shale having a significant decrease in the gas adsorption capacity of micropores.
N2 gas adsorption analyses have been used to measure the adsorption capacity in nanopores of pore size distribution from 0.37 nm to 200 nm using N2 at −196 °C. Figure 7 displays the N2 adsorption/desorption curves of three shale groups; the desorption curve is always on top of the adsorption curve, resulting in a loop [12,38]. The N2 adsorption curves of both UDS and BDS samples are of H2-type. This indicates that the pores are mainly ink-flask-type. In contrast, the N2 adsorption curves of DDS samples are of H3-type (Figure 7c). It means the pores are mainly fissure-type. As presented in Table 2, undeformed shale has the highest maximum nitrogen adsorption capacity. It ranges from 17.75 to 29.59 mL/g, with an average of 22.12 mL/g. Brittle deformed shale comes next. Its adsorption capacity ranges from 13.95 to 20.15 mL/g, with an average of 16.14 mL/g. Ductile deformed shale has the minimum adsorption capacity. It ranges from 3.23 to 6.58 mL/g, with an average of 4.65 mL/g. In the nanopore range of 0.37–200 nm, the tectonic stress background and structural deformation style significantly affect the nitrogen adsorption capacity of shale, with brittle deformed shale having less effect as the deformation intensity and deformation style vary, while ductile deformed shale significantly reduces the gas adsorption capacity of the nanopores. Combined with the previous changes in CO2 micropore adsorption capacity, brittle tectonic deformation mainly has a greater effect on the mesopores and macropores in organic nanopores, while ductile tectonic deformation produces a greater weakening effect on the all-scale micropores, mesopores, and macropores in organic nanopores.

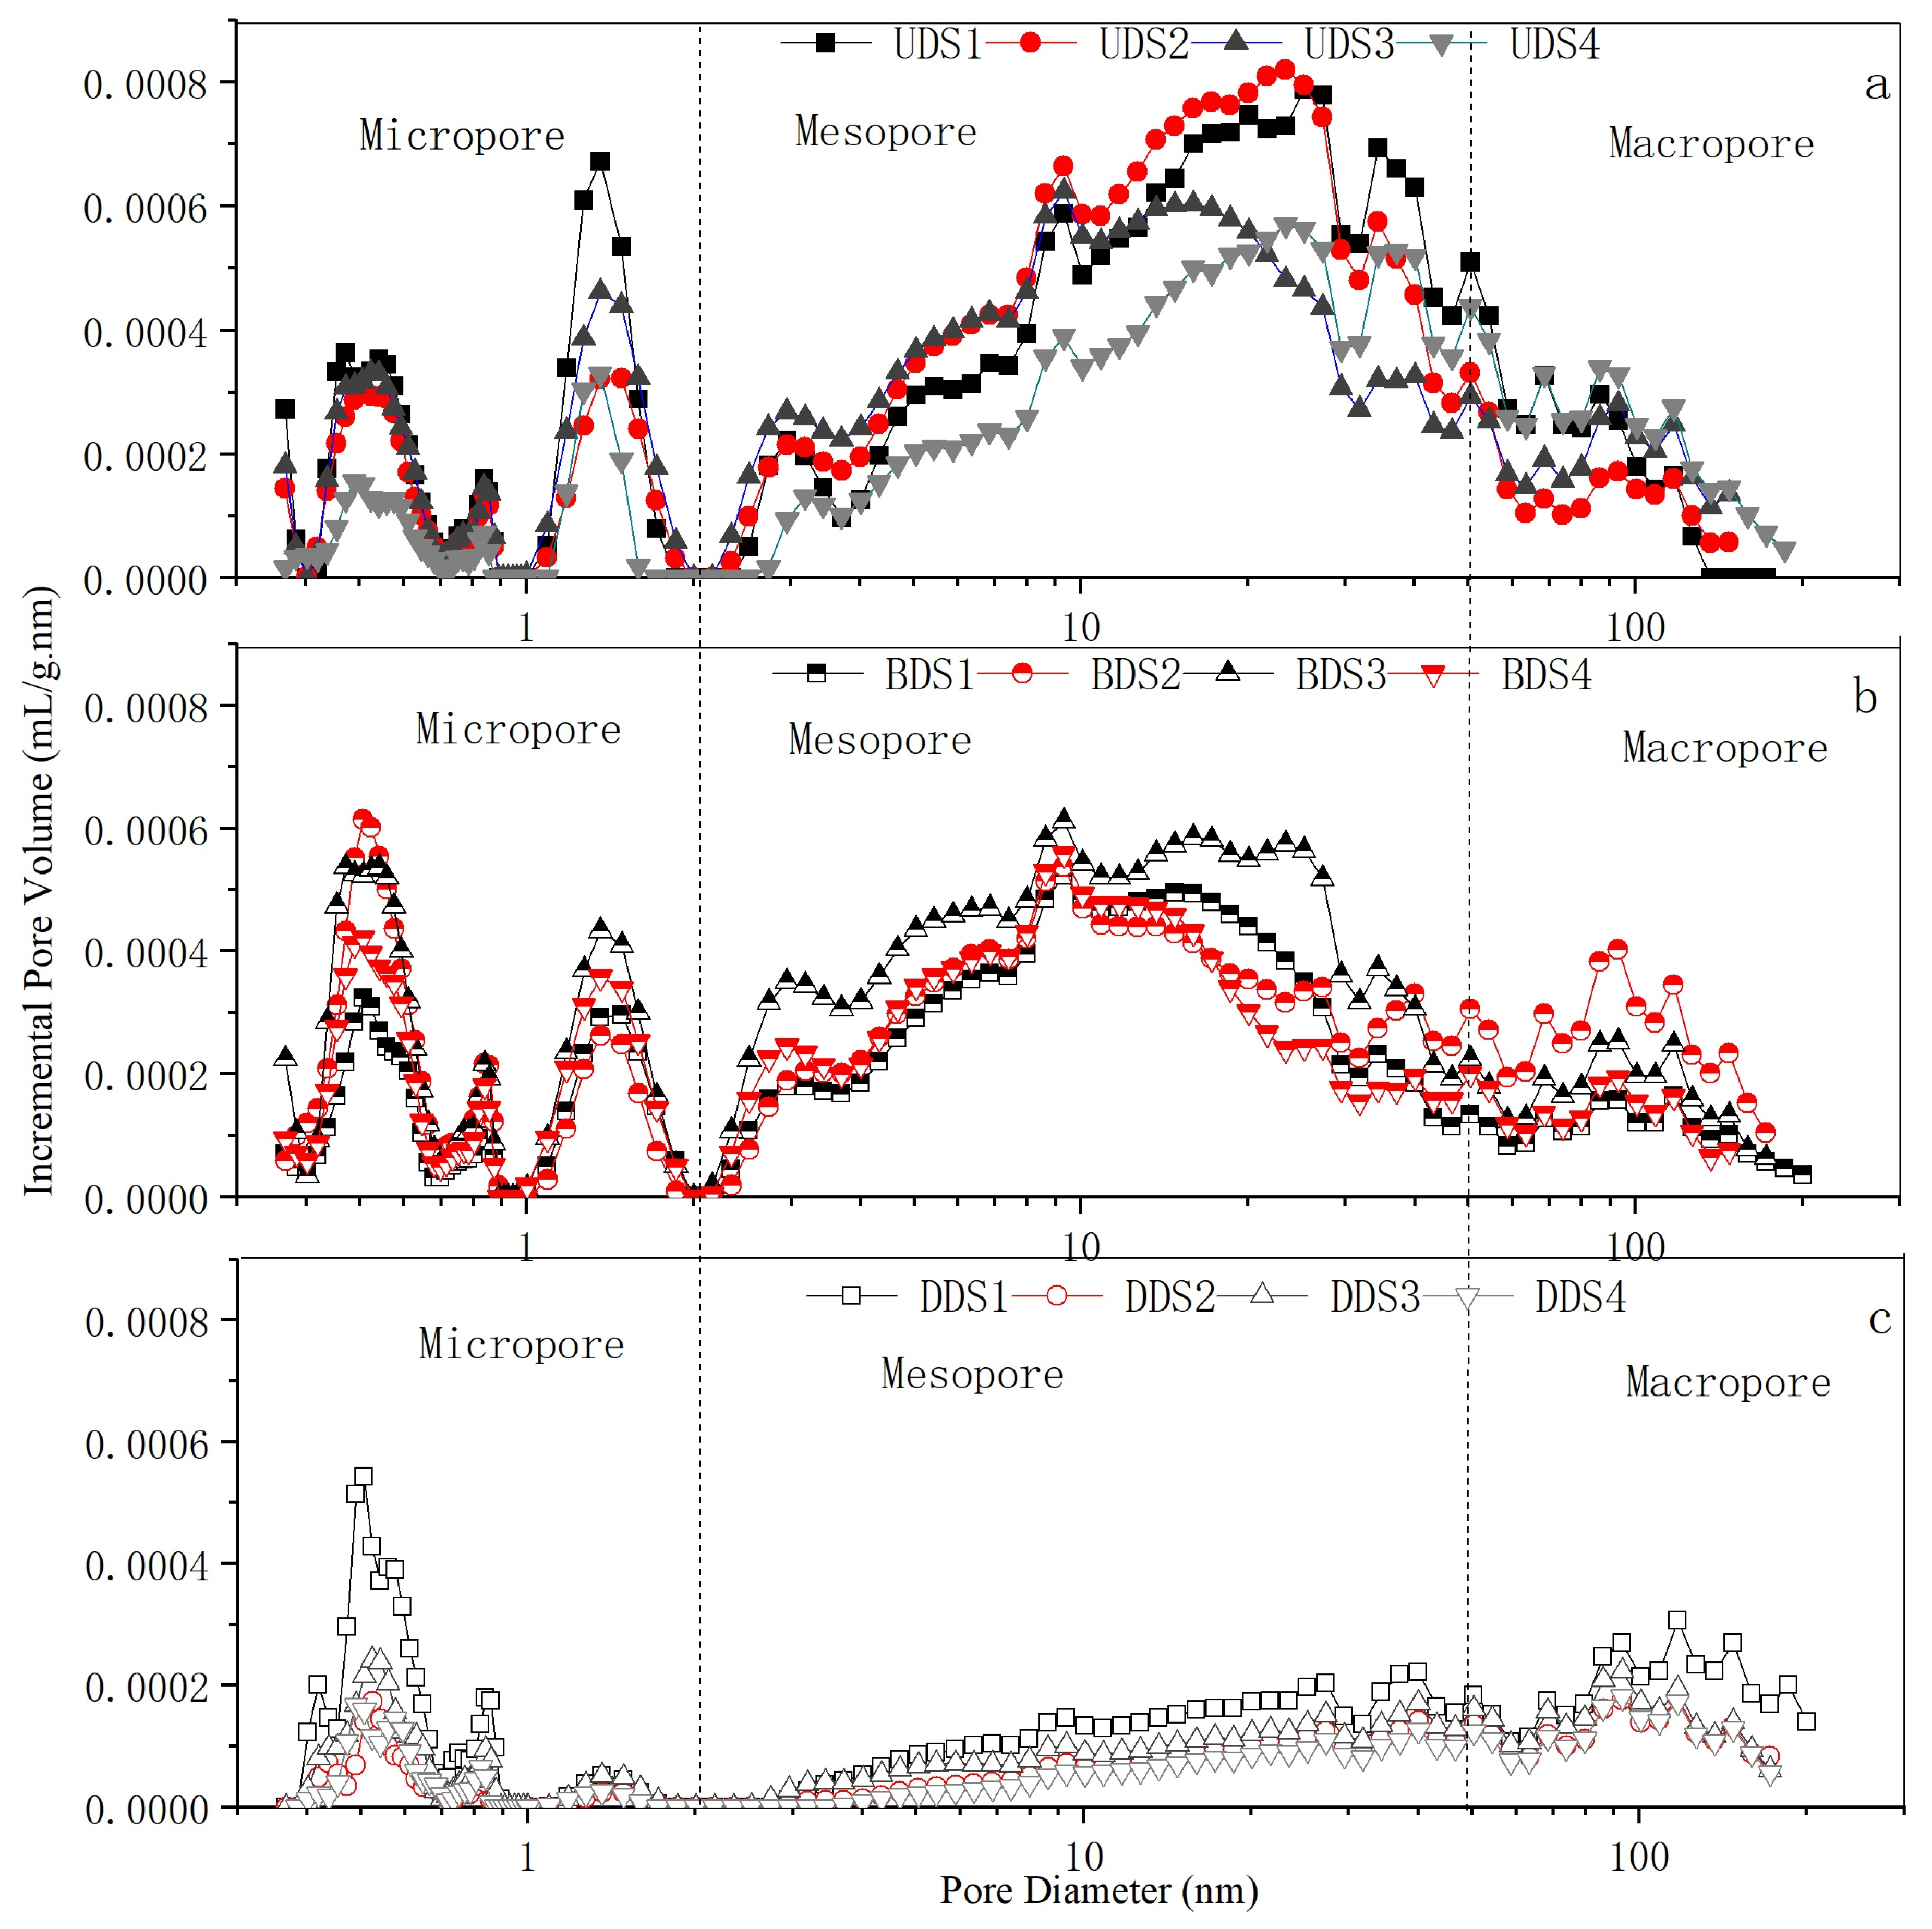
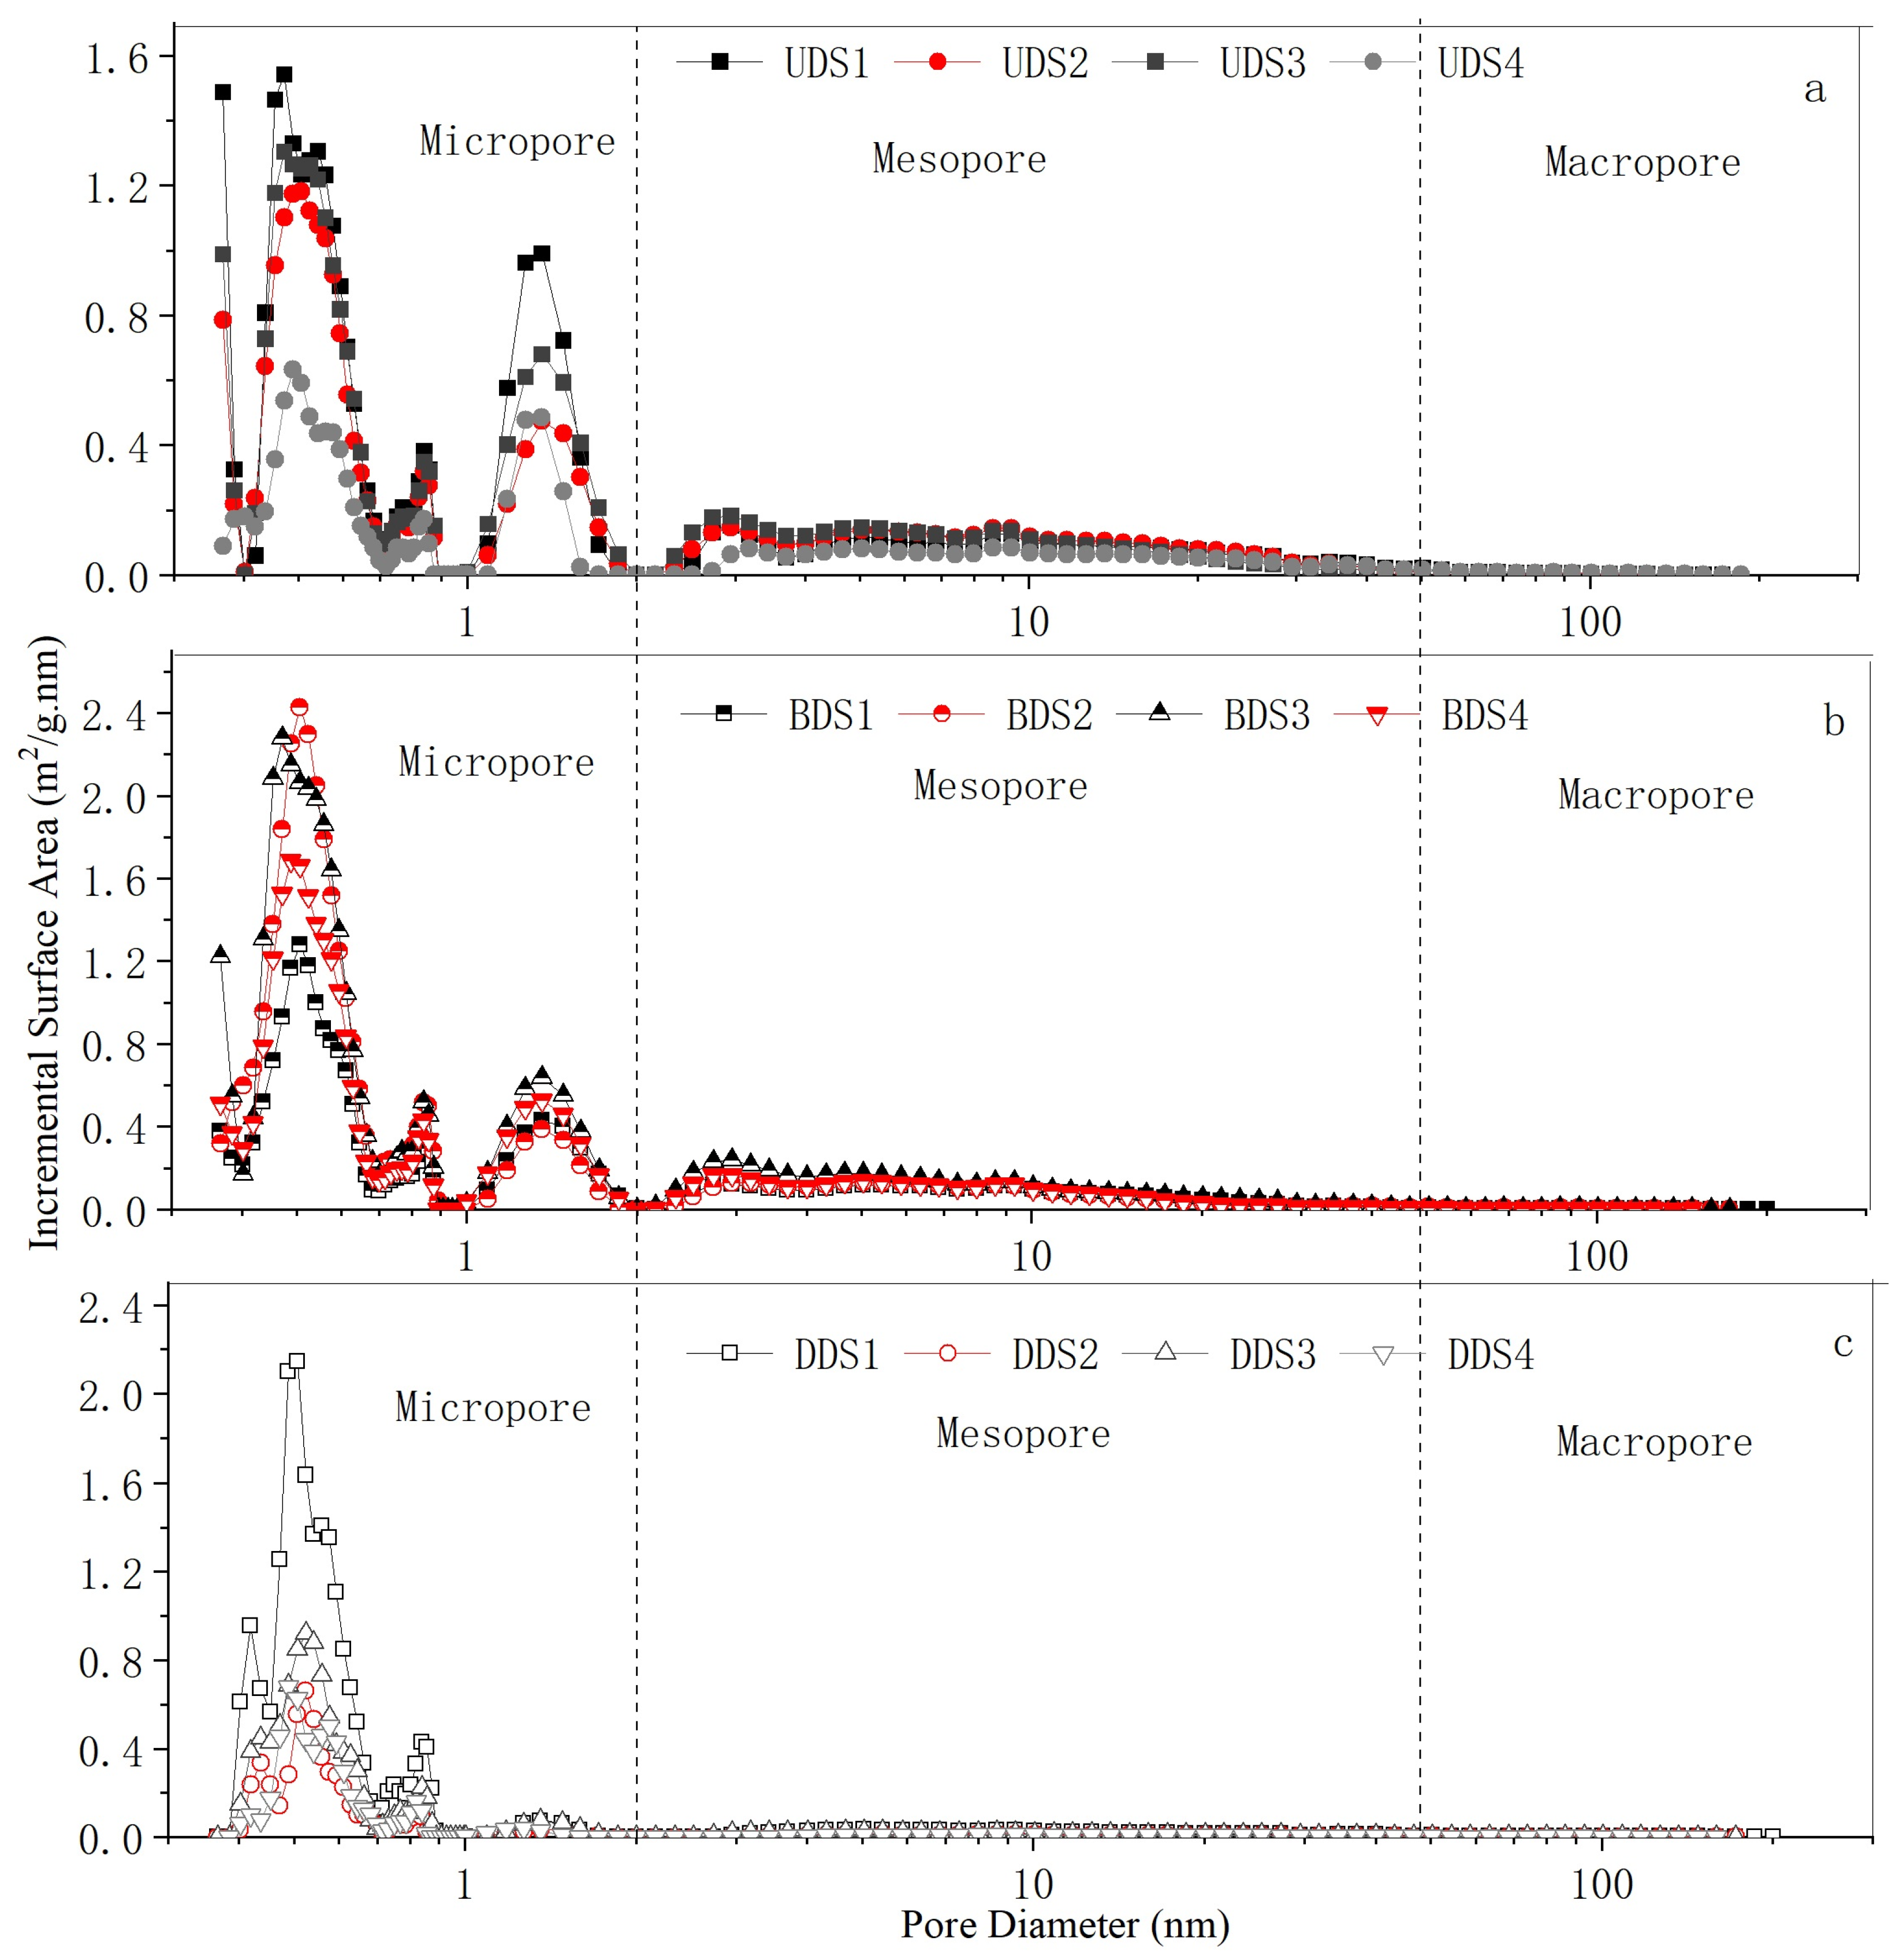
3.4. Pore Structure from LTGA

The pore structure was derived by analysis of the combined N2 and CO2 gas adsorption data by the same calculation models of density function theory (DFT). The development of density function theory (DFT) models has enhanced our understanding of gas adsorption in well-ordered systems compared to traditional models [12,41]. DFT calculation models offer a more reliable way for pore size analysis across all nanopores [39,40]. According to SEM picture analysis, 0.33–200 nm can represent the pore size of most organic matter pores. Low-temperature gas adsorption analyses measure pore size distributions (PSD) of micropores (0.33–2 nm), mesopores (2–50 nm), and macropores (50–200 nm). Two CO2 and N2 gas adsorption methods were combined using incremental PV (Figure 8) and SA plots (Figure 9). In Figure 8 and Figure 9, DFT-model incremental curves against pore diameter accurately reflect pore size distributions.
In terms of total nanopore volume, there is little difference between the organic matter nanopore volume of undeformed shale and brittle deformed shale. The total pore volume of undeformed shale is in the range of 20.01–29.15 μL/g, with an average of 25.5 μL/g (Table 2). The total pore volume of brittle deformed shale is in the range of 20.03–29.73 μL/g, with an average of 24.31 μL/g. The total pore volume of ductile deformed shale is in the range of 5.92–14.4 μL/g, with an average of 8.85 μL/g. In terms of the percentage of the pore volume of different pore structures, the pore volume of undeformed shale and brittle deformed shale is dominated by mesopores, whereas the structure of pore volume of ductile deformed shale is more balanced (Figure 10), with a decrease in the percentage of mesopores and an increase in micropores and macropores.
The Dubinin–Radushkevich (DR) and Brunauer–Emmett–Teller (BET) models calculate total surface area (SA) using CO2 and N2 adsorption data, respectively. Table 3 shows SA values calculated by different models. Brittle deformed shales always have a higher specific surface area, benefiting from a higher TOC and limited influence by tectonic stresses. The structure of the pore volume of all samples had the highest proportion of mesopore volume, but the structure of the pore’s specific surface area of all samples had the largest proportion of microporous contribution (>80%) to the specific surface area. Both in terms of pore volume and specific surface area, tectonic deformation has a greater impact on meso- and macropores, while tectonic deformation has less impact on micropores (0.33–2 nm).
In general, brittle deformation has a limited effect on the total pore volume and total pore specific surface area of organic pores in shale, while ductile deformation significantly reduces the pore volume and specific surface area of organic pores. In terms of pore structure, the distribution of pore volume and specific surface area of brittle deformed shale is not much different from that of undeformed shale. The pore volume is dominated by the significant dominance of mesopores, and the percentage of mesopore pore volume is greater than 50%. The specific surface area is dominated by micropores, with the percentage of microporous specific surface area greater than 80%, while the percentage of mesoporous specific surface area is greater than 10%. However, the distribution of pore volume of ductile deformed shale is more balanced, and the percentage of mesopore is 37.03%. The distribution of the specific surface area of ductile deformed shale is more extreme; the percentage of microporous area is greater than 90%.

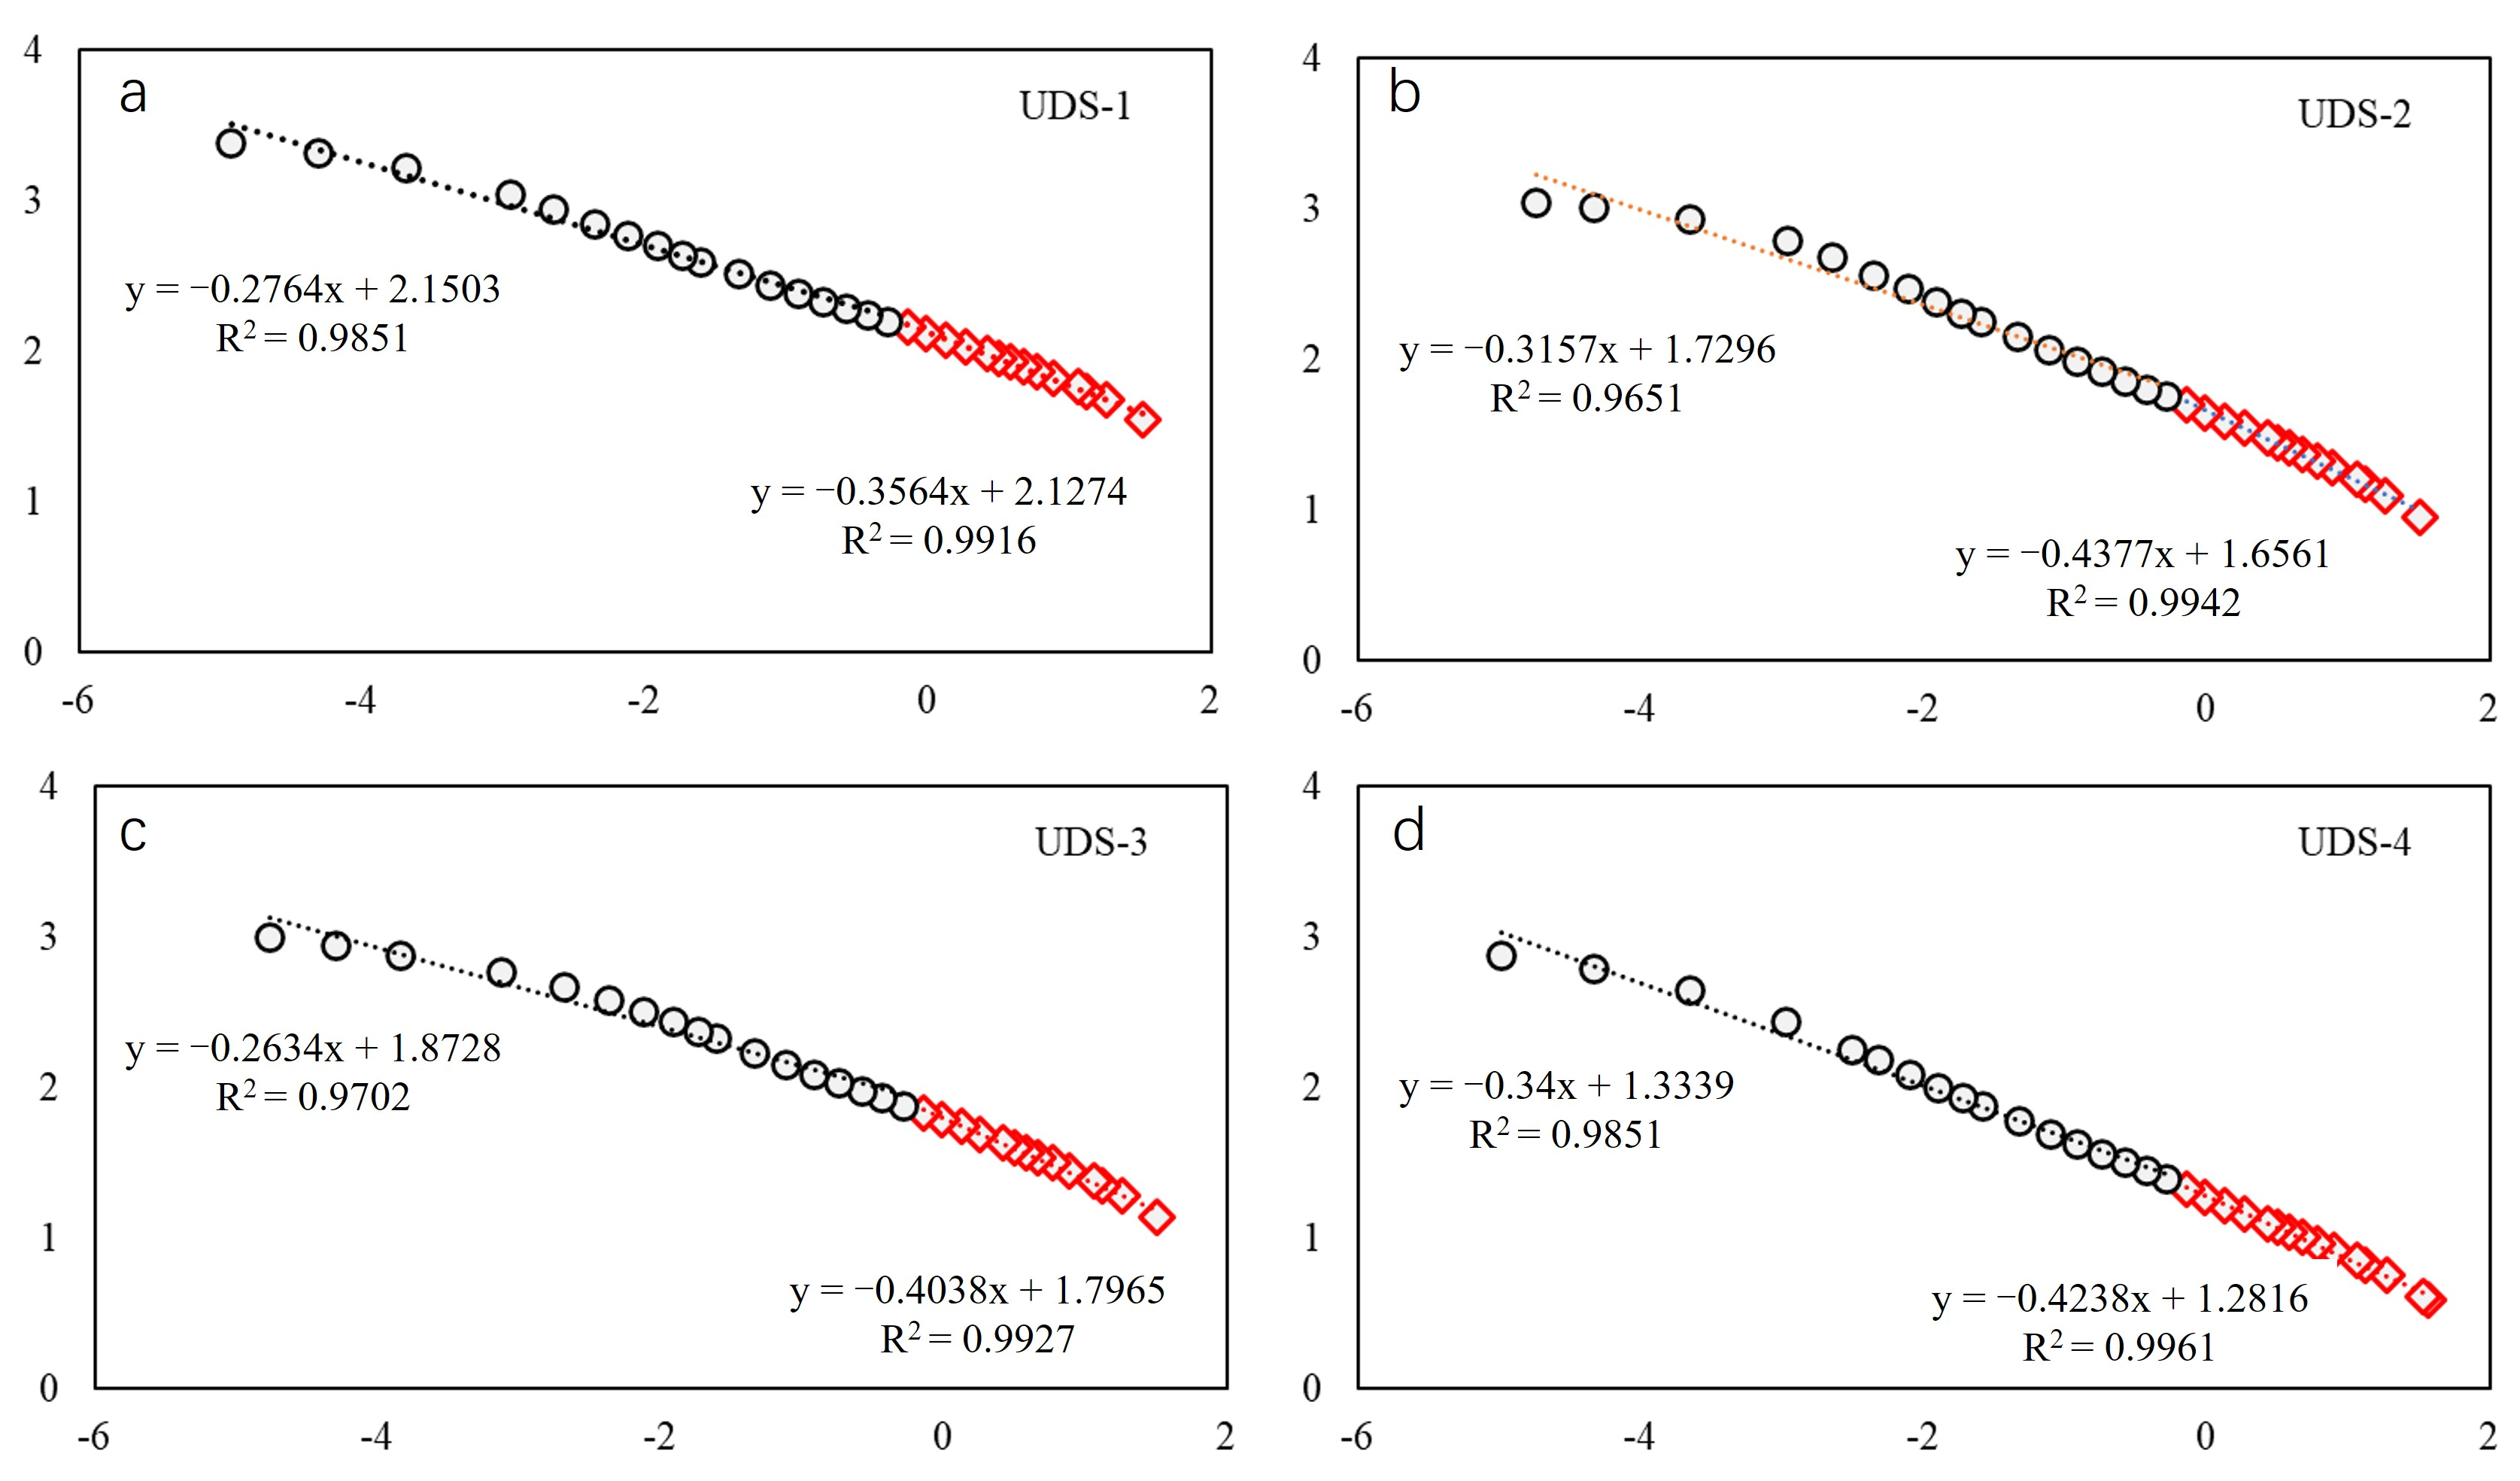
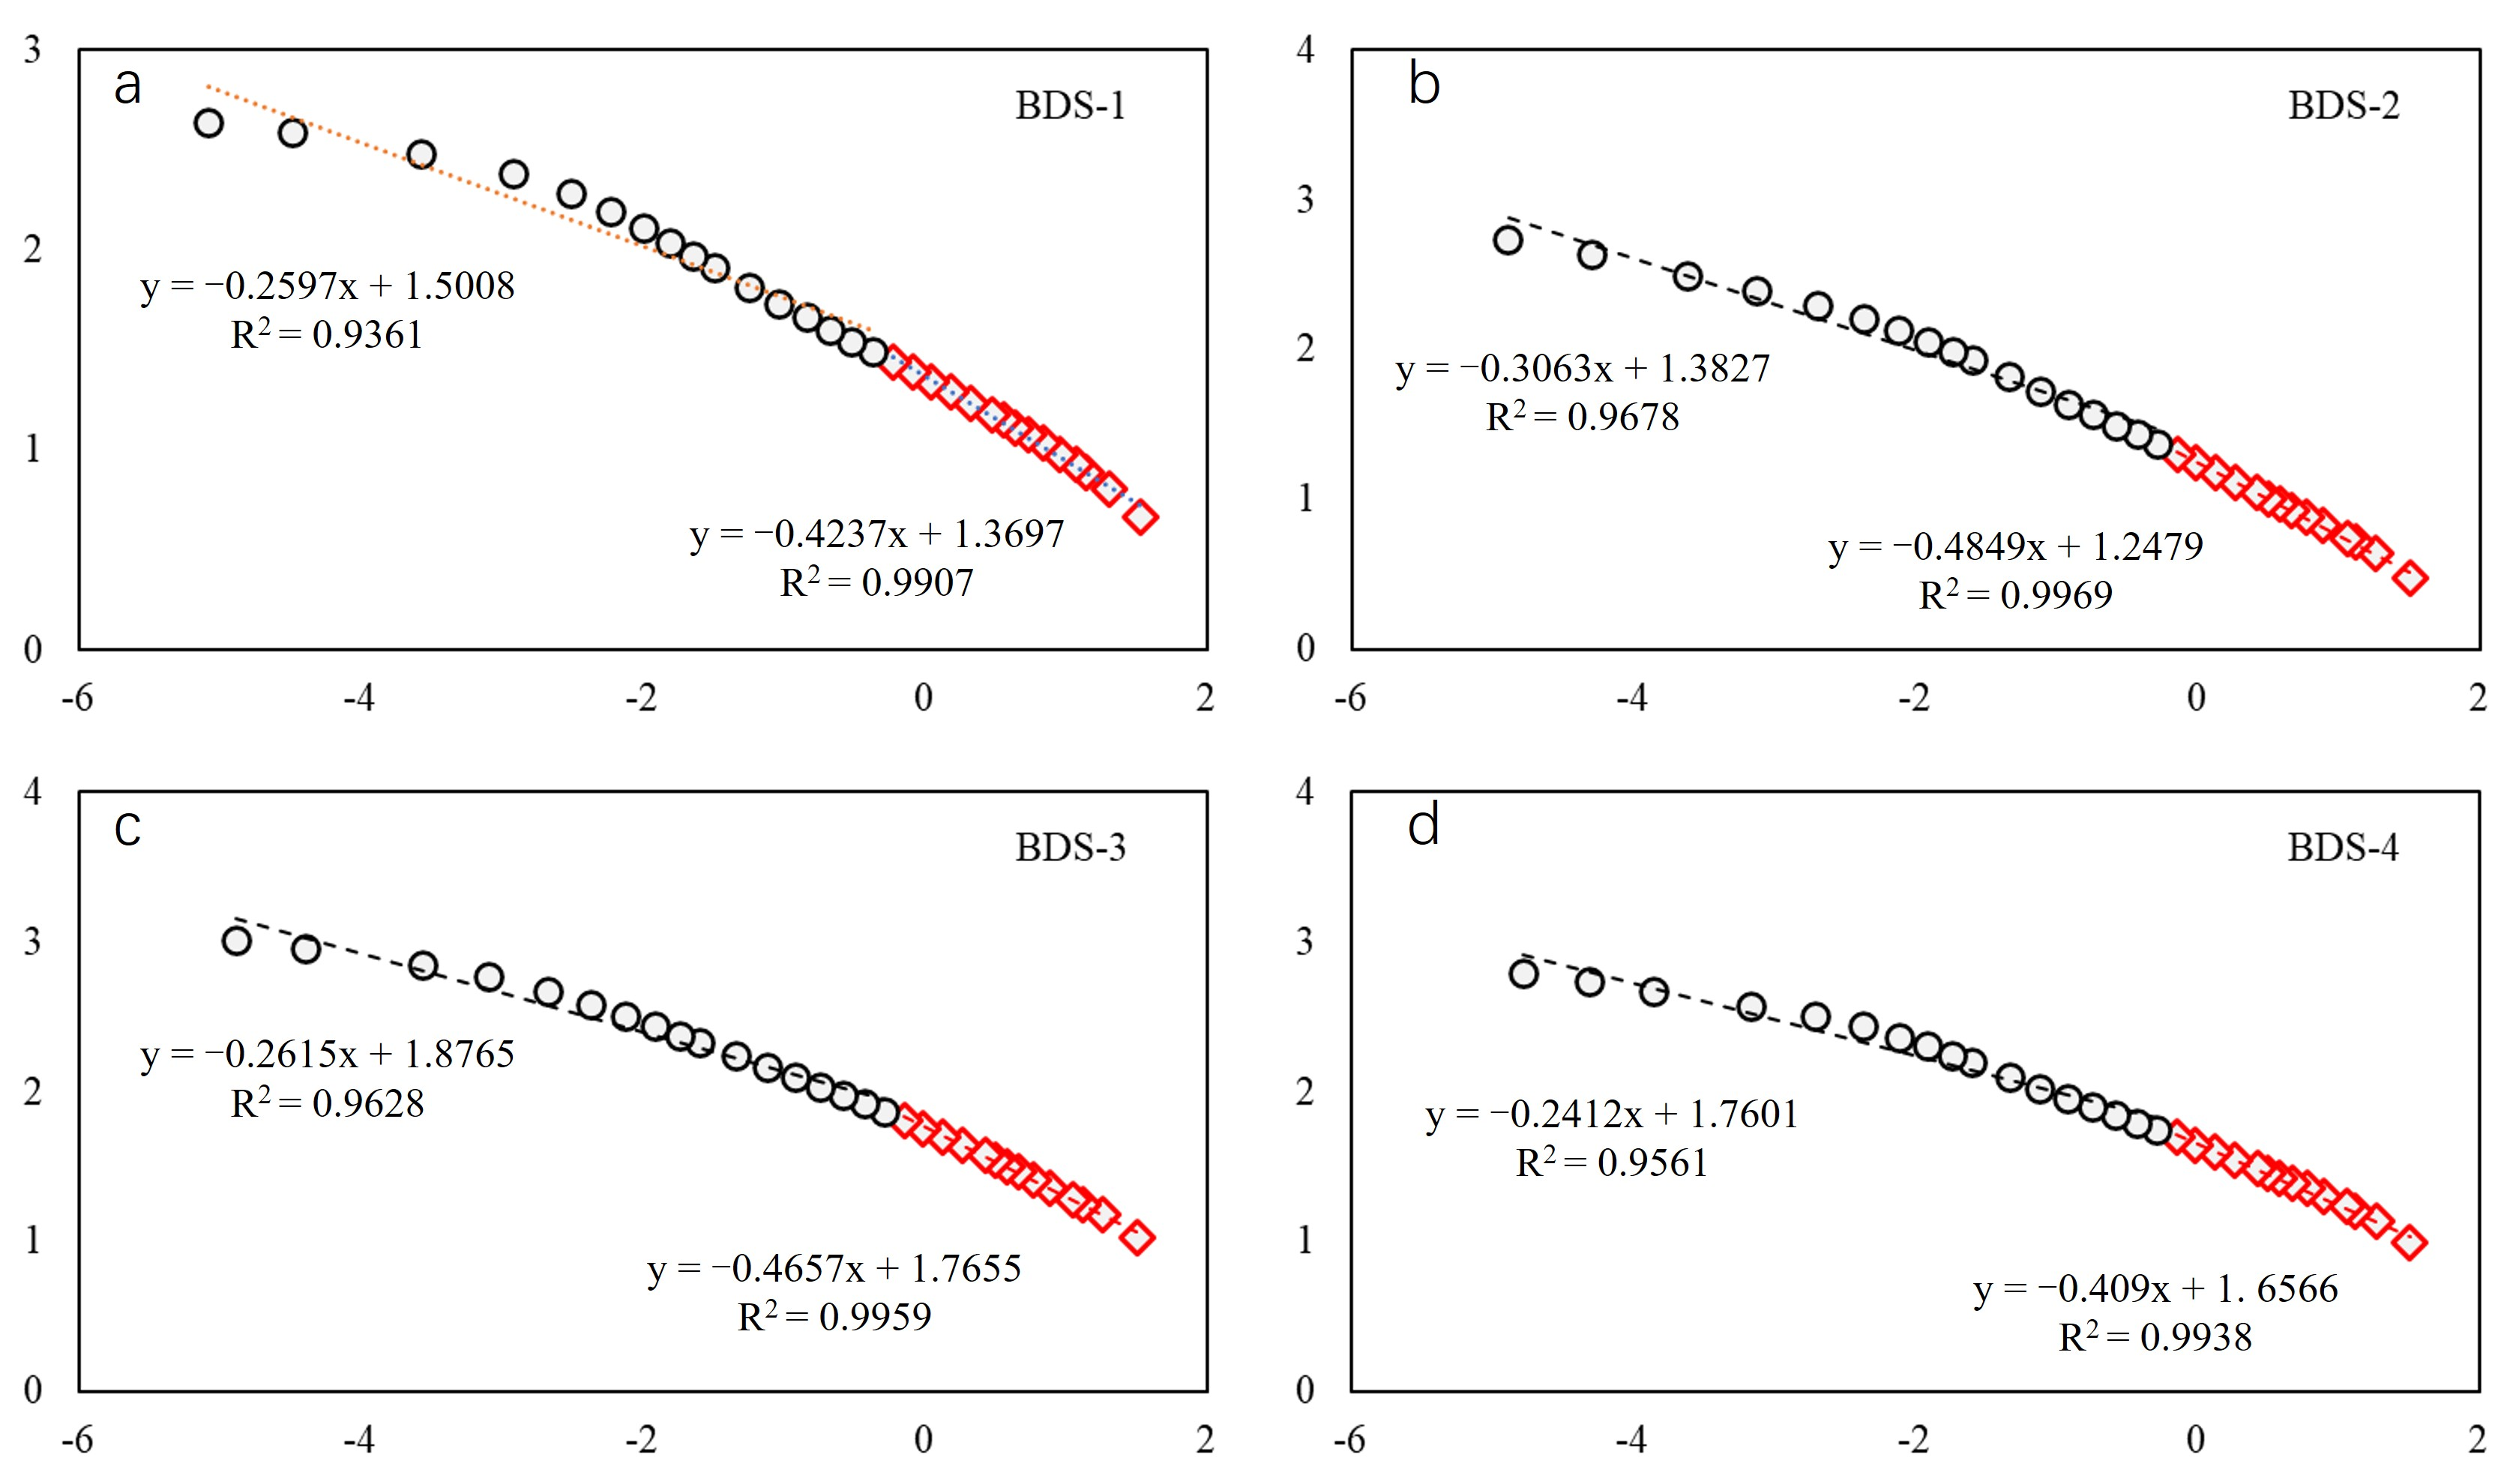
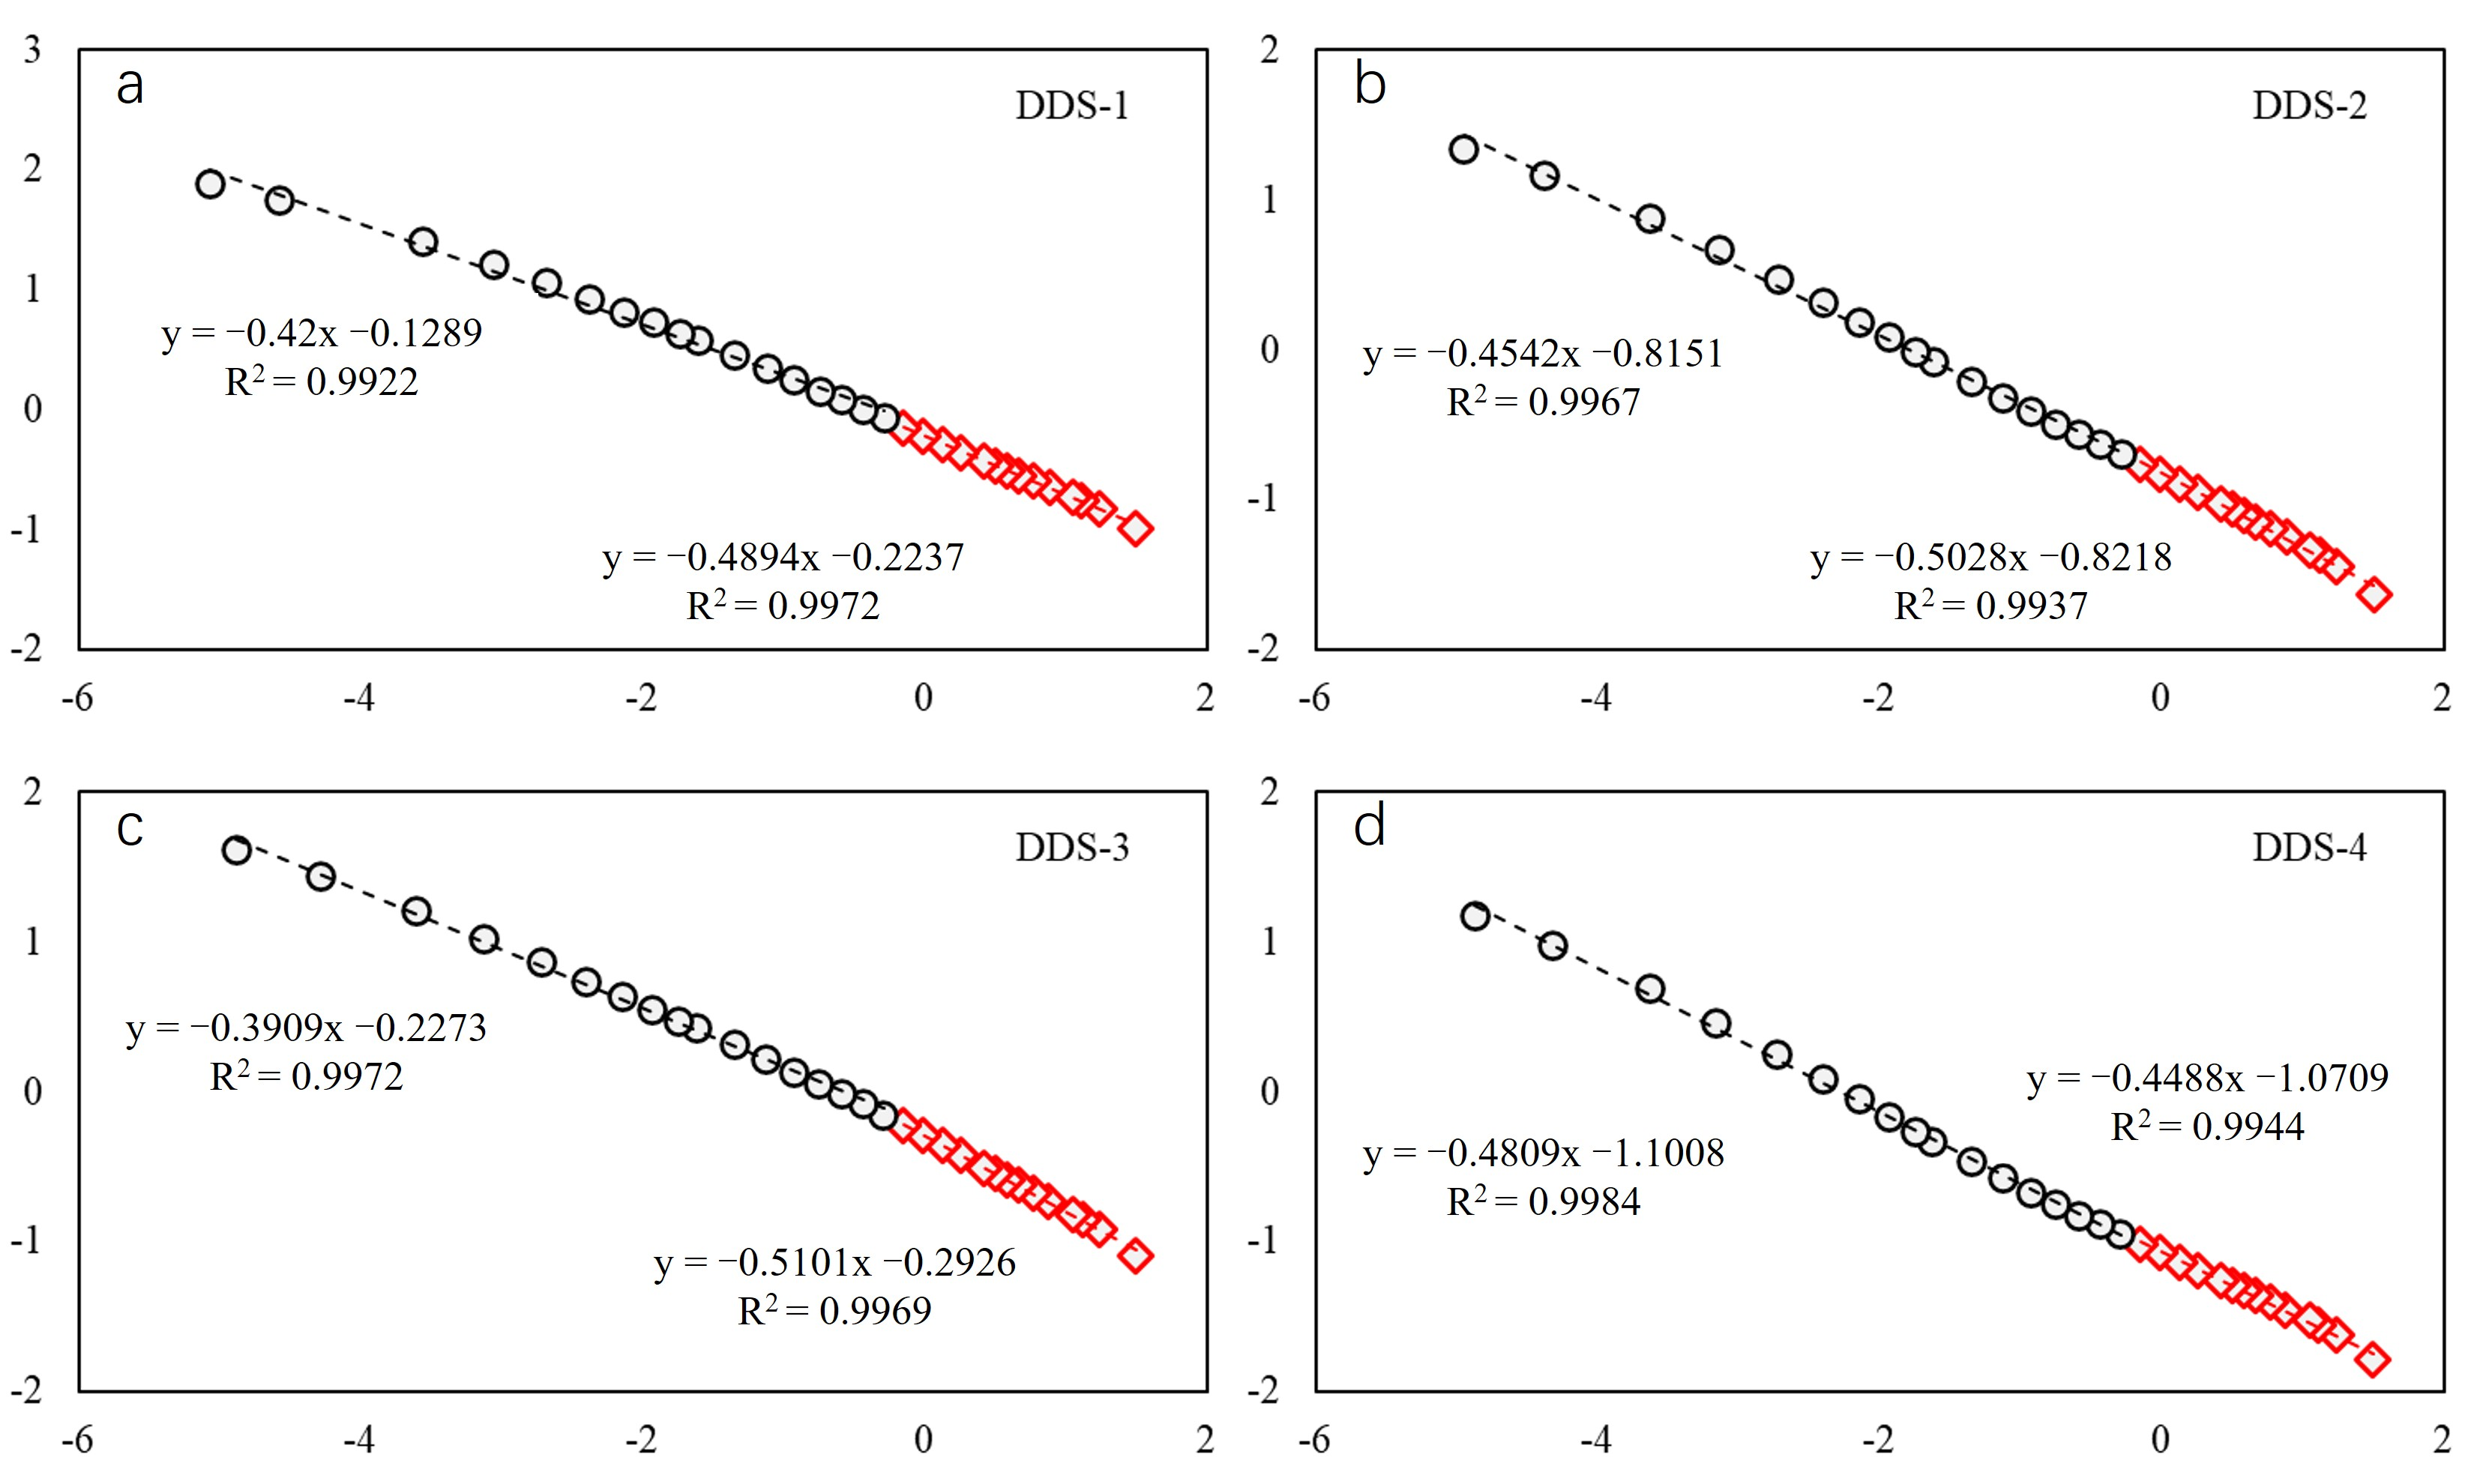
3.5. Fractal Dimensions from the N2 Adsorption

This study utilized the FHH model to calculate the fractal dimension and analyzed N2 adsorption/desorption data to evaluate the complexity of shale and kerogen nanopores. The fairly good fitting results (see Figure 11, Figure 12 and Figure 13 and Table 4) indicate different fractal characteristics at the two intervals. Based on these phenomena, the fractal dimensions Ds and Dm were calculated at the relative pressure (P/P0) range of 0–0.45 and 0.45–1 using the FHH equation [48]. Based on previous research results [29], at low relative pressures (P/P0 < 0.45), it mainly reflects the characteristics of micropore surfaces, which is related to monolayer adsorption under the action of van der Waals forces. At high relative pressures (P/P0 > 0.45), capillary condensation occurs in mesopores and macropores, affecting the calculation of the fractal dimension and reflecting the complexity of mesopore and macropore structures. The fitting equations, correlation coefficients of R2, and fractal dimension values (Ds and Dm) are summarized in Table 4. Curve fitting for the N2 adsorption fractal dimension characteristics is shown in Figure 11, Figure 12 and Figure 13, yielding an excellent correlation coefficient (R2) ranging from 0.9361 to 0.9984 (Table 4), showing a strong fit between them. In this research, we used the surface fractal dimension (Ds) at 0 < P/P0 < 0.45 to characterize the roughness of shale pore surfaces. This Ds dimension reflects the influence of the van der Waals forces phenomenon of monolayer adsorption in micropores with diameters smaller than 3 nm and dominated by adsorption pores containing adsorbed gas. A larger Ds indicates rougher pore surfaces. Rougher surfaces mean more adsorption sites on the pore surface, resulting in a higher shale adsorption capacity (Table 4). On the other hand, the matrix fractal dimension (Dm) at 0.45 < P/P0 < 1 reflects the heterogeneity and complexity within the pore structure, especially indicating the spatial complexity and irregularity of mesopores and macropores with diameters larger than 3 nm, mainly composed of flow-through pores containing free gas [49]. It is affected by the capillary condensation effect. A higher Dm value corresponds to a more intricate pore structure. Such a complex structure makes shale gas desorption, diffusion, and percolation more difficult.
The FHH plots of four undeformed shale samples are illustrated in Figure 11. The UDS fractal dimension Ds values range from 2.5623 to 2.6436, with a mean of 2.5946. The UDS fractal dimension Dm values are from 2.66 to 2.7366, with an average of 2.7011, indicating high pore structure complexity. The fractal dimension of brittle deformed shale is similar to undeformed shale samples (Figure 12). The BDS fractal dimension Ds values range from 2.5151 to 2.591, with a mean of 2.5542. The BDS fractal dimension Dm values are from 2.6937 to 2.7588, with an average of 2.7328. The BDS fractal dimension Ds values are slightly lower than UDS values, while Dm is slightly higher than UDS, indicating a bit of higher complexity of organic pore structure in brittle deformed shale samples. Ductile deformed shale exhibits different fractal dimension characteristics from undeformed shale and brittle deformed shale (Figure 13). The DDS fractal dimension Ds values range from 2.4899 to 2.5512, with a mean of 2.5122. The DDS fractal dimension Dm values are from 2.5191 to 2.6091, with an average of 2.5635. The fractal dimensions Ds and Dm of ductile deformed shale are relatively consistent, and both are about 2.5, indicating that the complexity of all scale organic pore structures is similar and both are relatively low. Compared with UDS and BDS, the fractal dimension Ds and Dm of ductile deformed shale are both very low (Table 4), indicating that the complexity of different pore structures of DDS are both lower than that of UDS and BDS. Especially, the value of Dm decreases from more than 2.7 in UDS and BDS to about 2.5 in DDS, which shows a significant decrease in the fractal dimension of mesopores and macropores in DDS, indicating that the complexity of mesopores and macropores in ductile deformed shale decreases significantly. The following discussion will cover the relationships between pore structures and fractal dimensions and the effects of different tectonic deformations on these organic pore features.

4. Discussion

4.1. Comparison of Pore Structure Fractal Characteristics Between Brittle and Ductile Deformation Shales

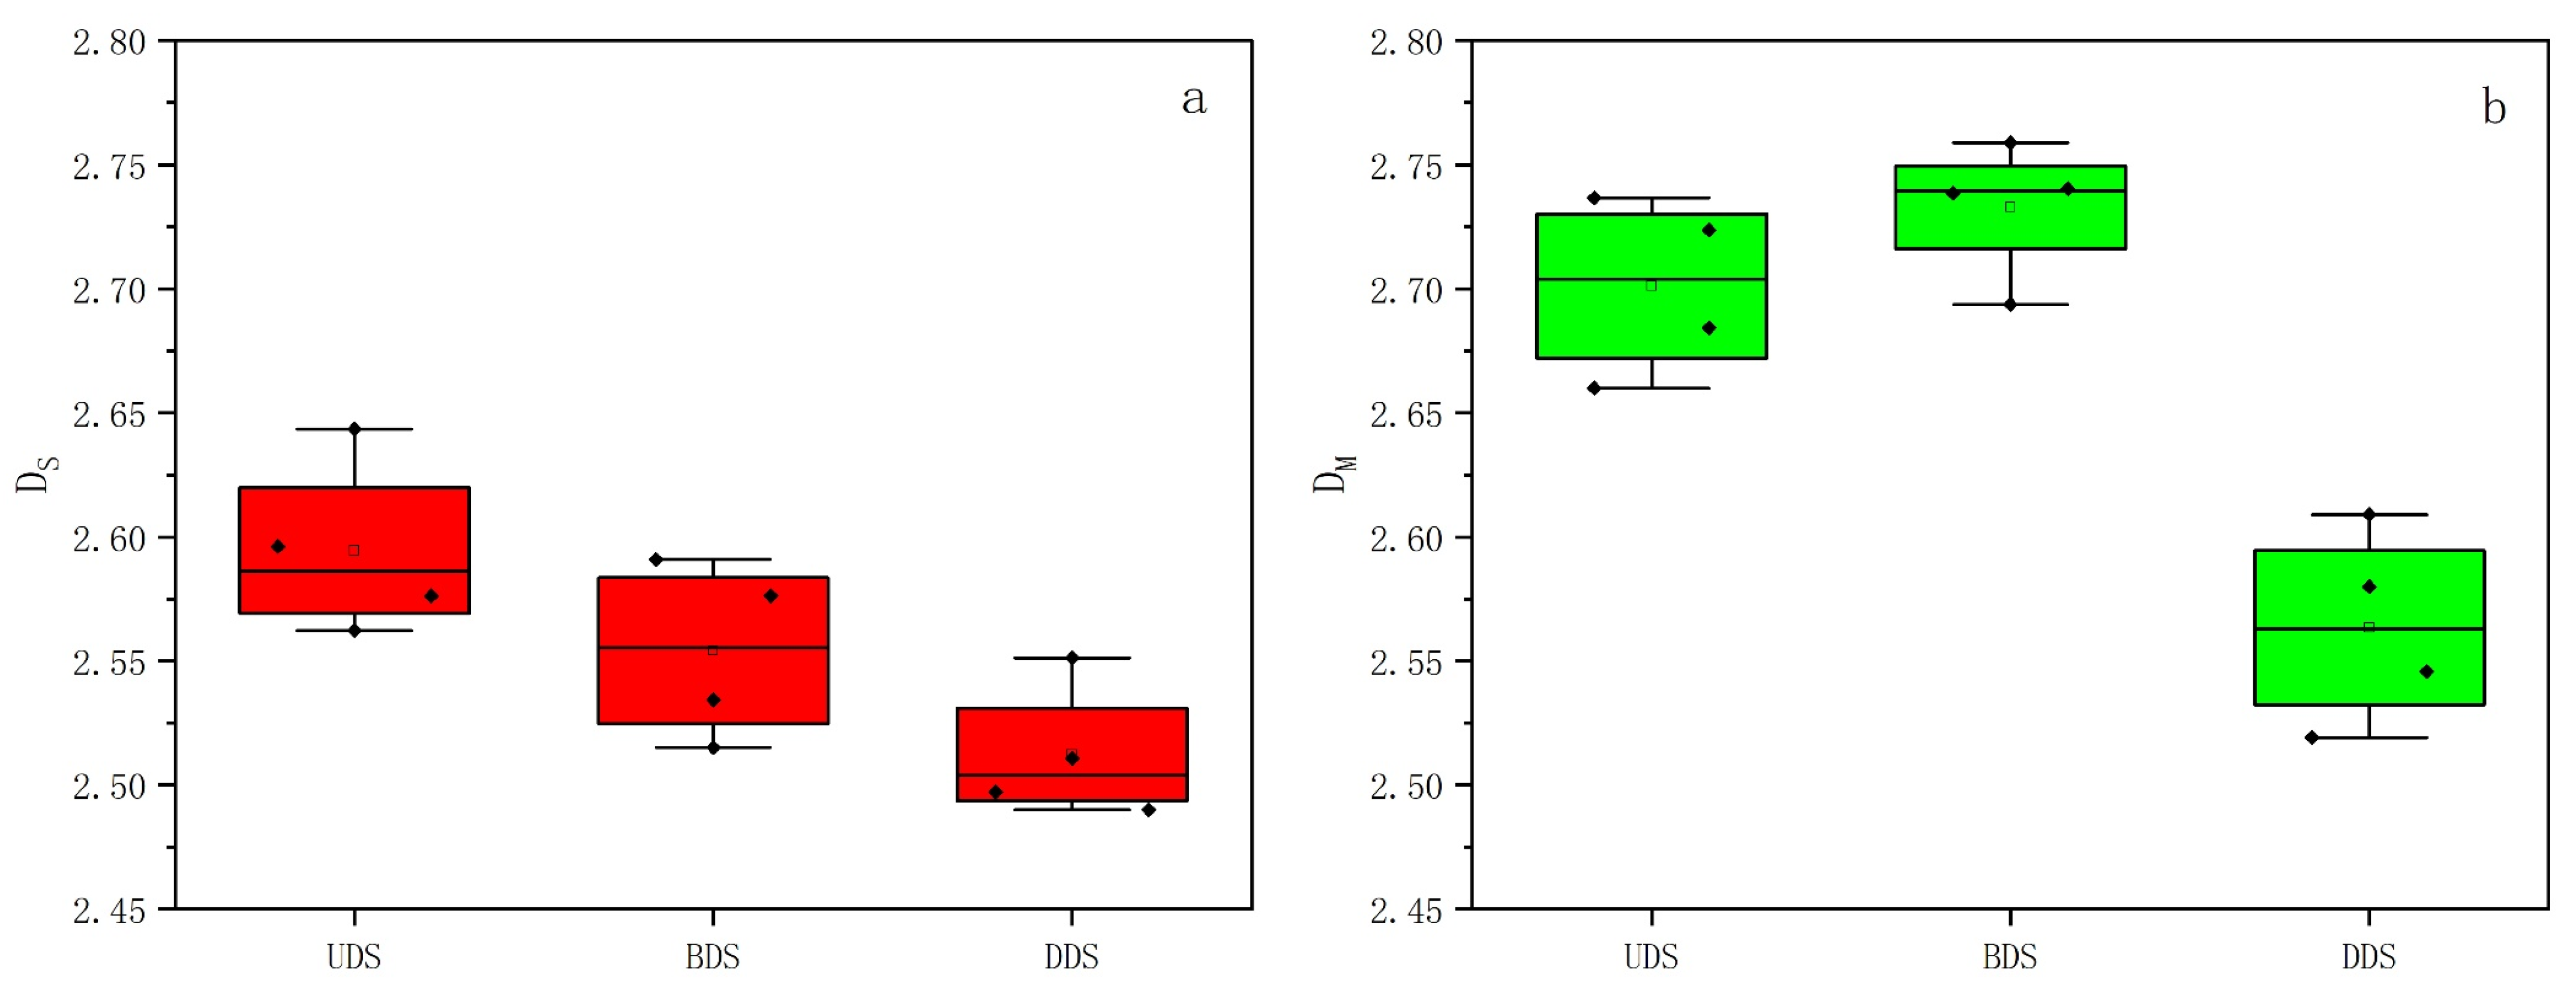
4.1.1. Differences in Fractal Dimensions

The fractal dimensions calculated from LTNA data show distinct differences between brittle deformed and ductile deformed shales. As presented in the results section, the average fractal dimension DS and DM for brittle deformed shales were 2.5542 and 2.7328, respectively. While for ductile deformed shales, they were 2.5122 and 2.5635, respectively. Both fractal dimension DS and DM of ductile deformed shale are lower than brittle deformed shales (Figure 14).This significant difference indicates that the organic nanopore network structure in the micropore, mesopore, and macropore range of brittle deformed shales is more complex than that of ductile deformed shales.
The development of fractures during brittle deformation is a major factor contributing to the higher DM in brittle deformed shales. When shale undergoes brittle deformation, tensile and shear fractures are formed [33]. These fractures can create a highly tortuous and branched pore network. For example, in a brittle deformed shale sample, a fracture may intersect with multiple intergranular and intragranular pores, connecting them in a complex way. The presence of these fractures increases the number of pore connection points and the irregularity of the pore network, which is reflected in the higher fractal dimension. In contrast, during ductile deformation, the rock deforms plastically, and the pore structure is more homogenized. The crystal plastic deformation and pressure solution creep processes tend to reduce the complexity of the organic pore network in the mesopore and macropore range. For instance, the alignment of minerals during crystal-plastic deformation can lead to a more regular arrangement of pores, resulting in a lower fractal dimension.

4.1.2. Impact of Deformation Type on Pore Structure Complexity

The different deformation types, brittle and ductile, have distinct impacts on the complexity of the shale pore structure, which can be well understood from the perspective of fractal characteristics. For brittle deformed shales, the formation of fractures is the key factor increasing pore structure complexity. The fractures not only increase the porosity and permeability of the shale but also create a complex network of pore connections. The large-scale fractures can act as main flow channels for gas, while the small-scale fractures can connect organic pores and other different types of pores, such as intergranular and intragranular pores. This complex pore network structure is reflected in the relatively high fractal dimension calculated from LTNA data. This is consistent with previous work on the development of high aspect ratios and high fractal dimensions in the strongly deformed Longmaxi Shale under strong tectonic stress [29]. It suggests that appropriate structure deformation of OM pores under tectonic deformation, especially brittle deformation, is conducive to the development of connectivity, but with the transformation of deformation to ductility and further increase of aspect ratio, the fractal dimension and pore connectivity will decrease.
In ductile deformed shales, the plastic deformation mechanisms, such as crystal plastic deformation and pressure–solution creep, lead to a different kind of pore structure complexity. The development of micro folds and foliations, as well as the preferred orientation of clay minerals and kerogen, can create a complex pore surface and pore size distribution. The low fractal dimension DM calculated from LTNA data for ductile deformed shales indicates that the macropore and mesopore structure is more homogenized and may have changed from the original ink-bottle type with complex edges to a simpler, narrower pore. This homogenized OM pore structure is beneficial for gas adsorption, as it maintains a larger specific surface area and adsorption sites for shale gas. However, the relatively lower fractal dimension calculated from LTNA data for ductile deformed shales implies that the mesopore and macropore network is less complex, which may result in a relatively lower gas flow rate compared to brittle deformed shales. In summary, brittle deformation mainly affects the fracture development of shale, while ductile deformation has a more significant impact on all-scale pore structures.

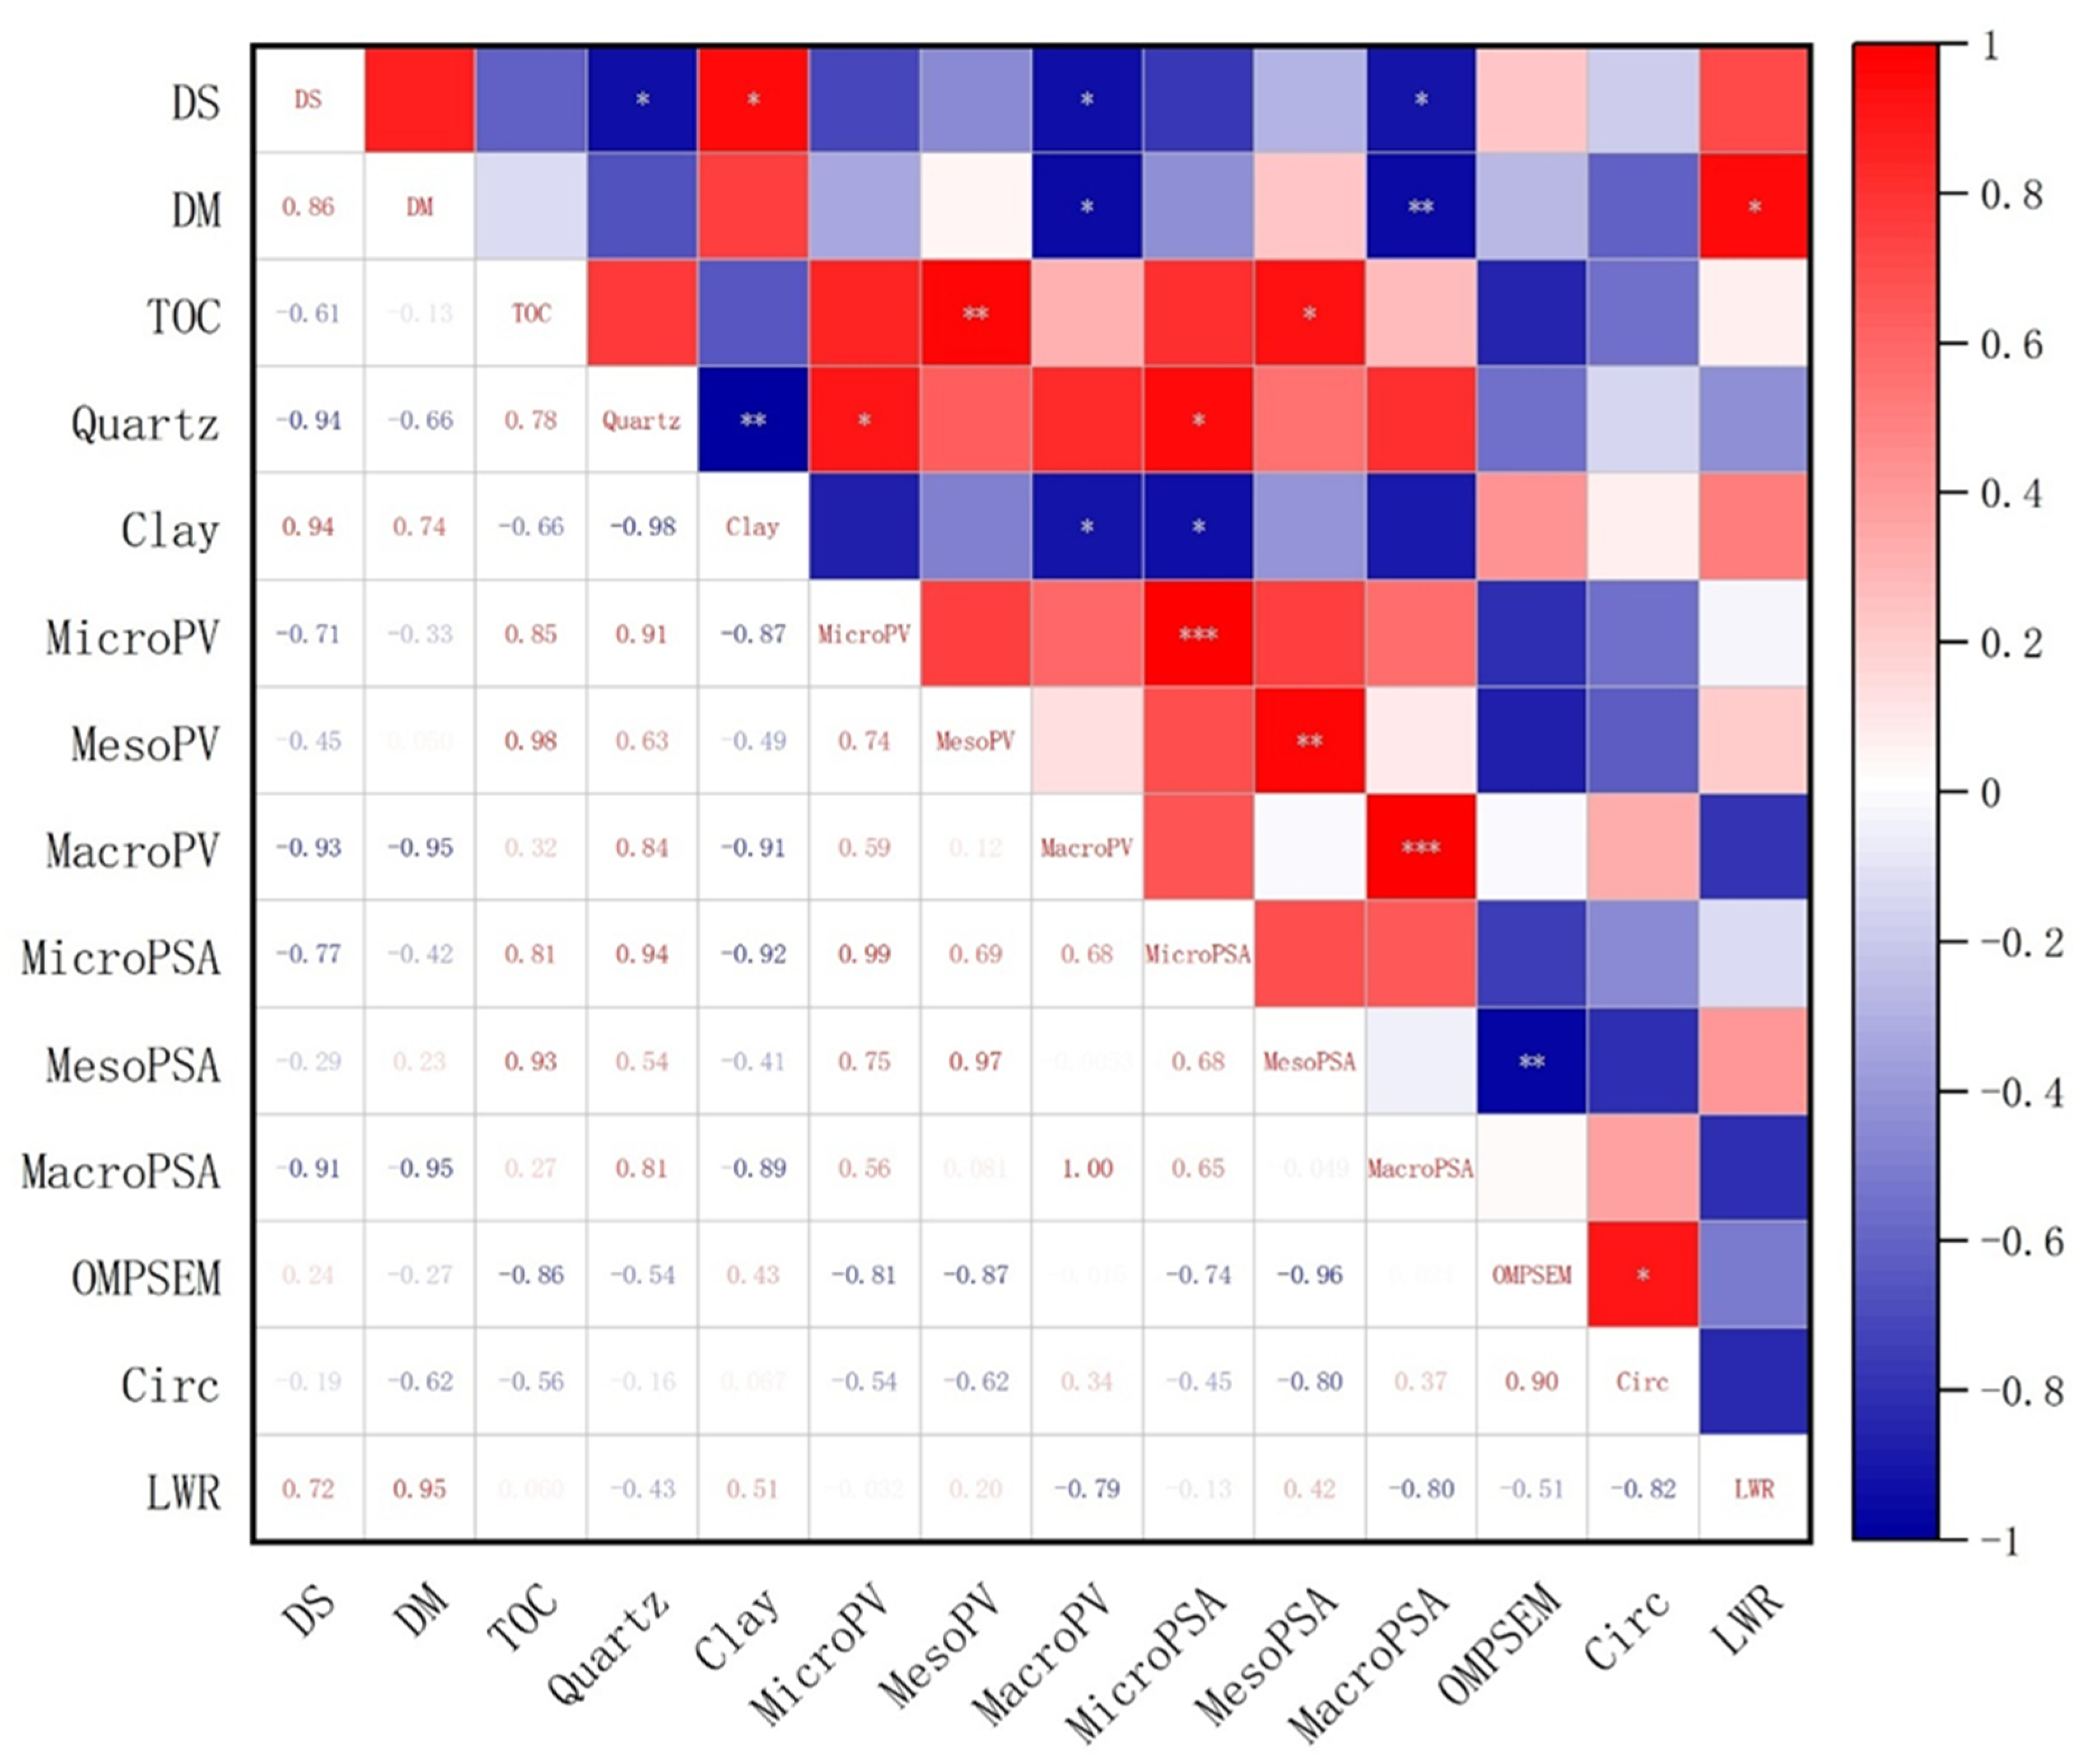
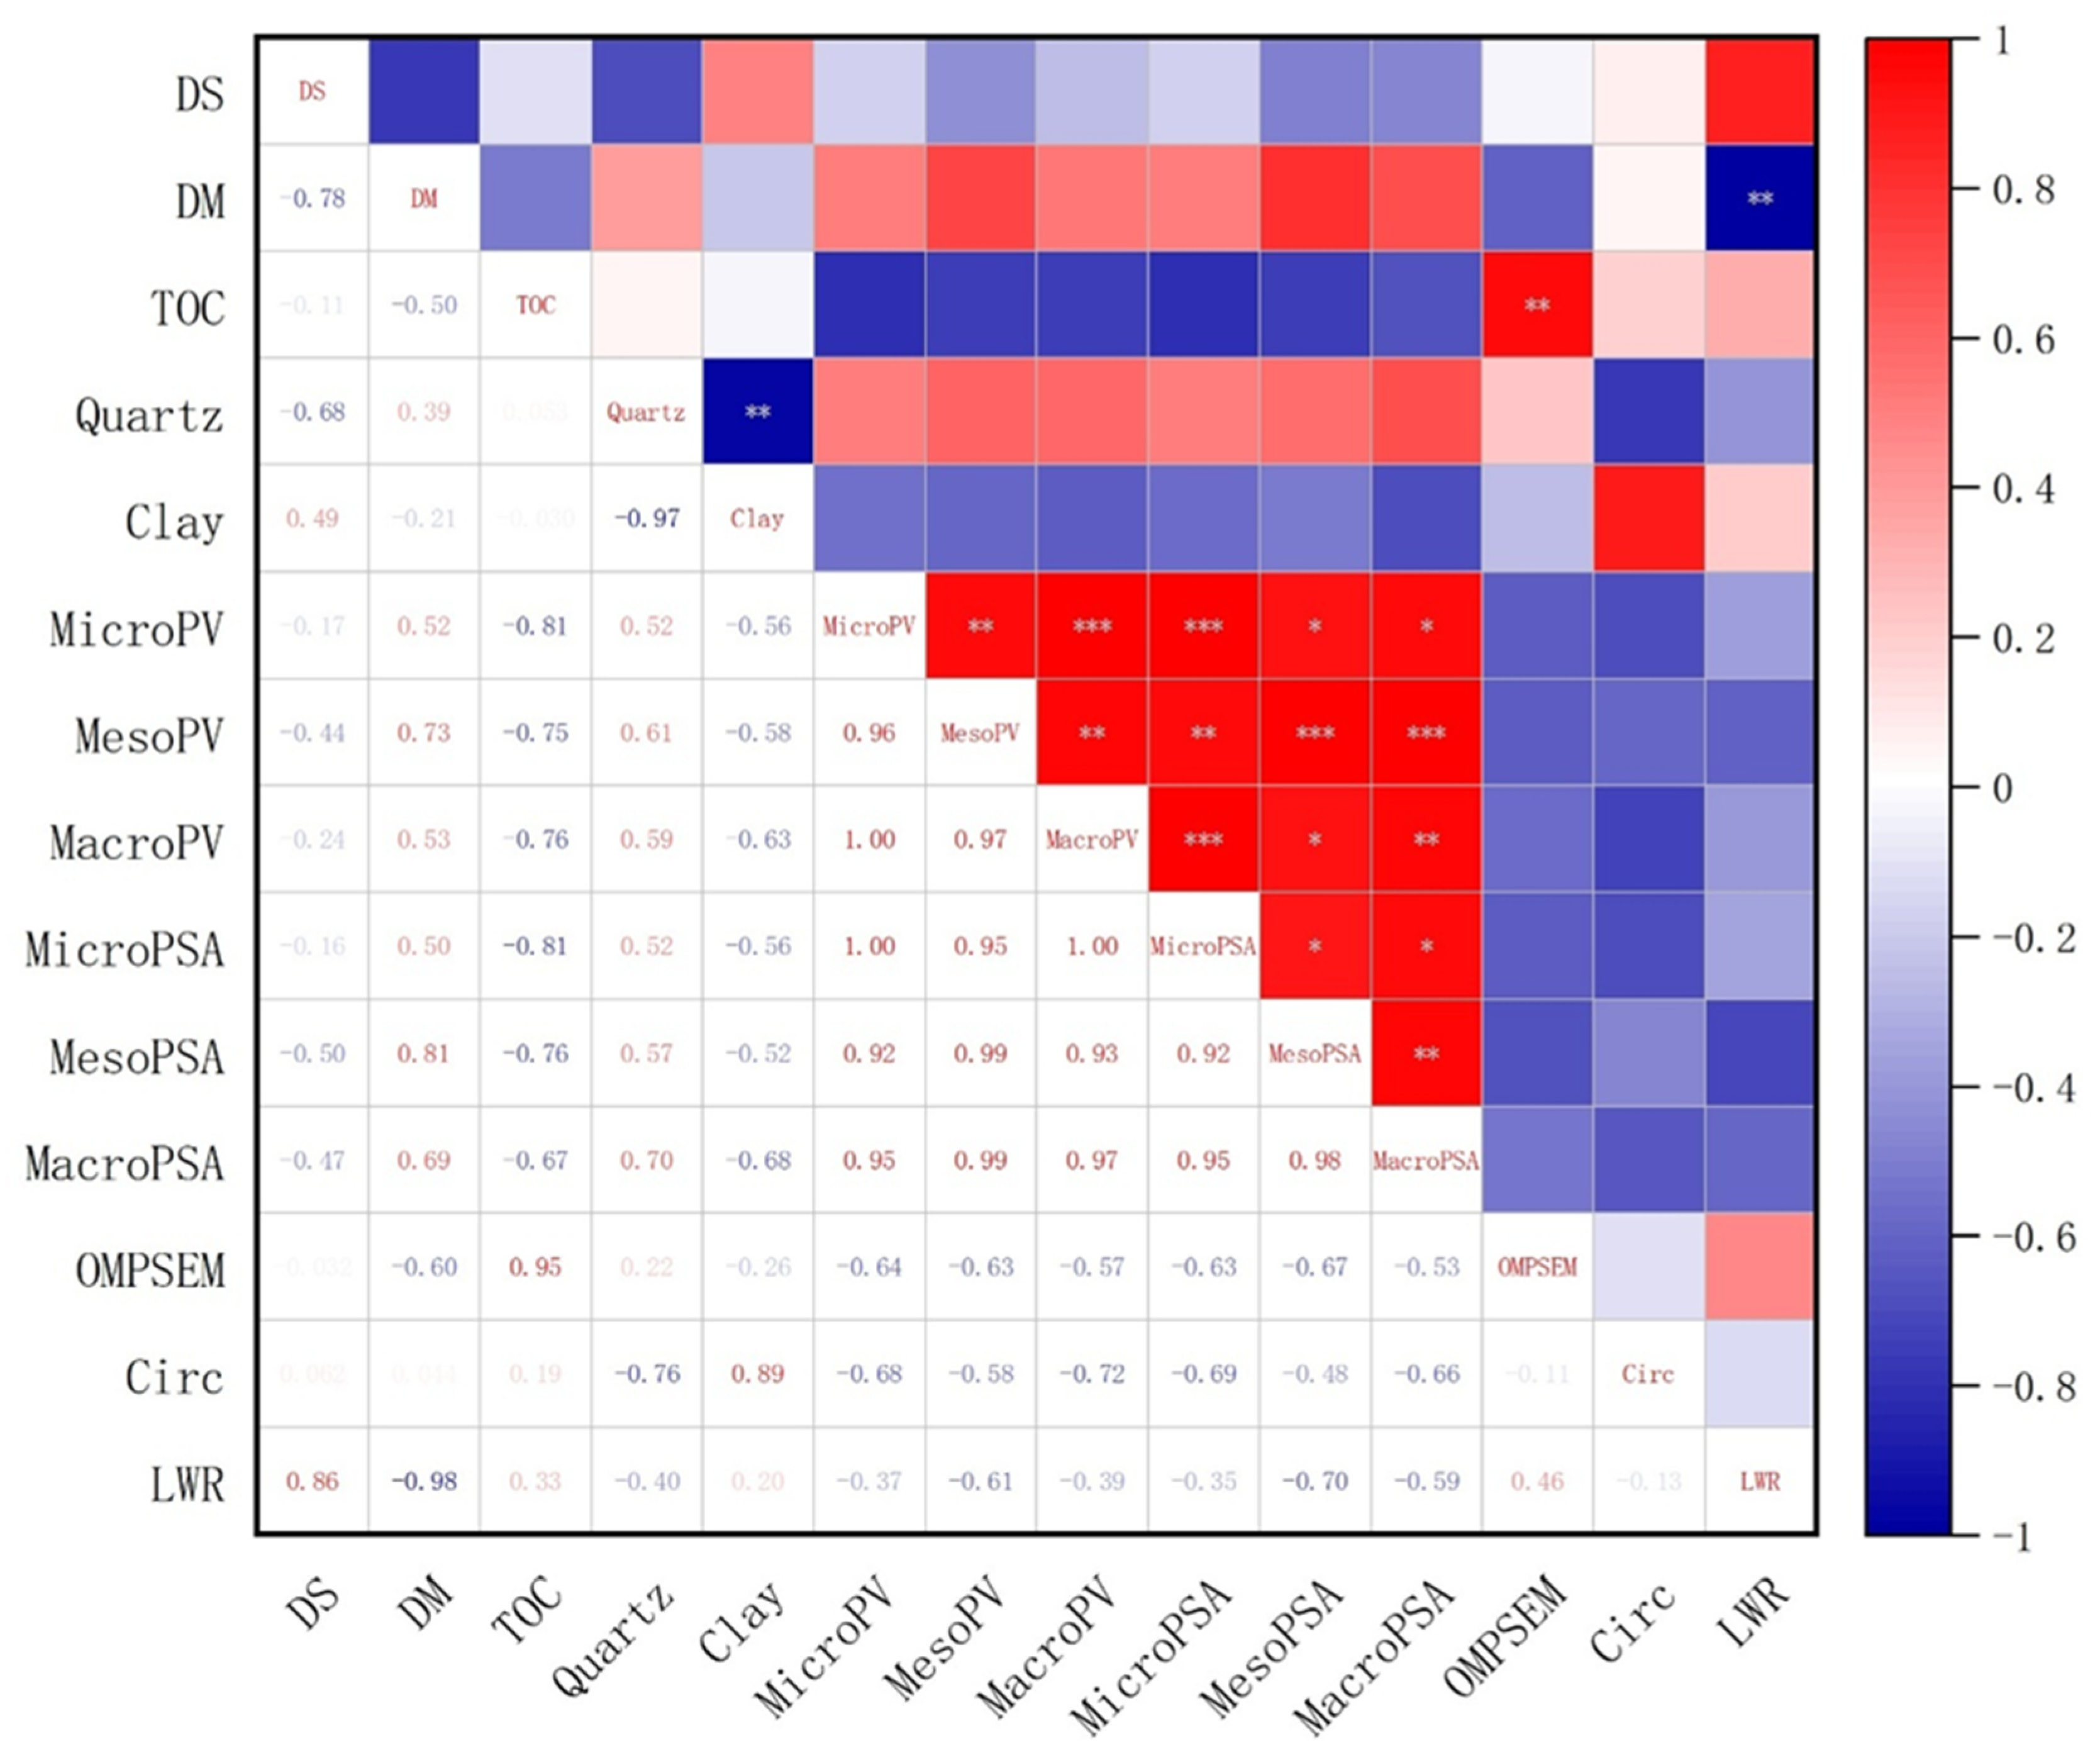
4.2. Factors Affecting the Fractal Characteristics of Shale Organic Pore Structure in Different Tectonic Deformation

Correlation analysis was carried out to explore the relationships between the fractal characteristics of the pore structure and other factors. The Pearson correlation coefficient was calculated to measure the linear relationship between variables (Figure 15, Figure 16 and Figure 17). The color bar on the right-hand side of the heatmap indicates the relationship between colors and correlation coefficients. Red colors signify positive correlations. The deeper the red, the closer the correlation coefficient is to 1, indicating a stronger positive correlation. Blue colors represent negative correlations. The deeper the blue, the closer the correlation coefficient is to −1, indicating a stronger negative correlation. Colors close to white indicate weak correlations, close to 0. Cells in the heatmap are labeled with specific correlation coefficient values. A positive value indicates a positive linear relationship, while a negative value indicates a negative linear relationship. The higher the absolute value of the correlation coefficient (AVOCC), the stronger the correlation with different factors. The close the AVOCC is to 1, the stronger the linear relationship. We used the p-values and Pearson correlation coefficients and presented them in Figure 15, Figure 16 and Figure 17. In this study, we chose the general criteria for p-values: 0.01, 0.05, and 0.1. In general, if the p-value is less than 0.01, it indicates at least 99% certainty; if the p-value is less than 0.05 (and greater than or equal to 0.01), it indicates at least 95% certainty; and if the p-value is less than 0.1 (and greater than or equal to 0.05), it indicates at least 90% certainty. Some cells are marked with asterisks (*, **, and ***). These asterisks denote the statistical significance levels of the correlations. Typically, * indicates a p-value less than 0.1, ** indicates a p-value less than 0.05, and *** indicates a p-value less than 0.01. Cells with asterisks imply that the correlations between the corresponding variables are statistically significant, meaning they are unlikely to occur randomly.
Figure 15 illustrates the correlation plot between the fractal dimension and UDS different parameters. For undeformed shale, the fractal dimension Ds is positively correlated with all parameters except clay content, with the best correlation coefficient of 0.70 with microPV and 0.69 with LWR. The fractal dimension DM is positively correlated with most parts of parameters except clay content and macroPV and macroSA. The best correlation coefficients are 0.92 with OMPSEM, 0.91 with microPV, and 0.90 with microPSA. When the significance markers of the correlations are considered, the fractal dimension DM of the undeformed shale has good determinism with the microporous pore volume, organic matter porosity, and organic matter pore aspect ratio LWR parameters. In particular, we stated that the correlation coefficient between the fractal dimension DM and LWR is 1, with a p-value less than 0.01 (***), showing a significant positive correlation within the 99% confidence interval. It is shown that the fractal dimension of undeformed shale is mainly affected by the development of micropores and pore shapes. The fractal dimensions DS and DM are also well positively correlated (0.65) with each other, indicating a synergistic evolutionary relationship between them in UDS.
Figure 16 illustrates the correlation plot between the fractal dimension and BDS’s different parameters. For brittle deformed shale, the fractal dimension Ds is positively correlated with parameters of clay content, LWR, and OMPSEM, with the best correlation coefficient of 0.94 with clay and 0.72 with LWR. The fractal dimension DM is positively correlated with parameters LWR and clay content mesoPSA. The best correlation coefficient of 0.95 with LWR and 0.74 with clay. It is shown that the fractal dimension of brittle deformed shale is mainly affected by the development of clay and pore length–width ratio. The fractal dimensions DS and DM are also well positively correlated with each other in BDS the correlation coefficient is 0.86, indicating a synergistic evolutionary relationship between them in BDS. Considering the significance markers of the correlations, the fractal dimension Ds of brittle deformed shale shows strong determinism with clay content, whereas the fractal dimension DM demonstrates strong determinism with the organic matter pore aspect ratio LWR.
In the case of ductile deformed shale (DDS), Figure 17 reveals distinct relationships. The fractal dimension Ds is negatively correlated with all parameters except LWR and clay content; the positive correlation coefficient is 0.86 with LWR and 0.49 with clay. The fractal dimension DM is positively correlated with parameters quartz content, all scale organic pore PV, and SA. The best correlation coefficient is 0.81 with mesoPSA and 0.73 with mesoPV. It is shown that the fractal dimension DM of ductile deformed shale is affected by all scale pores. The fractal dimensions DS and DM are very poorly negatively correlated with each other in DDS; the correlation coefficient is −0.78, indicating a decoupling of evolutionary relationships between them in DDS. Meanwhile, when the significance markers of correlation are considered, the fractal dimensions DS and DM of ductile deformed shale do not have positive correlation certainty with all the parameters, but rather the fractal dimension DM has a better negative correlation certainty with the organic matter pore aspect ratio LWR parameter. It shows that the complex types of organic matter mesopores and macropores, have been significantly negatively correlated with the values of pore aspect ratio in ductile deformed shales.
In conclusion, different tectonic deformations lead to diverse influencing factors on the fractal characteristics of shale organic pore structures. The development of micropores is crucial for undeformed shale, clay, and pore length–width ratio dominance in brittle deformed shale, and all-scale pores are key for ductile deformed shale. The pore aspect ratios LWR in undeformed and brittle deformed shales follow the same trend as the fractal dimension DM of meso- and macropores, with the fractal dimension DM becoming higher and pore shapes becoming more complex as the LWR increases. However, when the deformation reaches the ductile stage, after a large number of pores are compressed and larger LWR, the fractal dimension DM starts to decrease and the pore complexity decreases. Additionally, the relationships between DS and DM vary greatly among different types of shale, reflecting the complex impacts of tectonic deformation on the pore structure’s fractal features. TOC variability might influence the correlations observed. Shales with different TOC contents could have distinct pore structures and fractal characteristics. For example, higher TOC might lead to more organic-rich pores, which could in turn affect the relationships between fractal dimensions and other parameters. In addition, the compression of brittle minerals under stress and the directionality of clay minerals affect the fractal dimension of organic nanopores in shales [29,50]. Future studies could further explore the role of TOC and mineral variability in more detail.

4.3. Geological Significance of Shale Organic Nanopore Fractal Characters

Tectonic deformation is a fundamental geological process that has a profound impact on the organic nanopore structure of shale. Shale formations are often subjected to various tectonic forces, such as compression, extension, and shear, during their geological history [27,29,31,32,33]. These forces can cause the shale to undergo two main types of deformation: brittle deformation and ductile deformation. Brittle deformation in shale occurs when the rock is subjected to stress levels that exceed its strength, leading to the formation of fractures and the fragmentation of the rock mass. The main mechanisms of brittle deformation include tensile fracturing and shear fracturing. Brittle deformation typically occurs under high-stress conditions and low-temperature environments. In brittle deformed shale, fractures and microfractures are commonly developed. These fractures can be created by the tensile stress that exceeds the rock’s strength or by the shear stress that causes the rock to break along planes of weakness. In areas with strong tectonic compression, shale may experience faulting and fracturing, resulting in the formation of large-scale fractures that can significantly change the pore structure. These fractures can increase the porosity and permeability of the shale by providing new flow paths for gas. However, if the fractures are not well connected or are filled with secondary minerals during diagenesis, they may not effectively enhance gas migration.
Ductile deformation, on the other hand, occurs under relatively high temperatures and low stress rate conditions. In ductile deformed shale, the rock deforms plastically, resulting in the development of micro folds, foliations, and preferred orientations of pores. These features can also alter the organic nanopore structure of the shale. The development of micro folds can create new pore spaces within the shale matrix of clay and kerogen, while the preferred orientation of organic pores can affect the connectivity of pores. In addition, ductile deformation can cause the original organic pores to be distorted or compressed, changing their size and shape. The influence of tectonic deformation on shale organic pore structure is not only related to the type of deformation but also to the intensity and duration of the tectonic forces. Stronger and longer-lasting tectonic forces can lead to more significant changes in the pore structure. Moreover, the interaction between different types of tectonic deformation can further complicate the organic nanopore structure evolution. Shale may first experience brittle deformation, creating fractures, and then undergo toughness deformation, which can modify the shape and connectivity of these fractures. Given the significant impact of tectonic deformation on shale organic pore structure, due to the complexity of pore structure and strong heterogeneity of shale reservoirs, the relationship between organic pore characteristics and tectonic deformation still needs further study in the future.
Fractal dimension is a key parameter for quantifying the complexity of pore structures. The fractal characteristics of shale organic pore structures are closely related to the gas storage capacity, which is of great significance for accurately assessing shale gas reserves. In undeformed and brittle-deformed shales, the relatively higher fractal dimension DM (>2.7) in the mesopore and macropore range calculated from LTNA data implies a complex pore-network structure. A high DM value indicates a complex and irregular mesopore and macropore structure. When gas flows through such a structure, it needs to overcome more resistance, such as narrow pore necks and complex curved paths. Narrow pore necks can limit the gas flow rate, and complex curved paths increase the tortuosity of the gas flow, resulting in a slowdown of gas diffusion and seepage rates. By comparing the fractal dimensions of brittle and ductile deformed shales, we can determine how different types of tectonic deformation affect the complexity of pore structures. A lower fractal dimension DM (~2.5) in ductile deformed shales may indicate that the pore structure of organic matter gradually becomes homogeneous and stabilized under strong ductile deformation. More homogeneous and stable organic matter pores indicate that the shale still has some gas adsorption capacity even after intense tectonic stress, but the reduced gas adsorption capacity. The possible reduced connectivity of the organic matter pores increases the difficulty of shale gas desorption and fracking development in the ductile deformed shale region. Moreover, understanding the implications of organic pore structure fractal characteristics for shale gas can help in formulating more effective production strategies. For UDS and BDS, efforts should be focused on optimizing the use of natural fractures and enhancing the connectivity of the organic pore network. For ductile deformed shales, strategies should be centered around promoting gas desorption from the organic nanopore structure and improving the gas flow rate in the less complex mesopore and macropore range. And targeted stimulation strategies like creating new, larger fracture networks may be needed to improve gas production efficiency due to the lower gas diffusivity indicated by the reduced fractal dimension. Fractal dimension may not only respond to pore structure, but may also be an indicator of coordinated changes in permeability. Future work could integrate permeability measurements to validate the relationship between fractal dimensions and gas flow.

5. Conclusions

In this study, a comprehensive investigation was carried out on the fractal characteristics of the pore structure in shales subjected to undeformation, brittle and ductile deformation. The sample size may affect the universality of the conclusions; future research could expand the sampling range to verify the reliability of the current findings. However, our experimental methods are reproducible; the entire experimental process strictly follows relevant standards and specifications. Additionally, we compared the geological characteristics and pore structure features of the Niutitang Formation shale with those of other typical shale basins (such as the Longmaxi Formation shale). It is necessary to consider the impacts of geological condition differences on pore structures and fractal characteristics when applying the results to other different shale stratums and basins. The results revealed significant differences in the organic nanopore structure characteristics between the different types of deformed shales.
For undeformed and brittle deformed shales, the pore size distribution was relatively broad, with a dominant proportion of mesopores. The peak of the pore size distribution curve was mainly concentrated in the 2–50 nm range, and the macropores also contributed to the pore structure, providing large-scale flow paths for gas migration. The specific surface area calculated from LTNA data was relatively high, ranging from 13.95 to 29.59 mL/g, while the total pore volume ranged from 20.01 to 29.73 μL/g, and mesopores contributed the largest proportion to the total pore volume. The fractal dimensions DS calculated from P/P0 < 0.45 in LTNA data ranged from 2.5151 to 2.6436, indicating a complex pore network structure in the micropore. The fractal dimensions DM calculated from P/P0 > 0.45 in LTNA data ranged from 2.66 to 2.7588, indicating a more complex pore network structure in the mesopore and macropore range due to the maintenance of the original organic pore during tender tectonic stress and brittle deformation.
In contrast, ductile deformed shales had a pore size distribution with a peak mainly in the micropore and macropore range. The proportion of mesopores has decreased to be equivalent to that of micropores and macropores. The total pore volume was lower, ranging from 5.92 to 14.40 μL/g. The total pore surface area was ranging from 5.78 to 21.54 m2/g, with micropores contributing the largest proportion (92.91–96.01%). The DS for ductile deformed shales ranged from 2.4899 to 2.5512, showing a less complex pore network in the micropore. The DM for ductile deformed shales ranged from 2.5191 to 2.6091, showing a less complex pore network in the mesopore and macropore range due to the plastic flow and homogenization of the pore structure during ductile deformation.
The comparison of fractal characteristics among undeformed, brittle, and ductile deformed shales showed that the differences in fractal dimensions were significant. The deformation type had a distinct impact on the nanopore structure complexity, with brittle deformation being more limited in modifying the organic nanopore structure of shale. And ductile deformation has a more significant influence on the mesopore. In general, brittle deformation led to a more complex pore network, while ductile deformation reduced the complexity of the organic nanopore structure.

Author Contributions

Conceptualization, M.L. and Z.W.; methodology, M.L., M.D. and X.L.; software, M.L.; validation, K.Z. and X.F.; formal analysis, M.L.; investigation, Z.W. and X.F.; resources, Z.W.; data curation, M.L.; writing—original draft preparation, M.L.; writing—review and editing, Z.W. and X.F.; funding acquisition, M.L., M.D. and X.L. All authors have read and agreed to the published version of the manuscript.

Funding

This research was funded by the Fundamental Research Funds for Chinese Academy of Geological Sciences (grant No. JKYQN202338 and DZLXJK202208), the National Natural Science Foundation of China (NSFC, 41802158), and the China Geological Survey (CGS, DD20242231 and DD20250209006).

Data Availability Statement

The article consolidates the original findings of this study. For any other inquiries, please contact the corresponding author.

Acknowledgments

The LTGA analysis was performed with the support of Tao Zhang from the Beijing Center for Physical & Chemical Analysis, Beijing Academy of Science and Technology. The authors would like to express their sincere appreciation for his assistance.

Conflicts of Interest

The authors declare that they have no known competing financial interests or personal relationships that could have appeared to influence the work reported in this paper.

References

  1. Curtis, J.B. Fractured shale-gas systems. Aapg Bull. 2002, 86, 1921–1938. [Google Scholar]
  2. Zou, C.; Yang, Z.; Dong, D.; Zhao, Q.; Chen, Z.; Feng, Y.; Li, J.; Wang, X. Formation, Distribution and Prospect of Unconventional Hydrocarbons in Source Rock Strata in China. Earth Sci. 2022, 47, 1517–1533. [Google Scholar]
  3. Dong, D.; Zou, C.; Dai, J.; Huang, S.; Zheng, J.; Wang, Y.; Li, X.; Guan, Q.; Zhang, C.; Huang, J. Suggestions on the development strategy of shale gas in China. Nat. Gas Geosci. 2016, 27, 397–406. [Google Scholar] [CrossRef]
  4. Sun, C.; Nie, H.; Dang, W.; Chen, Q.; Zhang, G.; Li, W.; Lu, Z. Shale gas exploration and development in China: Current status, geological challenges, and future directions. Energy Fuels 2021, 35, 6359–6379. [Google Scholar] [CrossRef]
  5. Ross, D.J.K.; Bustin, R.M. Shale gas potential of the Lower Jurassic Gordondale member, Northeastern British Columbia, Canada. Bull. Can. Pet. Geol. 2007, 55, 51–75. [Google Scholar] [CrossRef]
  6. Hu, Q.; Ewing, R.P.; Rowe, H.D. Low nanopore connectivity limits gas production in Barnett formation. J. Geophys. Res. Solid Earth 2015, 120, 8073–8087. [Google Scholar] [CrossRef]
  7. Tian, H.; Pan, L.; Zhang, T.; Xiao, X.; Meng, Z.; Huang, B. Pore characterization of organic-rich Lower Cambrian shales in Qiannan Depression of Guizhou Province, Southwestern China. Mar. Pet. Geol. 2015, 62, 28–43. [Google Scholar] [CrossRef]
  8. Loucks, R.G.; Reed, R.M.; Ruppel, S.C.; Jarvie, D.M. Morphology, Genesis, and Distribution of Nanometer-Scale Pores in Siliceous Mudstones of the Mississippian Barnett Shale. J. Sediment. Res. 2009, 79, 848–861. [Google Scholar] [CrossRef]
  9. English, J.M.; English, K.L.; Corcoran, D.V.; Toussaint, F. Exhumation charge: The last gasp of a petroleum source rock and implications for unconventional shale resources. AAPG Bull. 2016, 100, 1–16. [Google Scholar] [CrossRef]
  10. He, S.; Li, H.; Qin, Q.R.; Long, S.X. Influence of mineral compositions on shale pore development of Longmaxi Formation in the Dingshan area, southeastern Sichuan Basin, China. Energy Fuels 2021, 35, 10551–10561. [Google Scholar] [CrossRef]
  11. Cao, T.; Song, Z.; Wang, S.; Cao, X.; Li, Y.; Xia, J. Characterizing the pore structure in the Silurian and Permian shales of the Sichuan Basin, China. Mar. Pet. Geol. 2015, 61, 140–150. [Google Scholar] [CrossRef]
  12. Sing, K.S.W. Reporting physisorption data for gas/solid systems with special reference to the determination of surface area and porosity, IUPAC. Pure Appl. Chem. 1985, 57, 603–619. [Google Scholar] [CrossRef]
  13. Wang, Y.; Cheng, H. Advances in microscopic pore structure characterization of fine-grained mudrocks. Energy Fuels 2023, 37, 1495–1510. [Google Scholar] [CrossRef]
  14. Liu, B.; Mastalerz, M.; Schieber, J. SEM Petrography of Dispersed Organic Matter in Black Shales: A Review. Earth Sci. Rev. 2022, 224, 103874. [Google Scholar] [CrossRef]
  15. Bakshi, T.; Vishal, V. A review on the role of organic matter in gas adsorption in shale. Energy Fuels 2021, 35, 15249–15264. [Google Scholar] [CrossRef]
  16. Yang, W.; Wang, Y.; Yan, F.; Si, G.; Lin, B. Evolution characteristics of coal microstructure and its influence on methane adsorption capacity under high temperature pyrolysis. Energy 2022, 254, 124262. [Google Scholar] [CrossRef]
  17. Awan, R.S.; Liu, C.; Yasin, Q.; Liu, B.; Wood, D.A.; Feng, D.; Iltaf, K.H. Geologic characterization of the Lower Paleozoic black shale of the Niutitang Formation: Implications for a shale gas potential in western Hunan, China. Mar. Pet. Geol. 2024, 163, 106756. [Google Scholar] [CrossRef]
  18. Loucks, R.G.; Reed, R.M.; Ruppel, S.C. Spectrum of pore types and networks in mudrocks and a descriptive classification for matrix-related mudrock pores. AAPG Bull. 2012, 96, 1071–1098. [Google Scholar] [CrossRef]
  19. Ko, L.T.; Loucks, R.G.; Zhang, T.W. Pore and pore network evolution of upper cretaceous boquillas (Eagle Ford-equivalent) mudrocks: Results from gold tube pyrolysis experiments. AAPG Bull. 2016, 100, 1693–1722. [Google Scholar] [CrossRef]
  20. Chen, J.; Xiao, X. Evolution of nanoporosity in organic-rich shales during thermal maturation. Fuel 2014, 129, 173–181. [Google Scholar] [CrossRef]
  21. Zhang, Y.; He, Z.; Jiang, S.; Lu, S.; Xiao, D.; Chen, G.; Zhao, J. Factors affecting shale gas accumulation in overmature shales case study from lower Cambrian shale in western Sichuan Basin, South China. Energy Fuels 2018, 32, 3003–3012. [Google Scholar] [CrossRef]
  22. Ning, S.; Xia, P.; Hao, F.; Tian, J.; Fu, Y.; Wang, K. Pore Fractal Characteristics between Marine and Marine–Continental Transitional Black Shales: A Case Study of Niutitang Formation and Longtan Formation. Fractal Fract. 2024, 8, 288. [Google Scholar] [CrossRef]
  23. Okolo, G.N.; Everson, R.C.; Neomagus, H.W.J.P.; Roberts, M.J.; Sakurovs, R. Comparing the porosity and surface areas of coal as measured by gas adsorption, mercury intrusion and SAXS techniques. Fuel 2015, 141, 293–304. [Google Scholar] [CrossRef]
  24. Brunauner, S.; Emmett, S.P.H.; Teller, E.J. Adsorption of gases in multimolecular layers. J. Am. Chem. Soc. 1938, 60, 309–319. [Google Scholar] [CrossRef]
  25. Klimakow, M.; Klobes, P.; Rademann, K.; Emmerling, F. Characterization of mechanochemically synthesized MOFs. Microporous Mesoporous Mater. 2012, 154, 113–118. [Google Scholar] [CrossRef]
  26. Han, H.; Cao, Y.; Chen, S.; Lu, J.; Huang, C.; Zhu, H.; Zhan, P.; Gao, Y. Influence of particle size on gas-adsorption experiments of shales: An example from a Longmaxi Shale sample from the Sichuan Basin, China. Fuel 2016, 186, 750–757. [Google Scholar] [CrossRef]
  27. Yu, Y.; Wang, Z.; Zhang, K.; Feng, X.; Cheng, M. Effects of shear on development characteristics of organic matter pores in shale: A case study of shale in the Niutitang Formation of the well XAD1. J. Petr. Sci. Eng. 2022, 211, 110166. [Google Scholar] [CrossRef]
  28. Tang, L.; Song, Y.; Jiang, Z.; Jiang, S.; Li, Q. Pore Structure and Fractal Characteristics of Distinct Thermally Mature Shales. Energy Fuels 2019, 33, 5116–5128. [Google Scholar] [CrossRef]
  29. Wang, Y.; Han, D.; Lin, W.; Jia, Y.; Zhang, J.; Wang, C.; Ma, B. Factors Controlling Differences in Morphology and Fractal Characteristics of Organic Pores of Longmaxi Shale in Southern Sichuan Basin, China. Fractal Fract. 2024, 8, 555. [Google Scholar] [CrossRef]
  30. Guan, D.Z.; Dong, D.Z.; Sun, S.S.; Hu, L.X.; Qi, L.; Li, C.D.; Chen, C.; Chen, X. Fractal characteristics of organic-rich shale pore structure and its geological implications: A case study of the Lower Silurian Longmaxi Formation in the Weiyuan block, Sichuan Basin. Nat. Gas Ind. 2024, 44, 108–118. [Google Scholar]
  31. Liang, M.; Wang, Z.; Gao, L.; Li, C.; Li, H. Evolution of pore structure in gas shale related to structural deformation. Fuel 2017, 197, 310–319. [Google Scholar] [CrossRef]
  32. Zhu, H.; Ju, Y.; Qi, Y.; Huang, C.; Zhang, L. Impact of tectonism on pore type and pore structure evolution in organic-rich shale: Implications for gas storage and migration pathways in naturally deformed rocks. Fuel 2018, 228, 272–289. [Google Scholar] [CrossRef]
  33. Li, X.; Wang, J.; Li, Z.; Zhang, K.; Feng, X.; Wang, Z. Impact of brittle deformation on pore structure evolution in shale: Samples collected from different fault positions. Energy Fuels 2022, 36, 1441–1456. [Google Scholar] [CrossRef]
  34. Hu, J.; Tang, S.; Zhang, S. Investigation of pore structure and fractal characteristics of the Lower Silurian Longmaxi shales in western Hunan and Hubei Provinces in China. J. Nat. Gas. Sci. Eng. 2016, 28, 522–535. [Google Scholar] [CrossRef]
  35. Ma, Y.; Zhong, N.; Han, H. Definition and sturcture characteristics of pores in mylonitized organic-rich. Shales Earth Sci. 2014, 44, 2202–2210. [Google Scholar] [CrossRef]
  36. Zhan, H.M.; Li, X.Z.; Hu, Z.M.; Duan, X.G.; Wu, W.; Guo, W.; Lin, W. Fractal Characteristics of Deep Shales in Southern China by Small-Angle Neutron Scattering and Low-Pressure Nitrogen Adsorption. Fractal Fract. 2022, 6, 484. [Google Scholar] [CrossRef]
  37. Yang, R.; He, S.; Yi, J.; Hu, Q. Nano-scale pore structure and fractal dimension of organic-rich Wufeng-Longmaxi shale from Jiaoshiba area, Sichuan Basin: Investigations using FE-SEM, gas adsorption and helium pycnometry. Mar. Pet. Geol. 2016, 70, 27–45. [Google Scholar] [CrossRef]
  38. Thommes, M.; Kaneko, K.; Neimark, A.V. Physisorption of gases, with special reference to the evaluation of surface area and pore size distribution (IUPAC Technical Report). Pure Appl. Chem. 2015, 87, 1051–1069. [Google Scholar] [CrossRef]
  39. Thommes, M.; Cychosz, K.A. Physical adsorption characterization of nanoporous materials: Progress and challenges. Adsorption 2014, 20, 233–250. [Google Scholar] [CrossRef]
  40. Landers, J.; Gor, A.G.A.; Neimark, V. Density functional theory methods for characterization of porous materials. Chem. Inf. 2014, 437, 3–32. [Google Scholar] [CrossRef]
  41. Groen, J.C.; Peffer, L.A.A.; Perez-Ramírez, J. Pore size determination in modified micro- and mesoporous materials. Pitfalls and limitations in gas adsorption data analysis. Microporous Mesoporous Mater. 2003, 60, 1–17. [Google Scholar] [CrossRef]
  42. Klaver, J.; Desbois, G.; Urai, J.L.; Littke, R. BIB-SEM study of the pore space morphology in early mature Posidonia Shale from the Hils area, Germany. Int. J. Coal Geol. 2012, 103, 12–25. [Google Scholar] [CrossRef]
  43. Zhang, J.; Li, X.; Xie, Z.; Li, J.; Zhang, X.; Sun, K.; Wang, F. Characterization of microscopic pore types and structures in marine shale: Examples from the Upper Permian Dalong formation, Northern Sichuan Basin, South China. J. Nat. Gas Sci. Eng. 2018, 59, 326–342. [Google Scholar] [CrossRef]
  44. Lin, W.; Zhao, X.; Li, M.; Zhuang, Y. Pore Structure Characterization and Fractal Characteristics of Tight Limestone Based on Low-Temperature Nitrogen Adsorption and Nuclear Magnetic Resonance. Fractal Fract. 2024, 8, 371. [Google Scholar] [CrossRef]
  45. Ross, D.J.K.; Bustin, R.M. The importance of shale composition and pore structure upon gas storage potential of shale gas reservoirs. Mar. Pet. Geol. 2009, 26, 916–927. [Google Scholar] [CrossRef]
  46. Pan, J.N.; Zhu, H.T.; Hou, Q.L. Macromolecular and pore structures of Chinese tectonically deformed coal studied by atomic force microscopy. Fuel 2015, 139, 94–101. [Google Scholar] [CrossRef]
  47. Lewan, M.D. Stable carbon isotopes of amorphous kerogens from Phanerozoic sedimentary-rocks. Geochim. Cosmochim. Acta 1986, 50, 1583–1591. [Google Scholar] [CrossRef]
  48. Liang, Z.; Jiang, Z.; Han, Y.; Wang, B.; Wu, W.; Li, Z.; Li, Y.; Xue, Z. A modified dent-fractal mathematical model to investigate the water vapor adsorption on nanopore structure heterogeneity from the Longmaxi shale, Sichuan Basin, China. Energy Fuels 2023, 37, 9131–9150. [Google Scholar] [CrossRef]
  49. Zou, J.; Chen, W.; Yang, D.; Yuan, J.; Jiao, Y.Y. Fractal characteristics of the anisotropic microstructure and pore distribution of low-rank coal. AAPG Bull. 2019, 103, 1297–1319. [Google Scholar] [CrossRef]
  50. Jiang, W.; Zhang, Y.; Ma, T.; Chen, S.; Hu, Y.; Wei, Q.; Zhuang, D. Pore Structure and Its Fractal Dimension: A Case Study of the Marine Shales of the Niutitang Formation in Northwest Hunan, South China. Fractal Fract. 2025, 9, 49. [Google Scholar] [CrossRef]
Figure 1. Outcrops and deformation characteristics of shale samples. (a) Undeformed shale (UDS) outcrop; (b) Brittle deformed shale (BDS) outcrop with folded structure; (c) Ductile deformed shale (DDS) outcrop in the slip zone. The length of the hammer is 38 cm, and the diameter of the coin is 20.5 mm. See Figure 2 and Table 1 for texture and structure properties of these samples.
Fractalfract 09 00257 g001
Figure 2. Microscopic characteristics of shale samples. (a) Undeformed shale with original parallel laminations and poorly-developed fractures; (b) Brittle deformed shale with single-phase cracks and secondary mineral veins; (c) Ductile deformed shale with multi-angle fault mirrors, multi-phase fracture cross-development, mylonite structures, and mineral-organic matter fragmentation and rearrangement.
Fractalfract 09 00257 g002
Figure 3. Process of organic matter pore extraction and analysis using ImageJ software. (a) SEM image of shale converted to 8 bit grayscale image; (b) Extracted organic matter region; (c) Extracted organic matter pore region; (d) Organic matter pores presented as black areas.
Fractalfract 09 00257 g003
Figure 4. Schematic diagram of parameters measurement for organic pores in SEM image processed by ImageJ software for different types of deformation. Undeformed shale in (ad); Brittle deformed shale in (eh); Ductile deformed shale in (il).
Fractalfract 09 00257 g004
Figure 5. Box plots showing the organic matter porosity (OMP) (a), roundness (Circ.) (b), and aspect ratio (LWR) (c) of shale samples with different deformations.
Fractalfract 09 00257 g005
Figure 6. CO2 adsorption curves of shale samples. (a) Undeformed shale; (b) Brittle deformed shale; (c) Ductile deformed shale.
Fractalfract 09 00257 g006
Figure 7. N2 adsorption/desorption curves of three shale groups. (a) Undeformed shale; (b) Brittle deformed shale; (c) Ductile deformed shale.
Fractalfract 09 00257 g007
Figure 8. Incremental pore volume (PV) plots of shale samples based on DFT-model analysis of combined N2 and CO2 gas adsorption data. (a) Undeformed shale; (b) Brittle deformed shale; (c) Ductile deformed shale.
Fractalfract 09 00257 g008
Figure 9. Incremental specific surface area (SA) plots of shale samples based on DFT-model analysis of combined N2 and CO2 gas adsorption data. (a) Undeformed shale; (b) Brittle deformed shale; (c) Ductile deformed shale.
Fractalfract 09 00257 g009
Figure 10. Ternary phase diagram of pore structure composition for different deformation type shales.
Fractalfract 09 00257 g010
Figure 11. FHH plots for calculating fractal dimensions of undeformed shale samples from N2 adsorption data.
Fractalfract 09 00257 g011
Figure 12. FHH plots for calculating fractal dimensions of brittle deformed shale samples from N2 adsorption data.
Fractalfract 09 00257 g012
Figure 13. FHH plots for calculating fractal dimensions of ductile deformed shale samples from N2 adsorption data.
Fractalfract 09 00257 g013
Figure 14. Box plots of fractal dimensions DS (a) and DM (b) for undeformed shales (UDS), brittle deformed shales (BDS), and ductile deformed shales (DDS).
Fractalfract 09 00257 g014
Figure 15. Correlation plot between the fractal dimension and different parameters of undeformed shale (*: p < 0.1; **: p < 0.05; ***: p < 0.01).
Fractalfract 09 00257 g015
Figure 16. Correlation plot between the fractal dimension and different parameters of brittle deformed shale (*: p < 0.1; **: p < 0.05; ***: p < 0.01).
Fractalfract 09 00257 g016
Figure 17. Correlation plot between the fractal dimension and different parameters of ductile deformed shale (*: p < 0.1; **: p < 0.05; ***: p < 0.01).
Fractalfract 09 00257 g017
Table 1. The basic features of the experimental samples.
Sample IDTOC
(%)
VRb
(%)
δC13
‰ (PDB)
Quartz
(%)
Clay
(%)
Other Minerals (%)Texture and Fabric Feature of Macroscopic Hand Specimens
UDS16.383.12−34.280164 Shale primary structure can be observed. Shale has original parallel bedding.
UDS28.443.15−33.777149
UDS38.123.15−33.666277
UDS43.573.13−34.266331
BDS18.953.12−34.357367 Shale has original parallel bedding. Shale shows cleavage structure and cleavage surface is smooth with fine-grained powder coatings. Fractures and mineral filling development.
BDS211.53.19−33.585105
BDS3183.28−33.78515-
BDS49.113.30−32.561318
DDS111.93.89−32.880155The primary structure of shale is damaged and the parallel bedding has disappeared due to mylonitization. The plastic deformation of shale is obvious. Shale structure is loose and fragile. Shale shows cleavage structure and cleavage surface is smooth with fine-grained powder coatings.
DDS220.73.48−32.779174
DDS314.33.39−32.872253
DDS415.83.37−32.865287
TOC—total organic carbon (%); VRb—vitrinite reflectance values of solid bitumen (%). Other minerals (%): feldspar, carbonate, pyrite, and siderite.
Table 2. Quantitative pore parameters of the shale samples.
Sample IDPore VolumeAdsorption CapacityRelative Content * (%)Pore Parameters from SEM
Micropore(μL/g)Mesopore(μL/g)Macropore(μL/g)Total Pore (μL/g)CO2 (ml/g)N2 (ml/g)Micropore(%)Mesopore(%)Macropore(%)OMP(%)Circ.(0–1)LWR
UDS17.5918.183.3829.153.4329.5926.0462.3711.608.470.721.85
UDS25.5219.262.1726.952.7821.0520.4871.478.057.730.691.79
UDS36.7616.103.0225.883.1120.1026.1262.2111.679.560.641.86
UDS42.8712.904.2620.011.4017.7514.3464.4721.297.570.671.75
BDS15.4212.612.0020.032.7013.9527.0662.969.997.770.771.93
BDS28.4512.924.4425.814.8015.3532.7450.0617.206.990.771.88
BDS39.5217.312.9029.734.9220.1532.0258.229.754.160.711.96
BDS47.2212.382.0521.653.7116.2033.3557.189.476.050.721.99
DDS15.934.753.7214.43.766.5841.1832.9925.832.470.452.81
DDS21.562.562.096.211.093.7925.1241.2233.663.820.563.00
DDS32.883.522.458.851.854.9832.5439.7727.682.390.702.34
DDS41.792.122.015.921.303.2330.2435.8133.952.900.653.45
* The relative contents of different pore size distributions with pore volume were calculated by the same model of DFT. OMP: porosity % of pores in organic matters from SEM images using ImageJ.
Table 3. Pore surface area characteristics of the samples.
Sample IDTotal SA of Gas Absorption by Different ModelSA of Gas Absorption by Same Model (DFT)Relative Content * (%)
CO2 (DR)
(m2/g)
CO2(DFT)
(m2/g)
N2(BET)
(m2/g)
N2(DFT)
(m2/g)
Micropore
(m2/g)
Mesopore
(m2/g)
Macropore
(m2/g)
Total pore
(m2/g)
Micropore
(%)
Mesopore
(%)
Macropore
(%)
UDS125.7726.7425.5418.0022.103.170.1025.3787.1112.500.39
UDS221.2021.5415.3610.2316.773.660.0620.4981.8417.860.29
UDS323.5424.1117.9412.0219.713.640.0823.4384.1215.540.34
UDS410.5210.9410.516.778.272.120.1110.578.7620.191.05
BDS121.4420.7711.677.8116.202.840.0519.0984.8614.880.26
BDS237.1536.9610.036.0527.892.920.1130.9290.209.440.36
BDS336.3638.2517.0410.1530.314.200.0734.5887.6512.150.20
BDS428.0628.7715.5710.3022.213.130.0525.3987.4812.330.20
DDS129.4728.832.261.5020.680.780.0821.5496.013.620.37
DDS28.898.531.250.825.370.360.055.7892.916.230.87
DDS314.7014.222.121.369.770.610.0610.4493.585.840.57
DDS410.9210.091.000.666.100.280.046.4295.024.360.62
* The relative contents of different pore size distributions with SA were calculated by the same model of DFT.
Table 4. Fractal dimensions calculated from N2 adsorption data using FHH method.
Sample IDP/P0 = 0–0.45P/P0 = 0.45–1
Fitting EquationR2DSFitting EquationR2DM
UDS1y = −0.3564x + 2.12740.99162.6436y = −0.2764x + 2.15030.98512.7236
UDS2y = −0.4377x + 1.65610.99422.5623y = −0.3157x + 1.72960.96512.6843
UDS3y = −0.4038x + 1.79650.99272.5962y = −0.2634x + 1.87280.97022.7366
UDS4y = −0.4238x + 1.28160.99612.5762y = −0.34x + 1.33390.98512.66
BDS1y = −0.4237x + 1.36970.99072.5763y = −0.2597x + 1.50080.93612.7403
BDS2y = −0.4849x + 1.24790.99692.5151y = −0.3063x + 1.38270.96782.6937
BDS3y = −0.4657x + 1.76550.99592.5343y = −0.2615x + 1.87650.96282.7385
BDS4y = −0.409x + 1.65660.99382.5910y = −0.2412x + 1.76010.95612.7588
DDS1y = −0.4894x − 0.22370.99722.5106y = −0.42x − 0.12890.99222.58
DDS2y = −0.5028x − 0.82180.99372.4972y = −0.4542x − 0.81510.99672.5458
DDS3y = −0.5101x − 0.29260.99692.4899y = −0.3909x − 0.22730.99722.6091
DDS4y = −0.4488x − 1.07090.99442.5512y = −0.4809x − 1.10080.99842.5191
Disclaimer/Publisher’s Note: The statements, opinions and data contained in all publications are solely those of the individual author(s) and contributor(s) and not of MDPI and/or the editor(s). MDPI and/or the editor(s) disclaim responsibility for any injury to people or property resulting from any ideas, methods, instructions or products referred to in the content.

