1. Introduction
As conventional oil and gas resources gradually deplete, the exploration and development of low-porosity and low-permeability reservoirs have become a focal point in the modern petroleum industry’s development [
1]. This kind of reservoir is relatively dense, with low face porosity, narrow and curved throats, weak oil and gas transportation capacity, and poor connectivity [
2,
3,
4,
5]. Low-permeability oil and gas reservoirs have huge development potential and occupy an important position in China’s unconventional oil and gas resources [
6,
7]. Therefore, improving exploration and development technologies for low-permeability reservoirs and effectively developing and utilizing these reservoirs are of great strategic significance for the sustainable and stable development of China’s energy industry [
8,
9,
10,
11]. Currently, this type of reservoir is being developed on a large scale in the Ordos Basin. Among these, the Chang 2 member is a typical low-permeability reservoir, which is one of the key areas for tight oil exploration and development in the basin [
12,
13,
14].
The complex pore structure of low-permeability reservoir rocks is an important factor affecting their seepage characteristics, but the quantitative relationship between reservoir seepage characteristics and the geometric topological features of the pore space is still unclear, and it is difficult for a single theory and method to accurately characterize the complexity and non-homogeneity of the reservoir structure [
15,
16]. Therefore, the complex pore throat structure can be more accurately characterized in conjunction with fractal geometry theory [
17,
18]. The fractal dimension is associated with the surface roughness of reservoir pore throats and is extensively utilized in the exploration of low-permeability sandstone reservoirs [
19,
20]. In low-permeability sandstone with a broad distribution of pore throats, examining fractal characteristics across multiple scales can be used to effectively describe the microstructure and fractal features of pore throats with varying radii [
21,
22]. As the number of protuberances and concavities on the surface of the pore throat increases, the pore throat structure exhibits higher roughness and complexity, and the fractal dimension can be used to quantitatively measure the surface roughness of the pore throat [
23,
24,
25]. Utilizing mercury intrusion capillary pressure (MICP) and scanning electron microscopy (SEM), one can precisely evaluate the pore throat structure of reservoirs [
26,
27,
28,
29]. The fractal dimension of sandstone exhibiting fractal characteristics typically falls between 2.0 and 3.0, reflecting the inherent local–whole relationship within the structure of sandstone pore throats. When the fractal dimension (D) is closer to 2.0, the pore throat surface is smoother, and the structure is more regular. Conversely, a higher fractal dimension indicates a more complex structure [
30].
In this research, we conducted a detailed investigation of the pore throat types, sizes, structures, and fractal characteristics in the low-permeability sandstone of the Chang 2 member using CTS, SEM, XRD, and MICP analyses. Furthermore, we classified and evaluated the reservoirs in the study area. We discussed the impacts of physical properties, pore throat structural parameters, and mineral composition on different types of reservoirs. This study provides effective methods for evaluating low-permeability, highly heterogeneous reservoirs.
2. Geological Setting
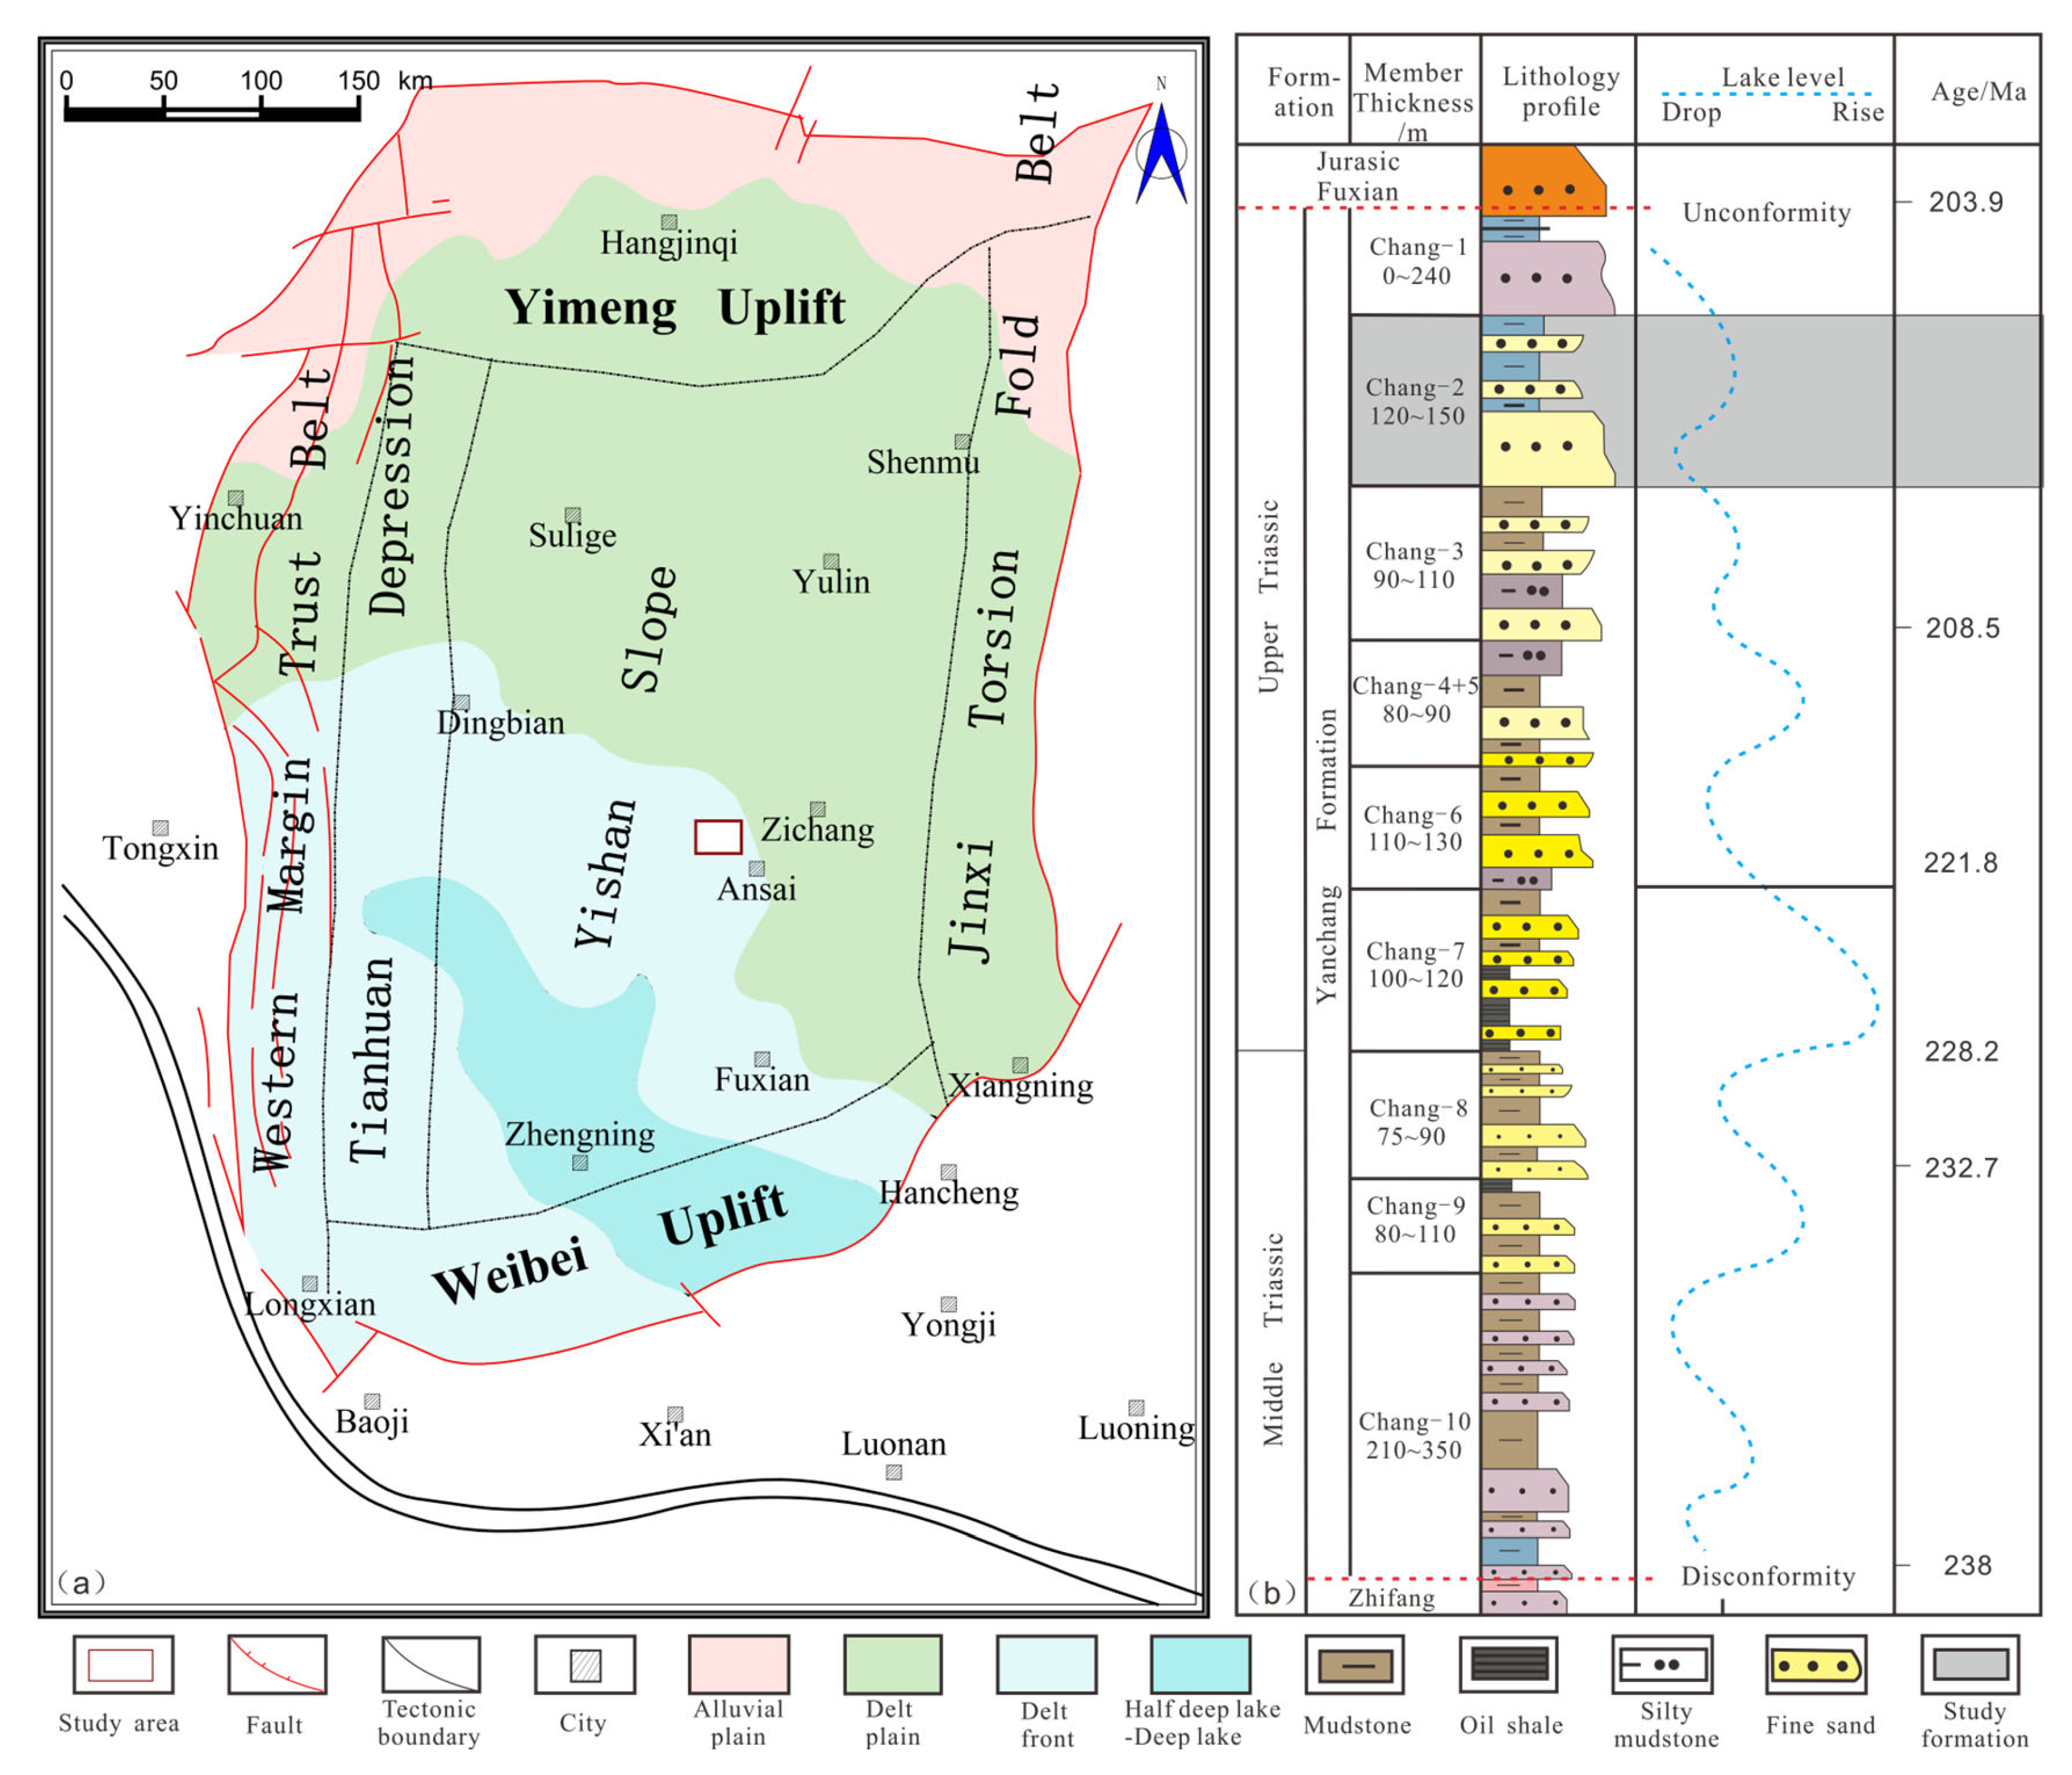
The Ordos Basin is a vast inland sedimentary basin that formed independently following the breakup of North China. Its current tectonic structure is relatively simple, with flat stratigraphy. The basin is an asymmetrical rectangle extending from north to south, featuring a wider and flatter eastern side and a steeper and narrower western side. A large number of faults and folds are developed along the basin margins, generally with a dip of less than 1° (
Figure 1a). The Triassic Extension Formation is an important hydrocarbon-bearing reservoir in the basin. Based on lithology and paleontological assemblages, previous researchers divided the Yanchang Formation into members from Chang 10 at the bottom to Chang 1 at the top. It shows a complete water-in to water-out sequence vertically [
31,
32,
33]. During the Chang 2 member, the lake basin gradually died out, deep lake deposits disappeared, and swamping of the plains accelerated. The northern part of the basin developed braided river and deltaic deposits, and the southwestern part was depleted (
Figure 1b) (modified by Lv, 2023) [
34].
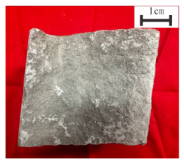
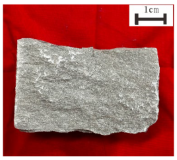
The Haojiaping area is situated in the central part of the Yishan Slope within the Ordos Basin. It is characterized by gentle stratigraphy and simple tectonics. Additionally, low-amplitude nasal tectonics, which are locally developed, are formed due to differential compaction. The Chang 2 oil formation group serves as the primary tight-oil target within the study area. The sandstones in the Chang 2 member of the Yanchang Formation in the study area are mainly light gray and gray-green and also contain siltstone and grey mudstone. It is a common stable onshore shallow water depositional environment.
3. Materials and Methods
3.1. Sampling and Processing
MICP can measure pore throat distribution, permeability contribution, skewness, sorting coefficient, and other pore throat structural parameters. X-ray diffraction analysis data were utilized to examine the whole rock and clay fractions of the samples. SEM images were employed to ascertain pore morphology, pore size, and mineral distribution [
35]. CTS experiments can be used to analyze the petrological and pore throat structural characteristics of samples. CL is employed to differentiate minerals that are challenging to identify under a polarized light microscope.
In this study, 25 wells were selected in Haojiaping block, and 85 blocks were sampled evenly in the Chang 2 member. These samples were processed into thin slices and cylindrical specimens with a diameter of approximately 2.5 cm and a length of 5.0 cm. The thin sections were allocated for confocal tomography scanning (CTS) testing (43 samples), X-ray diffraction (XRD) analysis (73 samples), and scanning electron microscopy (SEM) observation (32 samples). The cylindrical samples were used for porosity and permeability measurements (55 samples) and mercury intrusion capillary pressure (MICP) testing (55 samples).
3.2. Experimental Measurements
In this study, according to standard SY/T 5336-2006 [
36], a sc-II type cover pressure permeability test instrument was adopted for testing samples. The measurement precision of the instrument exceeded 95%. According to standard SY/T 5162-2014 [
37], SEM observations were performed using a Tescan S-3200N field emission electron microscope. According to standard SY/T 5368-2000 [
38], the CTSs of 43 samples were examined using an Olympus-cx21 polarizing microscope. According to standard SY/T 5916-2013 [
39], CL testing of rock flakes was accomplished using an LME-3PRX cathodoluminescence instrument.
According to the standard GBT 29171-2012 [
40], MICP was conducted using the Autopore IV 9505 mercury injection instrument at a temperature of 20–25 °C and a relative humidity of 80–85%. Mercury was injected into the reservoir to obtain the intrusion curves until the maximum pressure was reached, then the experiment of decreasing pressure was performed to obtain the mercury extrusion curves. The maximum intrusion pressure was recorded at 32.1 MPa, corresponding to a pore throat radius of 0.023 um. During the experiments, the volume accuracy of the entry or exit of mercury was greater than 0.1 uL. The distribution curve of the pore throat radius can be obtained by the relationship between the injected mercury saturation and the pore throat radius.
All of the aforementioned tests were conducted at the State Key Laboratory of Continental Dynamics, Northwest University, China.
3.3. Fractal Theory
Fractal theory is used to quantitatively characterize the complexity of reservoir pore structures at the micro and nano scale [
41,
42]. Fractal dimension (D) can quantitatively characterise the complexity and non-homogeneity of reservoir pore structure. According to the principle of fractal geometry, the number of pore throats N (r) with radius greater than r in the reservoir can be expressed as
where r
max represents the maximum pore throat radius, P(r) denotes the distribution density function of the pore throat radius, a is a proportionality constant, and D represents the fractal dimension.
By taking the derivative with respect to “r”, P(r) is derived.
where a′ is a proportionality constant, which is equivalent to −D × a.
The volume V(<r) of the pore throat with radius less than r is as follows:
The total pore volume (V) is as follows:
Combining Equations (3) and (4), the cumulative volume fraction of pore throats s with radii less than r(s) can be derived.
If r
min << r
max, Equation (5) can be simplified as follows:
According to Laplace formula
[
43], assuming that θ is not affected by pore throat size, the fractal Equation (7) of pore throat radius distribution can be obtained.
where S is the wetting phase saturation corresponding to capillary pressure Pc,%. Taking the logarithm of both sides of Equation (7), the formula is changed as follows:
In the high-pressure mercury injection experiment, the wetting phase is air, and non-wetting phase is mercury, so log(S) can be expressed as lg(1-SHg), where SHg is mercury saturation. The scatterplot of the correlation between lg(1-SHg) and lg(Pc) is then linearly fitted to obtain a slope that can be expressed as (D-3), from which the fractal dimension D can be calculated.
In this research, the Xoaoth classification standard was utilized to divide pore types into three categories: micropores (<0.1 μm), mesopores (0.1–1 μm), and macropores (>1 μm) [
44]. And the fractal dimensions of micropores (D1), mesopores (D2), and macropores (D3) were calculated according to the above fractal dimension formula. The porosity of micropores (φ
1), mesopores (φ
2), and macropores (φ
3) was calculated based on the cumulative fraction of volume of differently sized pore throats, respectively. Based on the weighted average of porosity of micropores, mesopores, and macropores, the total fractal dimension (D) can be determined as follows:
4. Results
4.1. Mineral Composition and Petrophysical Characteristics
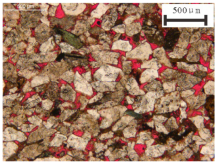
The Chang 2 member in the study area was deposited at the delta front, and its reservoir sands are mainly dominated by the deposition of underwater distributary channels as well as mouth bar microphases. According to the triangular projection map, the rock type is predominantly fine-grained feldspar sandstone (
Figure 2a). Of these, feldspar comprises the highest proportion (34% to 65%, with an average of 54.6%), followed by quartz (13% to 30%, with an average of 22.9%), and then rock fragment (6% to 26%, with an average of 7.9%). According to the XRD experiments analysis, the reservoir has the highest percentage of feldspar and quartz, 54.5% and 37.1%, respectively. The average content of clay minerals is 3.2%, and carbonate is 3.8% (
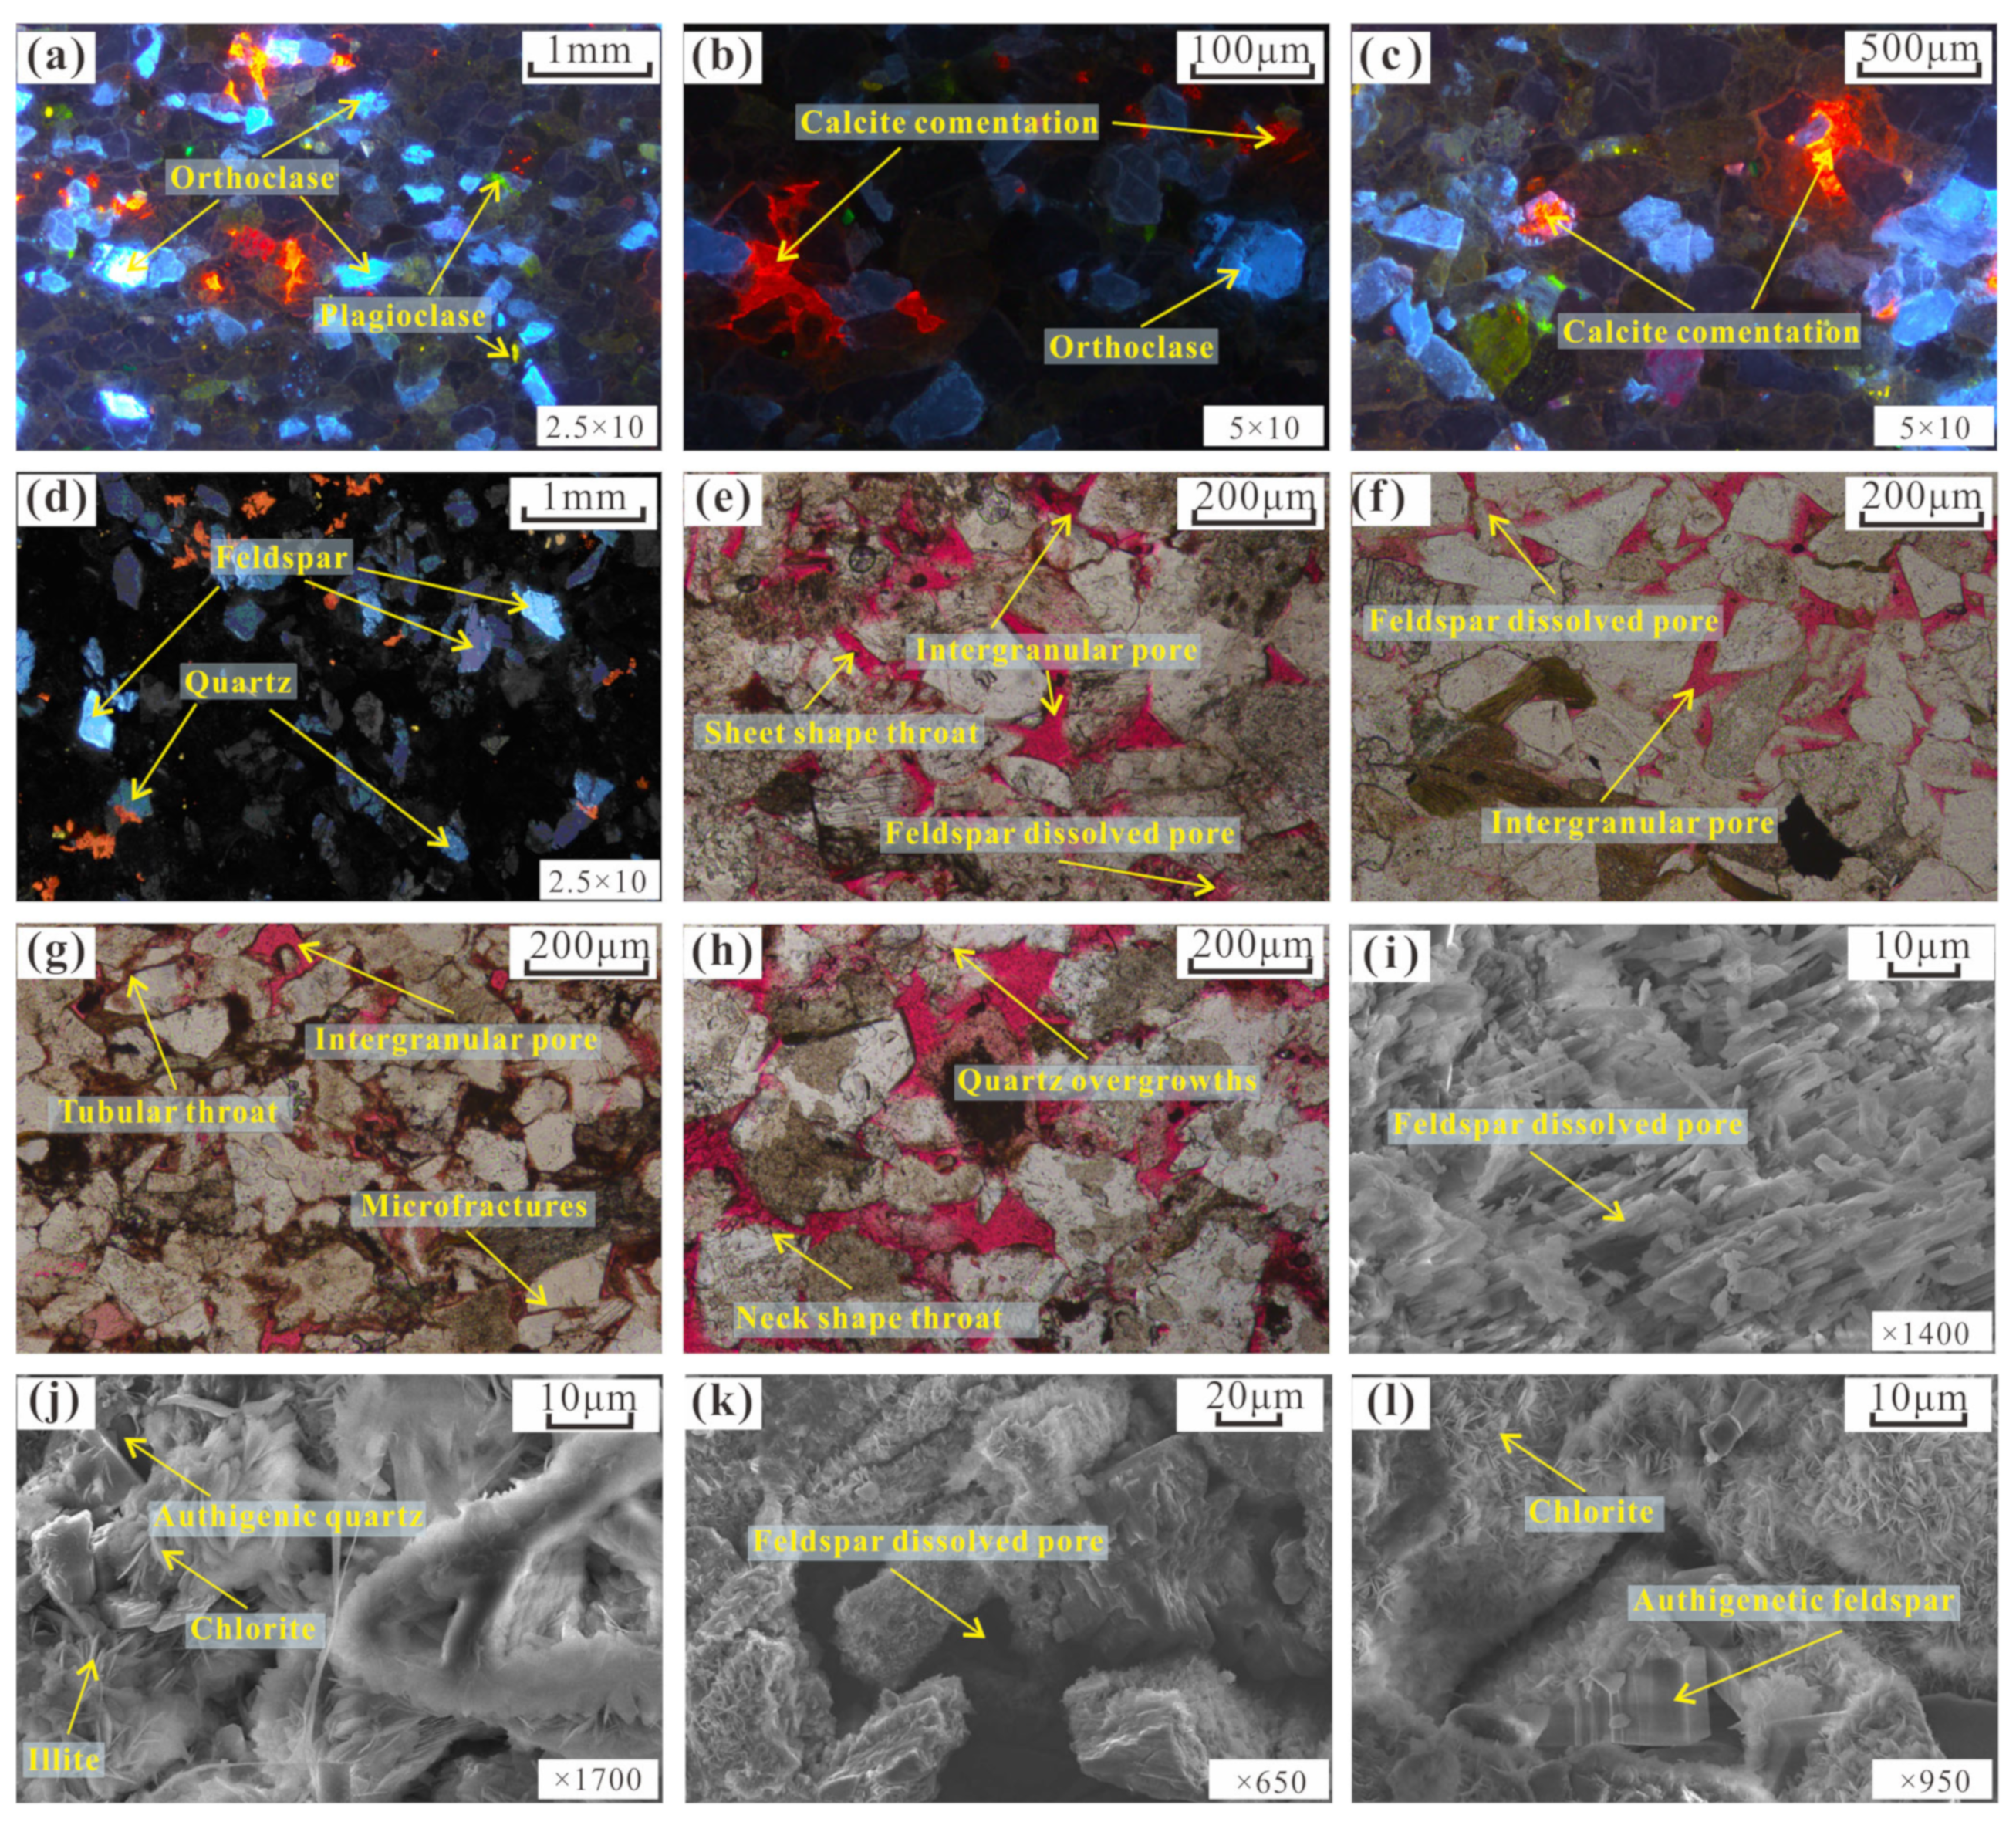
Figure 2b). Based on CL, CTS, and SEM analysis, the terrigenous clastic materials are mainly composed of plagioclase (
Figure 3a), orthoclase (
Figure 3b), and quartz (
Figure 3d). Authigenic quartz and authigenic feldspar are well-developed in the reservoir (
Figure 3j,l). The absolute content of clay minerals is 1.79%, with chlorite being the predominant component (
Figure 3j), followed by kaolinite, illite (
Figure 3j), and illite–smectite interstratified minerals. The pore fillers in the reservoir are mainly calcite. Under the thin section, calcite occasionally replaces feldspar. In most cases, only partial replacement occurs. The parts replaced by calcite exhibit a bright orange-yellow to orange-red fluorescence, while the residual parts show a gray-blue fluorescence (
Figure 3c). The cementation is primarily characterized by chlorite film cementation (
Figure 3l), followed by calcite cementation and quartz overgrowth cementation. The cementation type is mainly a composite of film-pore cementation.
Source-rock properties, rock maturity, and fluid properties can be responded to by sandstone classification. The quantitative relationship between the four components, quartz (Q), feldspar (F), rock fragment (R), and clay matrix (M), can reflect the diagenetic characteristics of the sandstone. The basic characteristics of the source rock index of the reservoir can be expressed by the source index (F/R) [
45,
46]. Feldspars are a symbol of granitic matrices, and lithic are a symbol of volcanic, sedimentary, and shallow metamorphic matrices. The average value of F/R ratio in the study area is 7.25, indicating that the reservoir is mainly derived from granitic deposits [
47]. Quartz is the stable component, and feldspar and rock fragment are the unstable components. The transport and abrasion history can be represented by Q/(F + R). In general, the higher the maturity of the composition, the better the abrasive conditions and the longer the transport history. The average value of Q/(F + R) ratio in the study area is 0.37, indicating that the reservoir component has low maturity. The ratio of grains or clasts to matrix (i.e., G/M) is an indicator of whether mechanical differentiation is effective or not. When the G/M ratio is small, the sand and mud are mixed, and the sorting is poor, indicating that the screening is not complete and the sediment accumulation is rapid, which is generally a sign of gravity flow deposition. The opposite is the sign of traction flow. The average G/M ratio in the study area is 29.3, reflecting good sorting.
where BI is the brittleness index (%), and m
qua, m
cla, and m
car are the contents (%) of quartz, clay, and carbonate minerals, respectively. Equation (10) was used to derive an average brittleness index of 85.3% for the study area. This indicates the high degree of brittleness of the reservoirs in the study area, which is favorable for fracture modification of the exploration area.
In conclusion, the matrix rock of the reservoir in the study area is granite, which is characterized by low compositional maturity, good sorting, poor–medium rounding, and high brittleness. This indicates that the deposited sediments were transported over a short distance and indicates a stable depositional environment of low energy with strong late diagenesis.
4.2. Porosity and Permeability
Physical analyses were conducted on 55 sandstone samples from the Chang 2 reservoir in the study area. The predominant distribution of porosity and permeability in the study area ranges from 13 to 16% and 2 to 6 mD, respectively (
Figure 4a,b). These indicate that the Chang 2 member in Haojiaping area is a typical low-permeability reservoir [
48].
Figure 4c shows a positive correlation between the porosity and permeability of the three types of reservoirs (the classification criteria are described in
Section 4.3). This suggests that the the size of pore throats has a substantial effect on permeability. According to the statistics from conventional thin section analyses, the average facies rate of the Chang 2 reservoir in the study area is 11.4%. Porosity is mainly due to intergranular pores with well-defined polygonal boundaries (
Figure 3e,g). Reservoir porosity is mainly affected by compaction, cementation, and mixed filling effects. The Chang 2 reservoir in the study area contains quartz, chlorite films, and other minerals (
Figure 3h,j,l). Chlorite and quartz are resistant to compaction and contribute to the preservation of pores in the reservoir [
49].
4.3. Characteristics of the Pore Throat Network
The Chang 2 member in the study area contains various types of reservoir spaces, intergranular pores and intercrystalline (dissolution) pores, secondarily moldic pores, and a small number of fissure pores and other types of pores. The intergranular pores account for 60% of the total surface porosity (
Figure 2c). Intergranular pores mainly refer to the residual intergranular pores formed after the mineral components have been compacted and cemented (
Figure 3e–g). Secondly, the chlorite film fills the pore space and dissolves, recovering a large number of intergranular pores (
Figure 3j,l). In the study area, the intragranular dissolution pores are primarily those formed by the dissolution of feldspar (
Figure 3i,k). The feldspars are usually dissolved and filled with illite and chlorite (
Figure 3j). The reservoir is relatively light, with strong pressure solution action, low weathering, good sorting, and moderate to poor rounding. The debris particles form line contact and concave–convex contact under pressure, producing a dense mosaic structure so that more than half of the primary pores of the Chang 2 reservoir are lost. The average sandstone grain size is 0.26 mm.
Throats are narrow passageway that connects the pores. The Chang 2 reservoir in the study area develops sheet (
Figure 3e), tubular (
Figure 3g), and neck-shape (
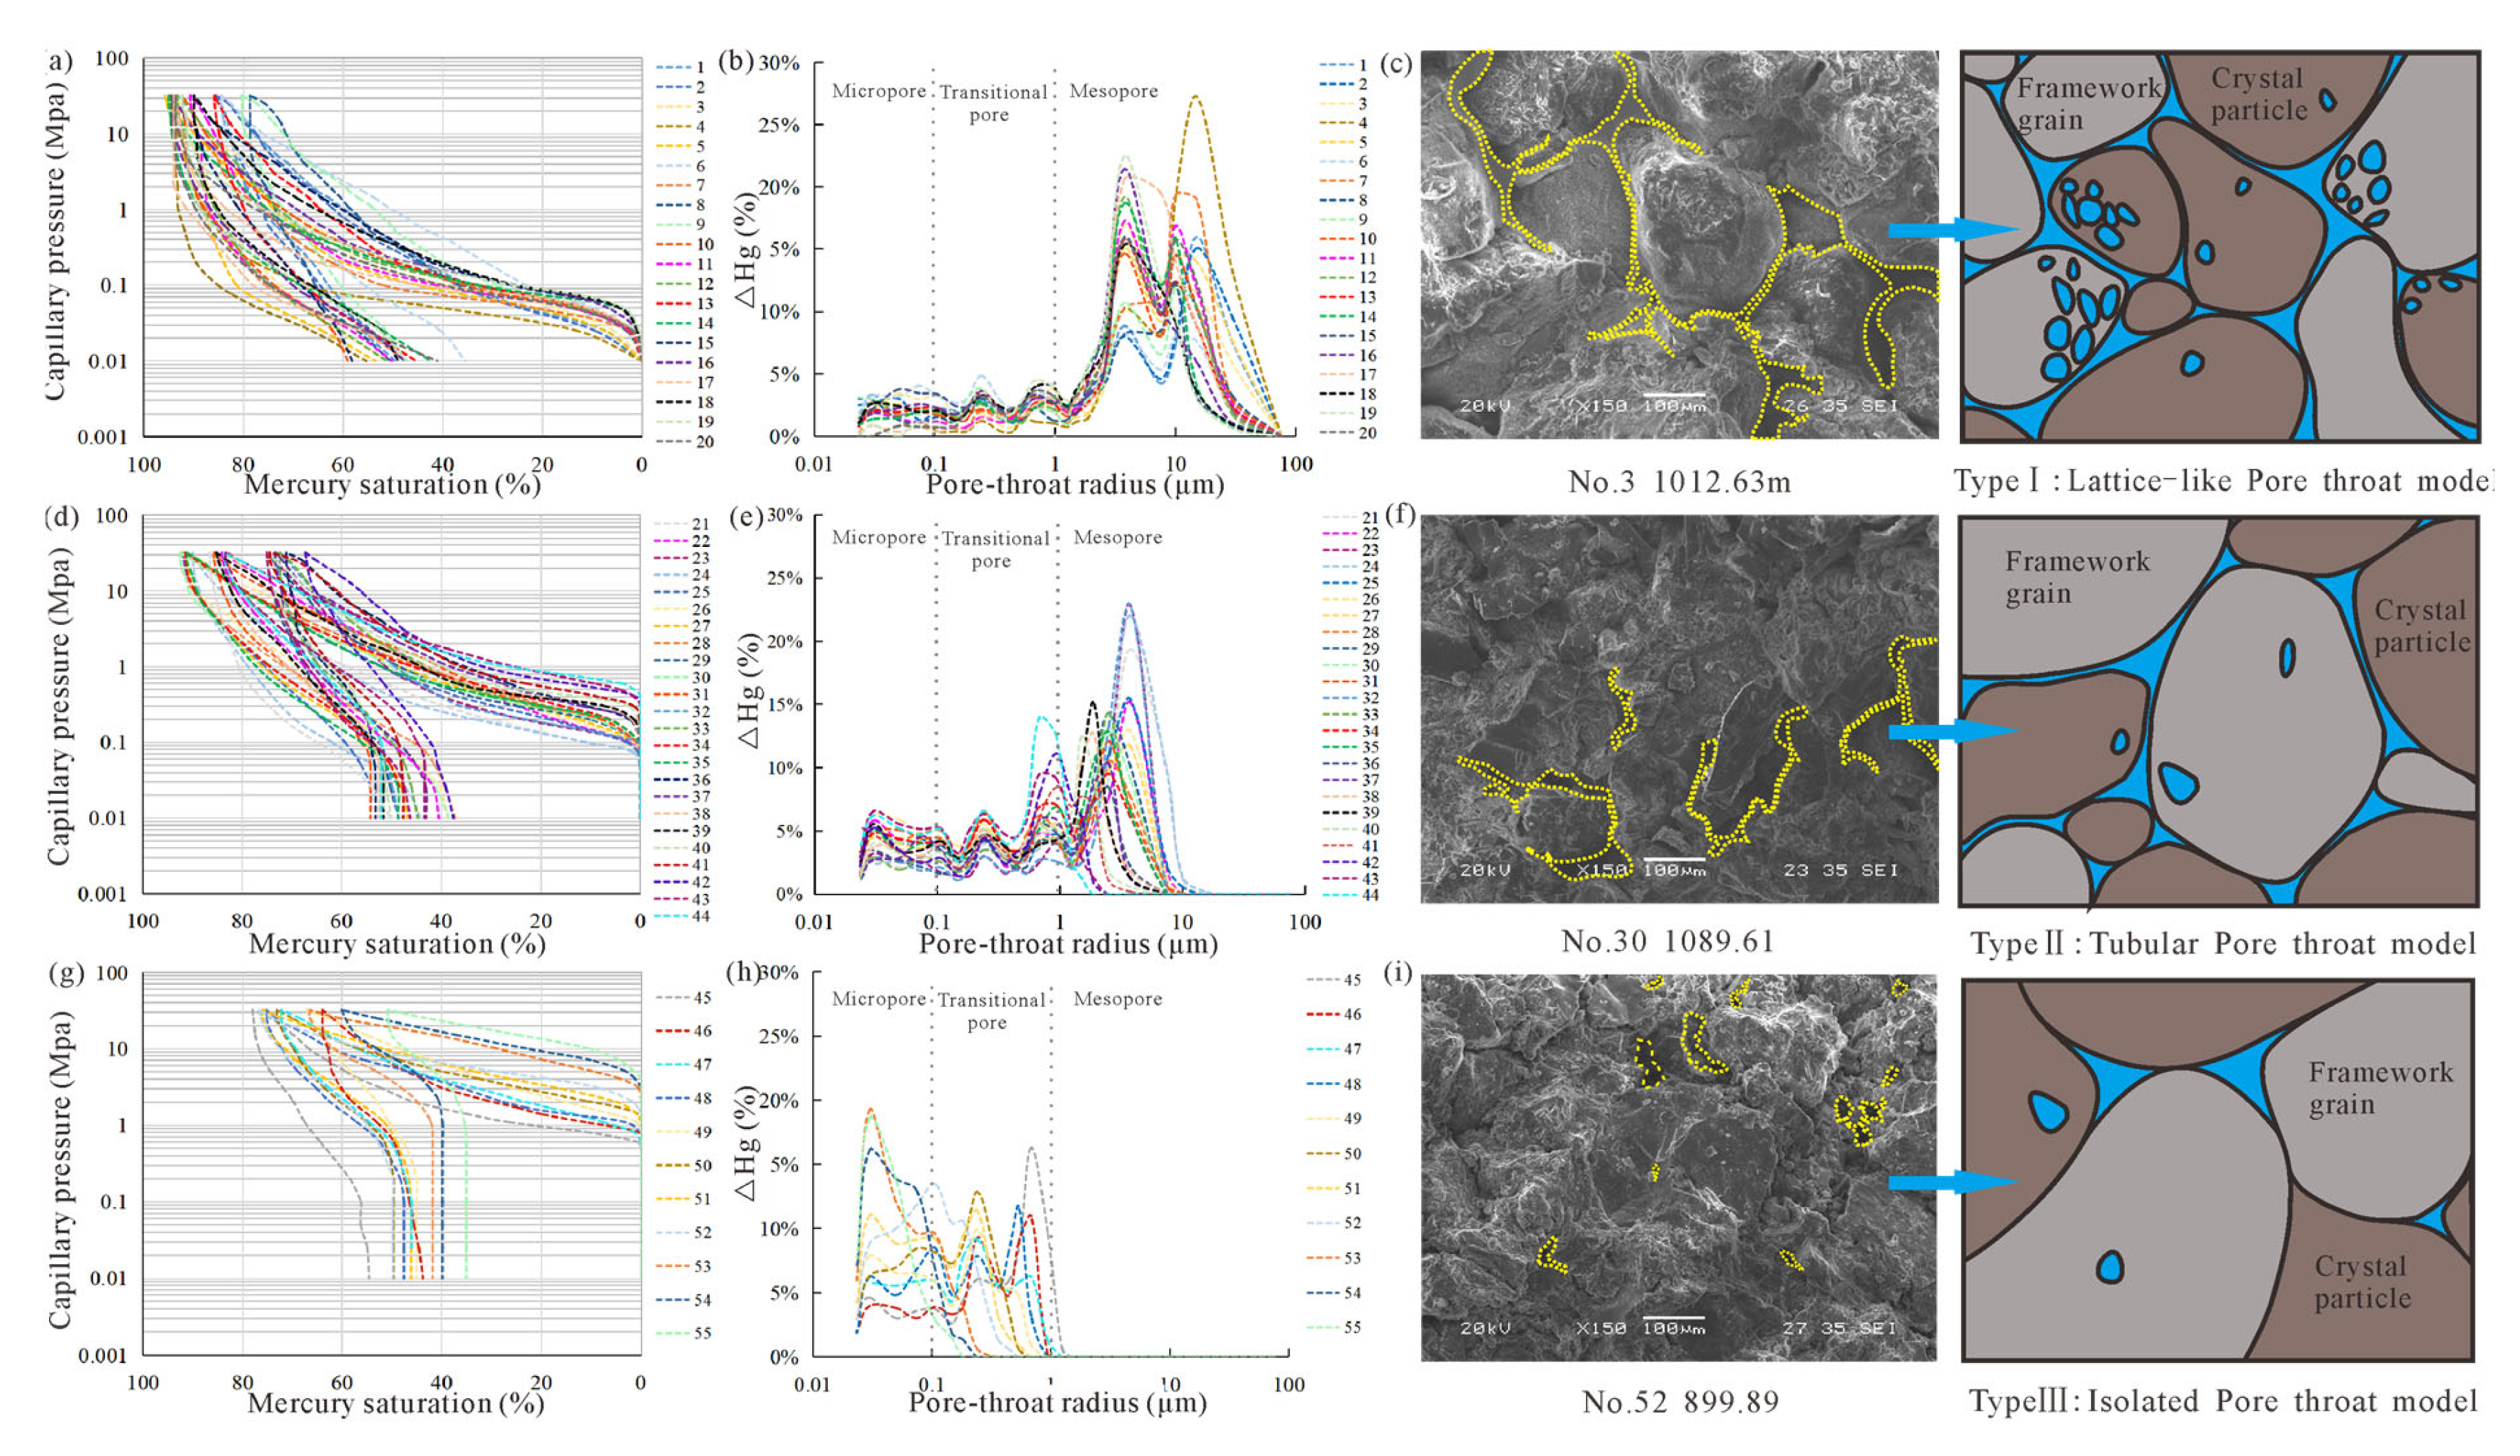
Figure 3h) throat types. The complexity and variety of primary pore throat assemblage types and the relatively weak connectivity are the main constraints on fluid flow. The pore throat structure characteristics and pore size distributions of 55 samples were detected using mercury injection capillary pressure (MICP) analysis [
50]. The samples were categorized into three types based on the type of morphology of the mercury intrusion and extrusion curves, characteristics of the distribution of the pore throat radius, the threshold of the entry pressure, the physical parameters, and the sortability (
Table 1). In summary, when the entry pressure is less than 0.1 MPa, it is a type I reservoir. At 0.1–0.6 MPa, it is a type II reservoir. When the pressure is greater than 0.6 MPa, it is a type III reservoir.
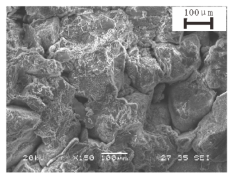
The capillary pressure curves and pore throat radius distribution curves were plotted for each sample. Combined with SEM images, three distinct reservoir pore throat connectivity models were established separately (
Figure 5). The optical microscope uses a 0.03 mm thick sheet to test the pore size and analyze the pore connectivity; the selection of appropriate magnification is essential to obtain accurate and reliable information on the pore structure. Comparisons and analyses of SEM images at different magnifications show that the pore structure of sandstone samples can be clearly demonstrated at 100 μm magnification. Therefore, the SEM images at a 100 μm magnification were chosen for the pore throat connectivity study [
51,
52].
There are type I samples with relatively low entry pressures and high mercury withdrawal efficiency (
Figure 5a). Such samples also have a wider distribution of pore throat sizes. There is a pore throat radius distribution of type I samples with a main peak at 15.0 μm and a secondary peak at about 3.75 μm (
Figure 5b). This type of sandstone has good permeability (average permeability of 23.5 mD) and relatively large pores (average porosity of 15.7%), and the pores are dominated by open pores. The average entry pressure and median pressure are 0.04 MPa and 0.06 MPa, respectively. The average maximum pore throat radius is 18.25 μm. Type I samples have better sorting and strongly positive skewness. The average maximum mercury saturation is 90.16%, and the mercury withdrawal efficiency is 51.74%. In type I reservoirs, the pores are predominantly residual intergranular pores, which make up 69.2% of the total porosity. Secondary dissolution pores account for the remaining 30.8% of the total pores. The pores are mainly large and medium pores, and the throats are mainly fine throats. The distribution of pores and throat channels is uniform. Poor sorting results in low pore coordination numbers and large pore throats. The types of pore structure combinations are large–medium pores and medium–fine throat types, with lattice-like pore throat network connectivity characteristics (
Figure 5c).
The angle between the mercury injection and the mercury withdrawal curve of type I is small, which is distributed below the entry pressure of 0.55 MPa (
Figure 5d). The pore throat radius distribution of type II samples showed a weak double peak, with the main peak at 2.50 μm and the secondary peak at about 0.68 μm (
Figure 5e). The pores for type II are dominated by macropores and mesopores, and the throats are dominated by fine-microfine throats. The sorting of pores and throats is good. The narrow pore throats have an average throat diameter of 0.88 μm, which provides the necessary paths for the residual intergranular pores and connection of dissolution pores. The pore space of this type of reservoir is dominated by open and semi-closed pores with a medium size, medium reservoir storage space, and average pore connectivity. Type II pore throats are typically characterized by tubular shapes (
Figure 5f).
Type III samples have high entry pressures and relatively low mercury withdrawal efficiencies. The plateau segments of the capillary pressure curves for the type III samples were steep (
Figure 5g). The average entry pressure and median pressure are 2.62 MPa and 1.96 MPa, respectively. Sortability is good, averaging 0.10. The angle between the entry mercury and the mercury withdrawal curve of type III is big. The pore throat radius distribution of type III samples mainly has a distinct wide multi-peak type (
Figure 5h). Type III is typically characterized by isolated micro-nanometre pores with poor pore throat connectivity. There is a lack of macropores and effective seepage channels in such samples (
Figure 5i).
4.4. Fractal Features
According to the pore classification criteria, the effective pore of each type of sample was correspondingly divided into micropores (0.01–0.1 μm), mesopores (0.1–1 μm), and macropores (>1 μm). Among the three types of samples, type I samples had the highest percentage of micropores, with an average of 72.0%. Micropores were not developed in type III samples. And in type II samples, there is a high percentage of mesopores. Therefore, a categorized discussion of reservoirs is necessary. Based on the pore throat structure parameters analyzed using the MICP test, scatter plots of log(1-S
Hg) versus log(P
c) for each sample are created in segments, and the slopes of the resulting straight are fitted. Fractal curves of three typical samples are shown, respectively (
Figure 6).
In
Table 2, the fractal dimensions (D1, D2, and D3), porosities (Φ1, Φ2, and Φ3), and permeability contributions (K1, K2, and K3) corresponding to micropores, mesopores, and macropores are calculated for further analysis. For type I samples, the average fractal dimensions (D1, D2, and D3) are 2.62, 2.68, and 2.65, respectively, with corresponding average porosities of 1.25%, 3.22%, and 11.22% (
Figure 6a). For type II samples, the average fractal dimensions (D1, D2, and D3) are 2.53, 2.70, and 2.69, respectively, and the corresponding average porosities are 2.44%, 6.12%, and 6.10% (
Figure 6b). For type III samples, the average fractal dimensions (D1, D2) are 2.54 and 2.69, respectively, with corresponding average porosities of 3.61% and 5.55% (
Figure 6c). The fractal dimension analysis of micropores, mesopores, and macropores in the 55 samples shows that the fractal dimensions all span from 2 to 3. This indicates that the pore throat structure of the Chang 2 reservoir in the study area exhibits fractal characteristics typical of a capillary model. The fractal dimension is closer to 2, and the pore structure is more regular. It being close to 3 indicates that the pore structure and space-filling surface are more complex, and the reservoir is more heterogeneous [
53]. Specifically, the fractal dimension of mesopores is relatively large, that of micropores is smaller, and that of macropores is intermediate (
Figure 6d). With the increases in the fractal dimension, the pore structure becomes more complex, suggesting greater complexity in the mesopore structure. This complexity likely arises from the intricate connectivity between pores and throats in mesopores, which is challenging to distinguish.
The total fractal dimension D was calculated for the 55 samples using Equation (10), with an average value of 2.64. The total fractal dimensions for type I, type II, and type III samples were distributed in the ranges of 2.46–2.77, 2.54–2.77, and 2.45–2.69, respectively. The volume share of different types of pore throats can be indirectly reflected by the relationship between the total fractal dimension and the fractal dimension of each pore throat segment. For type I samples, D is most influenced by macropores, while for type II and type III samples, D is primarily affected by mesopores. That is, the mesopore pore throat heterogeneity is the main controlling factor affecting the overall heterogeneity of the poor reservoir. It is a key area for subsequent reservoir modification.
5. Discussion
5.1. Relationships Between the Fractal Dimension and Reservoir Properties
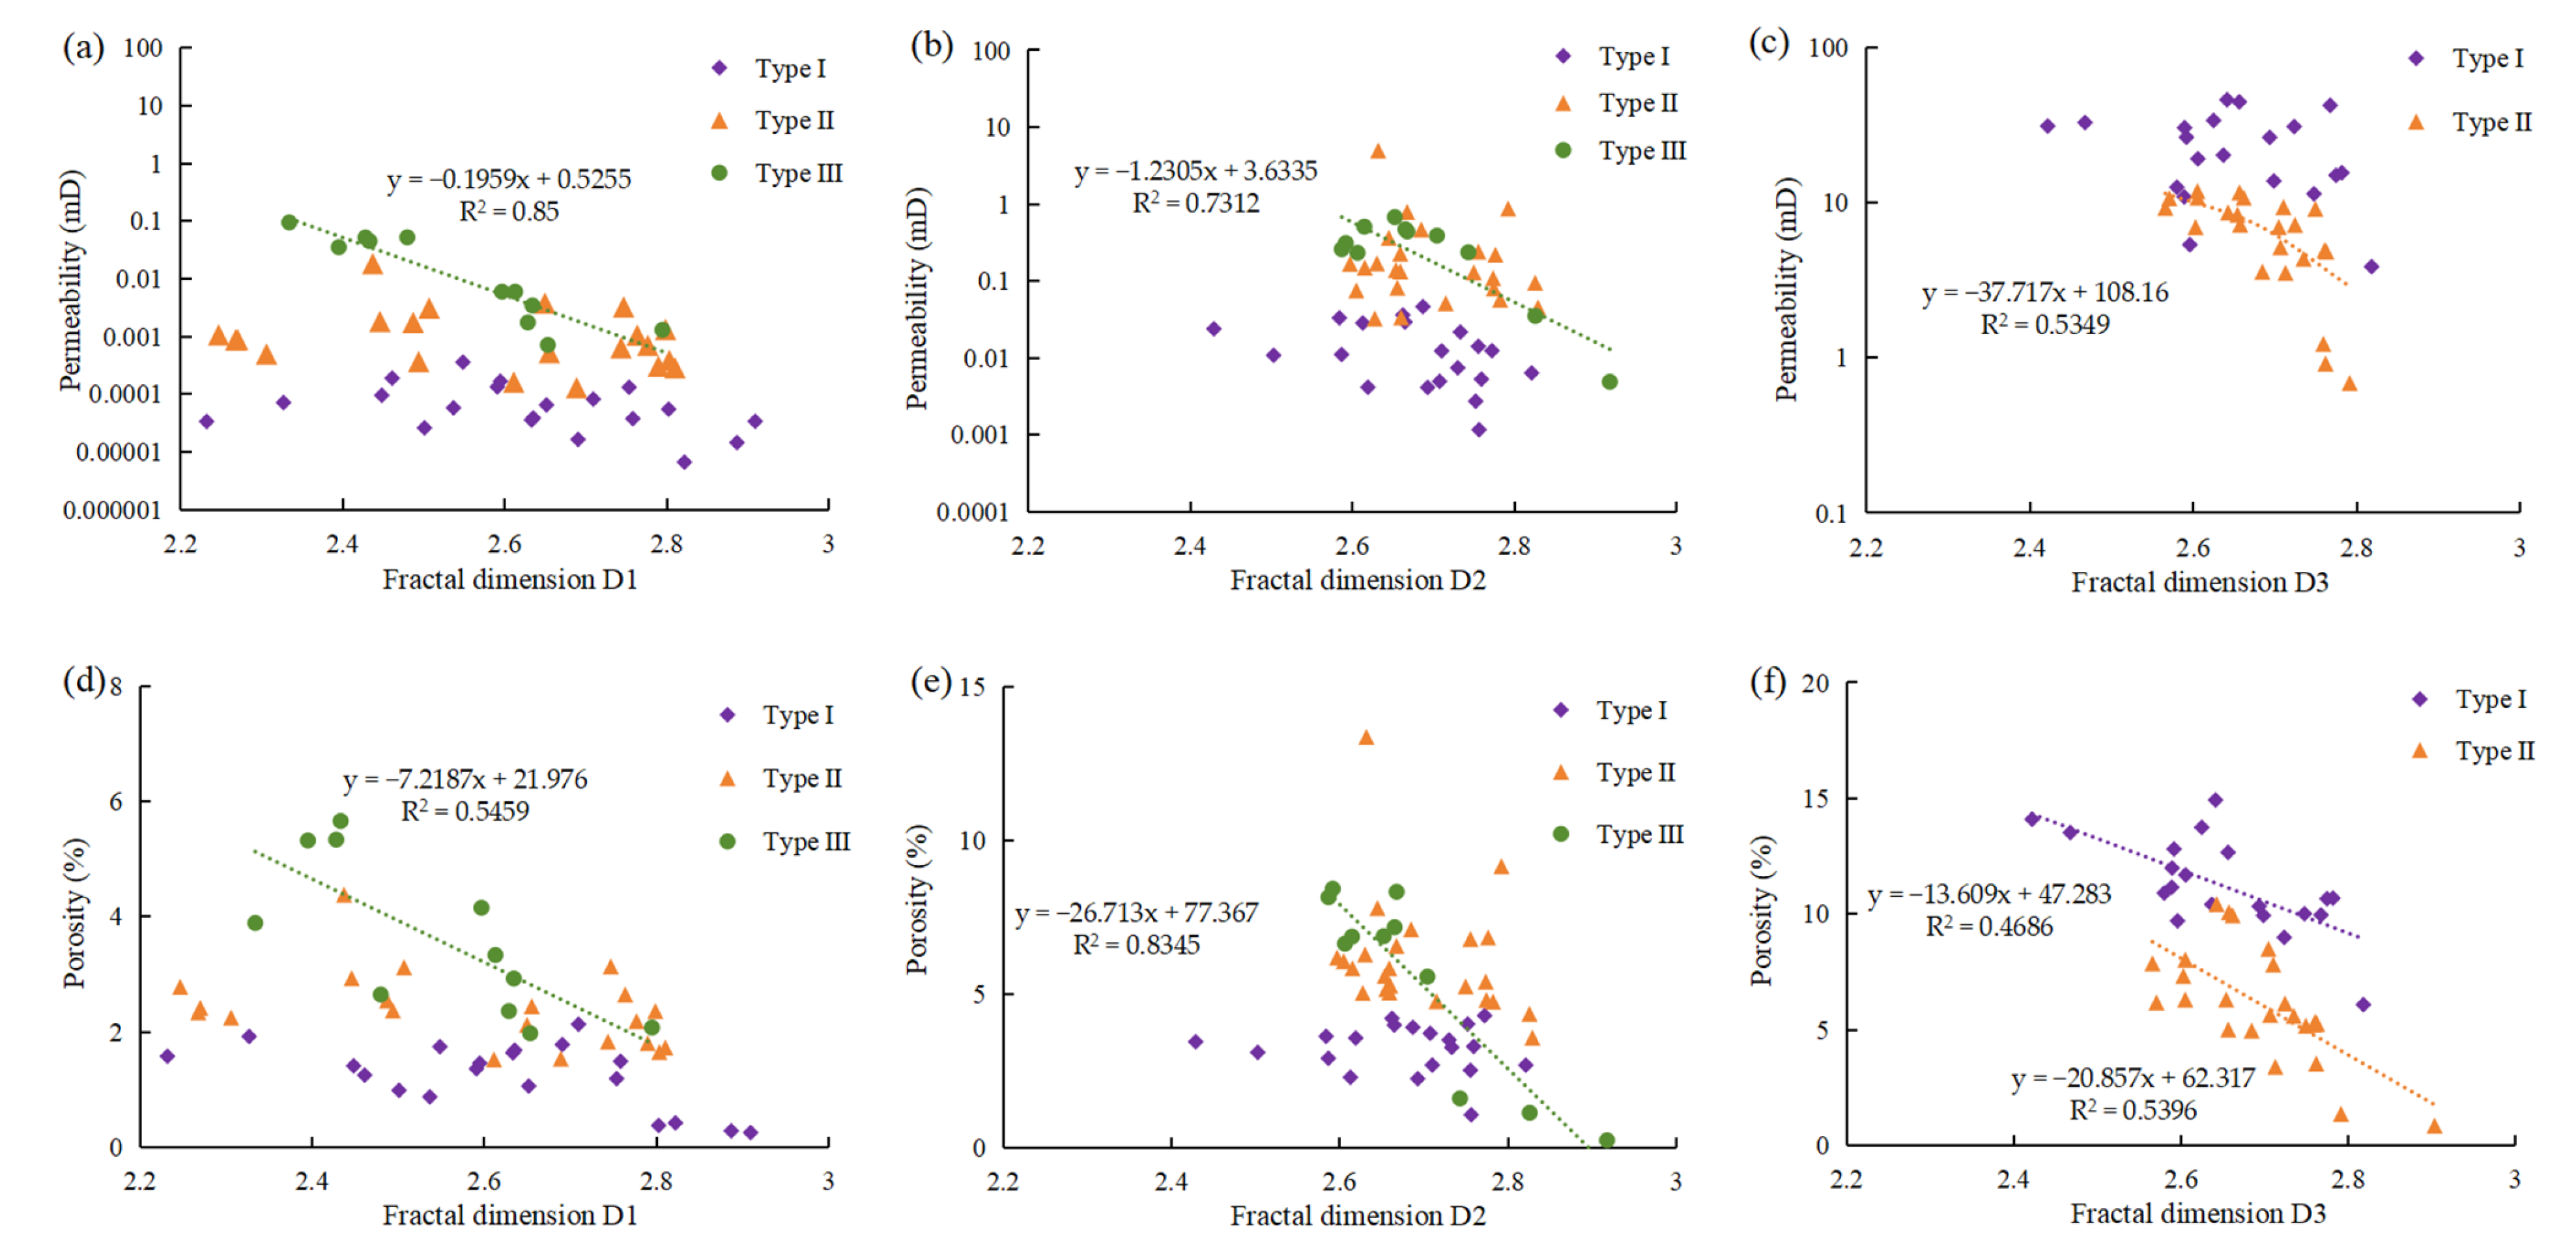
The fractal dimensions of pores of varying sizes were analyzed in relation to their corresponding physical properties. Specifically, D1 and D2 showed a distinct negative correlation with both the porosity and permeability of type III samples (
Figure 7a,b,d,e). Meanwhile, D3 exhibited a strong negative correlation with the porosity and permeability of type II samples (
Figure 7c,f). The porosity of type I samples only has a clear negative correlation with D3 (
Figure 7f). A higher fractal dimension signifies greater complexity and poorer connectivity within the pore throat structure, which, in turn, results in reservoirs with lower porosity and permeability [
54,
55,
56].
Figure 7 further shows that type I and type II samples include micropores, mesopores, and macropores, especially the contribution of macropores, whereas type III samples contain micropores and mesopores. The distribution of macropores is a primary factor influencing reservoir storage and seepage capacity.
As previously noted, in type I and type II samples, the porosity and permeability of the macropores show clear negative correlations with the fractal dimension (
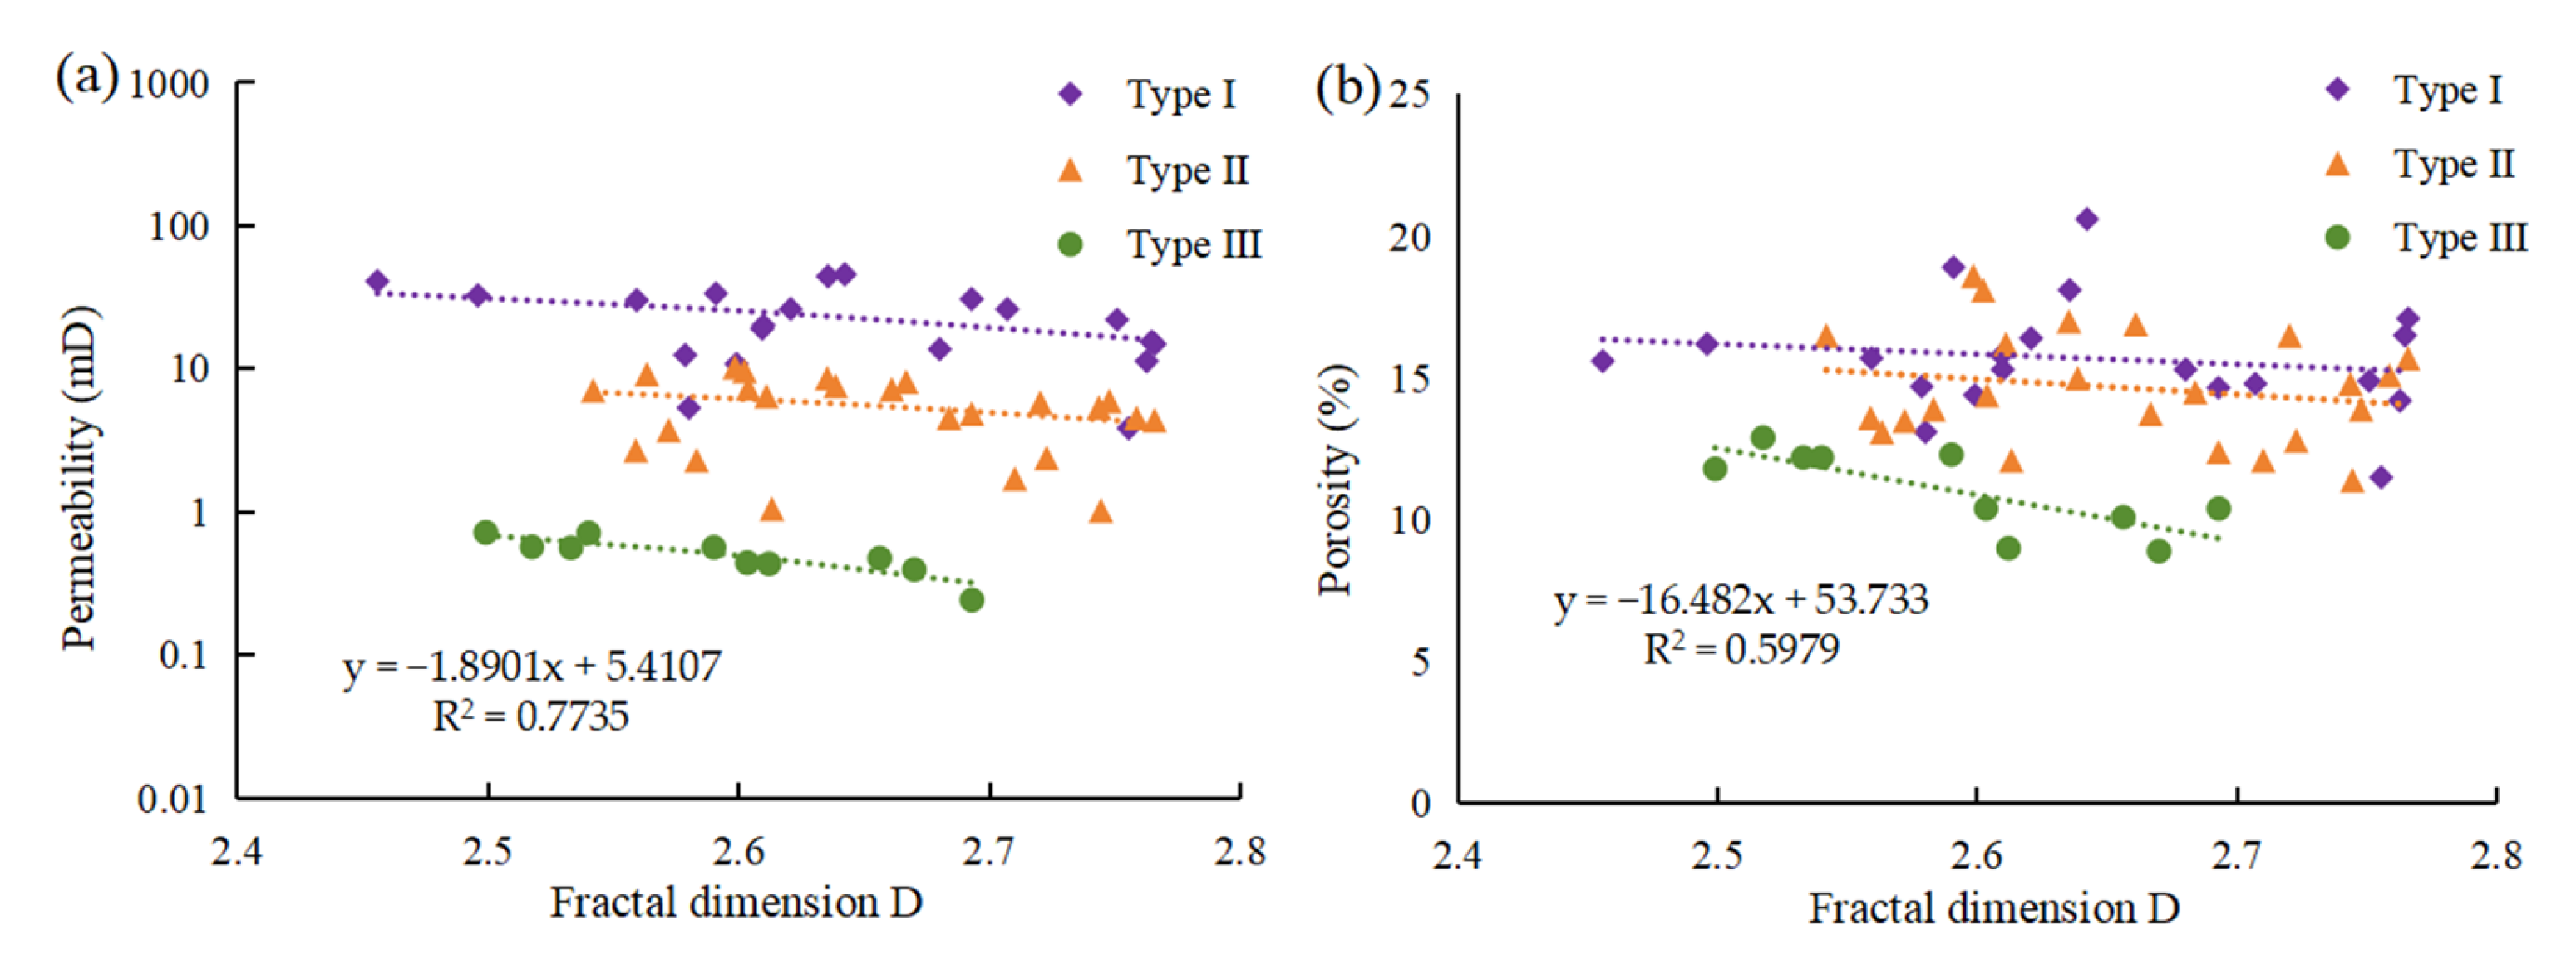
Figure 7). However, the structural complexity of macropores has a diminished effect on porosity and permeability due to micropores and mesopores. There is a strong negative correlation between the fractal dimension and porosity and permeability of type III samples (
Figure 7 and
Figure 8). Overall, the reservoir’s physical properties show a tendency to deteriorate as the complexity of the pore throat structure increases (
Figure 8). The analysis reveals that the fractal dimension can be used as a key parameter to judge the degree of reservoir pore throat development and evaluate the reservoir storage capacity.
5.2. Relationships Between Fractal Dimension and Pore Throat Structure Parameters
In this study, we analyze the correlation between pore throat structural parameters (entry pressure, skewness, maximum pore throat radius, etc.) and the fractal dimension. We explore the factors influencing the pore throat structure in three types of reservoirs, respectively (
Figure 9,
Figure 10,
Figure 11,
Figure 12 and
Figure 13).
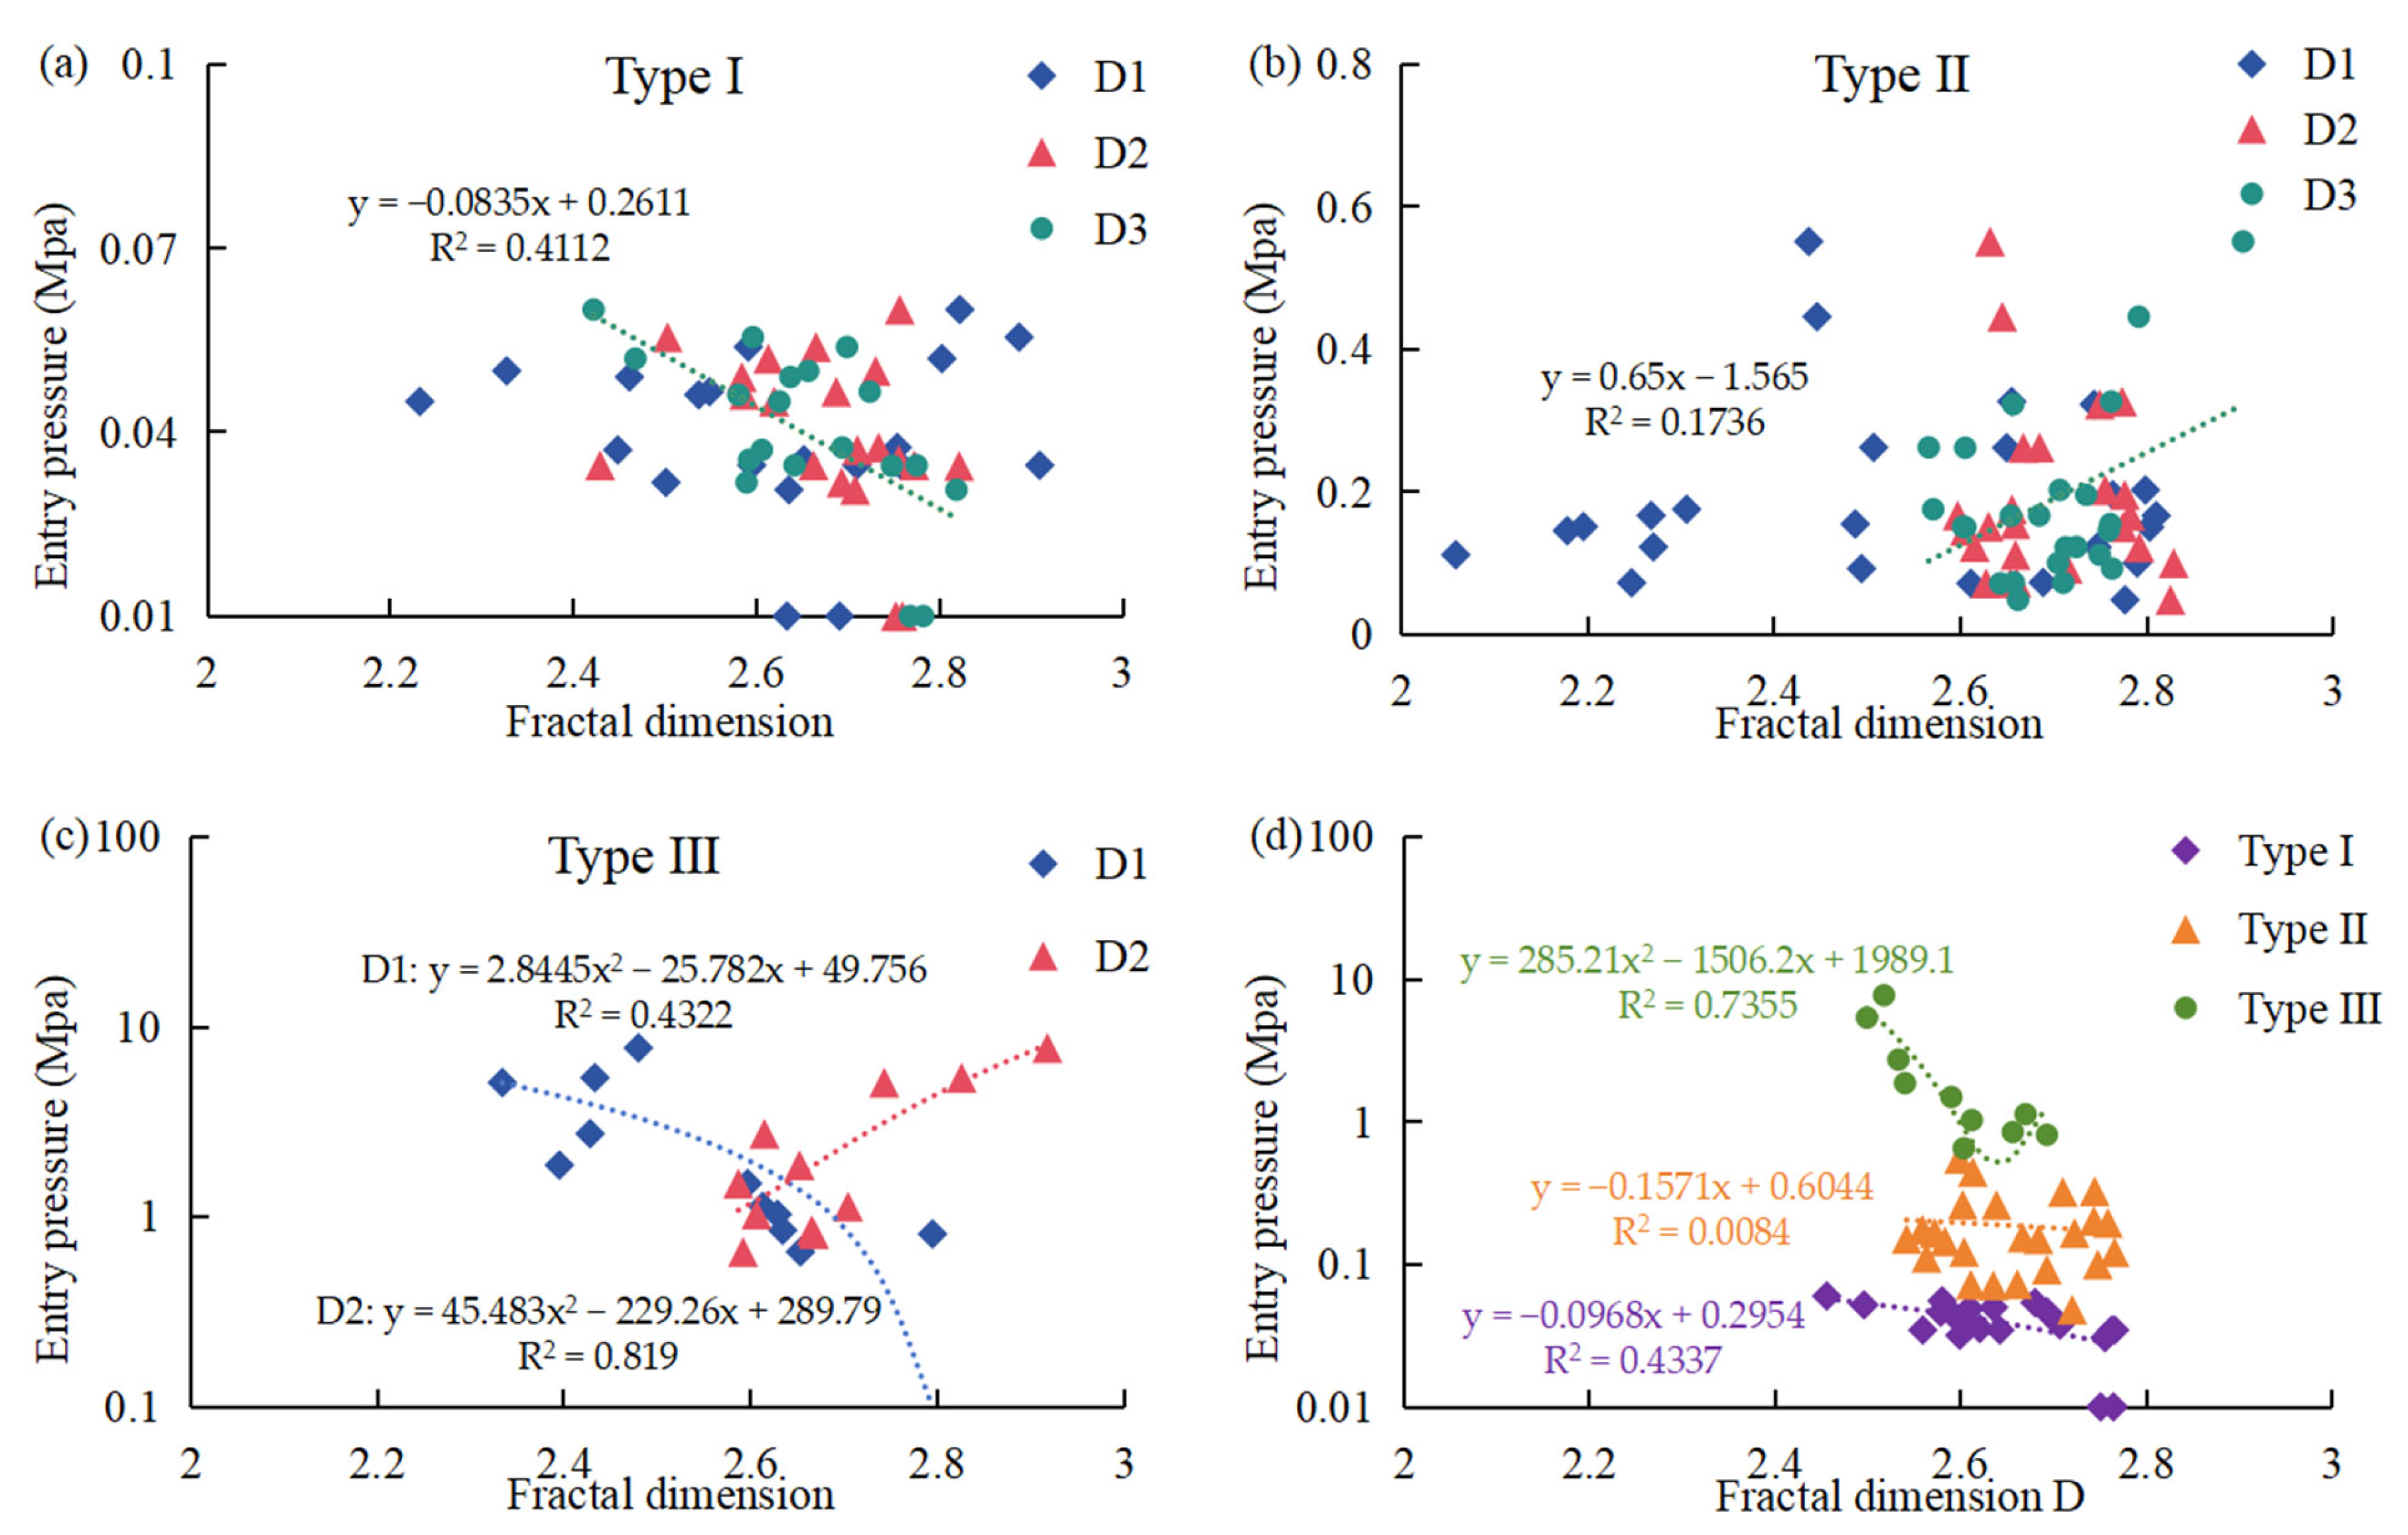
For type I samples, a significant negative correlation was found between D3 and entry pressure (
Figure 9a). For type II samples, no obvious correlation was found between the fractal dimension and the entry pressure (
Figure 9b). Type III samples have a significant negative correlation between D1 and entry pressure and a positive correlation between D2 and entry pressure (
Figure 9c). The analysis of the relationship between fractal dimension (D) and entry pressure reveals that type I samples have a lower entry pressure compared to type II and type III samples (
Figure 9d). Specifically, for type III samples, when D is below 2.65, a more complex pore throat structure corresponds to a lower entry pressure.
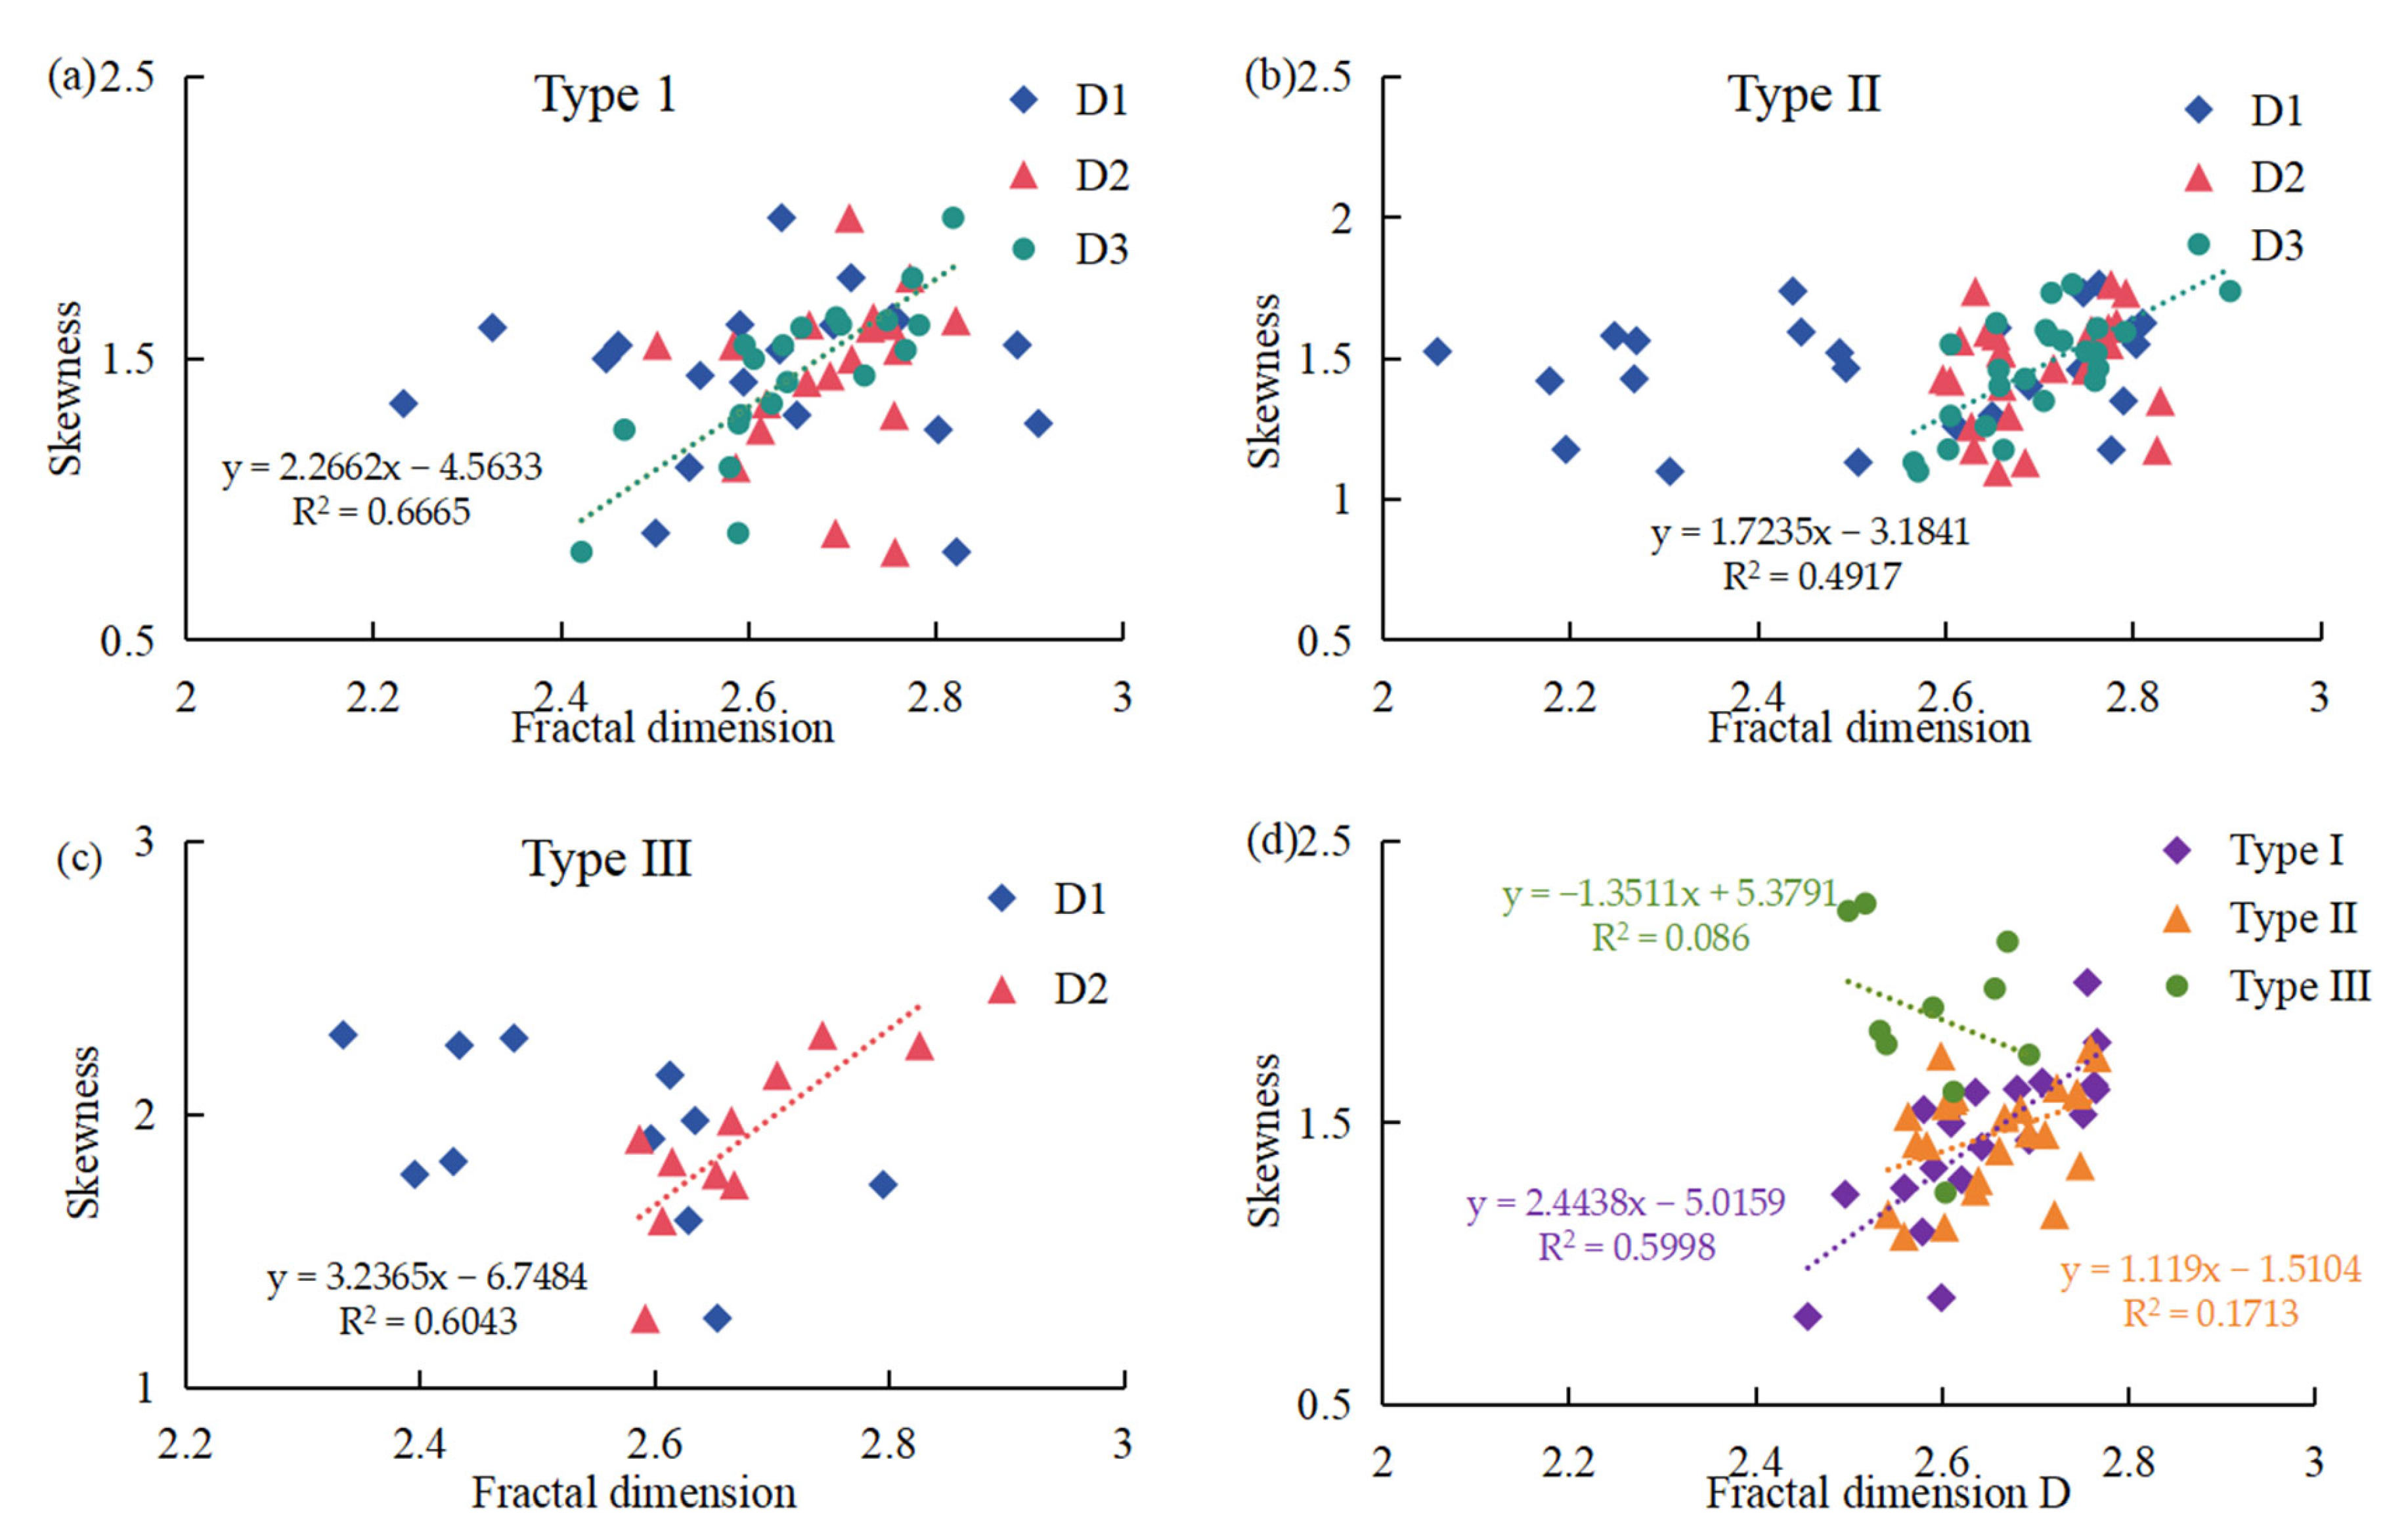
The larger pore fractal dimension is positively correlated with skewness for three types of samples (
Figure 10a–c). The total fractal dimension D of type I samples is positively correlated with skewness. The correlation with skewness is weakened for type II and type III samples due to the influence of micropores (
Figure 10d). This shows that the symmetry of the distribution of micropores and mesopores has a significant effect on the fractal characteristics of the reservoir pore throat structure.
In type I and type II samples, D2 and D are positively correlated with the maximum pore throat radius (
Figure 11a,b,d). In type III samples, there is a positive correlation between the maximum pore throat radius and D1 and a negative correlation with D2 (
Figure 11c). In type III samples, the correlation between the fractal dimension (D) and the maximum pore throat radius indicates that when D is below 2.6, a more complex pore throat structure corresponds to a larger maximum pore throat radius. Conversely, when D exceeds 2.6, a more complex pore throat structure corresponds to a smaller maximum pore throat radius (
Figure 11d).
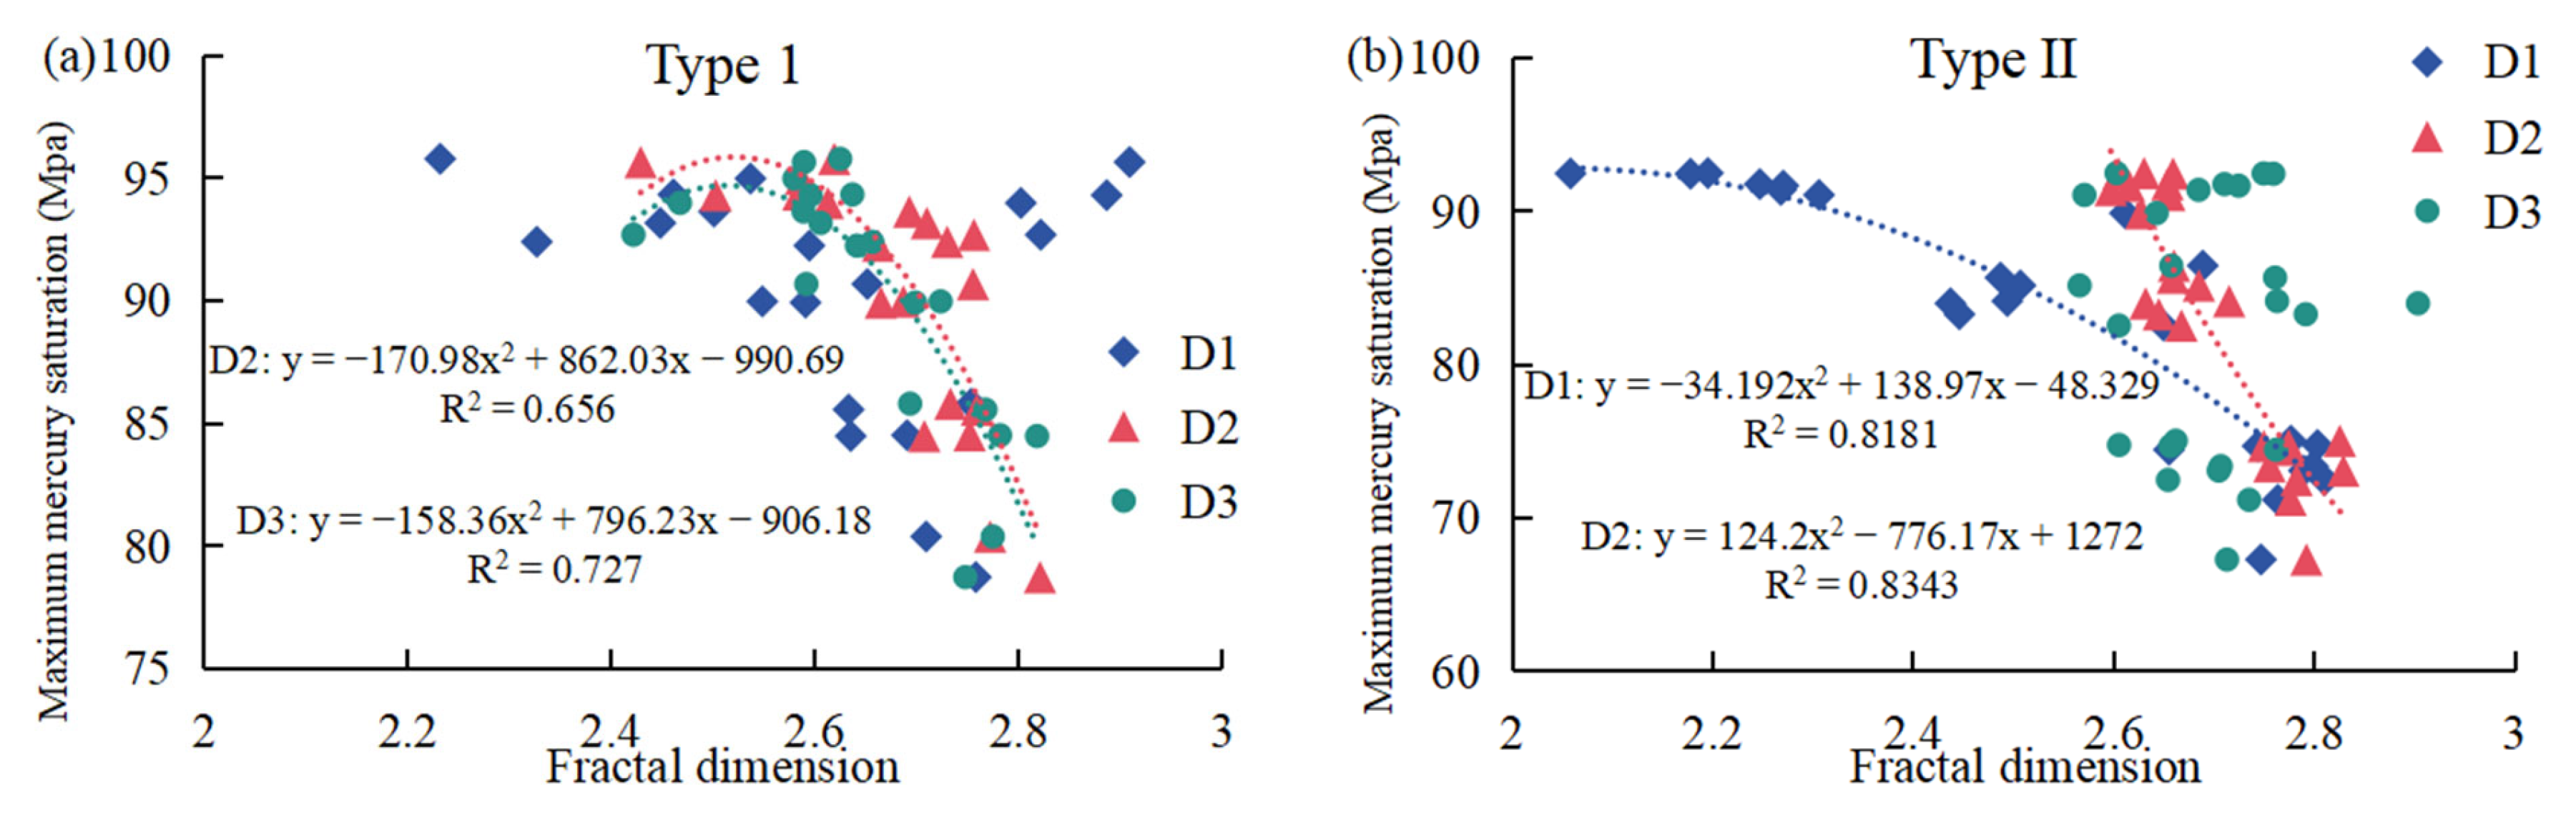
When the fractal dimension exceeds 2.5, the maximum mercury saturation of type I samples exhibits a strong negative correlation with both D2 and D3 (
Figure 12a). The maximum mercury saturation of type II samples shows a significant negative correlation with D1 and D2 (
Figure 12b). The maximum mercury saturation of type III samples shows a significant negative correlation with D2 (
Figure 12c). When the total fractal dimension exceeds 2.6, the maximum mercury saturation of all three types of samples exhibits a strong negative correlation with the fractal dimension (D) (
Figure 12d). This suggests that as the complexity of the pore throat structure increases, the maximum mercury saturation decreases.
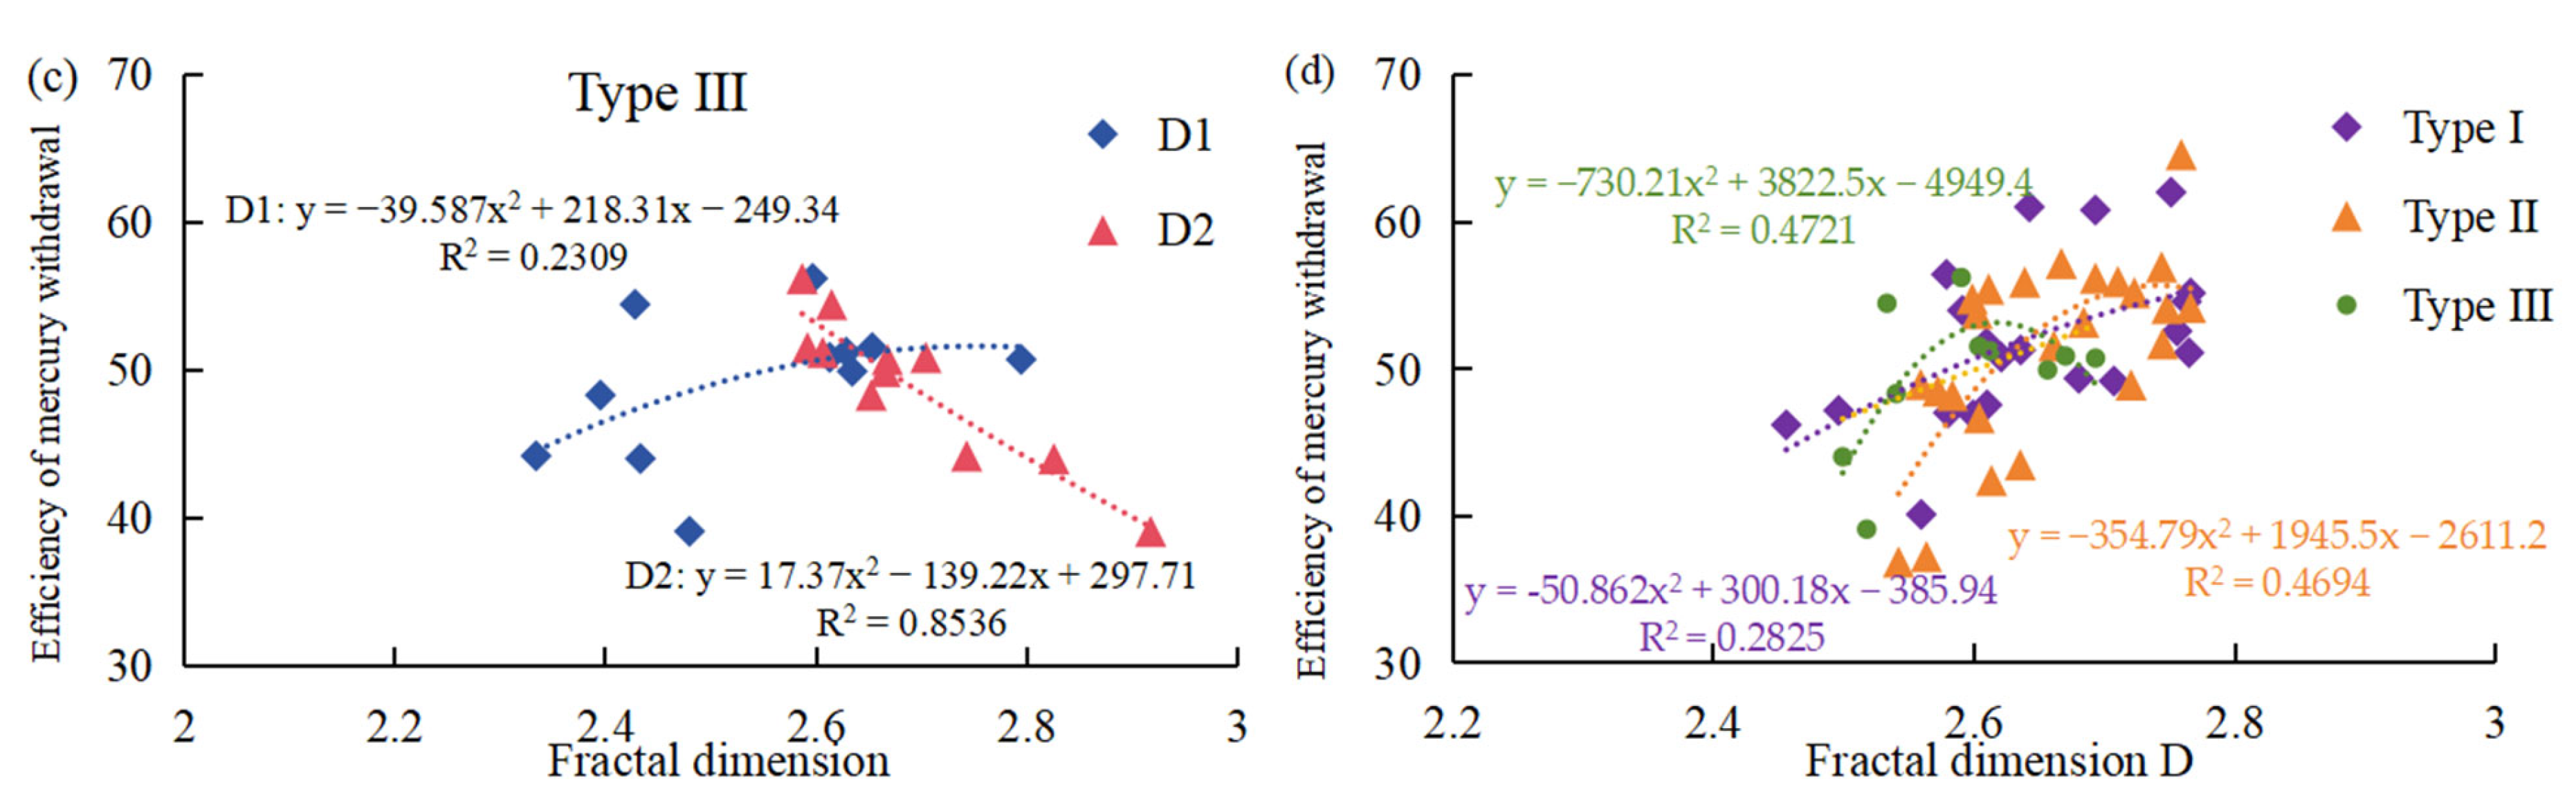
No significant correlation was observed between the efficiency of mercury withdrawal and the fractal dimension in type I samples (
Figure 13a). The D1 of class II samples showed a positive correlation with the mercury desorption efficiency (
Figure 13b). There was a significant negative correlation between D2 and amalgamation efficiency for type III samples (
Figure 13c).
Figure 13d showed a positive correlation between fractal dimension D and the efficiency of mercury withdrawal for type II samples. In type III samples, D was positively correlated with the efficiency of mercury withdrawal when it was less than 2.6. When D was greater than 2.6, it was negatively correlated.
In short, the results of the analysis show that the seepage and storage space of type I reservoirs are more affected by the heterogeneity and surface roughness of the macropores. Type II and type III reservoirs are influenced by mesopores. And the fractal dimension of type III reservoirs is usually quadratically related to the pore throat structural parameters, with the inflection point at D = 2.6. There is a clear correlation between the fractal dimension and the structural parameters of the pore throat. Therefore, the fractal dimension can be used to evaluate the heterogeneity of low-permeability sandstone reservoirs and quantitatively characterize the complexity of each pore throat structure.
5.3. Relationships Between Fractal Dimension and Mineral Composition
The pore throat structure of the samples is controlled by the influence of the mineral composition. The sedimentation process, tectonic deformation process, diagenesis and metamorphic processes, and geochemical processes all influence the distribution of minerals and the pore structure, thereby affecting their fractal characteristics. For example, during metamorphic processes, clay minerals may undergo dehydration and recrystallization, which complicates the pore structure and thereby affects its fractal geometry. The interplay of these processes leads to the complexity and heterogeneity of reservoirs. The pore throat size and the degree of complexity of the reservoir are influenced by the mineral content of quartz, feldspar, and clay [
57]. The relationship between the fractal dimension and mineral content of the three types of samples was analyzed to study the effect of mineral composition on pore throat structure and size (
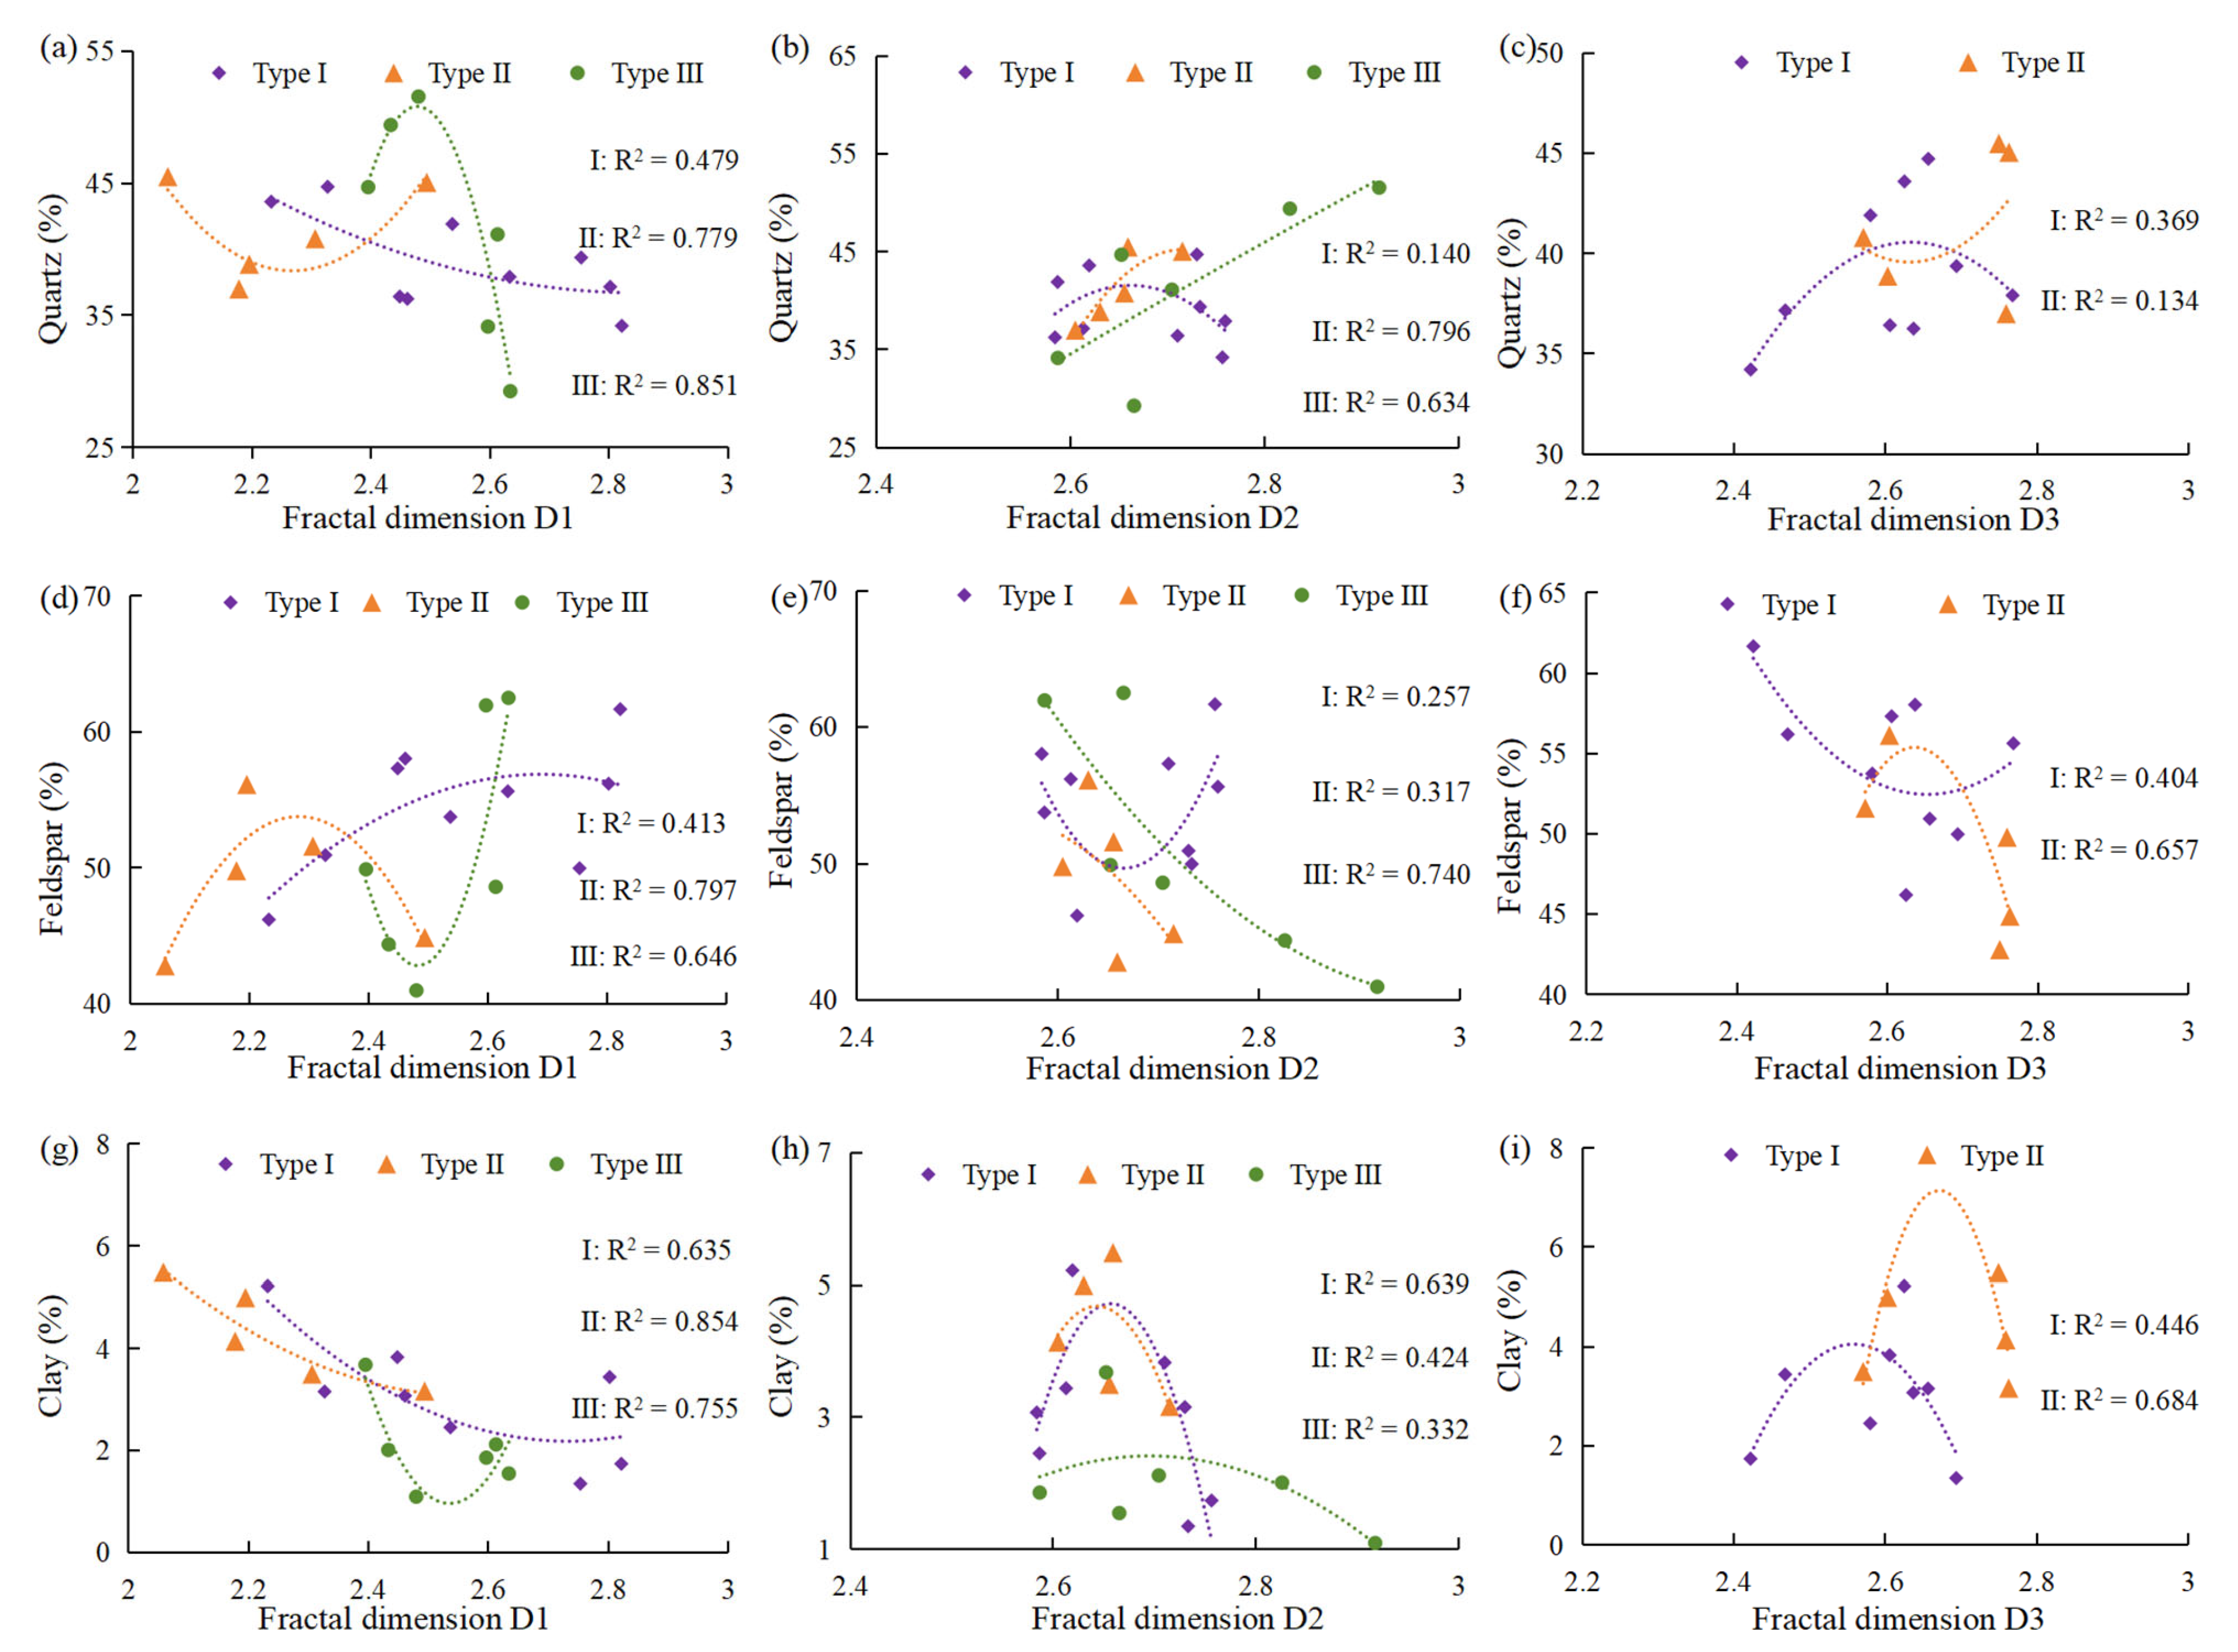
Figure 14). Based on fitting a large number of data points, it was found that the mineral content is usually quadratically related to the fractal dimension.
In type I samples, when the fractal dimension of D1 is below 2.75, D1 tends to increase as the content of quartz and clay decreases. Additionally, the content of feldspar shows a positive correlation with D1. When D1 is greater than 2.75, the increasing trend decreases and eventually stabilizes (
Figure 14a,d,g). When D2 is less than 2.66, the pore throat structure becomes more complex as the quartz and clay content increases and the feldspar content decreases. When D2 is greater than 2.66, the reverse is true (
Figure 14b,e,h). The relationship between D3 and mineral content is similar to that of D2 (
Figure 14c,f,i).
In type II samples, when D1 is less than 2.27, quartz content is negatively correlated with D1 and feldspar content is positively correlated with D1. The opposite is true when D1 is greater than 2.27 (
Figure 13a,d). D1 rises as the clay content decreases (
Figure 14g). In this study, D2 is positively correlated with quartz content but negatively correlated with feldspar content (
Figure 14b,e). When D2 is less than 2.64, it is positively correlated with clay content, and the opposite when D2 is greater than 2.64 (
Figure 14h). When D3 is less than 2.65, there is a negative correlation with quartz content and a positive correlation with feldspar and clay content, and the opposite when D3 is greater than 2.65 (
Figure 14c,f,i).
In type III samples, the pore throat structure becomes more complex with increasing quartz content and decreasing feldspar and clay content when D1 is less than 2.5, and the opposite when D1 is greater than 2.5 (
Figure 14a,d,g); D2 is positively correlated with clay content when it is less than 2.7 and the opposite when D2 is greater than 2.7 (
Figure 14h).
The correlation between D1 and mineral content is more significant, indicating that the pore throat structure of micropores is more influenced by the mineral composition. This is due to the high self-similarity and homogeneity of the micropores.
In summary, the mineral composition has different effects in pore throat structures of different complexity. The differences in particle size and chemical properties among various minerals are significant, which leads to the formation of different pore spaces within reservoirs. This can be attributed to the fact that quartz minerals possess strong resistance to compaction and dissolution, resulting in smooth pore throat surfaces. A high quartz content may increase the pore space in reservoirs, thereby affecting the spatial heterogeneity of the reservoir. The dissolution of feldspar can generate many different types, sizes, and complex structures of pores and throats. If dissolution occurs along cleavage directions, a series of regular pore throats is formed, thus increasing the homogeneity of pore throats in tight sandstone reservoirs. In contrast, if irregular pore throats are generated, the heterogeneity of the pore throat structure in tight sandstone reservoirs is greatly increased [
58]. The formation of clay minerals can occupy pores and block throats, increasing the complexity of the pore throat structure; however, while occupying the primary pores, clay minerals also partially convert them into intercrystalline pores of their own. Illite and chlorite films can effectively inhibit the secondary enlargement of quartz, thereby protecting the intercrystalline pores [
59]. Therefore, minerals such as quartz, feldspar, and clay exert a dual influence on the pore throat structure.
6. Conclusions
(1) The Chang 2 reservoir in the study area is primarily composed of fine-grained feldspar sandstone, characterized by low compositional maturity, good sorting, poor to moderate rounding, high brittleness, and low permeability. The sedimentary environment is relatively stable, with intense diagenetic processes occurring later on. Feldspar and quartz are the most abundant components in the reservoir, accounting for 54.5% and 37.1%, respectively. Clay and carbonate minerals follow in abundance. The most common pore types in the study area are intergranular pores and dissolution pores. The main fillings are chlorite and illite. Tabular and tubular pore throats are well-developed.
(2) Using the capillary pressure curve, pore throat radius distribution, and pore throat structure parameters and combined with SEM images, the 55 samples were classified into three categories, and three different reservoir connectivity models were established. The capillary pressure curves of the type I samples have a long and gentle section, with an entry pressure below 0.1 MPa. Such samples also have a wider distribution of pore throat sizes. The connectivity of the pore throat is the typical lattice model. The angle between the mercury injection curve and mercury withdrawal curve of the type II sample is small, and the entry pressure is less than 0.6 MPa. The distribution curve of the pore throat radius is double-peaked. The pore throat connectivity is characterized by a tubular model. The platform section of the capillary pressure curve of type III samples is short. The physical properties are poor, and the entry pressure is greater than 0.6 MPa. The pore throat radius size is small, lacking macropores. It is an isolated pore throat structure model. Reservoir classification provides a theoretical basis for the selection of sweet spots in petroleum exploration.
(3) Based on fractal theory, the segmented fractal dimensions and the total fractal dimension of each sample were calculated, respectively. The pore throat structure can be divided into three segments: micropores, mesopores, and macropores. The average fractal dimensions for micropores, mesopores, and macropores are 2.57, 2.69, and 2.67, respectively. This study reveals that the surfaces of micropores are smooth, and the heterogeneity of the pore throat structure is weak. For type II and type III reservoirs, the total fractal dimension is more significantly influenced by mesopores. Therefore, mesopores can be considered as the primary target area for reservoir modification.
(4) D1, D2, D3, and D all exhibit a negative correlation with porosity and permeability. This indicates that a complex pore throat structure leads to a decrease in the reservoir’s storage and permeability capabilities. The fractal dimensions of the three types of reservoirs show a clear correlation with pore throat structural parameters such as entry pressure, skewness, and maximum mercury saturation. Therefore, fractal dimensions can be used to evaluate the development degree and heterogeneity of reservoir pore throat structures and to quantitatively characterize the complexity of pore throat structures.
(5) Mineral composition is influenced by a variety of geological factors. During the process of sedimentary diagenesis, the composition and distribution of minerals are affected. Quartz, feldspar, and clay exhibit a complex quadratic relationship with the fractal dimension. Therefore, mineral content has a dual impact on the pore throat structure. Due to the high self-similarity and uniformity of micropores, the pore throat structure of micropores is more significantly influenced by the mineral composition. Identifying the growth mechanisms, transformation processes, and pore-protection effects of minerals is an important research direction for analyzing the pore throat structure of sandstone.
Author Contributions
Conceptualization, H.Z. and L.G.; methodology, H.Z. and L.G.; software, H.Z. and X.L.; validation, H.Z., J.L. and L.G.; formal analysis, H.Z. and L.G.; investigation, X.L. and Y.W.; resources, J.L. and Z.W.; data curation, H.Z., Z.W. and Y.T.; writing—original draft preparation, H.Z.; writing—review and editing, L.G.; visualization, Z.W.; supervision, Z.W.; project administration, Z.W.; funding acquisition, Z.W. All authors have read and agreed to the published version of the manuscript.
Funding
This research was funded by the National Natural Science Foundation of China (grant number 41302076).
Data Availability Statement
All data generated or analyzed during this study are included in this published article.
Acknowledgments
This work was supported by the State Key Laboratory of Continental Dynamics and PetroChina Changqing Oilfield Company. Finally, we would like to express our thanks to the reviewers of this paper.
Conflicts of Interest
Authors Xiaojun Li, Junfeng Liu, Yiping Wang and Yafei Tian are employed by The Second Oil Production Plant of PetroChina Changqing Oilfield Company. The remaining authors declare that the research was conducted in the absence of any commercial or financial relationships that could be construed as a potential conflict of interest.
References
- Ouyang, S.; Sun, W.; Wu, Y.; Meng, Z.; Li, G.; Zhao, D. Seepage characteristics and infliuencing factors of low permeability-ultra low permeability reservoir: A case of Chang 6 reservoir in Houshi-Xinghe area of Ansai oilfield in Ordos Basin. Geol. Sci. Technol. Inf. 2019, 38, 199–207. [Google Scholar]
- Zou, C.; Zhu, R.; Liu, K.; Su, L.; Bai, B.; Zhang, X.; Yuan, X.; Wang, J. Tight gas sandstone reservoirs in China: Characteristics and recognition criteria. J. Pet. Sci. Eng. 2012, 89, 82–91. [Google Scholar]
- Gao, H.; Li, H. Pore structure characterization, permeability evaluation and enhanced gas recovery techniques of tight gas sandstones. J. Nat. Gas Sci. Eng. 2016, 28, 536–547. [Google Scholar] [CrossRef]
- Desbois, G.; Urai, J.; Kukla, P.; Konstanty, J.; Baerle, C. High-resolution 3D fabric and porosity model in a tight gas sandstone reservoir: A new approach to investigate microstructures from mm-to nm-scale combing argon beam cross sectioning and SEM imaging. J. Pet. Sci. Eng. 2011, 78, 243–257. [Google Scholar]
- Sun, L.; Zou, C.; Jia, A.; Wei, Y.; Zhu, R.; Wu, S.; Guo, Z. Development characteristics and orientation of tight oil and gas in China. Pet. Explor. Dev. 2019, 46, 1073–1087. [Google Scholar]
- Hu, S.; Tao, S.; Yan, W.; Men, G.; Tang, Z.; Xue, J.; Jia, X.; Chen, X.; Jiang, T.; Huang, D.; et al. Advances on continental tight oil accumulation and key technologies for exploration and development in China. Nat. Gas Geosci. 2019, 30, 1083–1093. [Google Scholar]
- Li, Y.; Luo, H.; Li, H.; Liu, X.; Tan, Y.; Chen, S.; Cai, J. A brief review of dynamic capillarity effect and its characteristics in low permeability and tight reservoirs. J. Pet. Sci. Eng. 2020, 189, 106959. [Google Scholar]
- Zou, C.; Zhu, R.; Bai, B.; Yang, Z.; Hou, L.; Ziia, M.; Fu, J.; Shao, Y.; Liu, K.; Cao, H.; et al. Significance, geologic characteristics. Resource potential and future challenges of tight oil and shale oil. Bull. Mineral. Petrol. Geochem. 2015, 34, 3–17. [Google Scholar]
- Zou, C.; Yang, Z.; Zhu, R.; Zhang, G.; Hou, L.; Wu, S.; Tao, S.; Yuan, X.; Dong, D.; Wang, Y.; et al. Progress in China’s unconventional oil & gas exploration and development and theoretical technologies. Acta Geol. Sin. 2015, 89, 979–1007. [Google Scholar]
- Wei, X.; Hu, Y.; Zhao, H.; Kang, R.; Shi, X.; Liu, X. New geological understanding of tight sandstone gas. Lithol. Reserv. 2017, 29, 11–20. [Google Scholar]
- He, D.; Li, D.; Tong, X.; Wu, X. Integrated 3D hydrocarbon exploration in sedimentary basins of China. Oil Gas Geol. 2021, 42, 265–284. [Google Scholar]
- Li, F.; Wang, F.; Zhao, Z. Characteristics of Chang 2 reservoir in Resiwan oil region of Zichang oilfield, Ordos Basin. J. Guilin Univ. Technol. 2024, 44, 402–408. [Google Scholar]
- Cui, Q. Characteristics of Different Reservoirs and Development Strategy in Yanchang Oilfield of Ordos Basin—A Case Study of Zhenjiamao Chang 6 Reservoir, Haojiaping Chang 2 Reservoir and Laozhuang Yan 9 Reservoir. Ph.D. Thesis, Northwest University, Xi’an, China, 2020. [Google Scholar]
- Chen, B. Research on Diagenesis Difference and Productivity Evaluation of Low Permeability Sandstone Reservoir—Taking Yan’an Formation and Yanchang Formation in Ordos Basin as Examples. Ph.D. Thesis, Northwest University, Xi’an, China, 2020. [Google Scholar]
- Wang, W.; Lin, C.; Zhang, X. Fractal Dimension Analysis of Pore Throat Structure in Tight Sandstone Reservoirs of Huagang Formation: Jiaxing Area of East China Sea Basin. Fractal Fract. 2024, 8, 374. [Google Scholar] [CrossRef]
- Qu, Y.; OUyang, S.; Gao, J.; Shi, J.; Wu, Y. Pore Space Characteristics and Migration Changes in Hydrocarbons in Shale Reservoir. Fractal Fract. 2024, 8, 588. [Google Scholar] [CrossRef]
- Lu, Y.; Liu, K. Pore Structure Characterization of Eocene Low-Permeability Sandstones via Fractal Analysis and Machine Learning: An Example from the Dongying Depression, Bohai Bay Basin, China. ACS Omega 2021, 6, 11693–11710. [Google Scholar]
- Cai, L.; Guo, X.; Zhang, X.; Zeng, Z.; Xiao, G. Pore-throat structures of the Permian Longtan Formation tight sandstones in the South Yellow Sea Basin, China: A case study from borehole CSDP-2. J. Pet. Sci. Eng. 2020, 186, 106733. [Google Scholar] [CrossRef]
- Wu, Y.; Tahmasebi, P.; Lin, C.; Munawar, M.; Cnudde, V. Effects of micropores on geometric, topological and transport properties of pore systems for low-permeability porous media. J. Hydrol. 2019, 575, 327–342. [Google Scholar]
- Geng, L.; Li, G.; Wang, M.; Li, Y.; Tian, S.; Pang, W.; Liu, Z. A fractal production prediction model for shale gas reservoirs. J. Nat. Gas Sci. Eng. 2018, 55, 354–367. [Google Scholar]
- He, T.; Zhou, Y.; Xie, Y.; Shang, Y.; Chen, T.; Zhang, Z. Research on the microscopic pore-throat structure and reservoir quality of tight sandstone using fractal dimensions. Sci. Rep. 2024, 14, 22825. [Google Scholar]
- Liu, D.; Gu, Z.; Liang, R.; Su, J.; Ren, D.; Chen, B.; Huang, C.; Yang, C. Impacts of Pore-Throat System on Fractal Characterization of Tight Sandstones. Geofluids 2020, 1, 4941501. [Google Scholar] [CrossRef]
- Xia, Y.; Cai, J.; Perfect, E.; Wei, W.; Zhang, Q.; Meng, Q. Fractal dimension, lacunarity and succolarity analyses on CT images of reservoir rocks for permeability prediction. J. Hydrol. 2019, 579, 124–198. [Google Scholar] [CrossRef]
- Wang, C. Research on Characteristics of Chang 6 Reservoir in Huanxian Area, Ordos Basin. Master’s Dissertation, Xi’an Shiyou University, Xi’an, China, 2022; pp. 1–63. [Google Scholar]
- Huang, W.; Lu, S.; Hersi, O.; Wang, M.; Deng, S.; Lu, R. Reservoir spaces in tight sandstones: Classification, fractal characters, and heterogeneity. J. Nat. Gas Sci. Eng. 2017, 46, 80–92. [Google Scholar] [CrossRef]
- Li, X.; Wei, W.; Wang, L.; Cai, J. Fractal dimension of digital 3D rock models with different pore structures. Energies 2022, 15, 7461. [Google Scholar] [CrossRef]
- Jouini, M.; Alabere, A.; Alsuwaidi, M.; Morad, S.; Bouchaala, F.; Jallad, O. Experimental and digital investigations of heterogeneity in lower cretaceous carbonate reservoir using fractal and multifractal concepts. Sci. Rep. 2023, 13, 20306. [Google Scholar] [CrossRef]
- Liu, M.; Xie, R.; Li, C.; Li, X.; Jin, G.; Guo, J. Determining the segmentation point for calculating the fractal dimension from mercury injection capillary pressure curves in tight sandstone. J. Geophys. Eng. 2018, 15, 1350–1362. [Google Scholar] [CrossRef]
- Wu, Y.; Tahmasebi, P.; Lin, C.; Zahid, M.; Dong, C.; Golab, A.; Ren, L. A comprehensive study on geometric, topological and fractal characterizations of pore systems in low-permeability reservoirs based on SEM, MICP, NMR, and X-ray CT experiments. Mar. Pet. Geol. 2019, 103, 12–28. [Google Scholar] [CrossRef]
- Rahner, M.; Halisch, M.; Fernandes, C.; Weller, A.; Santos, V. Fractal dimensions of pore spaces in unconventional reservoir rocks using X-ray nano- and micro-computed tomography. J. Nat. Gas Sci. Eng. 2018, 55, 298–311. [Google Scholar] [CrossRef]
- Gao, Y. Research on Brittleness Evaluation and Main Controlling Factors of Tight Oil Reservoirs—A Case Study from Triassic Yanchang Formation Chang 7 Oil Formation in Dingbian Dongrengou Oilfield, Ordos Basin. Master’s Thesis, Northwest University, Xi’an, China, 2022; pp. 1–89. [Google Scholar]
- Li, A.; Qiang, Q.; Xu, L.; Zhang, W.; Yin, S.; Xie, H. Chemical characteristics of formation water of Chang 2 oil formation of Yanchang Formation in Zhaike area, Ordos Basin and its indication to dense oil reservoir. Nat. Gas Geosci. 2022, 33, 1637–1647. [Google Scholar]
- Wang, L.; Li, W.; Liu, Q.; Wang, D.; Zhang, M.; Bai, B. Lithofacies characteristics and sedimentary environment of Chang 7 black shale in the Yanchang Formation, Ordos Basin. J. Palaeogr. 2023, 25, 598–613. [Google Scholar]
- Lv, Q.; Xin, H.; Wang, L.; Luo, S.; Dan, W.; Feng, S. Sedimentary types, characteristics and model of lacustrine fine-grained gravity flow in the Member 7 of Trassic Yanchang Formation in Ningxian area, Ordos Basin. J. Palaeogeogr. 2023, 25, 823–840. [Google Scholar]
- Alberti, G.; Nuzzaci, G. 1.6.5 SEM and TEM techniques. World Crop Pests 1996, 6, 399–410. [Google Scholar]
- SY/T 5336-2006; Recommend practices for core analysis. Petroleum Industry Press: Shandong, China, 2006.
- SY/T 5162-2014; Analytical method of rock sample by scanning electron microscope. Petroleum Industry Press: Shandong, China, 2014.
- SY/T 5368-2000; Thin section examination of rock. Petroleum Industry Press: Beijing, China, 2000.
- SY/T 5916-2013; Identification method of rocks and minerals by cathode luminescence. Petroleum Industry Press: Beijing, China, 2013.
- SY/T 29171-2012; Rock capillery pressure measurement. Petroleum Industry Press: Beijing, China, 2012.
- Guo, R.; Xie, Q.; Qu, X.; Chu, M.; Li, S.; Ma, D.; Ma, X. Fractal characteristics of pore-throat structure and permeability estimation of tight sandstone reservoirs: A case study of Chang 7 of the Upper Triassic Yanchang Formation in Longdong area, Ordos Basin, China. J. Pet. Sci. Eng. 2020, 184, 106555. [Google Scholar]
- Zhong, X.; Zhu, Y.; Jiao, T.; Qi, Z.; Luo, J.; Xie, Y.; Liu, L. Microscopic pore throat structures and water flooding in heterogeneous low-permeability sandstone reservoirs: A case study of the Jurassic Yan’an Formation in the Huanjiang area, Ordos Basin, Northern China. J. Asian Earth Sci. 2021, 219, 104903. [Google Scholar] [CrossRef]
- Purcell, W.R. Capillary pressures: Their measurement using mercury and the calculation of permeability therefrom: American Institute of Mechanical Engineers Petroleum Transactions. J. Pet. Technol. 1949, 2, 39–48. [Google Scholar]
- Xoaoth, B. Coal and Gas Outburst; Song, S., Wang, Y., Eds.; Song, S.; Wang, Y., Translators; China Industry Press: Beijing, China, 1966. [Google Scholar]
- Jiang, Z. Sedimentary Science; Petroleum Industry Press: Beijing, China, 2003; pp. 1–424. [Google Scholar]
- Guo, L.; Jiang, Z.; Guo, F. Mineralogy and fracture development characteristics of marine shale-gas reservoirs: A case study of Lower Silurian strata in southeastern margin of Sichuan Basin, China. J. Cent. South Univ. 2015, 22, 1847–1858. [Google Scholar]
- Zhang, Z. Study on Water Injection Technology of Chang 2 Reservoir in Haojiaping Oilfield. Master’s Dissertation, Xi’an Shiyou University, Xi’an, China, 2014; pp. 1–64. [Google Scholar]
- Lu, H.; Wang, Q.; Du, X.; Guo, L.; Yan, G.; Wang, X.; Liu, J. Low-permeability reservoir types classification and reservoir sensitivity controlling factors: A case study of Paleogene in Bohai Sea. Acta Pet. Sin. 2019, 40, 1331–1345. [Google Scholar]
- Lala, A.; Sayed, N. Controls of pore throat radius distribution on permeability. J. Pet. Sci. Eng. 2017, 157, 941–950. [Google Scholar]
- Zhang, Q.; Liu, Y.; Wang, B.; Ruan, J.; Yan, N.; Chen, H. Effects of pore-throat structures on the fluid mobility in chang 7 tight sandstone reservoirs of longdong area, Ordos Basin. Mar. Pet. Geol. 2022, 135, 105407. [Google Scholar]
- Chai, S.; Lu, J.; Li, L.; Zhang, Y.; Zhang, Z. In situ laser heating and high temperature imaging in scanning electron microscopy. J. Chin. Electron Microsc. Soc. 2025, 01, 018. [Google Scholar]
- Li, K.; Jia, Y.; Han, Y.; Lei, F.; Lin, F.; Wang, T.; Chen, W. Quantitative characterization of microscopic structure of carbonate rocks from coal measures in tectonic zone based on MIP and SEM. China Coal 2025, 1, 022. [Google Scholar]
- Wu, Y.; Liu, C.; Ouyang, S.; Luo, B.; Zhao, D.; Sun, W.; Awan, R.; Lu, Z.; Li, G.; Zang, Q. Investigation of pore-throat structure and fractal characteristics of tight sandstones using HPMI, CRMI, and NMR methods:A case study of the lower Shihezi Formation in the Sulige area, Ordos Basin. J. Pet. Sci. Eng. 2022, 210, 110053. [Google Scholar]
- Yang, M.; Pan, Y.; Feng, H.; Yan, Q.; Lu, Y.; Wang, W.; Qi, Y.; Zhu, H. Fractal Characteristics of Pore Structure of Longmaxi Shales with Different Burial Depths in Southern Sichuan and Its Geological Significance. Fractal Fract. 2025, 9, 2. [Google Scholar]
- Cui, H.; Zhu, S.; Wang, J.; Gao, Y.; Wan, C.; Tong, H. Physical Properties, Pore-Throat Structure, Fractal Characteristics and Their Effects on the Gas-Bearing Capacity of Tight Sandstone: A Case Study from the Northern Tianhuan Depression, Ordos Basin, China. Nat. Resour. Res. 2022, 31, 1559–1584. [Google Scholar]
- Zhang, H.; Guo, L.; Wu, Z.; Ma, J. Pore-throat structure, fractal characteristics and permeability prediction of tight sandstone: The Yanchang Formation, Southeast Ordos Basin. Sci. Rep. 2024, 14, 27913. [Google Scholar] [CrossRef] [PubMed]
- Zhao, H.; Luo, T.; He, P.; Sun, J.; Li, T. Fractal characteristics andin fluencing factors of tight reservoirs in Shanxi Formation in southern Ordos Basin. Unc. Oil. Gas. 2024, 11, 37–45. [Google Scholar]
- Qu, Y.; Sun, W.; Tao, R.; Luo, B.; Chen, L.; Ren, D. Pore-throat structure and fractal characteristics of tight sandstones in Yanchang Formation, Ordos Basin. Mar. Pet. Geol. 2020, 120, 104573. [Google Scholar]
- Cai, L.; Yang, T.; Tian, J.; Yi, J.; Ren, Q. Advances in Studies of Development and Growth Mechanisms of Clay Minerals in Tight Sandstone Reservoirs. Acta Sedimentol. Sin. 2023, 41, 1859–1889. [Google Scholar]
Figure 1.
Tectonic position of the study area (a) and comprehensive histogram of the Extension Formation (b).
Figure 1.
Tectonic position of the study area (a) and comprehensive histogram of the Extension Formation (b).
Figure 2.
The mineral component and reservoir space types of the Yanchang Formation in the Haojiaping area. N—number of samples.
Figure 2.
The mineral component and reservoir space types of the Yanchang Formation in the Haojiaping area. N—number of samples.
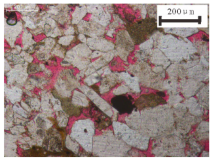
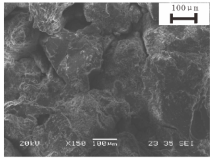
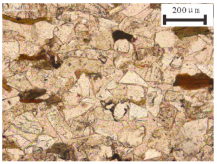
Figure 3.
Mineral composition and pore throat types in the Haojiaping area based on CL, CTS, and SEM. (a) CL thin section image showing orthoclase and plagioclase. (b) CL thin section image showing calcite cement. (c) CL thin section image showing small amounts of calcite accounting for feldspar. (d) CL thin section image showing quartz and feldspar. (e) CTS image showing intergranular pores, solution pores developed, and quartz secondary overgrowth. Sheet shape throat. (f) CTS image showing intergranular pores and solution pores developed. (g) CTS image showing microfractures and tubular throat. (h) CTS image showing quartz secondary overgrowth and neck shape throat. (i) SEM image showing regular feldspar dissolved pore. (j) SEM image showing illite, chlorite, and authigenic quartz. (k) SEM image showing feldspar dissolves to form large pores. (l) SEM image showing self-growing feldspar symbiotic with chlorite.
Figure 4.
Petrophysical characteristics of the study area. (a) Distribution graph of porosity. (b) Distribution graph of permeability. (c) Porosity and permeability relationship graph (showing an index correlation).
Figure 4.
Petrophysical characteristics of the study area. (a) Distribution graph of porosity. (b) Distribution graph of permeability. (c) Porosity and permeability relationship graph (showing an index correlation).
Figure 5.
Capillary pressure curves, pore throat size distribution curves, and pore throat connectivity characteristics according to SEM and its connectivity model. (a) Capillary pressure curves for type I samples. (b) Distribution curves of pore throat radius for type I samples. (c) Model of pore-throat connectivity for type I samples. (d) Capillary pressure curves for type II samples. (e) Distribution curves of pore throat radius for type II samples. (f) Model of pore-throat connectivity for type II samples. (g) Capillary pressure curves for type III samples. (h) Distribution curves of pore throat radius for type III samples. (i) Model of pore-throat connectivity for type III samples.
Figure 6.
Fractal characteristic curves of typical samples with the three types of pore throat structures. (a) Fractal dimension curve of type I samples. (b) Fractal dimension curve of type II samples. (c) Fractal dimension curve of type III samples. (d) The fractal dimension comparison of different sizes of pore throats.
Figure 7.
Fractal dimensions D1, D2, and D3 versus permeability (a–c) and porosity (d–f) of three types of samples.
Figure 7.
Fractal dimensions D1, D2, and D3 versus permeability (a–c) and porosity (d–f) of three types of samples.
Figure 8.
Correlation of fractal dimension D with permeability (a) and porosity (b) of three types of samples.
Figure 8.
Correlation of fractal dimension D with permeability (a) and porosity (b) of three types of samples.
Figure 9.
Correlation of fractal dimension with entry pressure of three types of samples. (a) Correlation between fractal dimension and entry pressure for type I samples. (b) Correlation between fractal dimension and entry pressure for type II samples. (c) Correlation between fractal dimension and entry pressure for type III samples. (d) Correlation between total fractal dimension D and entry pressure for three types samples.
Figure 10.
Correlation of fractal dimension with skewness of three types of samples. (a) Correlation between fractal dimension and skewness for type I samples. (b) Correlation between fractal dimension and skewness for type II samples. (c) Correlation between fractal dimension and skewness for type III samples. (d) Correlation between total fractal dimension D and skewness for three types samples.
Figure 11.
Correlation of fractal dimension with maximum pore throat radius of three types of samples. (a) Correlation between fractal dimension and maximum pore throat radius for type I samples. (b) Correlation between fractal dimension and maximum pore throat radius for type II samples. (c) Correlation between fractal dimension and maximum pore throat radius for type III samples. (d) Correlation between total fractal dimension D and maximum pore throat radius for three types samples.
Figure 12.
Correlation of fractal dimension with maximum mercury saturation of three types of samples. (a) Correlation between fractal dimension and maximum mercury saturation for type I samples. (b) Correlation between fractal dimension and maximum mercury saturation for type II samples. (c) Correlation between fractal dimension and maximum mercury saturation for type III samples. (d) Correlation between total fractal dimension D and maximum mercury saturation for three types samples.
Figure 13.
Correlation of fractal dimension with efficiency of mercury withdrawal of three types of samples. (a) Correlation between fractal dimension and efficiency of mercury withdrawal for type I samples. (b) Correlation between fractal dimension and efficiency of mercury withdrawal for type II samples. (c) Correlation between fractal dimension and efficiency of mercury withdrawal for type III samples. (d) Correlation between total fractal dimension D and efficiency of mercury withdrawal for three types samples.
Figure 14.
Quartz content versus D1 (a), D2 (b), and D3 (c). Feldspar content versus D1 (d), D2 (e), and D3 (f). Clay content versus D1 (g), D2 (h), and D3 (i). (The curves represent trend lines for each type of sample).
Figure 14.
Quartz content versus D1 (a), D2 (b), and D3 (c). Feldspar content versus D1 (d), D2 (e), and D3 (f). Clay content versus D1 (g), D2 (h), and D3 (i). (The curves represent trend lines for each type of sample).
Table 1.
Characteristics of different types of reservoirs of the Yanchang Formation in the Haojiaping area (the statistical process removes outliers).
Table 2.
Fractal dimension calculation results of the Chang 2 sandstone samples in the Haojiaping area.
Table 2.
Fractal dimension calculation results of the Chang 2 sandstone samples in the Haojiaping area.
| Type | Number | D1 | Φ1 (%) | K1 (mD) | D2 | Φ2 (%) | K2 (mD) | D3 | Φ3 (%) | K3 (mD) | D |
|---|
| I | 1 | 2.69 | 1.78 | 0.00002 | 2.75 | 4.03 | 0.00276 | 2.78 | 10.69 | 15.49 | 2.76 |
| 2 | 2.63 | 1.64 | 0.00004 | 2.76 | 3.30 | 0.00533 | 2.77 | 9.96 | 42.05 | 2.75 |
| 3 | 2.33 | 1.92 | 0.00007 | 2.73 | 3.51 | 0.00748 | 2.66 | 12.67 | 44.28 | 2.64 |
| 4 | 2.82 | 0.43 | 0.00001 | 2.76 | 1.08 | 0.00117 | 2.42 | 14.10 | 30.94 | 2.46 |
| 5 | 2.23 | 1.58 | 0.00003 | 2.62 | 3.57 | 0.00419 | 2.62 | 13.75 | 33.62 | 2.59 |
| 6 | 2.64 | 1.69 | 0.00004 | 2.71 | 3.73 | 0.00499 | 2.82 | 6.09 | 3.85 | 2.76 |
| 7 | 2.50 | 0.99 | 0.00003 | 2.69 | 2.25 | 0.00416 | 2.59 | 11.16 | 10.83 | 2.60 |
| 8 | 2.76 | 1.49 | 0.00004 | 2.82 | 2.69 | 0.00642 | 2.75 | 10.02 | 11.33 | 2.76 |
| 9 | 2.71 | 2.13 | 0.00008 | 2.77 | 4.30 | 0.01248 | 2.77 | 10.66 | 14.92 | 2.77 |
| 10 | 2.59 | 1.46 | 0.00017 | 2.66 | 4.21 | 0.03628 | 2.64 | 14.93 | 45.69 | 2.64 |
| 11 | 2.65 | 1.06 | 0.00007 | 2.76 | 2.52 | 0.01422 | 2.59 | 12.81 | 26.20 | 2.62 |
| 12 | 2.45 | 1.41 | 0.00010 | 2.71 | 2.69 | 0.01241 | 2.61 | 11.69 | 19.05 | 2.61 |
| 13 | 2.75 | 1.19 | 0.00013 | 2.73 | 3.27 | 0.02182 | 2.69 | 10.34 | 26.15 | 2.71 |
| 14 | 2.54 | 0.88 | 0.00006 | 2.59 | 2.91 | 0.01114 | 2.58 | 10.91 | 12.49 | 2.58 |
| 15 | 2.55 | 1.75 | 0.00036 | 2.69 | 3.92 | 0.04664 | 2.72 | 8.99 | 30.70 | 2.69 |
| 16 | 2.46 | 1.25 | 0.00019 | 2.58 | 3.63 | 0.03329 | 2.64 | 10.42 | 20.11 | 2.61 |
| 17 | 2.80 | 0.38 | 0.00006 | 2.61 | 2.30 | 0.02859 | 2.47 | 13.52 | 32.60 | 2.50 |
| 18 | 2.59 | 1.36 | 0.00013 | 2.66 | 3.99 | 0.02944 | 2.70 | 9.94 | 13.70 | 2.68 |
| 19 | 2.89 | 0.29 | 0.00001 | 2.50 | 3.11 | 0.01089 | 2.60 | 9.71 | 5.33 | 2.58 |
| 20 | 2.91 | 0.26 | 0.00003 | 2.43 | 3.45 | 0.02401 | 2.59 | 11.99 | 30.18 | 2.56 |
| II | 21 | 2.61 | 1.53 | 0.00016 | 2.63 | 5.04 | 0.03273 | 2.64 | 10.43 | 8.60 | 2.64 |
| 22 | 2.69 | 1.54 | 0.00013 | 2.66 | 5.28 | 0.03387 | 2.66 | 10.08 | 7.18 | 2.66 |
| 23 | 2.49 | 2.37 | 0.00037 | 2.72 | 4.77 | 0.05165 | 2.76 | 5.26 | 4.82 | 2.69 |
| 24 | 2.78 | 2.19 | 0.00070 | 2.83 | 4.36 | 0.09539 | 2.66 | 9.95 | 19.72 | 2.72 |
| 25 | 2.25 | 2.78 | 0.00107 | 2.65 | 5.59 | 0.13976 | 2.71 | 7.82 | 13.31 | 2.61 |
| 26 | 2.06 | 2.87 | 0.00126 | 2.66 | 5.05 | 0.13387 | 2.75 | 5.18 | 9.07 | 2.56 |
| 27 | 2.27 | 2.42 | 0.00088 | 2.62 | 5.84 | 0.15019 | 2.72 | 6.14 | 7.16 | 2.60 |
| 28 | 2.18 | 2.59 | 0.00047 | 2.60 | 6.07 | 0.07578 | 2.76 | 5.24 | 2.23 | 2.58 |
| 29 | 2.80 | 1.66 | 0.00039 | 2.77 | 4.81 | 0.08056 | 2.61 | 8.03 | 4.47 | 2.68 |
| 30 | 2.20 | 2.88 | 0.00118 | 2.63 | 6.29 | 0.17031 | 2.60 | 7.33 | 6.92 | 2.54 |
| 31 | 2.49 | 2.55 | 0.00175 | 2.66 | 5.84 | 0.22793 | 2.76 | 5.35 | 7.92 | 2.67 |
| 32 | 2.79 | 1.81 | 0.00031 | 2.83 | 3.59 | 0.04579 | 2.70 | 8.50 | 9.92 | 2.75 |
| 33 | 2.81 | 1.73 | 0.00029 | 2.78 | 4.76 | 0.05755 | 2.65 | 6.31 | 2.33 | 2.72 |
| 34 | 2.27 | 2.34 | 0.00087 | 2.60 | 6.19 | 0.16823 | 2.68 | 4.97 | 3.57 | 2.57 |
| 35 | 2.31 | 2.25 | 0.00050 | 2.66 | 5.16 | 0.08221 | 2.57 | 6.19 | 2.62 | 2.56 |
| 36 | 2.76 | 2.65 | 0.00106 | 2.78 | 6.84 | 0.22075 | 2.73 | 5.61 | 4.33 | 2.76 |
| 37 | 2.80 | 2.36 | 0.00132 | 2.76 | 6.79 | 0.24202 | 2.71 | 5.65 | 5.14 | 2.74 |
| 38 | 2.65 | 2.13 | 0.00378 | 2.67 | 6.57 | 0.79257 | 2.61 | 6.31 | 11.81 | 2.64 |
| 39 | 2.51 | 3.12 | 0.00311 | 2.68 | 7.10 | 0.46857 | 2.57 | 7.87 | 9.21 | 2.60 |
| 40 | 2.74 | 1.84 | 0.00064 | 2.75 | 5.25 | 0.13012 | 2.66 | 5.01 | 1.58 | 2.71 |
| 41 | 2.66 | 2.45 | 0.00053 | 2.77 | 5.41 | 0.10950 | 2.76 | 3.55 | 0.92 | 2.74 |
| 42 | 2.75 | 3.14 | 0.00325 | 2.79 | 9.16 | 0.87717 | 2.71 | 3.41 | 3.51 | 2.77 |
| 43 | 2.45 | 2.93 | 0.00182 | 2.64 | 7.80 | 0.36584 | 2.79 | 1.37 | 0.69 | 2.61 |
| 44 | 2.44 | 4.38 | 0.01830 | 2.63 | 13.36 | 4.97962 | 2.90 | 0.86 | 5.32 | 2.60 |
| III | 45 | 2.65 | 1.98 | 0.00071 | 2.59 | 8.42 | 0.31227 | / | / | / | 2.60 |
| 46 | 2.79 | 2.08 | 0.00130 | 2.67 | 8.32 | 0.44170 | / | / | / | 2.69 |
| 47 | 2.63 | 2.93 | 0.00343 | 2.67 | 7.17 | 0.47257 | / | / | / | 2.66 |
| 48 | 2.63 | 2.36 | 0.00175 | 2.61 | 6.64 | 0.23325 | / | / | / | 2.61 |
| 49 | 2.61 | 3.33 | 0.00596 | 2.70 | 5.57 | 0.39004 | / | / | / | 2.67 |
| 50 | 2.60 | 4.15 | 0.00596 | 2.59 | 8.15 | 0.26004 | / | / | / | 2.59 |
| 51 | 2.40 | 5.32 | 0.03512 | 2.65 | 6.88 | 0.67888 | / | / | / | 2.54 |
| 52 | 2.43 | 5.33 | 0.05180 | 2.61 | 6.87 | 0.51020 | / | / | / | 2.53 |
| 53 | 2.33 | 3.89 | 0.09439 | 2.74 | 1.61 | 0.23702 | / | / | / | 1.99 |
| 54 | 2.43 | 5.66 | 0.04471 | 2.83 | 1.14 | 0.03529 | / | / | / | 2.50 |
| 55 | 2.48 | 2.65 | 0.05700 | 2.92 | 0.25 | 0.00300 | / | / | / | 2.52 |
| Disclaimer/Publisher’s Note: The statements, opinions and data contained in all publications are solely those of the individual author(s) and contributor(s) and not of MDPI and/or the editor(s). MDPI and/or the editor(s) disclaim responsibility for any injury to people or property resulting from any ideas, methods, instructions or products referred to in the content. |
© 2025 by the authors. Licensee MDPI, Basel, Switzerland. This article is an open access article distributed under the terms and conditions of the Creative Commons Attribution (CC BY) license (https://creativecommons.org/licenses/by/4.0/).


 ,
, 


