1. Introduction
The maintenance of internal conditions is fundamental to life. The stability of biological variables, known as homeostasis, is a defining principle of this process [
1,
2]. Among these variables, blood pressure serves as a critical indicator of cardiovascular homeostasis, ensuring sufficient blood perfusion to all parts of the organism. This stability is achieved through numerous regulatory mechanisms that operate across short-, mid-, and long-term timescales [
3].
Short-term regulation occurs within the span of successive heartbeats to maintain brain perfusion, a critical function given the brain’s lack of significant energy reserves and its reliance on a continuous blood supply [
4]. Failure of this regulation leads to a loss of consciousness, a catastrophe in cardiovascular dynamics commonly referred to as vasovagal syncope [
5]. Vasovagal syncope is common in the general population and occurs primarily in the standing position, which challenges cardiovascular regulation [
4,
5]. This short-term regulation is mediated by rapid neural mechanisms governed by the autonomic nervous system, the nervous system that operates independently of conscious control. Among its many physiological roles, the autonomic nervous system modulates the baroreflex, a key mechanism that adjusts heart rate in response to blood pressure fluctuations, thereby compensating for drops in blood pressure to restore homeostasis [
3,
4].
While the homeostatic framework explains the stability of blood pressure, it does not account for the cardiovascular system’s remarkable adaptability to extreme conditions such as high altitude, cold exposure, and diving [
1]. To address these limitations, alternative perspectives beyond homeostasis are required [
1,
6,
7]. One such perspective is the concept of self-organized criticality (SOC), a universal theory describing the dynamics of natural systems [
7,
8,
9]. Systems exhibiting SOC spontaneously maintain a state of equilibrium (perceived as homeostasis) while operating near criticality, a property that enables both flexibility and adaptability. Proximity to criticality enables sudden shifts in system behavior, often manifesting as catastrophic events or avalanches [
9].
The application of self-organized criticality (SOC) to cardiovascular function faces several challenges, as it does in other fields [
10,
11]. First, there is limited familiarity with this theory within the biomedical field. Second, there is no single, universally accepted method to demonstrate SOC in a system [
10,
11]. Nevertheless, the cardiovascular system provides a compelling case, supported by a range of evidence that will be discussed. Among these, power laws observed in the system’s dynamics serve as a cornerstone for demonstrating SOC [
9]. Power laws, a characteristic signature of SOC, have been described across numerous disciplines, including physics, geoscience, astronomy, economics, and ecology.
Paradoxically, the transdisciplinary nature of self-organized criticality (SOC) poses an additional challenge to its acceptance in cardiovascular research. Scientists from other fields often focus exclusively on power laws, potentially overlooking the broader context and the limitations associated with biological data collection [
10,
11]. Biological data collection is constrained by ethical and technical limitations, in contrast to the extensive datasets used in physics and computational modeling. For instance, recording cardiovascular data over hundreds of heartbeats without interfering with organismal functions demands strict adherence to ethical standards, technical precision, and careful control of experimental conditions.
This study aims to investigate SOC in cardiovascular dynamics by analyzing extended physiological recordings for power-law behavior, a hallmark of SOC. By addressing methodological and conceptual challenges, we seek to refine the application of SOC to cardiovascular physiology and highlight its biomedical relevance.
2. Material and Methods
2.1. Ethics
Participants received a detailed explanation of the study before providing written informed consent. This study, conducted in accordance with the Declaration of Helsinki, Finland, received approval from the Comité Consultatif de Protection des Personnes dans la Recherche Biomédicales des Pays de la Loire (Regional Committee for the Protection of Persons, #00/08, 30 May 2000) in France.
2.2. Participants
The participants of this study were selected from a database of one hundred patients who underwent an assessment of their cardiovascular function in the standing position using a head-up tilt test (HUTT, see below). This database was created for a larger study on vasovagal syncope [
12]. Of the one hundred consecutive patients who performed the HUTT, those with a positive outcome were excluded. Patients with a negative outcome but a history of heart disease or those on cardiovascular treatment were also excluded. Additionally, patients with a negative outcome but an abnormal cardiovascular response during the HUTT were excluded. Abnormal responses included orthostatic hypotension or postural orthostatic tachycardia. Orthostatic hypotension was defined as a blood pressure drop greater than 20 mmHg in systolic or more than 10 mmHg in diastolic pressure upon tilting. Postural orthostatic tachycardia was defined as an increase in heart rate of more than 30 beats per minute or a heart rate greater than 140 beats per minute in the standing position, without a drop in blood pressure. This selection process resulted in a group of healthy participants with a negative HUTT and no history of cardiovascular disease.
2.3. Head-Up Tilt Test
The HUTT is an essential diagnostic tool, with established guidelines for assessing a patient’s response to orthostatic stress and identifying conditions such as orthostatic hypotension and vasovagal syncope [
13]. The test was conducted in a quiet room with subdued lighting and a stable ambient temperature of 22–24 °C. Patients were instructed to remain as still as possible, keep their eyes open, and immediately report any symptoms, while avoiding verbal communication unless necessary. The procedure began with the patient positioned supine on a motorized tilt table equipped with a footplate for support (AkronA8622, Electro-Medical Equipment, Marietta, GA, USA), and baseline measurements of vital signs, including heart rate and blood pressure, were recorded. The table was then slowly tilted to a 70-degree angle to simulate an upright posture. Throughout the test, the patient’s condition was continuously monitored for symptoms such as dizziness, presyncope, or changes in vital signs. The test lasted up to 45 min or was terminated earlier if symptoms developed. Following symptom onset or the completion of the test, the patient was returned to the supine position and monitored until fully stabilized.
2.4. Cardiovascular Signal Recordings
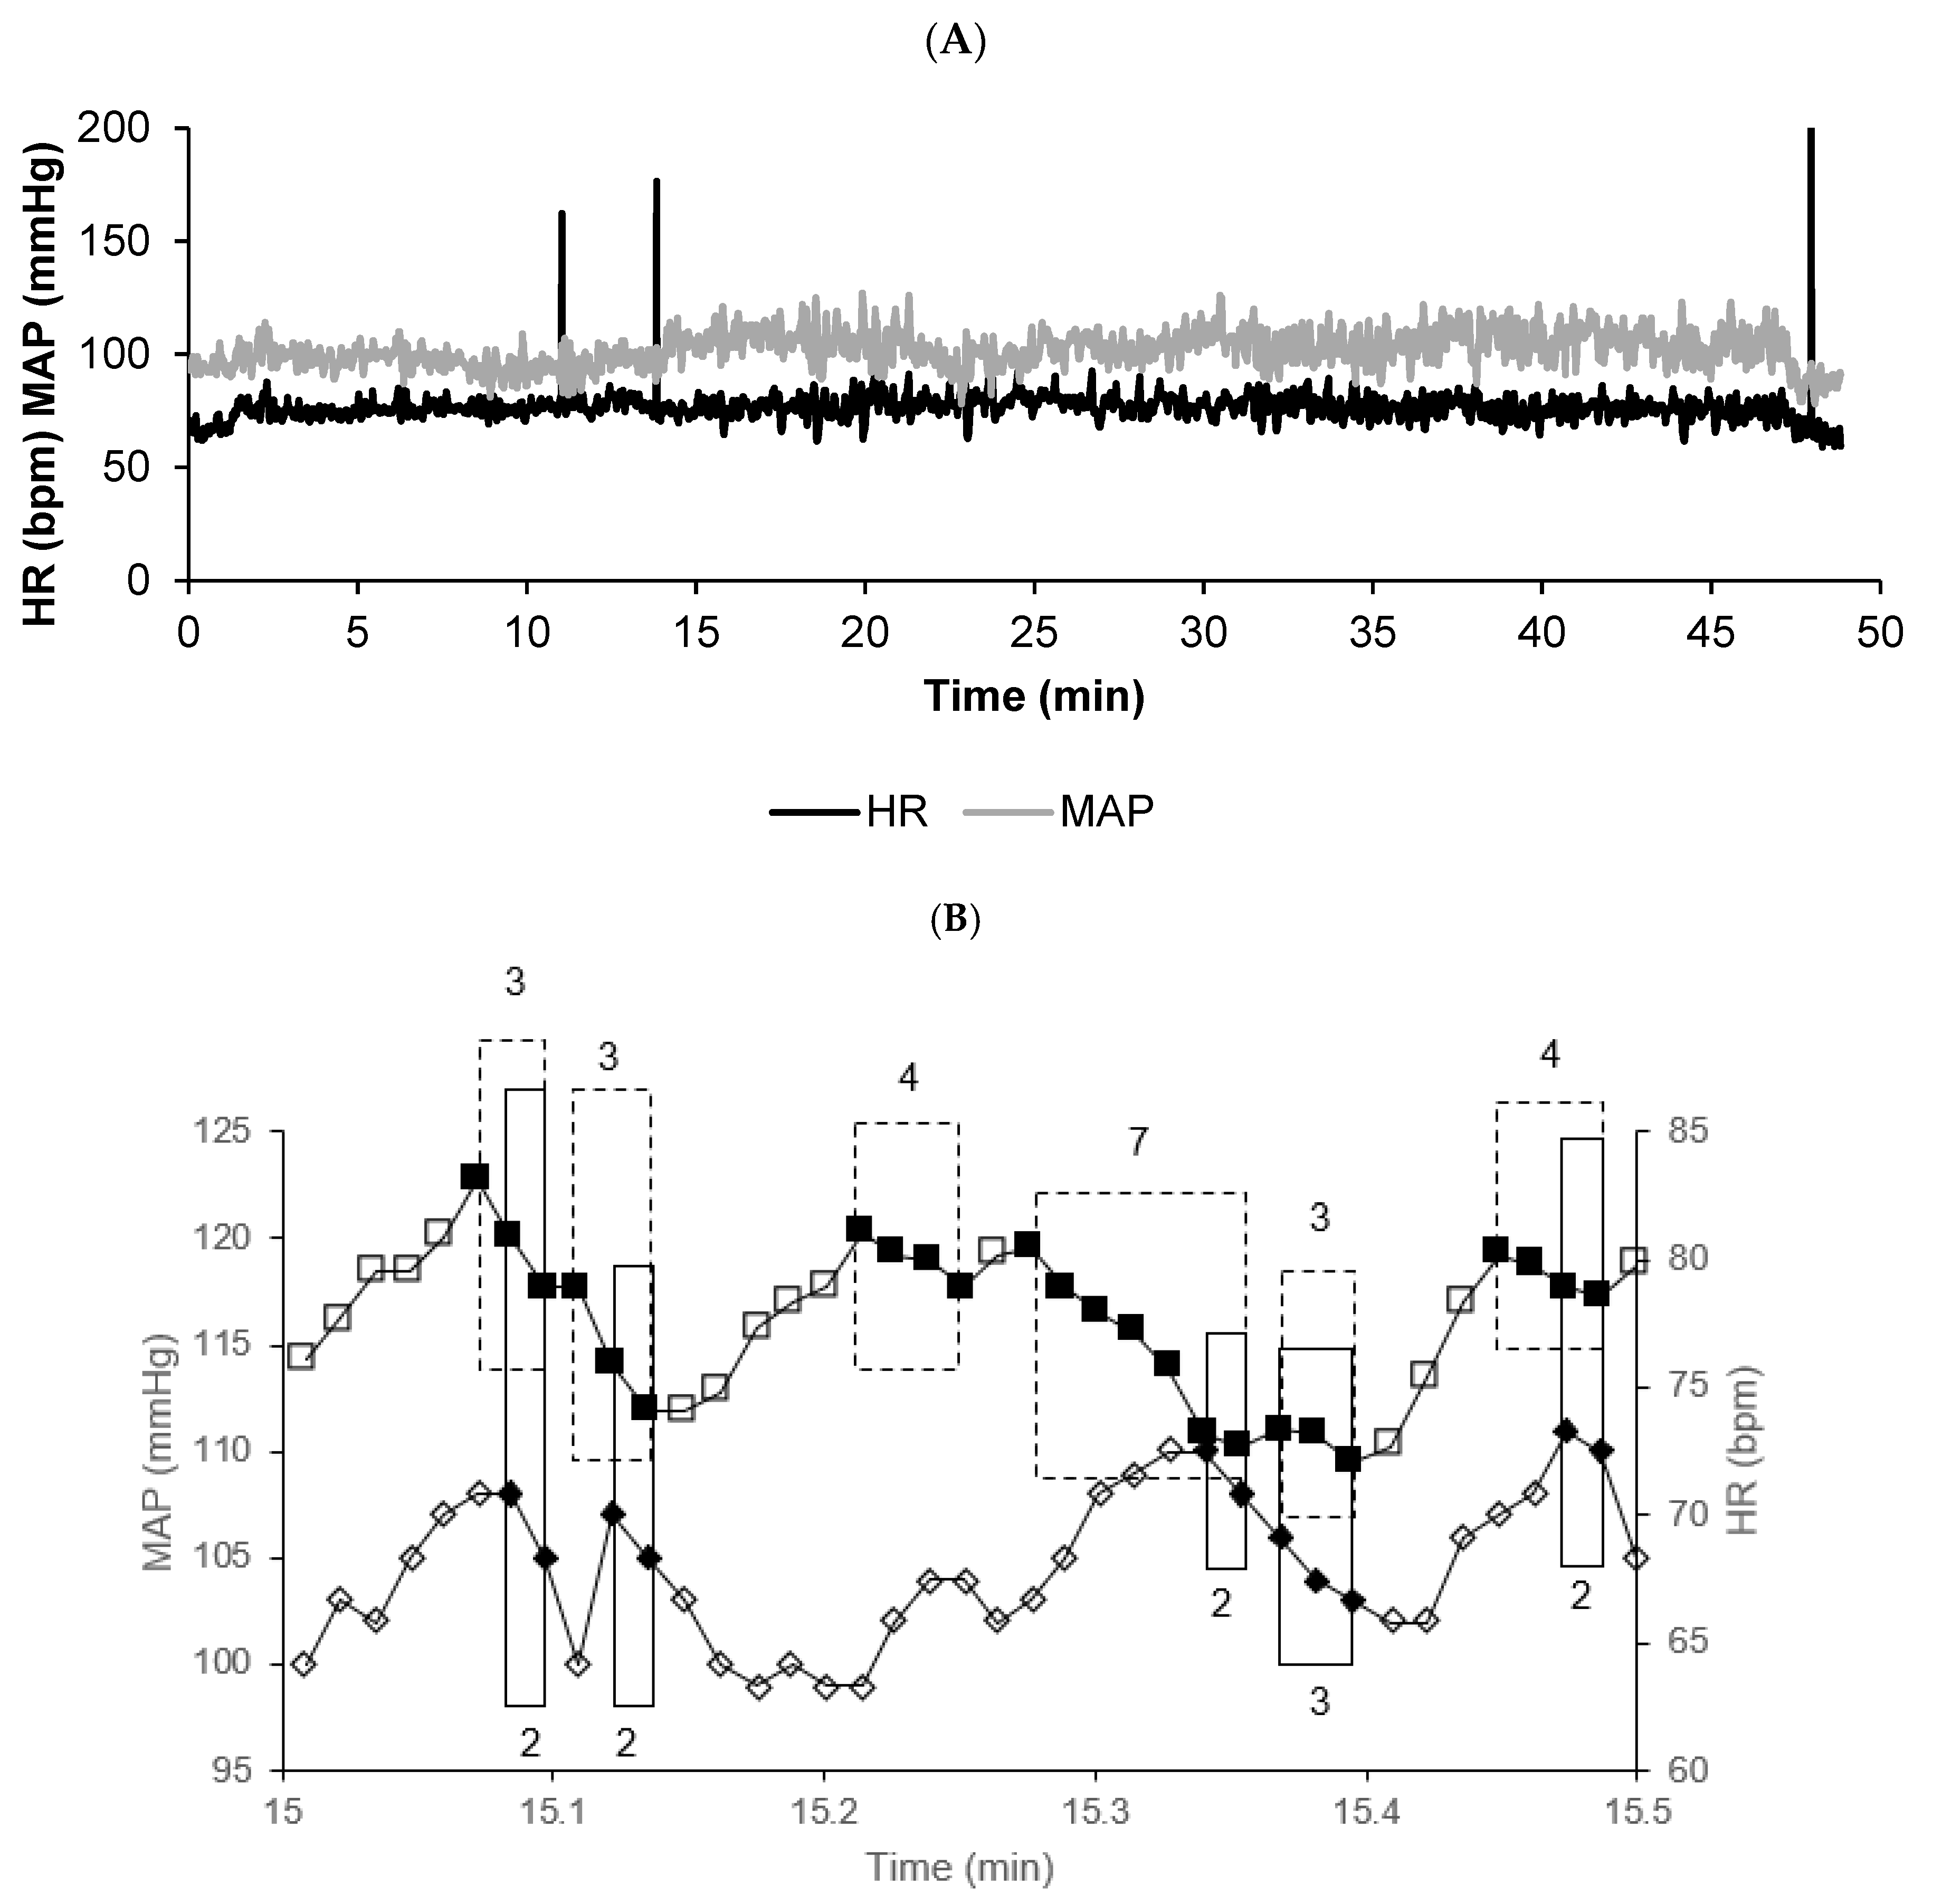
The electrocardiogram (ECG) and blood pressure were continuously recorded throughout the entire 45 min head-up phase using the MAC vu system (Marquette, Milwaukee, WI, USA) and a Finometer (FMS system, Amsterdam, The Netherlands). Data were sampled at a frequency of 500 Hz (AT-MIO-16, 12 bits, LabVIEW 5.1, National Instruments, Austin, TX, USA). R-wave peaks were automatically detected offline using custom-developed software based on the amplitude and first derivative of the ECG waveform. True mean blood pressure was determined on a beat-by-beat basis, calculated as the mean of the instantaneous blood pressure during each heartbeat. All detections were manually reviewed by a trained operator, who carefully examined the ECG recording to identify artifacts or ectopic beats. When an unusually high or low pulse rate was observed, the operator checked the corresponding ECG trace: if it showed an artifact, an ectopic beat, or a missing detection, the erroneous value was corrected by replacing it with the preceding one; otherwise, the value was retained. Conventional interpolation filtering was deliberately avoided to prevent the artificial generation of bradycardia or tachycardia events. RR intervals and blood pressures were determined with precision corresponding to the resolution of the data acquisition system. The first few minutes following the transition to the head-up tilt were discarded, and only the head-up phase after initial cardiovascular adaptation was considered for analysis.
2.5. Surrogate Data
For each subject, we obtained both the observed beat-by-beat time series and the corresponding surrogate time series, which were generated by randomizing the observed beat-by-beat values.
2.6. Cardiovascular Avalanches
Vasovagal syncope is characterized by a drop in blood pressure that is not compensated by a baroreflex-mediated increase in heart rate, but rather, is unexpectedly accompanied by a parallel decrease in heart rate until syncope occurs [
5,
13]. Vasovagal syncope represents a catastrophic event in cardiovascular dynamics. These characteristics led to the definition of the vasovagal sequence as any parallel decrease in blood pressure and heart rate, even when brief and asymptomatic [
14]. Blood pressure and heart rate were considered different from the previous beat at the resolution of the signal recordings (see section on cardiovascular signal recordings). Vasovagal sequences were identified in the subjects’ cardiovascular signal recordings, counted, and sorted according to their length in beats. A vasovagal sequence of length
L is defined as a series of
L successive beats where both blood pressure and heart rate decrease in parallel:
The total number of vasovagal sequences of length L in a given recording is denoted by (L). The vasovagal sequences were sorted according to their length, forming a distribution (L) versus L.
The drop in heart rate observed during vasovagal syncope also contributed to the later definition of the bradycardia sequence as any decrease in heart rate occurring across successive beats [
15]. Bradycardia sequences were identified in the subjects’ cardiovascular signal recordings, counted, and sorted according to their length in beats:
The total number of bradycardia sequences of length L in a given recording is denoted by (L). The bradycardia sequences were sorted according to their length, forming a distribution (L) versus L.
We termed these sequences of successive heartbeats evocative of a vasovagal response as cardiovascular avalanches, regardless of whether they represent vasovagal sequences (when blood pressure is considered [
14]) or bradycardia sequences (when only heart rate is considered [
15]).
2.7. Symbolic Analysis
The goal of this study was to investigate power laws as evidence of self-organized criticality in cardiovascular dynamics. The following section details the plotting and analysis of these power laws, which are derived from two distinct types of heartbeat sequences classified as cardiovascular avalanches. Both types share a common feature: a decrease in heart rate over successive beats. Given this relationship, we sought to introduce a novel approach to deriving a cardiovascular power law. Guzzettti et al. proposed a symbolic analysis of heart rate variability based on the several patterns of increased, decreased, or unchanged values that RR-intervals can adopt over three successive beats at a resolution of 5 ms [
16]. We referred to these patterns as “symbolic sequences”. We identified the pattern for each sequence of three consecutive heartbeats in the subjects’ cardiovascular recordings, counted them, and sorted them according to their frequency of occurrence. Let
RRi be the RR-interval value at index
i. A symbolic sequence over three successive values is defined as follows:
The total number of symbolic sequences of type S in a given recording is denoted by (S). The sequences were sorted according to their frequency of occurrence, forming a distribution (S) versus the sequence type S.
2.8. Frequency Distribution Graphs
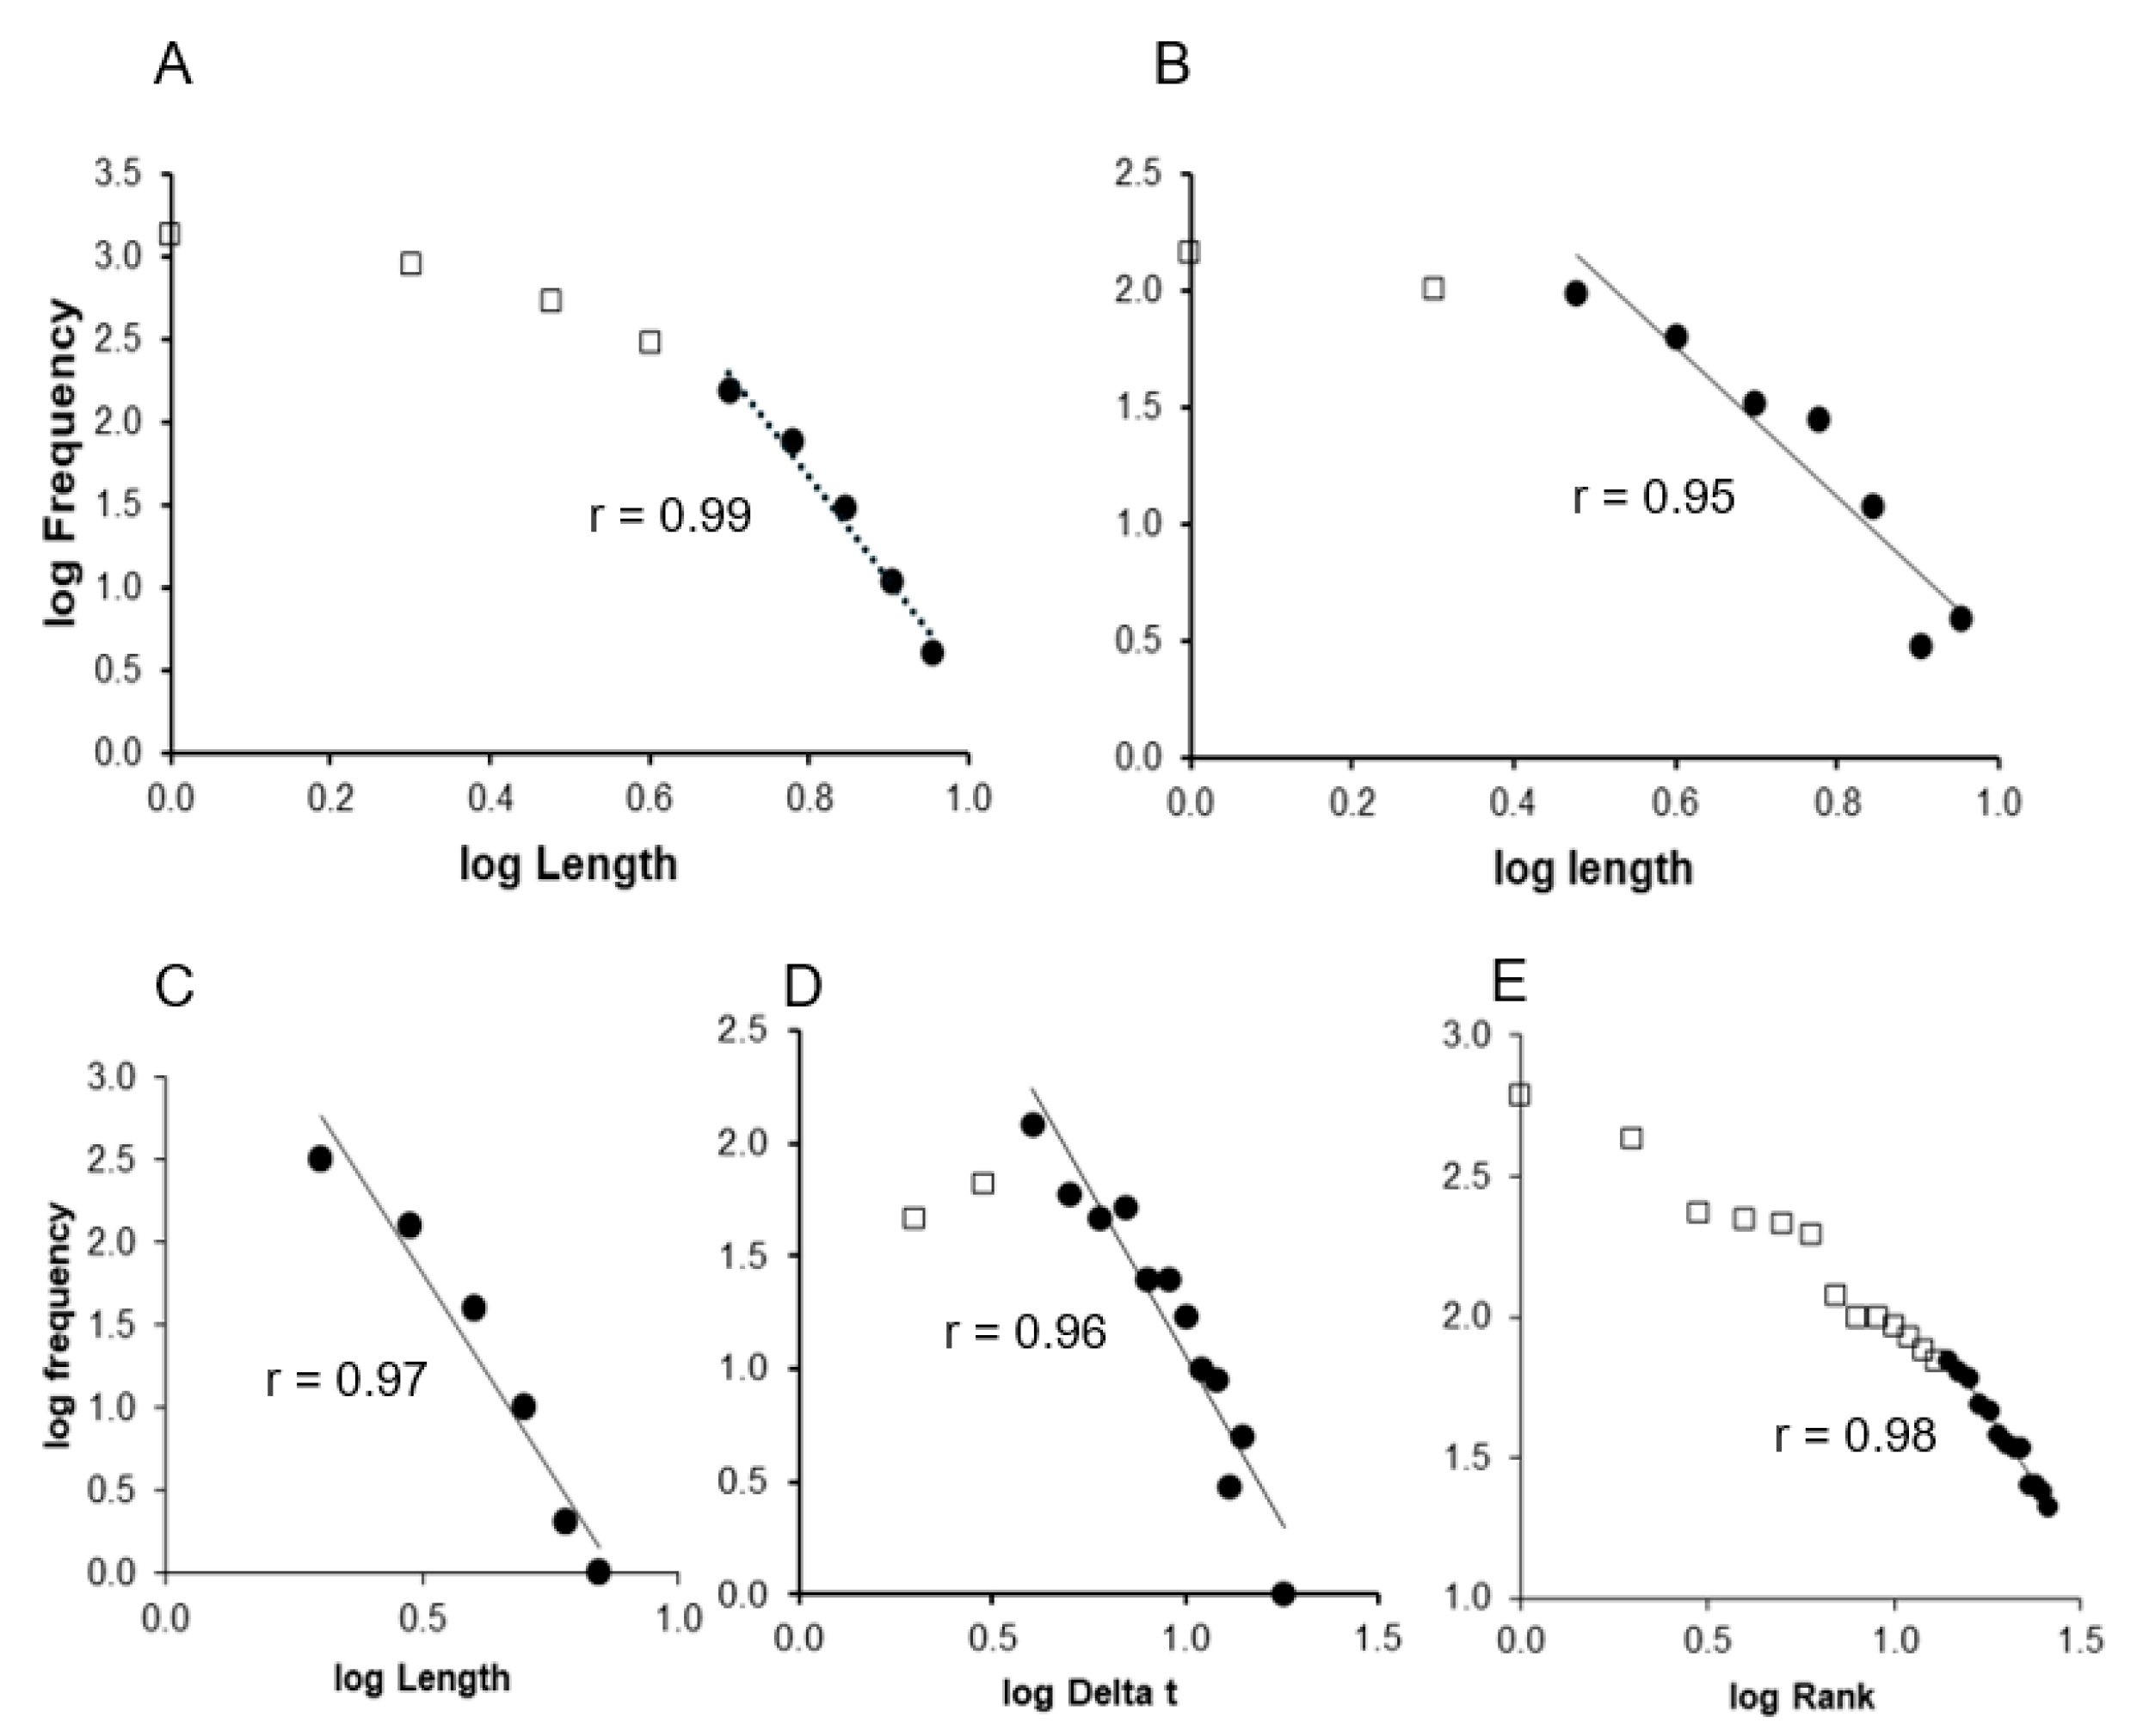
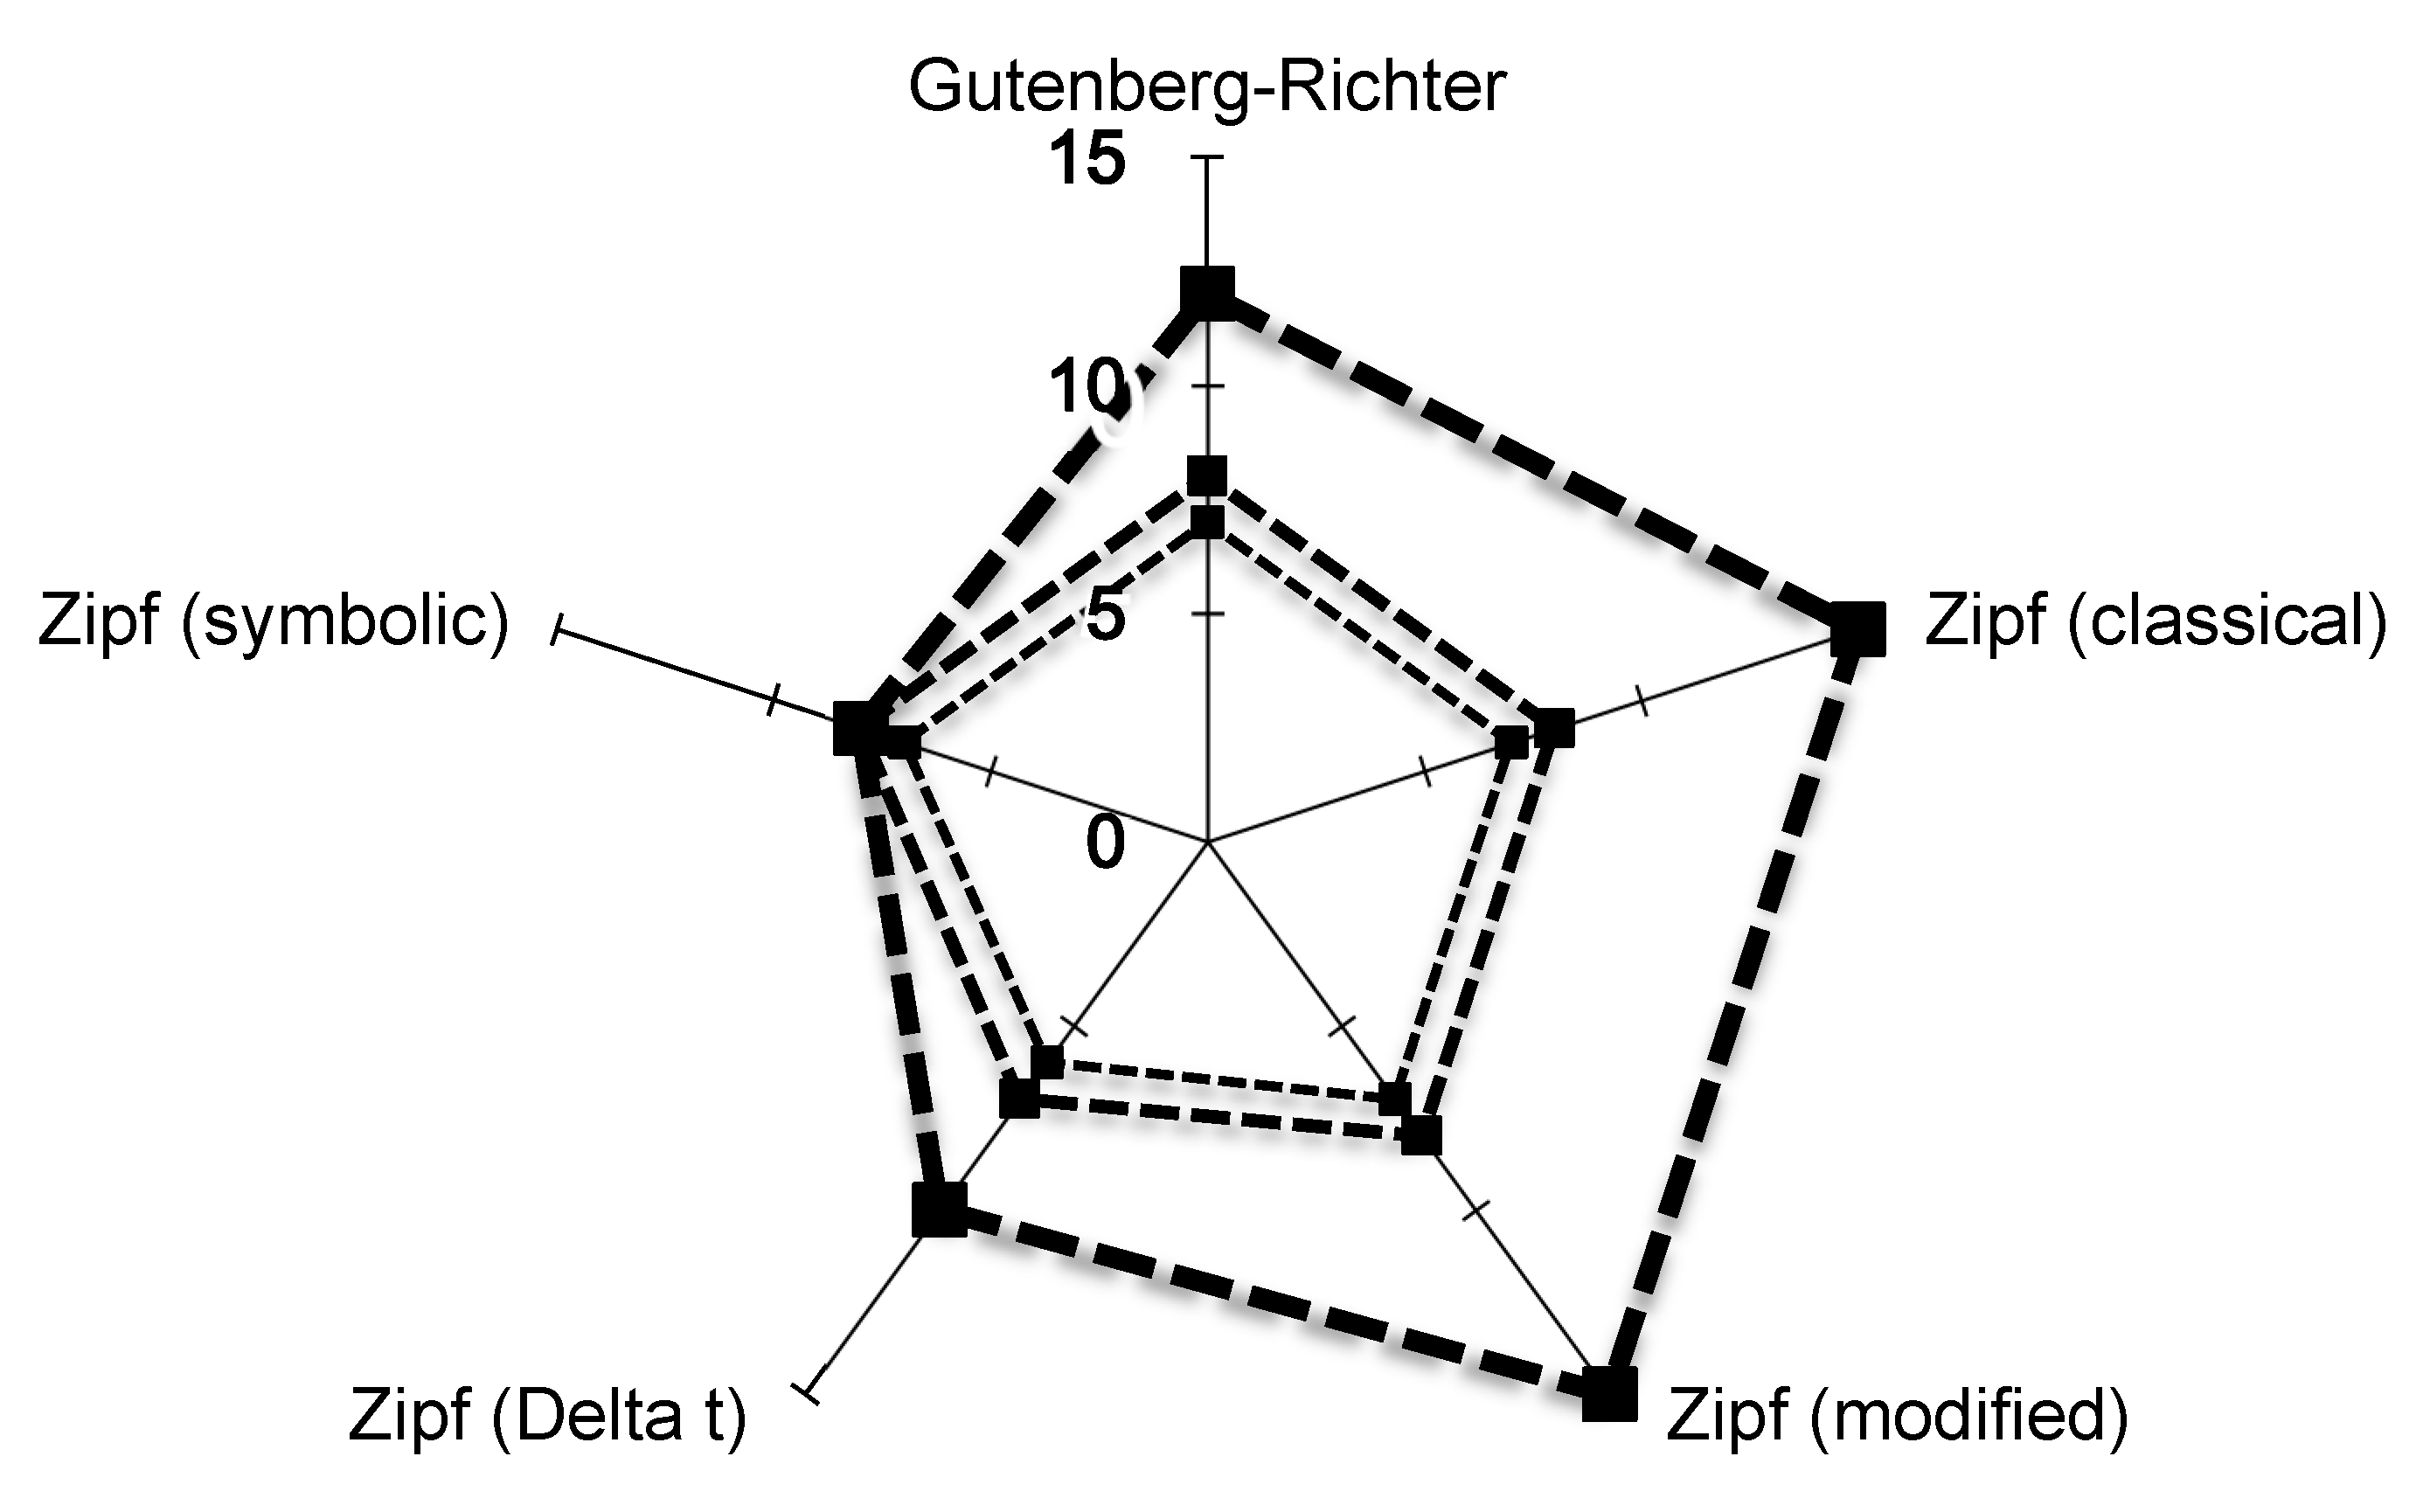
This study focuses on the statistical distributions of events identified in cardiovascular signal recordings to demonstrate that they follow a power-law distribution. Five types of power-law distributions were examined. The first was the Gutenberg–Richter law, which describes the frequency of catastrophic events according to their magnitudes. In this study, the Gutenberg–Richter distribution was applied to vasovagal reactions, which were identified and counted according to their magnitude (in number of beats) [
14]. We plotted the magnitude versus cumulative frequency on a log–log scale to evaluate power-law behavior. The remaining four power-law distributions were variations of Zipf’s law, which characterizes the frequency of specific events, such as the occurrence of words in a text in its original formulation. The first variation of Zipf’s distribution was applied to bradycardia sequences, which were identified and counted based on their length (number of beats), as described previously [
15]. The second variation refined this method to prevent the inclusion of short sequences within longer ones. The third variation examined the time intervals between bradycardia sequences, counting these intervals based on their duration in beats [
11]. For these first three variations, graphs of the magnitude versus frequency were plotted on a decimal log–log scale. The fourth variation involved counting symbolic sequences and ranking them according to their frequency of occurrence. A graph of the rank vs. frequency was plotted on a decimal log–log scale.
2.9. Statistical Analysis
Data are presented as the mean ± standard error of the mean (SEM). Linear regressions were performed on each individual Gutenberg–Richter distribution graph. For the classical Zipf’s distribution graphs, linear regressions were applied excluding the first four points, as previously recommended, because the finite size effect disrupts the power law at this cutoff [
17]. For the second and third types of Zipf’s distribution graphs, linear regressions were performed excluding the first two points, as this adjustment shifts the finite size effect break of the power law as identified by the best regression coefficient [
17]. Linear regressions were also performed on the fourth type of Zipf’s distribution graph, corresponding to the symbolic sequence analysis, focusing on the linear portion as identified by the best regression coefficient [
17]. Regression coefficients (
r) were obtained for each case. The regression coefficient between two variables
x and
y is computed as follows:
where
xi and
yi are individual data points,
and
are the mean values of
x and
y, and n is the number of data points.
We adopted a three-stage approach to validate the presence of a power law. The first stage involved observing a regression coefficient (
r) > 0.95, which is a standard cutoff for accepting a distribution as a power law [
9,
14]. The second stage was to pass the first stage and demonstrate a significant difference in the maximum length of vasovagal sequences or bradycardia sequences between the actual time series and their surrogate for the Gutenberg–Richter distribution graphs and the first, second, and third types of Zipf’s distribution graphs. For the fourth type of Zipf’s distribution graph, where all events have equal length by definition, we sought a significant difference in the slope of the linear regression. Slopes could not be determined for the first, second, and third Zipf’s distributions of surrogate data due to an insufficient number of data points to draw a straight line. The second stage involved comparing actual and surrogate data using a Wilcoxon test for paired data, with statistical significance set at
p < 0.05. (Prism 8 software, GraphPad Software, version 8.3.0, San Diego, CA, USA). A Wilcoxon test was chosen because the sample size was small and the data were paired, as each subject’s actual and surrogate data stemmed from the same underlying series. The third stage required passing both the first and second stages and showing significant evidence using Clauset’s statistical method to confirm a power-law distribution (
poweRlaw package, R, version 4.4.2, the R Foundation for Statistical Computing), as per the authors’ recommendations [
18,
19]. Clauset’s method was selected because, to the best of our knowledge, it is the only established statistical method for rigorously testing and validating the presence of a power-law distribution. A discrete power-law model (implemented as a
displ object in the
poweRlaw R package) was fitted to the cardiovascular avalanche or symbolic sequence frequencies. The lower threshold
xmin was estimated using the Kolmogorov–Smirnov method to minimize the distance between the empirical and model distributions, following the procedure outlined by Clauset et al. [
18]:
where
S(
x) is the cumulative distribution function (CDF) of the data and
P(
x) is the CDF of the fitted power-law model.
The scaling exponent (
α) was then estimated using maximum likelihood methods:
where
n is the number of data points above
xmin and
xi are the observed values.
Finally, the goodness-of-fit of the power-law model to the data was assessed using a bootstrapping approach with 1000 resamples, and the p-value was calculated to determine whether the data significantly deviated from the model. A p-value > 0.05 indicated that the distribution was compatible with a power law.
4. Discussion
This study provides compelling evidence of power laws in the cardiovascular dynamics of healthy subjects, based on experimental data. Notably, the Zipf’s distribution of cardiovascular avalanches offers robust support for the presence of self-organized criticality in the normal functioning of the cardiovascular system in the standing position.
The distribution of cardiovascular avalanches clearly followed Zipf’s law, as demonstrated through the three-stage validation conducted in this study. This finding provides compelling evidence for the presence of self-organized criticality in normal cardiovascular dynamics. While the conventional method for plotting Zipf’s distribution has the limitation of including shorter avalanches within longer ones, the adapted method used in this study effectively excludes this possibility without affecting the validity of the three-stage validation [
15]. Among the five distributions examined in this study, only two Zipf distributions successfully passed the three-stage validation. The interpretation of the remaining three distributions should be approached with caution. While the analysis of time intervals between avalanches has been used to demonstrate power-law distributions in other natural systems, this approach has limitations when applied to the cardiovascular system [
11]. In the classical cardiovascular Zipf’s distribution, event magnitude is defined as the length of the event in terms of the number of beats [
15]. Time delays between events are highly dependent on these magnitude measurements, which are also durations. To study Zipf’s distribution based on time intervals between cardiovascular avalanches, longer signal recordings may be necessary. However, extended cardiovascular recordings in the standing position are impractical, as this position cannot be maintained for long periods due to physiological constraints, increasing the risk of loss of consciousness. Gutenberg–Richter distribution studies of cardiovascular events likely face the same limitation as Zipf’s distribution analyses, namely, the use of too short of signal recordings for effective analysis [
14]. Unlike the bradycardia sequences employed in Zipf’s distribution analysis, vasovagal sequences are sparse. As a result, the number of data points available for constructing the Gutenberg–Richter distribution is fewer than for Zipf’s distribution. Additionally, the finite size effect observed around the delay of the first four beats in Zipf’s distribution is absent in the Gutenberg–Richter distribution, likely due to the limited number of events captured in the available recording duration. The Gutenberg–Richter distribution may thus be affected by a finite size effect in the initial points, which remains undetectable due to the shortness of the recordings but alters its quality. The symbolic analysis only partially demonstrated a power-law distribution. Among the seven subjects, all successfully passed the first stage of the validation process, but only for a selected portion of the distribution, and none passed the third stage. Symbolic analysis focuses on three consecutive heartbeats, a delay shorter than a single breath. Breathing strongly influences heart rate, producing regular fluctuations known as respiratory sinus arrhythmia, which may obscure complex patterns in heart rate variability [
20]. Moreover, symbolic analysis is based on overall spontaneous heart rate variability rather than on specific underlying regulatory mechanisms or their potential failures, unlike cardiovascular avalanches [
16]. The appeal of symbolic analysis in this experiment stemmed from its distinct approach to analyzing heart rate variability, contrasting with the method used for studying cardiovascular avalanches. Furthermore, symbolic sequences can be viewed as “words”, evoking the concept of word frequency counting in the original description of Zipf’s law [
9]. However, the “language” and “words” of the cardiovascular system remain unknown, highlighting the limitations of this approach in exploring cardiovascular self-organized criticality.
Power laws are fundamental to the evidence supporting self-organized criticality. In some cases, they are the only available argument, given the lack of an established method for unequivocally demonstrating this phenomenon. Self-organized criticality is a universal theory proposed to explain the dynamics of various systems across fields from physics to economics [
9] Neurophysiology was among the first biological fields to explore self-organized criticality, observing power laws in neuronal avalanches during actual or simulated brain activity [
10]. However, the brain is a network of firing cells with no immediately apparent dynamics or tuning, and normal brain function is not typically disrupted by major catastrophic events. Despite years of research, the implications of power laws in neuronal avalanches for brain function remain unclear [
7,
10]. Self-organized criticality was proposed for the cardiovascular system much later, despite being a natural candidate for such a functioning [
6,
21]. Recent findings have provided evidence that cardiovascular dynamics display features consistent with self-organized criticality [
14,
15,
22,
23,
24,
25]. The cardiovascular system is a dynamic system with the pumping heart and is maintained at equilibrium through the principle of homeostasis. Its dynamics also include major catastrophic events, such as vasovagal loss of consciousness. Furthermore, the cardiovascular system demonstrates remarkable flexibility, adapting to a wide range of environments, including the microgravity experienced during space travel—an environment that no organism had encountered until recently, leaving evolution no opportunity to select for it. Cardiovascular dynamics have been studied through heart rate variability (HRV) since the 1980s [
26,
27,
28]. HRV analysis quickly revealed complex patterns, including a 1/f pattern in its spectral analysis [
29,
30]. This pattern, evocative of fractal dynamics, is commonly observed in self-organized critical (SOC) systems and is explained by their underlying dynamics [
8,
31]. The analysis of non-Markov stochastic processes confirms the connection between fractal patterns and SOC in heart rate variability [
32]. SOC systems are poised at criticality, leading to phase transitions that can be observed. The functioning of the cardiovascular system is influenced by such phase transitions, particularly during positional shifts from supine to standing [
33,
34]. Finally, the cardiovascular system is also susceptible to rhythm anomalies that can lead to life-threatening conditions, known as cardiac arrhythmias. Recent evidence has shown that these arrhythmic episodes follow a power law, highlighting the self-organized criticality underlying cardiovascular function [
35]. Taken together, these observations—ranging from the presence of power laws to the influence of phase transitions—provide compelling evidence in favor of SOC in the cardiovascular system.
Challenging the system is a classic approach to demonstrating the physiology of adaptation. The clearer manifestation of criticality during the challenge of the standing position—where vasovagal syncope most often occurs—compared to the supine position aligns with this traditional physiological principle [
25]. However, power laws remain the primary evidence for self-organized criticality within a system. It is worth noting that the first stage of validation in this study used a high cutoff value for the regression coefficient, derived from physics. Such a high regression coefficient is uncommon in biology, particularly when analyzing experimental data, and can be seen as additional evidence supporting cardiovascular self-organized criticality.
Study Limitations
The goal of this study was to demonstrate self-organized criticality (SOC) within the normal functioning of the cardiovascular system. However, the data analyzed focused exclusively on the standing position, raising questions about the generalizability of these findings to other functional contexts. A previous study has shown that SOC is more easily observed in the standing position, likely due to the increased cardiovascular demands in this posture [
25]. Furthermore, the background of cardiovascular SOC is largely based on vasovagal syncope, a phenomenon that predominantly occurs in the standing position [
14]. Whether criticality changes across different positions or is simply more evident in the standing position remains an open question. Another unresolved question is whether cardiovascular regulation actively modulates criticality, potentially reducing it to limit the risk of vasovagal syncope.
The main limitation of this study is the short duration of the cardiovascular recordings. This limited duration likely explains why the Gutenberg–Richter distribution failed to complete the three-stage validation of SOC. Nevertheless, the recordings exceeded 40 min, which is notably long for a standing position without movement. Longer recordings, such as those obtained with a Holter monitor—a portable device that records ECG during daily activities—could provide additional insights. Similarly, smartwatches can reliably collect extended heart rate data. However, both methods capture heart rate variability, which is influenced not only by regulatory mechanisms but also by the subject’s continuous adaptation to changing daily activities, in contrast to motionless recordings, where heart rate variability is primarily explained by regulatory mechanisms.
Our previous work has demonstrated the strong influence of data collection conditions on heart rate variability analysis, including its complex and fractal aspects [
36]. The small sample size (n = 7) could also be perceived as a limitation. However, this must be considered in the context of an initial cohort of 100 subjects. Although the sample size in our study was small, the beat-to-beat heart rate and blood pressure recordings were valuable, as they lasted more than 40 min while the subjects, who were healthy, were in the upright position. Such recordings are rare and difficult to obtain for physiological and ethical reasons [
27]. These prolonged recordings allowed us to precisely characterize the power laws associated with self-organized criticality in the cardiovascular system. Importantly, the evidence supporting the presence of self-organized criticality in the cardiovascular system is reinforced by several previous studies that have identified power laws, albeit without being able to describe them in detail [
14,
15,
22,
23,
24,
25]. The cumulative sample size across these studies is becoming substantial, thereby mitigating the limitation of our smaller cohort. Despite the reduced number of subjects, this study was able to clearly demonstrate cardiovascular SOC through the analysis of Zipf’s distributions.
In conclusion, this study provides preliminary evidence that cardiovascular avalanches exhibit power-law distributions, reinforcing the concept of self-organized criticality in cardiovascular dynamics. These findings offer valuable insights into cardiovascular regulation and highlight potential implications for biomedical research.


