Article

Study on Surface Roughness and True Fracture Energy of Recycled Aggregate Concrete Using Fringe Projection Technology

1
School of Civil and Transportation Engineering, Guangdong University of Technology, Guangzhou 510006, China
2
School of Architecture and Urban Planning, Guangdong University of Technology, Guangzhou 510090, China
*
Author to whom correspondence should be addressed.
Fractal Fract. 2025, 9(3), 159; https://doi.org/10.3390/fractalfract9030159
Submission received: 16 December 2024 / Revised: 24 February 2025 / Accepted: 25 February 2025 / Published: 4 March 2025
(This article belongs to the Special Issue Fracture Analysis of Materials Based on Fractal Nature)

Abstract

This paper investigates the fracture surfaces and fracture performance of recycled aggregate concrete (RAC) using fringe projection technology. This non-contact, point-by-point, and full-field scanning technique allows precise measurement of RAC’s fracture surface characteristics. This research focuses on the effects of recycled aggregate replacement rate, water-to-binder (w/b) ratio, and maximum aggregate size on RAC’s fracture properties. A decrease in the w/b ratio significantly reduces surface roughness (Rs) and fractal dimension (D), due to increased cement mortar bond strength at lower w/b ratios, causing cracks to propagate through aggregates and resulting in smoother fracture surfaces. At higher w/b ratios (0.8 and 0.6), both surface roughness and fractal dimension decrease as the recycled aggregate replacement rate increases. At a w/b ratio of 0.4, these parameters are not significantly affected by the replacement rate, indicating stronger cement mortar. Larger aggregates result in slightly higher surface roughness compared to smaller aggregates, due to more pronounced interface changes. True fracture energy is consistently lower than nominal fracture energy, with the difference increasing with higher recycled aggregate replacement rates and larger aggregate sizes. It increases as the w/b ratio decreases. These findings provide a scientific basis for optimizing RAC mix design, enhancing its fracture performance and supporting its practical engineering applications.

1. Introduction

With the aging of urban infrastructure and the gradual demolition of old buildings, recycled aggregate concrete (RAC) has emerged as an effective solution to the problem of concrete waste, conserving resources and promoting environmental protection. To expand the practical applications of RAC, research on the mechanical properties of RAC has garnered significant attention from numerous researchers [1,2]. The morphology of concrete fracture surfaces serves as a trace of fracture damage, containing valuable information that can be extracted through quantitative analysis methods [3,4]. This process is crucial for understanding the fracture mechanisms of concrete materials [5,6].
Given that the fracture surface of concrete exhibits fractal characteristics, the fractal dimension D is commonly used to quantify the complexity of the fracture surface [7]. A higher D value indicates that the morphology of the fracture surface is more irregular, leading to greater surface roughness [8]. The fractal dimension reflects the geometric irregularity and local morphological features of the fracture surface, although its calculation can be quite complex. Additionally, a more intuitive roughness indicator is the ratio of the actual surface area of the fracture to its projected area [9], which is simpler to calculate and effectively reflects the macroscopic roughness of the concrete fracture surface. Currently, both measures are key quantitative indicators of the surface roughness of concrete materials.
To obtain the fractal dimension or roughness of concrete fractures, three-dimensional measurement of the fracture surface is essential. Various measurement methods have been proposed by scholars worldwide, including two-dimensional contact methods and three-dimensional non-contact methods [10]. Common two-dimensional measurement techniques, such as mechanical probe methods and profilometry, offer flexibility and affordability but suffer from low accuracy, failing to adequately represent the distribution of surface roughness and potentially damaging rough surfaces. In contrast, three-dimensional non-contact methods, primarily using laser scanning [11,12] and structured light 3D measurement [13,14], provide higher precision and richer information about the fracture surface.
The fracture energy of concrete is one of the most important fracture mechanics parameters [15,16]. It represents the external work absorbed per unit area of the fracture surface [17], with all the work done by external forces being consumed by the propagating cracks in the specimen. Numerous researchers have investigated how the composition of materials affects fracture energy; however, in most studies calculating fracture energy, only the projected area of the ligament portion of the specimen is considered [17,18]. This can result in an inaccurate representation of the true fracture energy of the concrete, potentially leading to misunderstandings regarding how fracture energy varies with material composition [8]. Wu et al. [19] utilized laser scanning technology to reconstruct the three-dimensional profiles of concrete fracture surfaces. Their results indicated that as the maximum aggregate particle size increased, the fractal dimension also exhibited a corresponding growth trend. They found a positive correlation between the fracture energy of the concrete material and its fractal dimension, suggesting that fracture energy increases with higher fractal dimensions. They also introduced the concept of true fracture energy [6,20], which accounts for the roughness of the actual fracture surface. Their findings indicated that true fracture energy is less influenced by aggregate size and closely related to changes in the water-to-binder ratio; a reduction in the water-to-binder ratio increases true fracture energy due to the enhanced strength of the concrete matrix, which alters the fracture path, leading to more aggregate breakage and reduced roughness of the fracture surface [5]. Viktor Mechtcherin [21] investigated the fracture performance of concrete through a series of uniaxial tensile tests, employing phase profilometry to quantitatively characterize the roughness of the concrete fracture surface. Their experimental findings and fractological analyses showed a relationship between the stress-crack opening curve and both the roughness and fractal dimension of the fracture surface for all the parameters studied.
Additionally, Liu et al. [22] examined the fracture surfaces of damaged concrete using digital image analysis techniques, proposing a definition for the breakage rate of coarse aggregates on the fracture surface. Their study found that concrete strength and coarse aggregate size significantly affect the breakage rate, with higher concrete strength and larger coarse aggregate sizes leading to increased breakage rates. Xiao et al. [23] utilized digital imaging techniques to analyze the fracture surfaces of recycled aggregate concrete, extracting statistical features and aggregate boundaries to establish a two-dimensional mesoscopic numerical model, providing essential insights for analyzing the performance of recycled concrete. An et al. [24] conducted three-point bending tests to investigate the effect of replacing natural aggregates with brick particle recycled coarse aggregates on the fracture performance of recycled concrete, employing digital image processing techniques to extract the two-dimensional fractal dimension of the specimens’ fracture surfaces to characterize their roughness. Their research revealed that as the replacement rate of brick particle recycled coarse aggregates increased, the fractal dimension of the fracture surfaces gradually decreased, and a strong correlation was observed between the fractal dimension and fracture energy. Lu et al. [25] employed fringe projection technology to measure the fracture surfaces of recycled aggregate concrete at different ages, discovering an inverse relationship between flexural strength and fracture surface roughness.
Research indicates that the load-bearing capacity of concrete is supported by both the role of the aggregate and the interfacial bonding effects, meaning that the capacity of concrete is influenced not only by its constituent materials but also by the interfacial properties between these materials [26]. The interfacial transition zone (ITZ) in recycled aggregate concrete is more complex than that in ordinary concrete, representing a weak area where cracks initiate and propagate [27,28,29]. When recycled aggregate concrete fractures, the information from its fracture surface can reflect the complexity of crack development, aiding in understanding the fracture mechanisms of recycled aggregate concrete [30].
However, there is currently limited research on the three-dimensional fracture surface morphology of recycled aggregate concrete; moreover, the true fracture energy of RAC, which takes into account the roughness of the fracture surface, is an area that requires further investigation. This study aims to bridge this gap by utilizing fringe projection technology [31] to conduct three-dimensional measurements of the fracture surfaces of recycled aggregate concrete. We explored the effects of water-to-binder ratio, recycled aggregate replacement rate, and maximum aggregate particle size on the roughness of fracture surfaces, and investigated the true fracture energy of RAC. The results of this study will provide valuable insights into the fracture mechanisms and performance optimization of recycled aggregate concrete, contributing to the advancement of sustainable construction materials.

2. Materials and Methodology

2.1. Raw Materials

The study primarily conducted experiments on two types of concrete: normal concrete (NC) and recycled aggregate concrete (RAC). The ordinary Portland cement was provided by Guangzhou Shijing Cement Company, with a strength grade of 42.5R, as shown in Figure 1a. The fine aggregate and natural coarse aggregate were provided by Guangzhou Huaji Building Materials Company. The fine aggregate, river sand, is depicted in Figure 1b. Its apparent density is 2643 kg/m3, its bulk density is 1435 kg/m3, and the fineness modulus is 2.36. The natural coarse aggregate (NA) is crushed stone with a particle size ranging from 5 mm to 31.5 mm, as shown in Figure 1c. The apparent density is 2750 kg/m3, the water absorption is 1.3%, and the moisture content is 1.02%. Figure 1d shows the recycled coarse aggregate (RA), which is sourced from construction and demolition waste, primarily consisting of recycled concrete. No specific treatment was applied to remove adhered mortar, which may contribute to the variability in the aggregate’s properties. Its apparent density is 2745 kg/m3, its water absorption is 4.73%, its moisture content is 2.56%, and its diameter ranges from 5 mm to 31.5 mm. Tap water from the materials laboratory was used for concrete mixing and curing.

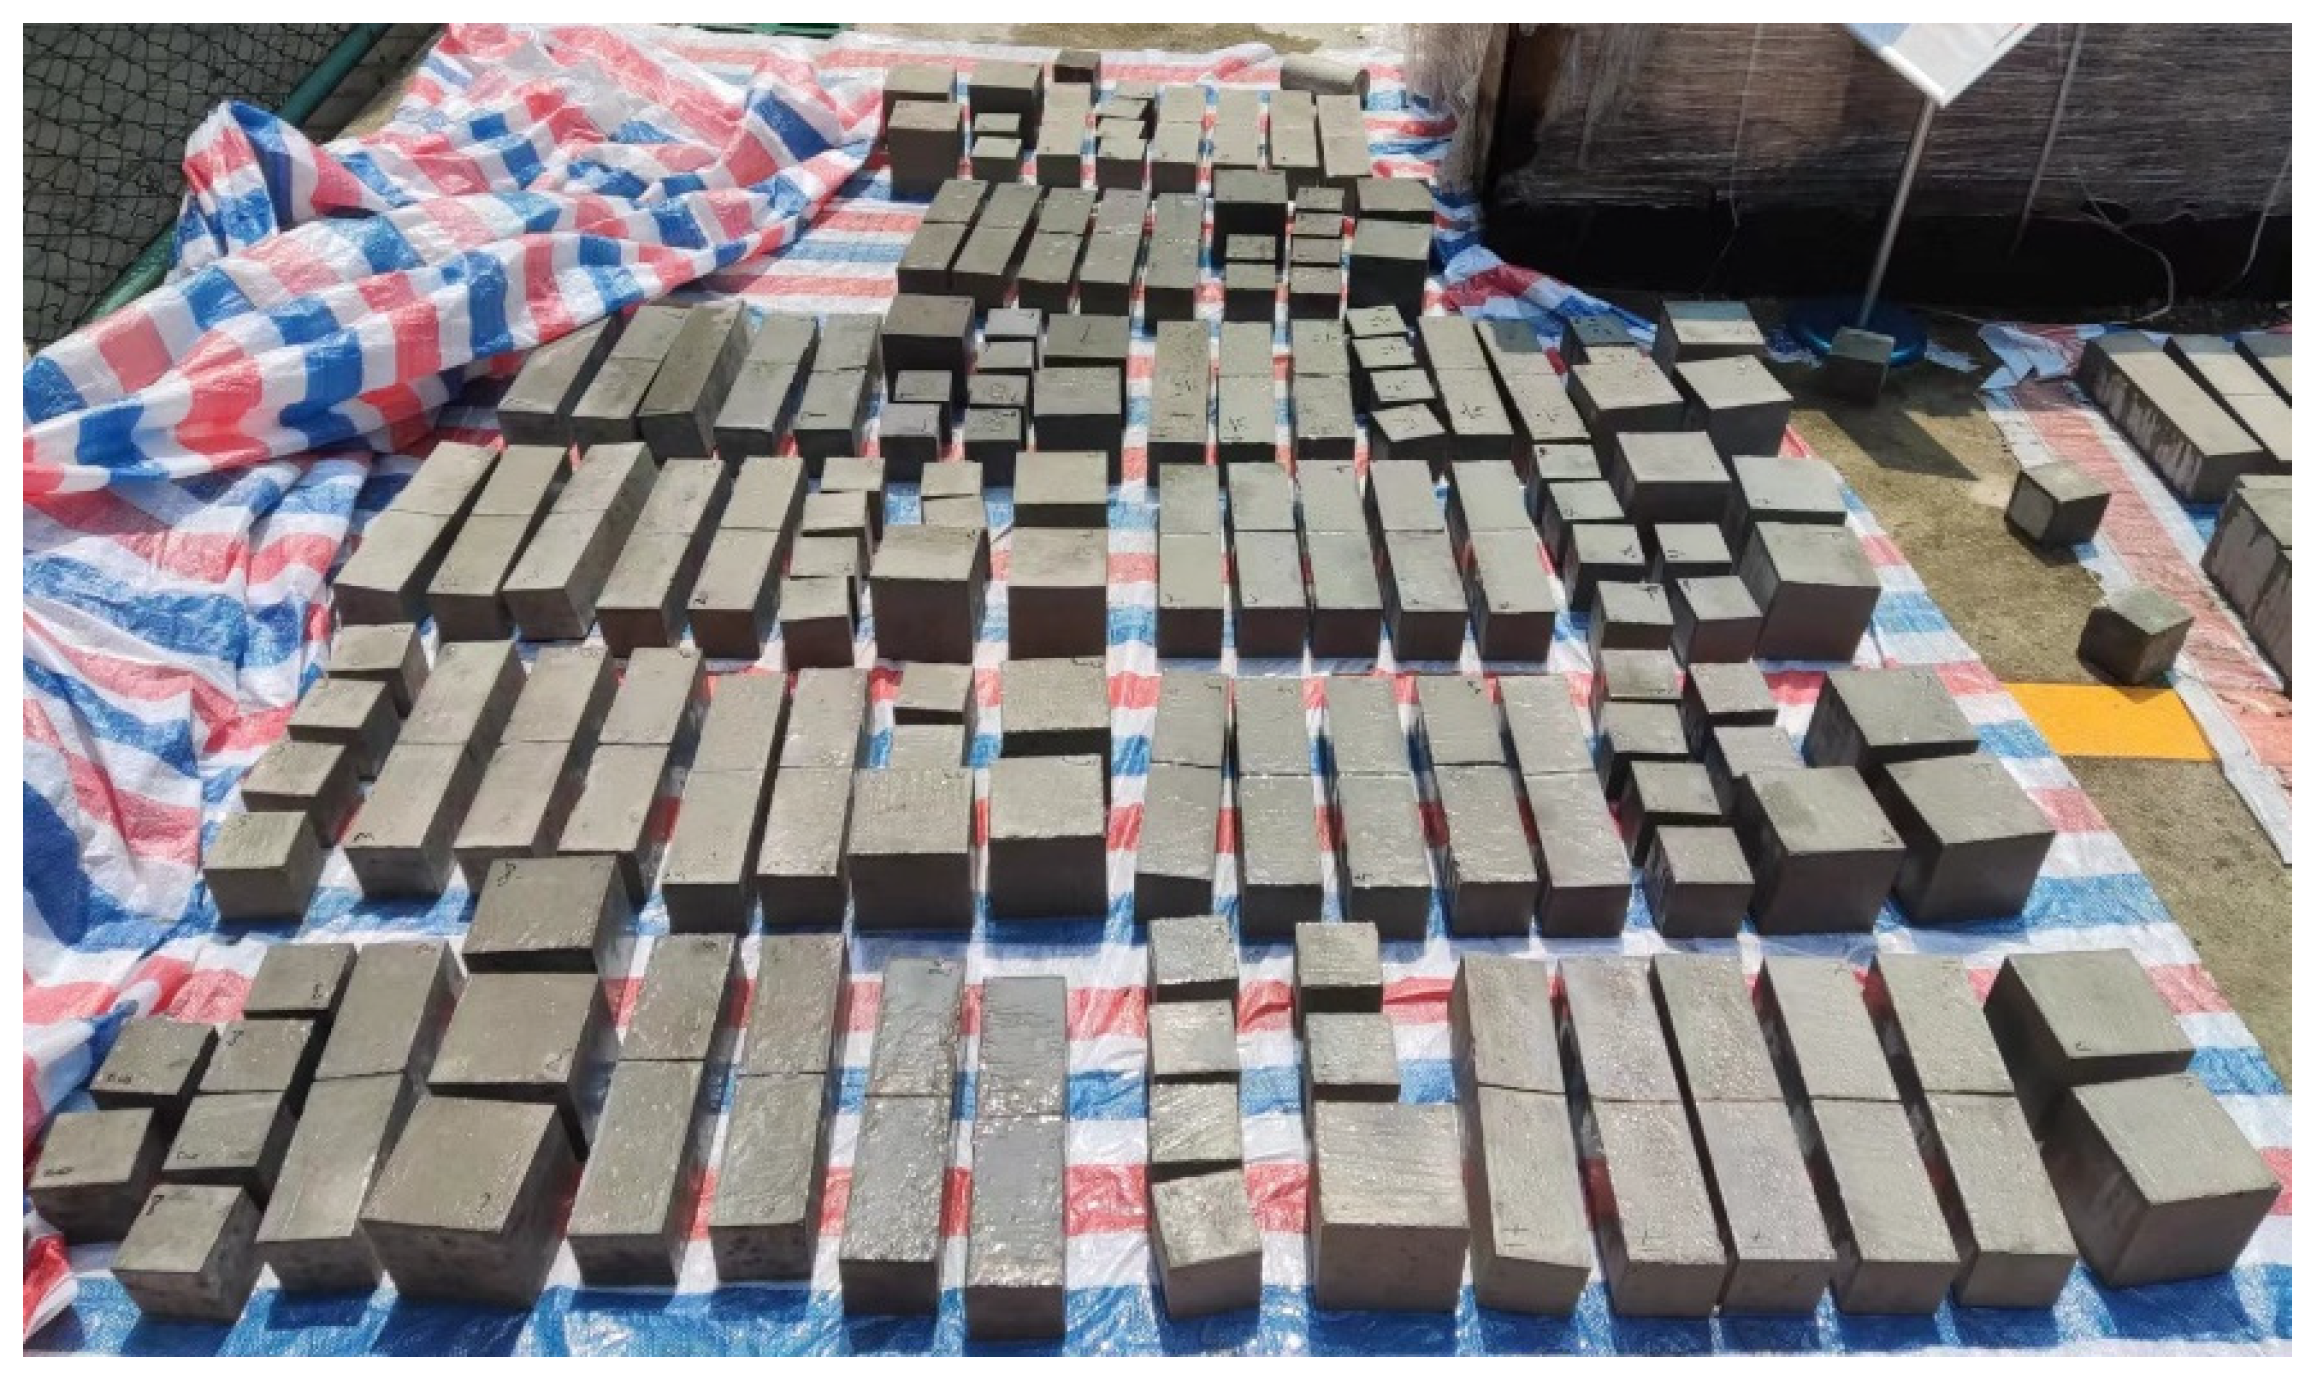
2.2. Casting and Curing

The experimental variables for recycled aggregate concrete included the replacement ratio of recycled aggregate (0%, 50%, 100%), water-to-binder ratio W/B (0.80, 0.60, 0.40), and maximum aggregate size (16 mm, 31.5 mm). For the maximum aggregate sizes of 16 mm and 31.5 mm, the concrete consisted of fully graded aggregates with particle sizes ranging from 5 mm to 16 mm and 5 mm to 31.5 mm, respectively. All specimen parameters are shown in Table 1.
According to the standard GBT 50081-2019 [32], compressive strength tests were conducted using 100 × 100 × 100 mm3 cubic specimens, while split tensile strength tests were conducted using cubic specimens with dimensions of 150 × 150 × 150 mm3. Three specimens were cast for each type of concrete for both compressive and split tensile strength tests. For the fracture test, the three-point bending method was employed following the standard DLT5332-2005 [33]. This involved using notched beam specimens with dimensions of 100 mm × 100 mm × 400 mm, with five specimens cast for each group. The dimensions and quantities of specimens used in this study are summarized in Table 2.
A HJW100 forced mixer with a single horizontal shaft was used for concrete mixing. During the mixing process, the initial step involved pre-wetting the dry mixer with tap water to prevent it from absorbing water. Then, according to the mix proportion (Table 1), cement, sand, and coarse aggregates were added to the mixer simultaneously for a dry mixing duration of 30 s. Subsequently, half of the required water amount was added and mixed for 60 s. Finally, the remaining water was added, and mixing continued for another 120 s. This procedure ensured the uniformity of the mixed materials. The mixture was then poured into the corresponding molds and placed on a vibrating table for compaction.
The curing method adopted for the specimens was natural curing. The specimens were placed in a shaded and humid environment. A layer of plastic film was then placed over the top to maintain appropriate temperature and humidity levels for the freshly cast specimens. After 24 h of curing, the molds were removed. Subsequently, for the next 28 days, the specimens were cured by watering at least twice a day to ensure they achieved the required curing temperature and humidity. The specimen curing site is shown in Figure 2.

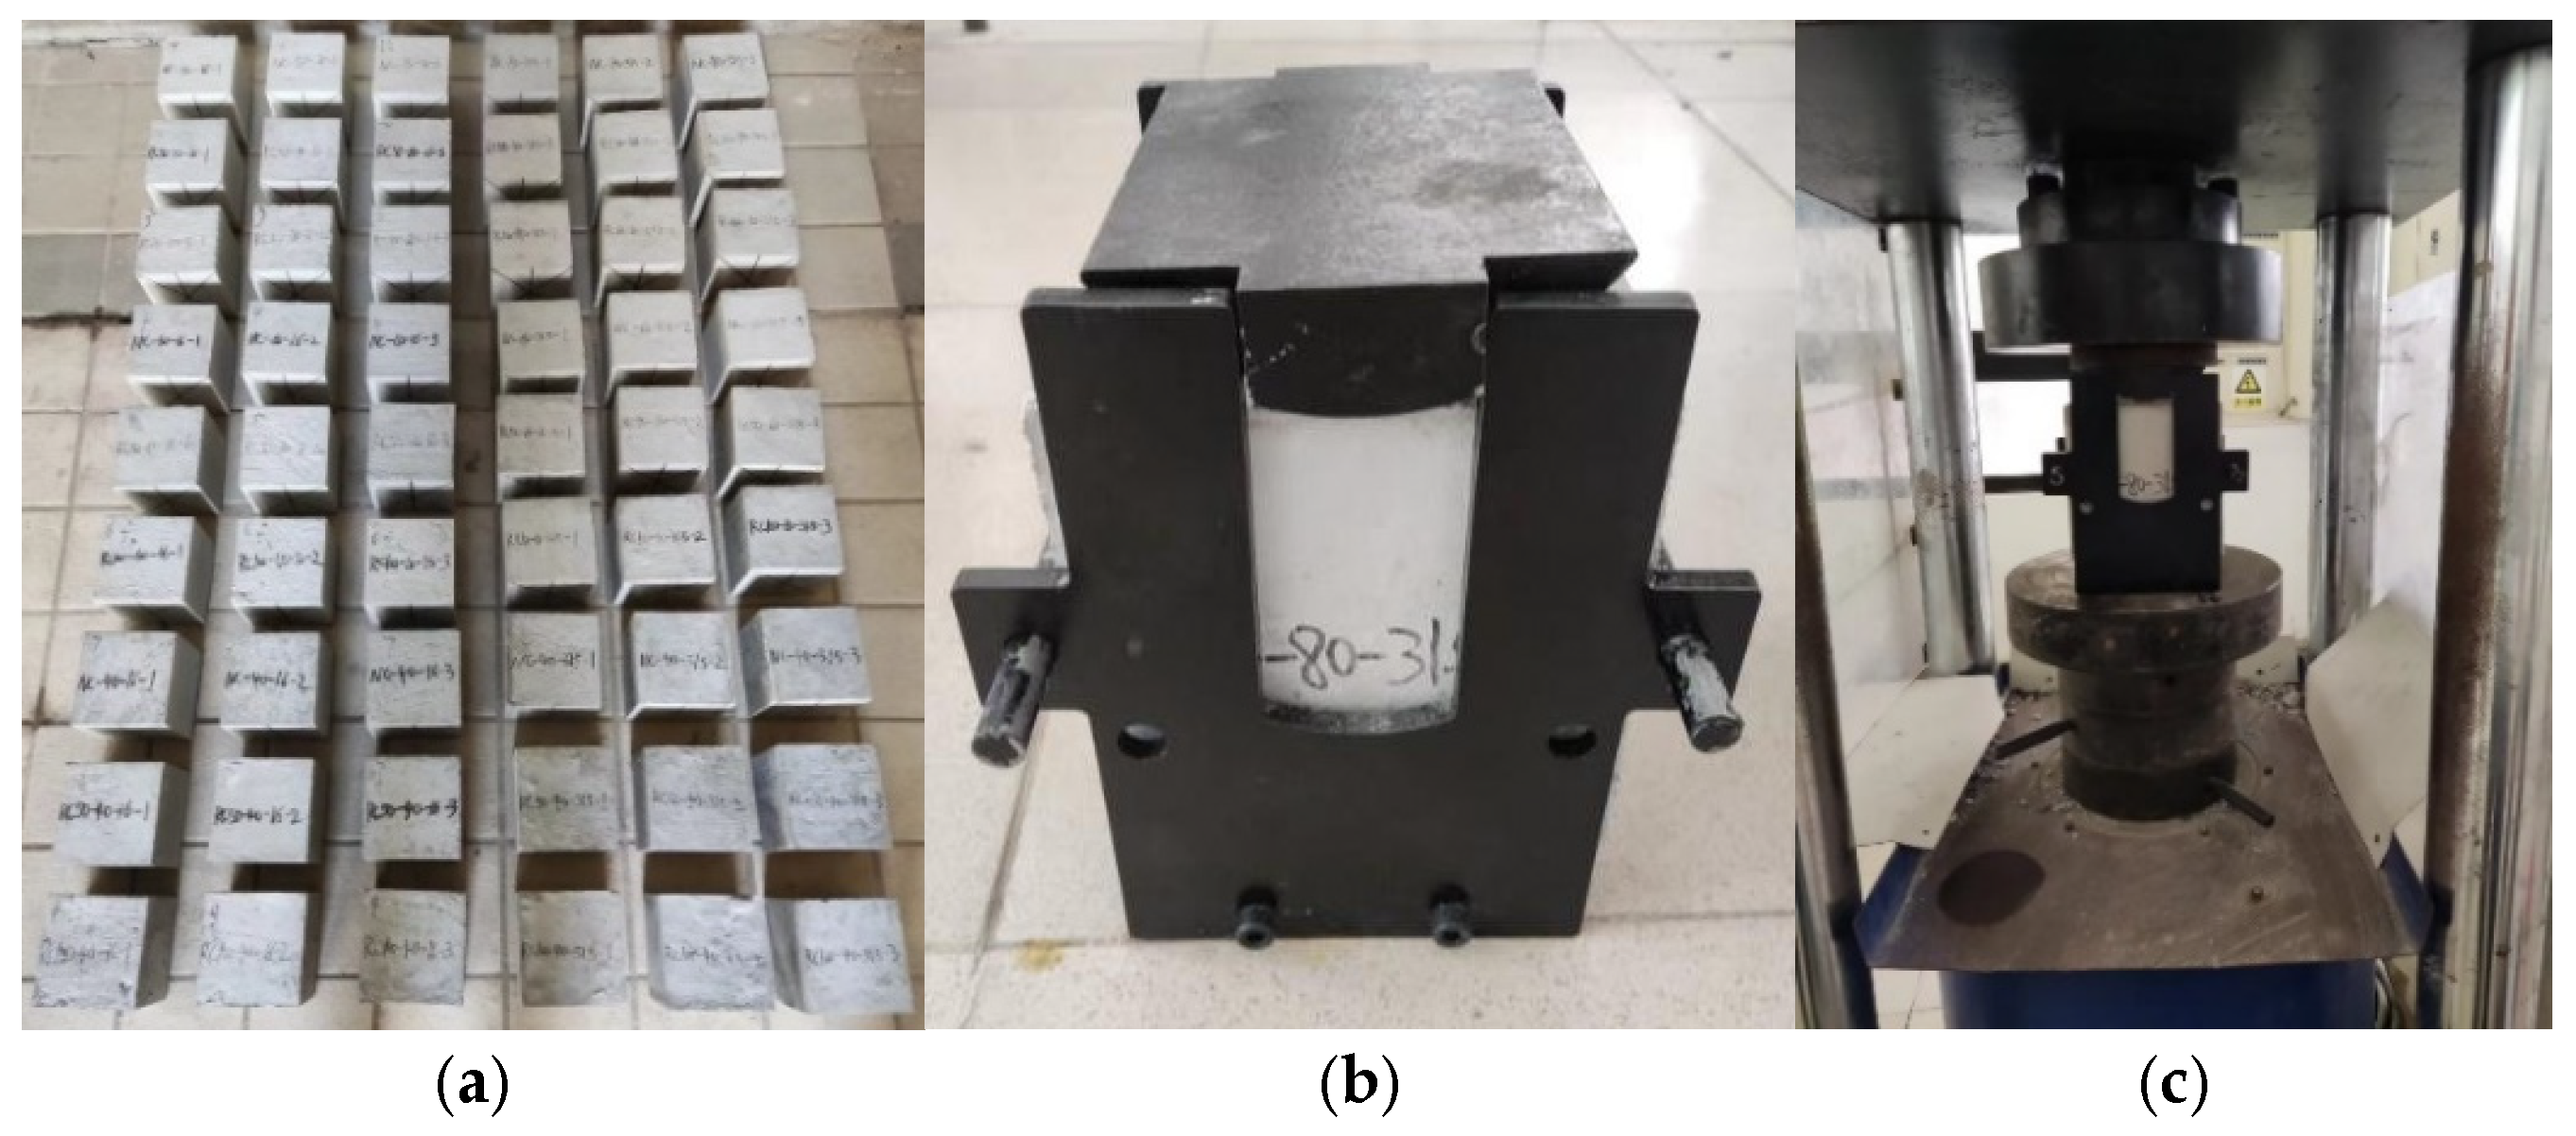
2.3. Cube Compressive Strength Test

The compressive strength of concrete was tested using the YNS-Y3000 electro-hydraulic servo testing machine, as depicted in Figure 3. The testing method primarily followed the standard GB50081-2019, employing the force loading method at a rate of 0.5 MPa/s. As the loading force increased, the concrete cube specimen underwent failure. At this point, the loading of the pressure testing machine was manually stopped, and the failure load was recorded. The compressive strength of the concrete cube was then calculated using Equation (1):
f c c = F A
where f c c represents the compressive strength of the standard cubic specimen in MPa, F is the failure load of the specimen in N, and A is the cross-sectional area of the specimen in mm2. Since the compressive strength test utilized non-standard cubic specimens with dimensions of 100 × 100 × 100 mm3, according to the standard, the concrete strength grade is lower than C60. Therefore, the measured compressive strength f c c needs to be multiplied by a size conversion factor of 0.95. The results are listed in Table 3.

2.4. Cube Splitting Tensile Test

The split tensile strength test was conducted using the same equipment used for the compressive strength test. The testing method followed the standard GB50081-2019, employing a force loading method at a rate of 0.05 MPa/s. During testing, a specialized split tensile strength positioning bracket was utilized (see Figure 4). The cubic specimen was placed into the bracket, followed by positioning spacers and blocks above it. Once preparations were complete, the specimen was loaded onto the pressure testing machine. As the loading force increased, the concrete cube underwent split tensile failure. The loading was stopped manually at this point, and the failure load was recorded. The split tensile strength of the concrete cube was then calculated using Equation (2):
f t s = 2 F t π A = 0.637 F t A
where f t s represents the split tensile strength of the concrete in MPa, and F t is the failure load of the specimen in N. The results are listed in Table 4.

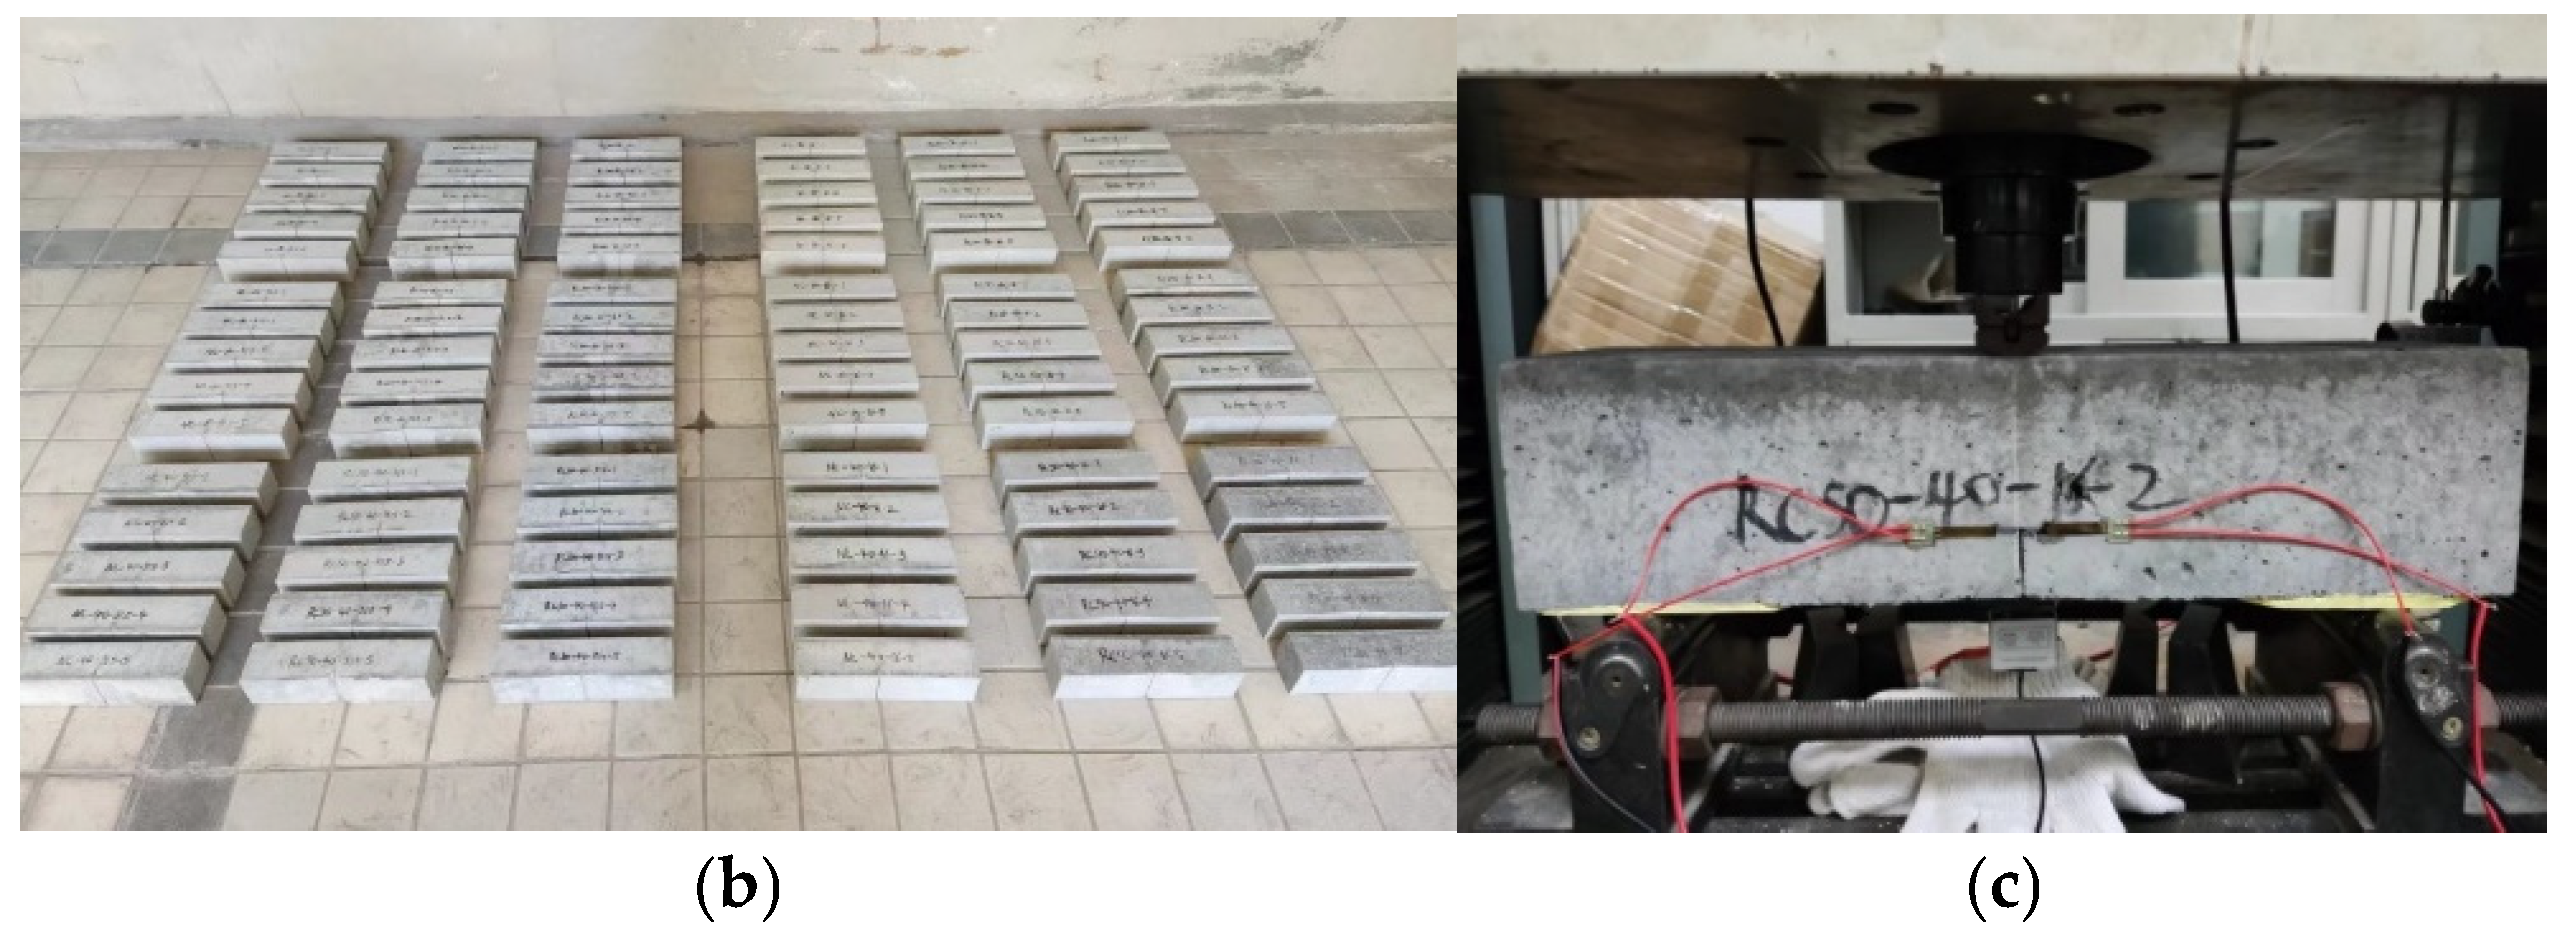
2.5. Three Point Bending Beam Fracture Test

The three-point bending fracture test was conducted using the DDL300 universal testing machine. All specimens were prepared with a groove depth of 30 mm, as depicted in Figure 5a,b. The vertical displacement at midspan position was measured using displacement sensors. During the test, specimens were loaded at a rate of 0.2 mm/min until a complete fracture occurred, as shown in Figure 5c.
Fracture energy is one of the primary indicators used to evaluate the fracture performance of concrete materials [34]. It typically refers to the energy consumed per unit area to form cracks. Here, the area refers to the projected area of the fracture surface rather than the actual area. Therefore, in this study, the fracture energy obtained using this calculation method is referred to as nominal fracture energy.
Through this experiment, the load-deflection curve of the specimen’s fracture can be obtained. Assuming that all the work done by the external load is used to form the concrete fracture surface, the area under the curve represents all the work done by the external load or the total fracture energy of the concrete beam. However, since it is impossible to eliminate the influence of self-weight during the experiment, when calculating the fracture energy, not only the work done by the external load needs to be considered, but also the self-weight of the concrete notch fracture beam and the work of additional equipment. Therefore, the formula for calculating the nominal fracture energy of recycled aggregate concrete is as follows:
G F = W 0 + m g m a x A
where W0 is the total area under the load-deflection curve; and m = m1 + m2, where, m1 is the mass of the specimen between the two support points and m2 is the mass of the attachments placed on the specimen. g is the acceleration due to gravity. Δmax is the maximum deflection of the beam at final failure. A is the projected area of the fracture surface. In this work, m = m 1 + m 2 = 7.2   k g + 0.405   k g = 7.605   k g , A = 0.1   m × 0.07   m = 0.007   m 2 .

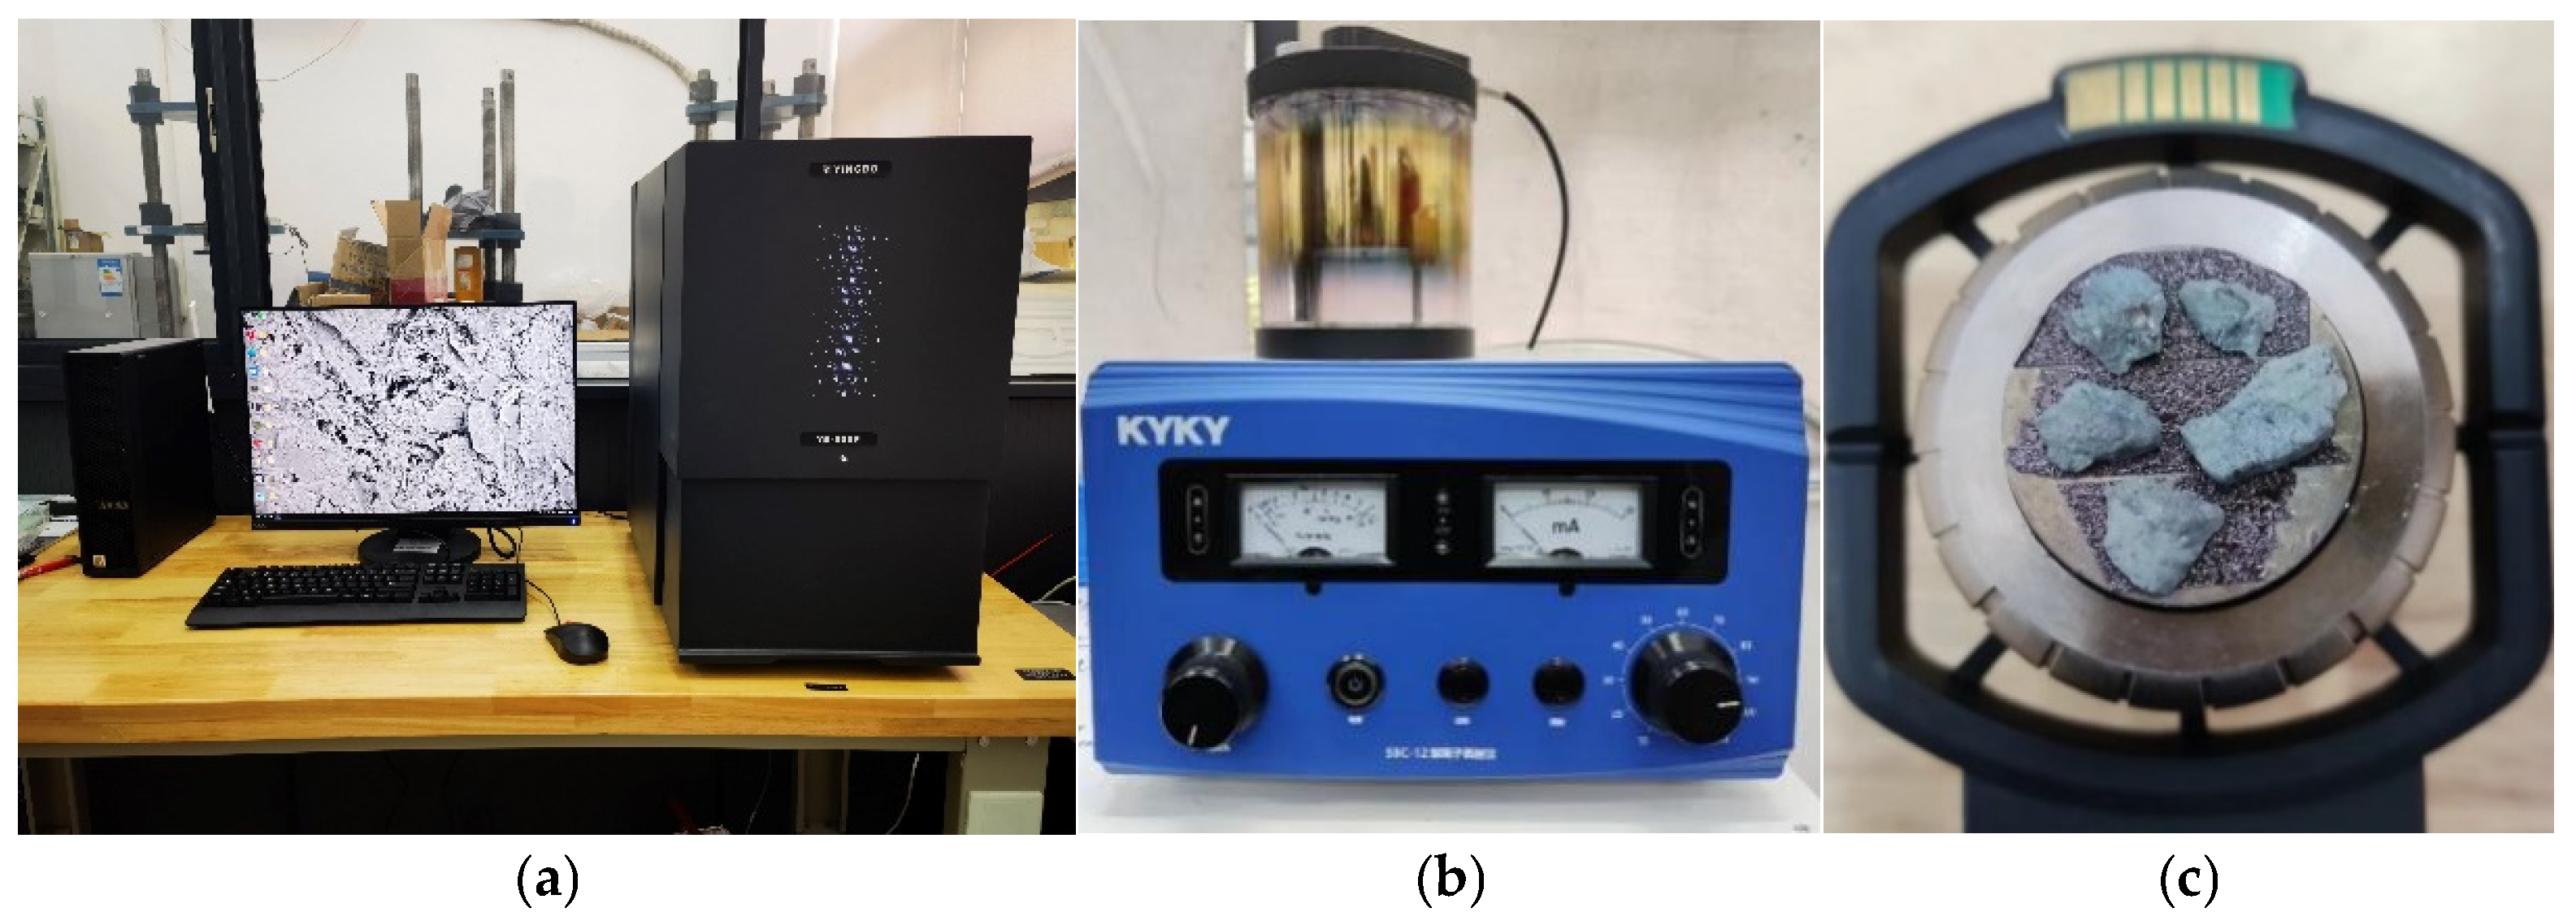
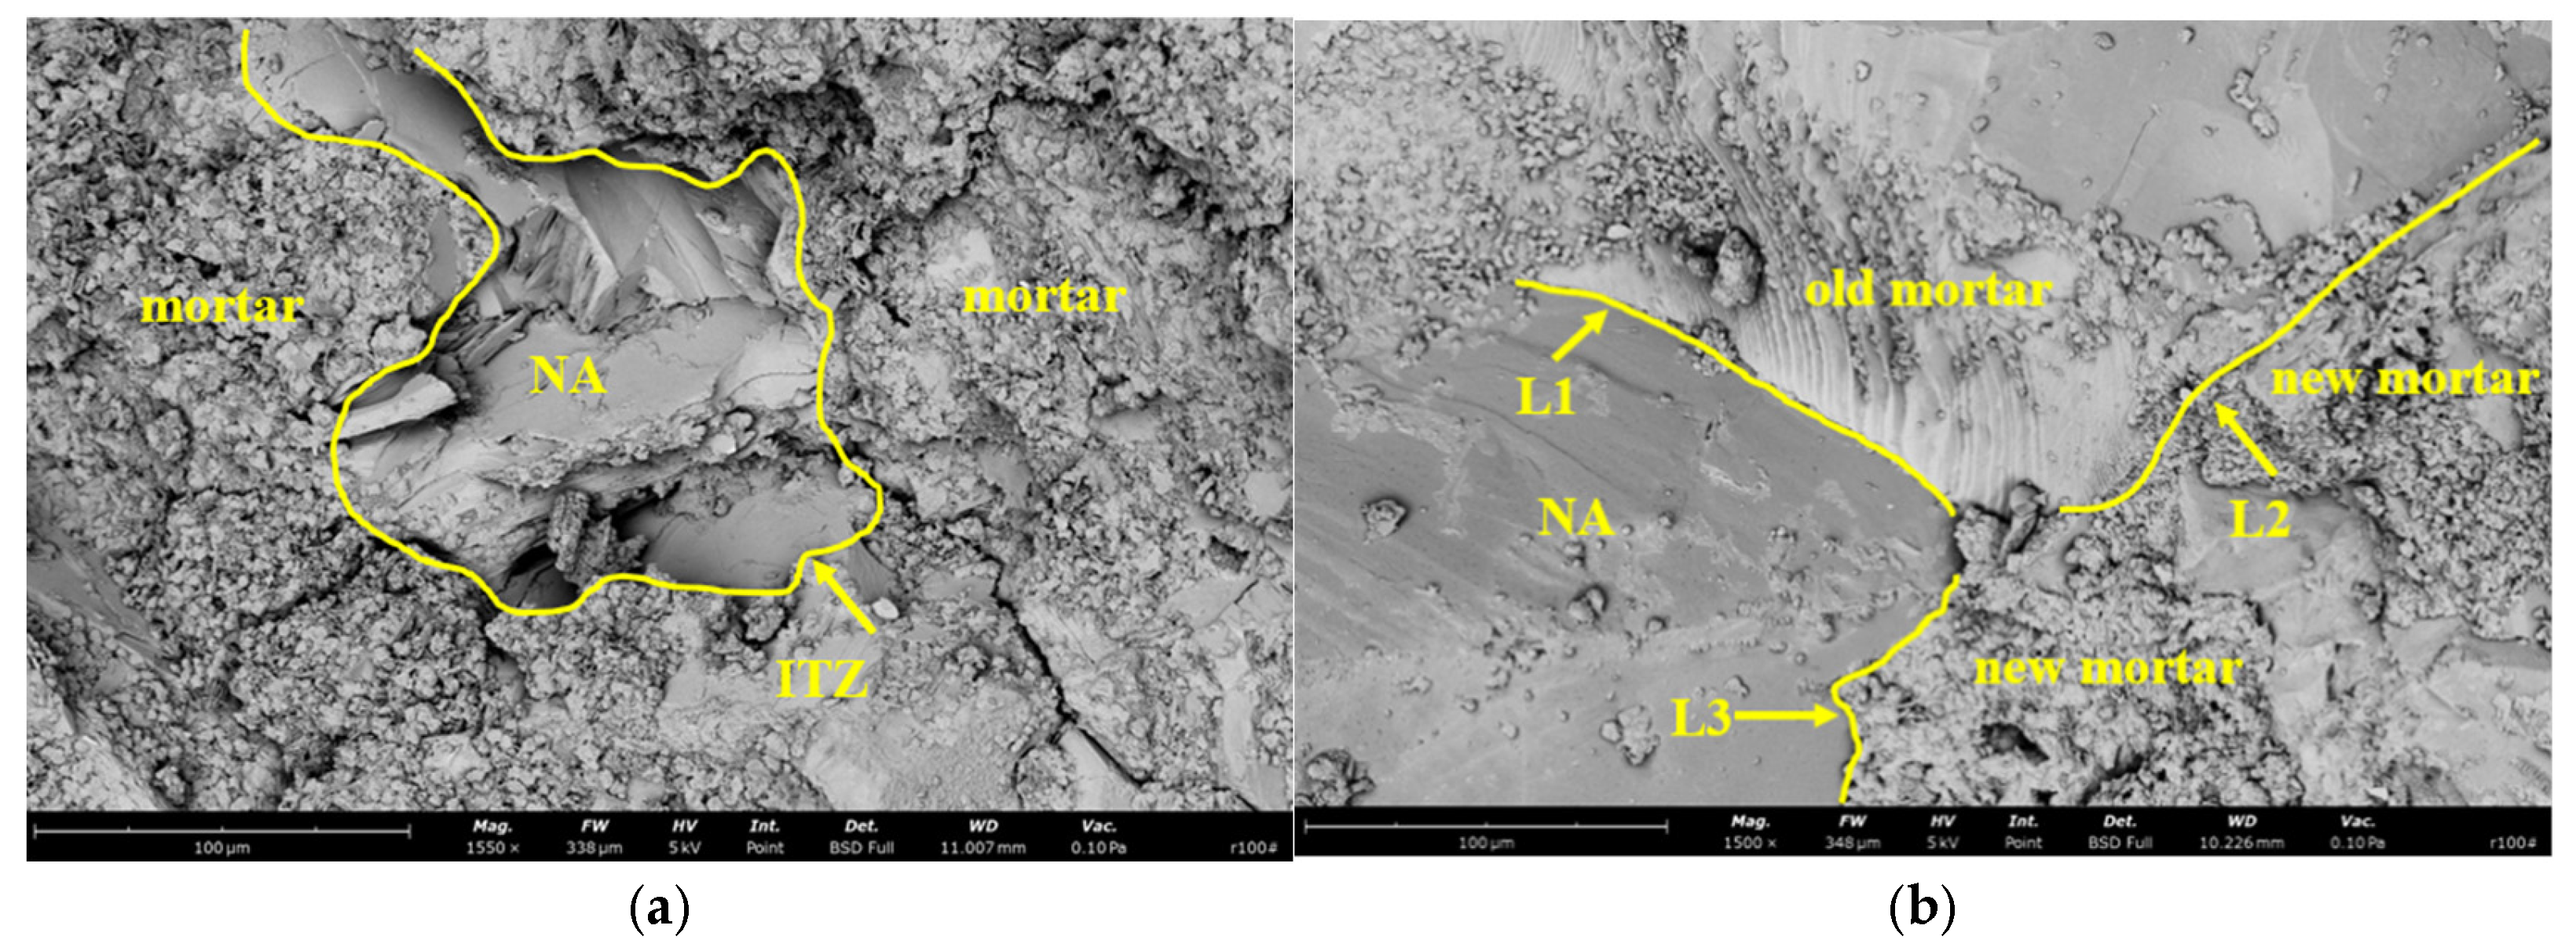
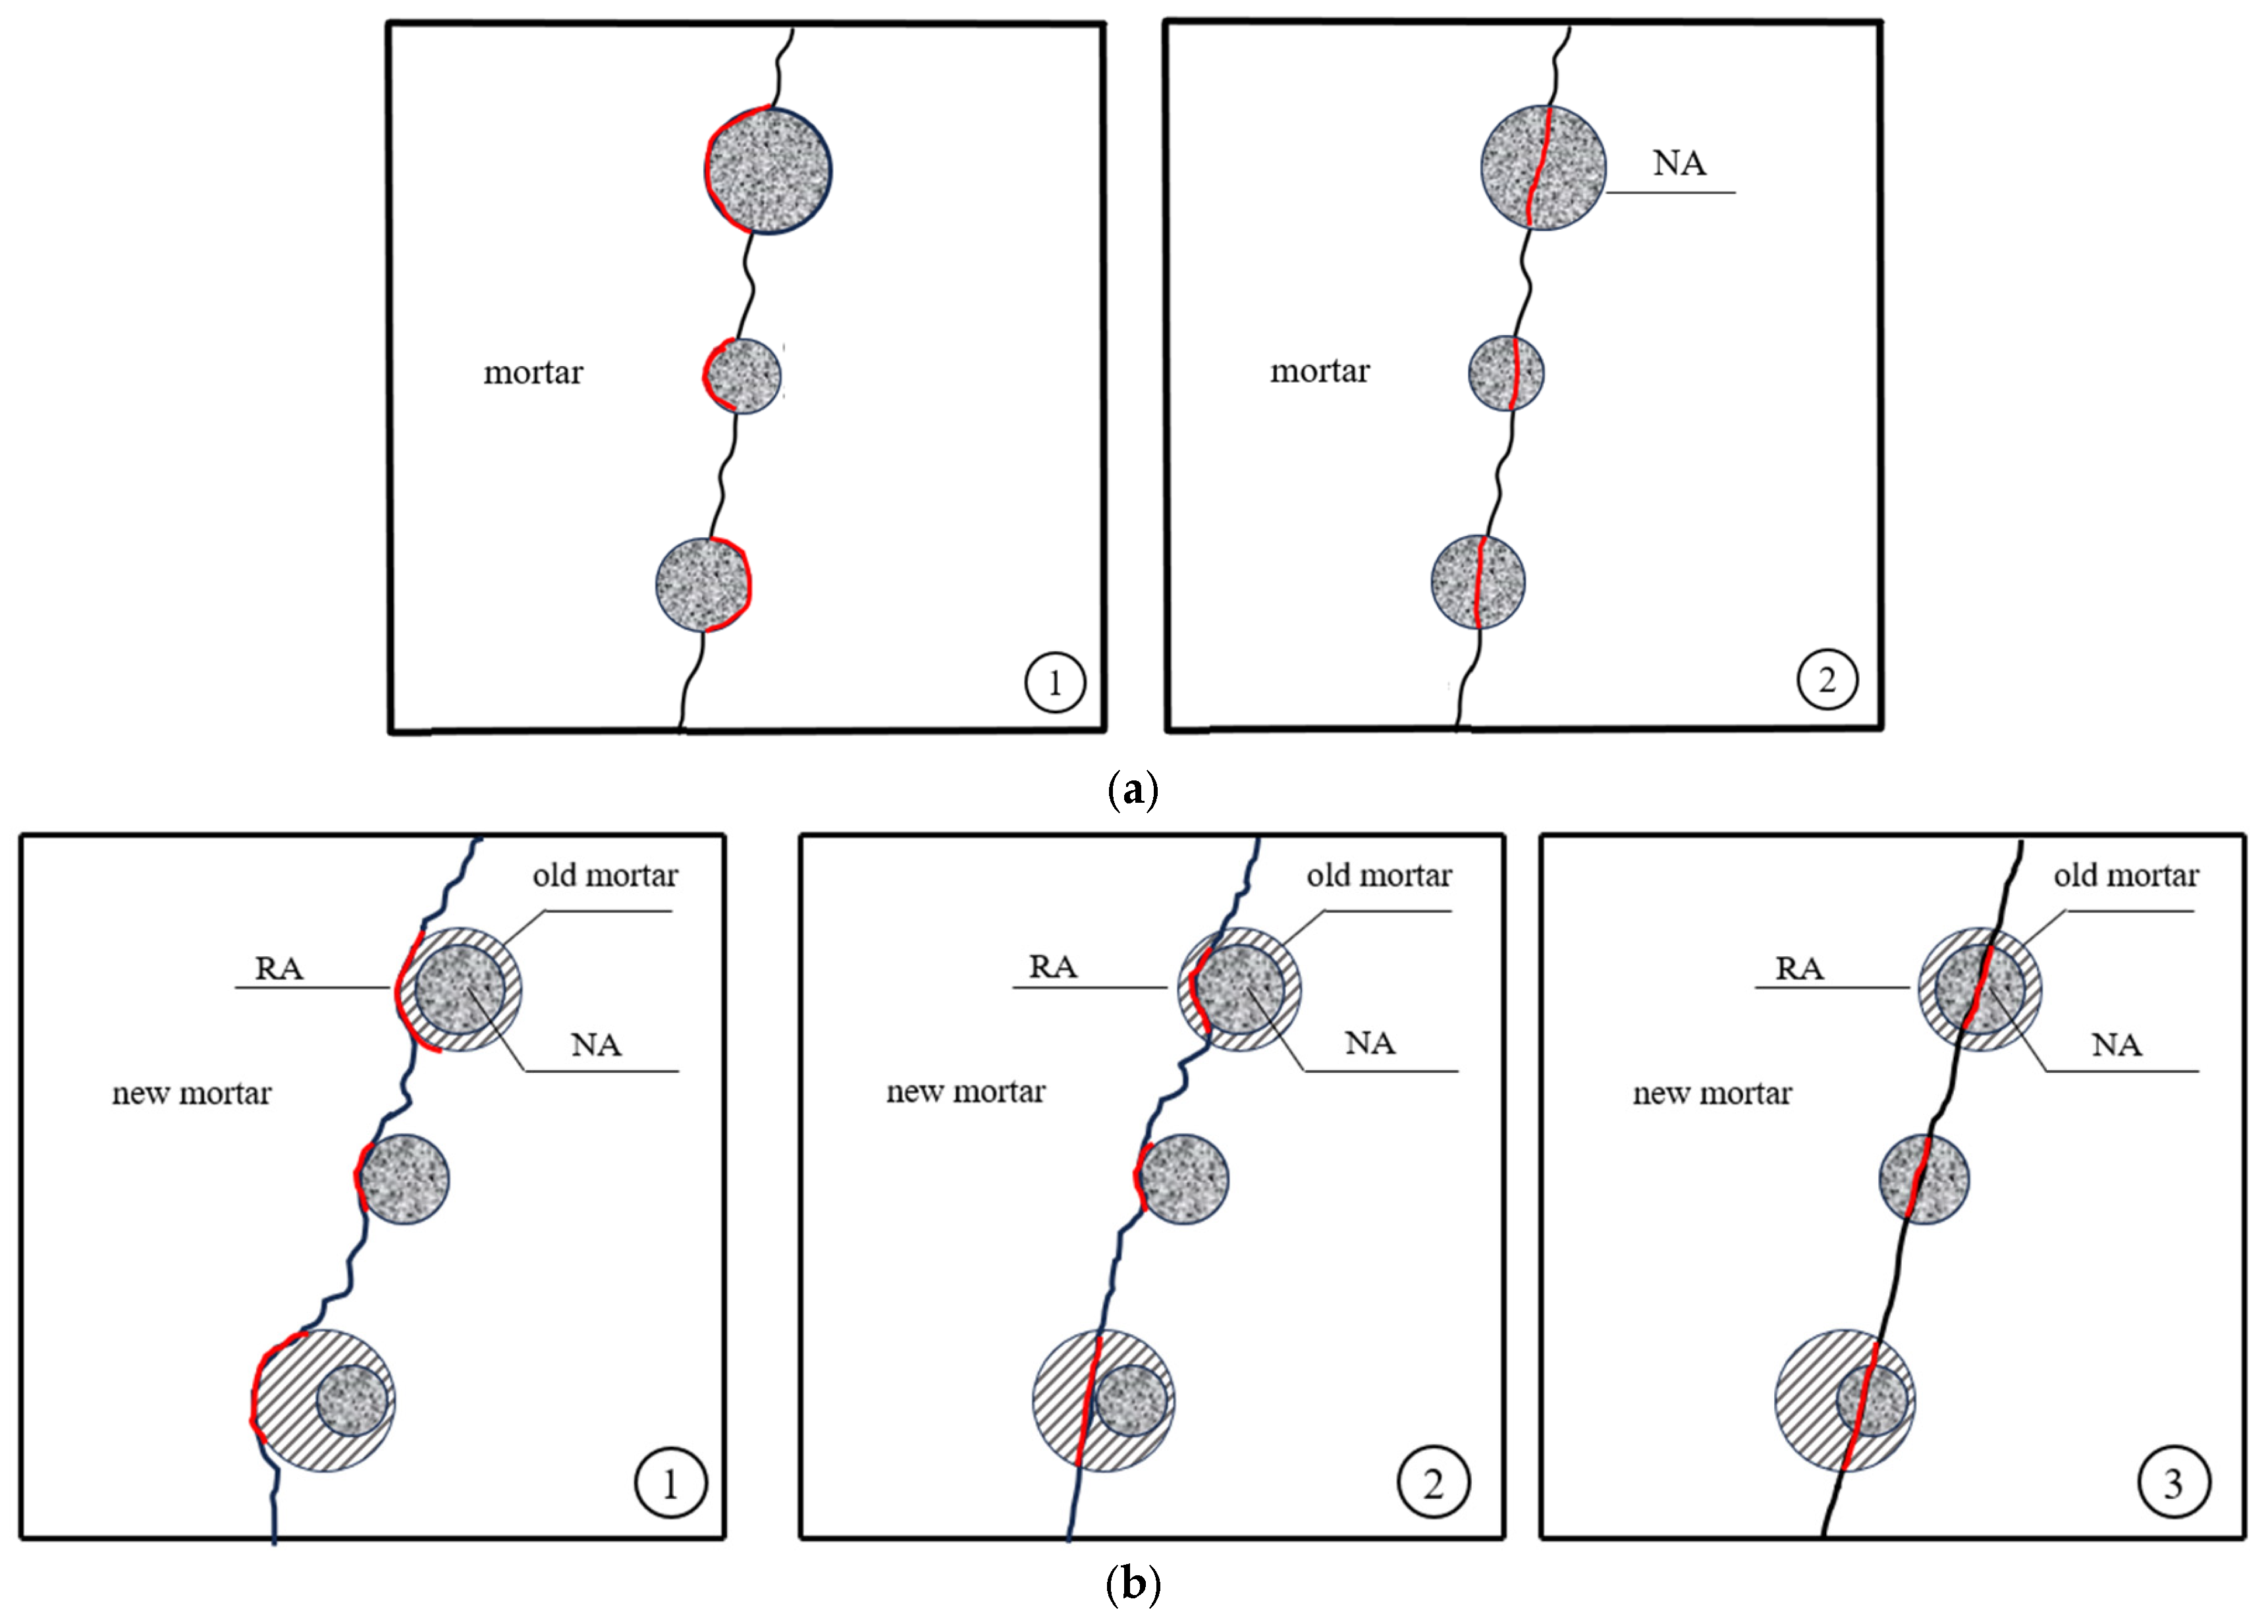
2.6. Microstructure Detection

The concrete microstructure testing was conducted using a scanning electron microscope (SEM) model YB-500P manufactured by Phenom-World company, based in Eindhoven, The Netherlands. After the three-point bending fracture test, specimens were selected at 1 cm from the fracture surface and prepared into small pieces. The surfaces of the specimen fragments were cleaned and then attached to sample holders using conductive adhesive. Subsequently, the sample holders with the specimen fragments were placed in an ion sputtering machine for vacuum pumping followed by 60 s of gold coating. After the gold coating process, the sample holders were placed under the SEM to observe the microstructure of the fractured specimen fragments and capture images, as shown in Figure 6.

2.7. Fracture Interface Measurement

2.7.1. Roughness RS and Fractal Dimension D

The roughness (Rs) of the concrete fracture surface is defined as the ratio of the real area (At) of the fracture surface to its projected area (Ap):
R s = A t / A p
The projected area (Ap) is the area excluding the 30 mm crack reserved on the specimen cross-section (as shown in Figure 5a), which is 100 mm × 70 mm. While the actual area (At) of the fracture surface can be obtained by summing the areas of all spatial triangles formed by the densest sampling points obtained through fringe projection 3D measurement technology. In this work, the density of sampling points is up to the image resolution.
Another measure of concrete surface roughness is the fractal dimension since the fracture surface of concrete has fractal characteristics. The fractal dimension can be determined using the projection-covering method, which is analogous to the box-counting technique [7]. The fractal dimension, denoted as D, is ascertained by the rate at which the apparent area, A(r), varies with the decrease in grid size, r. This relationship is encapsulated in the following equation:
D = 2 + l n A ( r ) l n r

2.7.2. The True Fracture Energy

During the actual fracture process, cracks typically propagate along specific regions within the specimen, known as ligaments. As cracks propagate, the work done by external forces is consumed by the crack, resulting in material fracture. Therefore, by considering the entire surface area of the fracture surface, including the excess expansion area of the crack, one can more accurately evaluate the material’s fracture energy. Therefore, when calculating fracture energy, replacing the projected surface area of ligaments A in Equation (3) with the actual surface area A’ of the specimen fracture surface yields the true fracture energy of the material:
G F = W 0 + m g m a x A = W 0 + m g m a x A × R s = G F R s
where A’ represents the actual surface area of the specimen cross-section.
Additionally, there are two other methods for calculating the actual fracture energy. The first method, presented by Yan [20], employs the following formula for calculating genuine fracture energy:
G F = S 0 S D 2 ( 2 D ) G F
Here, D represents the calculated fractal dimension, S0 denotes the maximum reference scale used in calculating the fractal dimension, and SD represents the minimum reference scale used in calculating the fractal dimension. For this study, S0 is set to 11, and the minimum reference scale SD is set to 5.
The second method for calculating genuine fracture energy, proposed by Issa [8], is as follows:
G F = G F [ 1 + k ( D 2 ) ]
Here, D represents the fractal dimension and k represents the slope of the fitting curve used in calculating the fractal dimension [8].

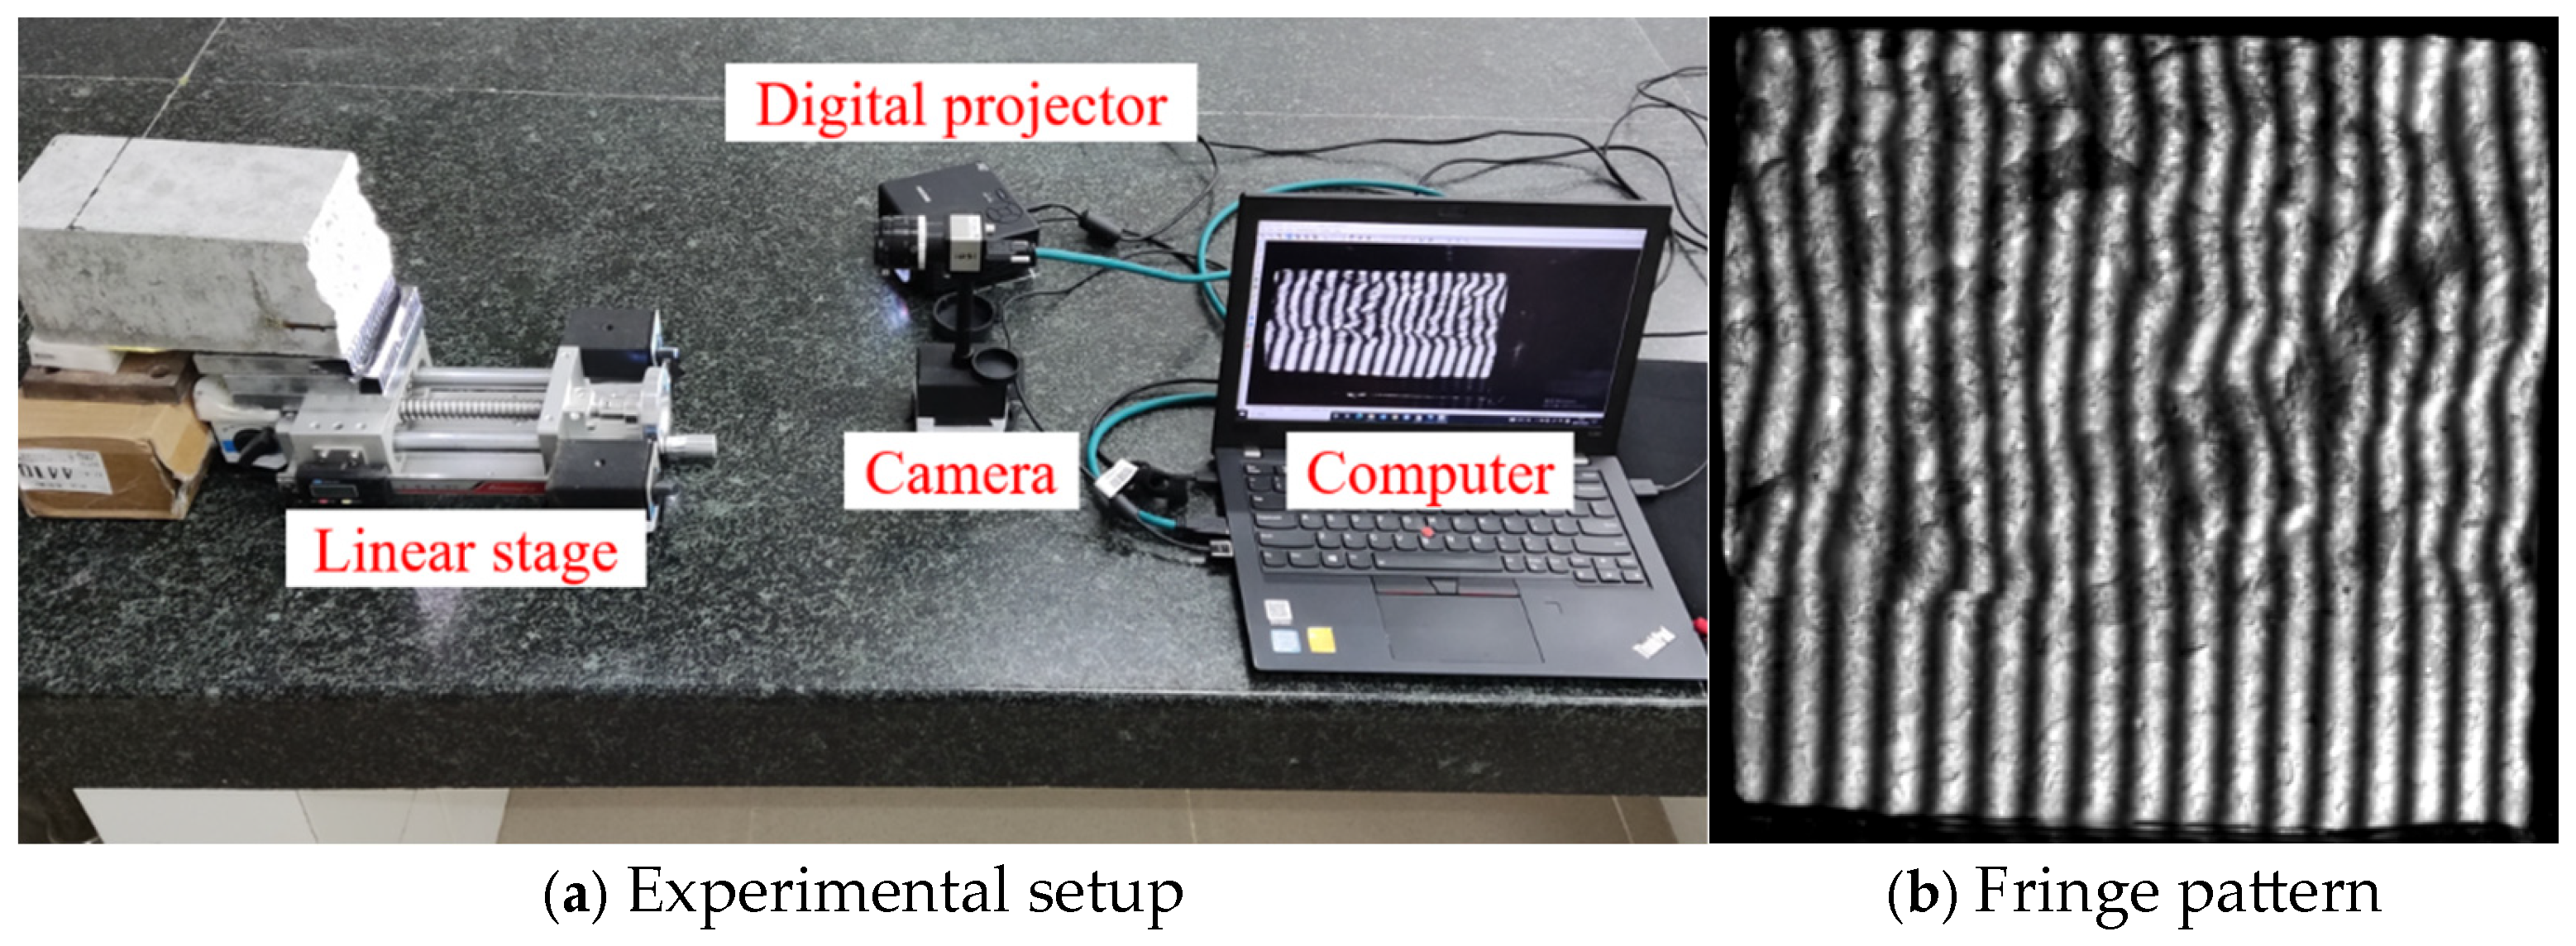
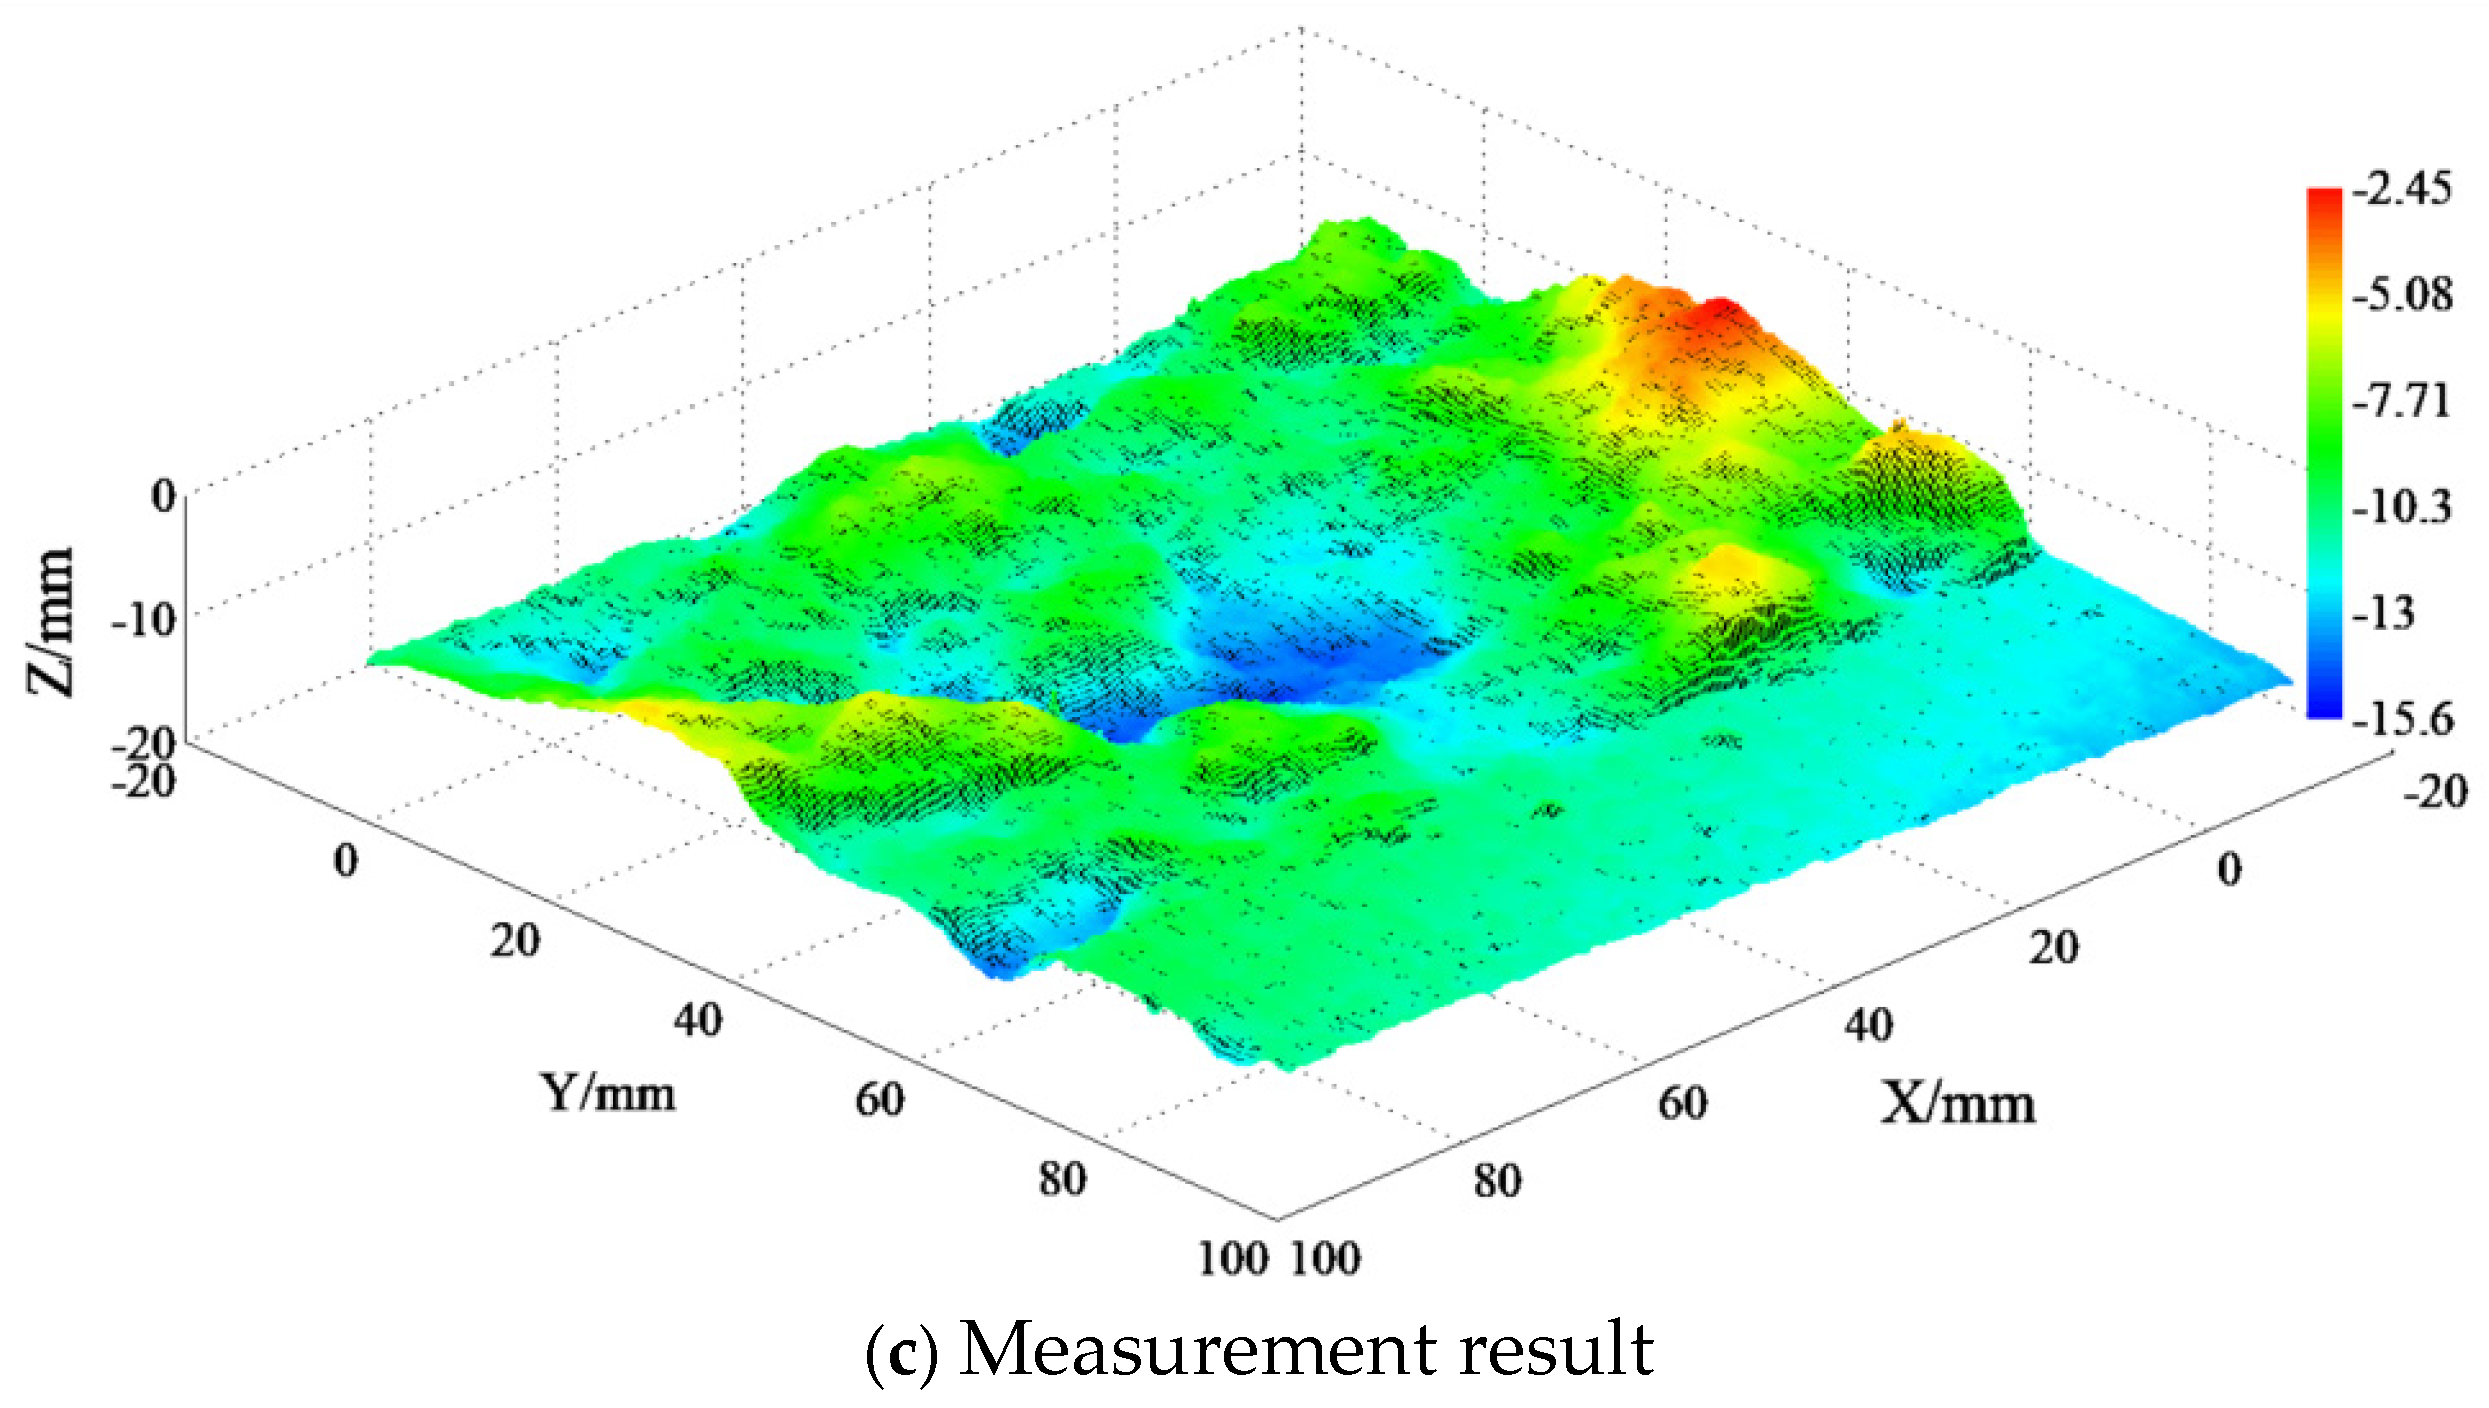
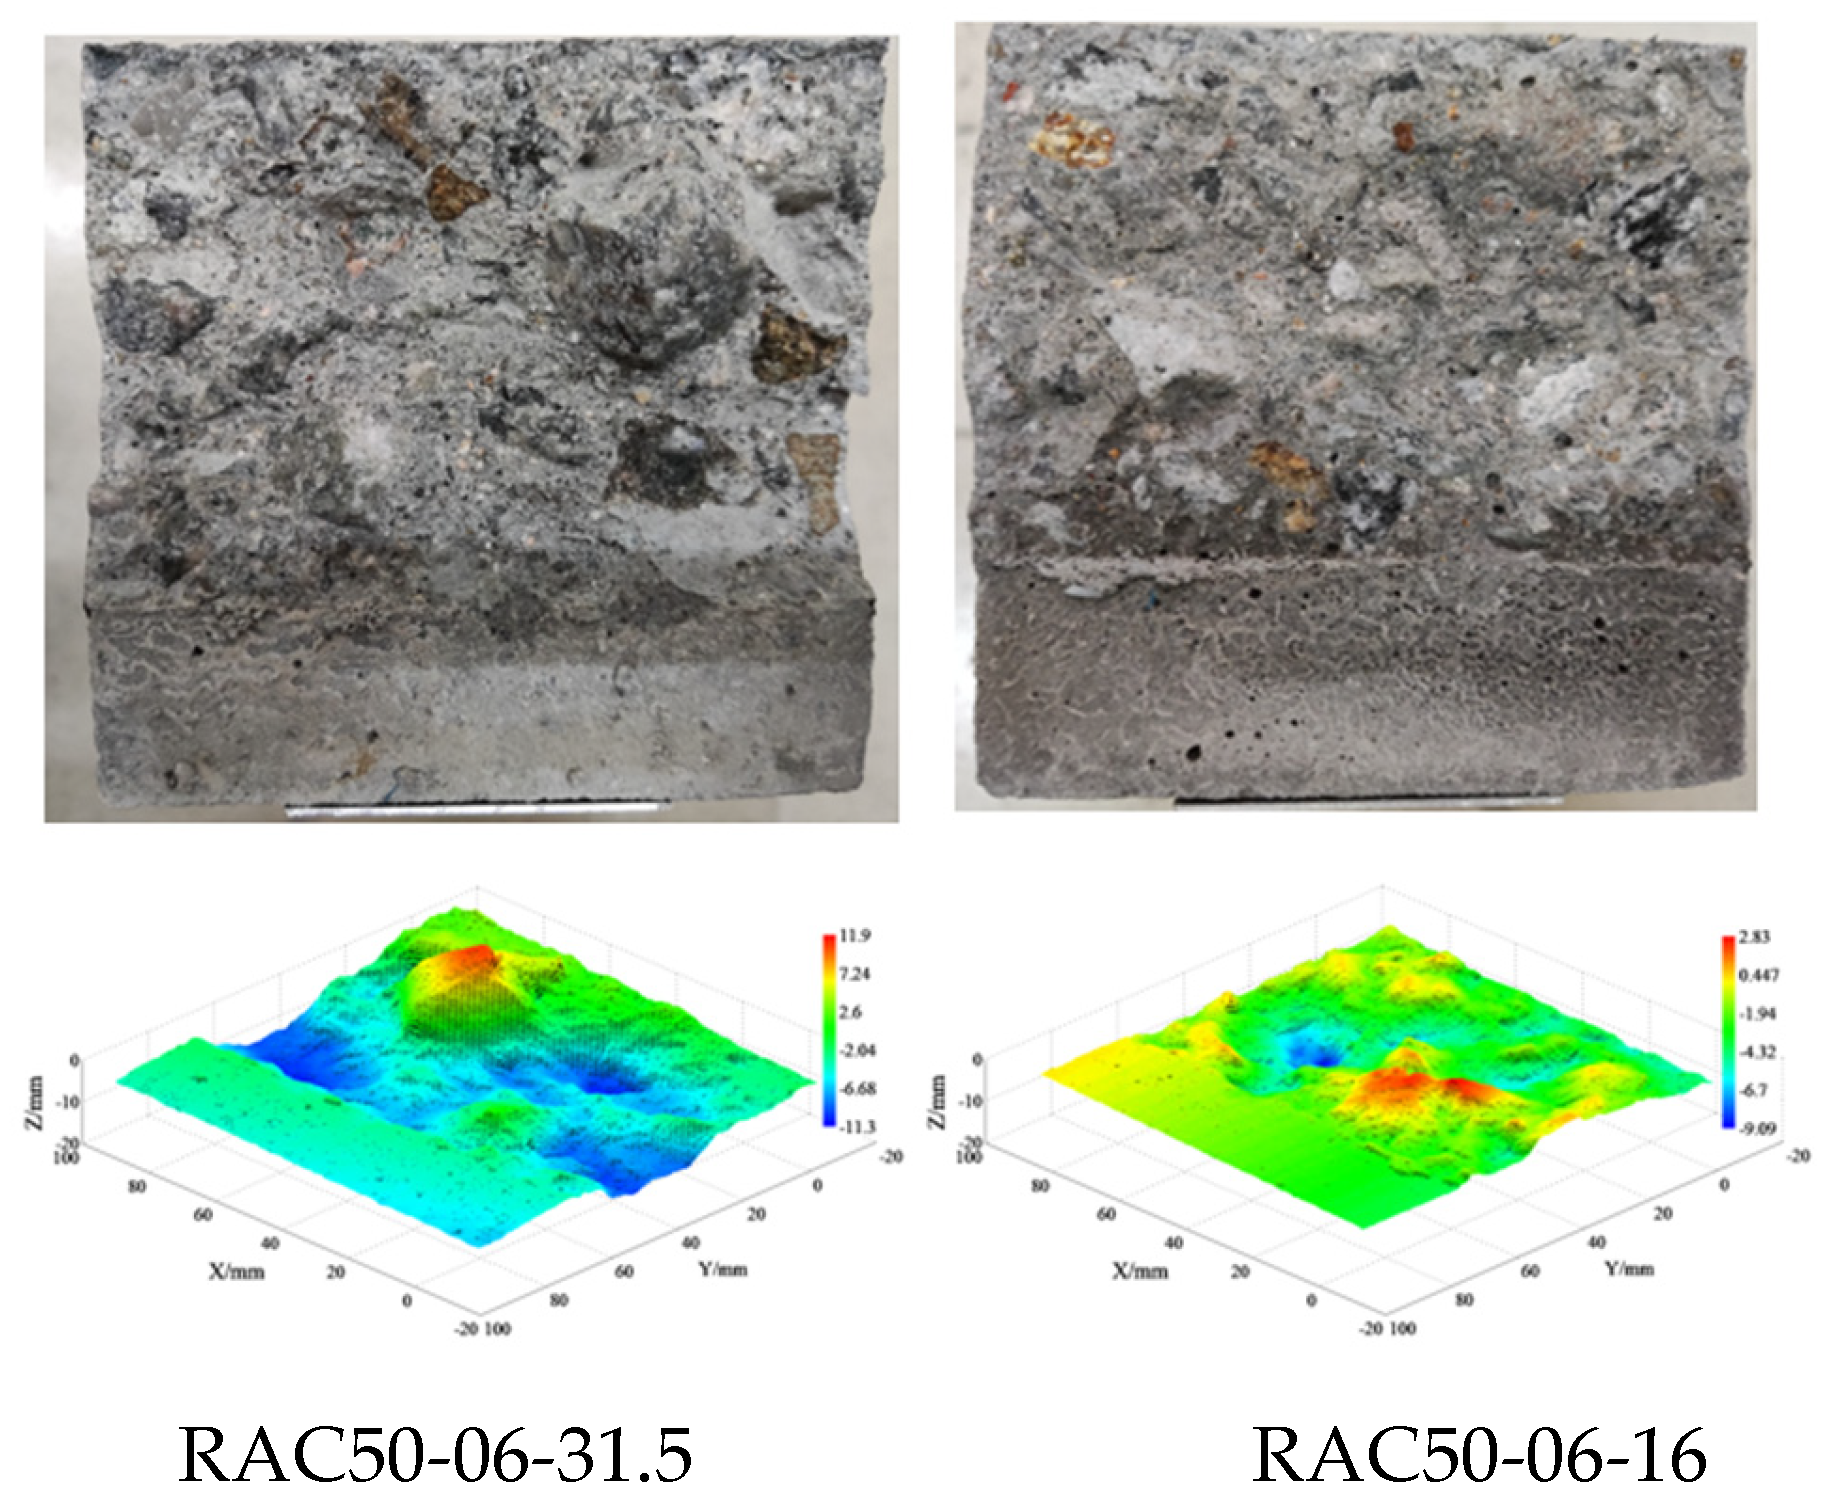
2.7.3. Three-Dimensional Measurement

In this study, fringe projection technology was employed for fracture surface measurements. First, a series of sinusoidal fringe patterns are projected onto the surface of the object using a digital projector. These fringe patterns undergo distortion as the surface shape changes. Next, a camera captures the distorted fringe patterns caused by variations in surface height. Subsequently, the phase of the fringe is demodulated from the distorted fringe patterns using the four-step phase-shifting method and phase unwrapping algorithm. Then, the depth (Z-coordinate) of each point on the object surface is obtained through a two-reference-plane based method. Finally, lateral calibration is performed to convert image coordinates into world coordinates. Thereby the three-dimensional surface morphology information of the concrete fracture surface can be obtained.
Figure 7a shows the fringe projection 3D measurement system. The system consists of a DLP projector (Ricoh, rw1120est, Tokyo, Japan) with a resolution of 1280 × 800 pixels, a 12-bit CMOS camera (IDS, 3370, Obersulm, Germany), a computer (ThinkPad, X11, Beijing, China), and a linear translation stage. The projector is used to project computer-generated sinusoidal fringe patterns, while the camera captures the distorted fringe patterns. All these images are recorded by the computer. The camera optical axis was set perpendicular to the calibration plane, the distance between the camera and the calibration plane at Z = 0 was approximately 1000 mm, and the angle between the projector optical axis and the camera optical axis ranged from 20 to 40 degrees. Additionally, during the experiment, the grayscale of the projected sinusoidal fringe patterns was adjusted within the range of 50 to 250 to ensure a good linear response of the projection-acquisition system. Figure 7b shows one of the phase-shifting fringes. The measurement area was about 100 × 100 mm2, corresponding to approximately 1500 pixels × 1500 pixels, resulting in a dense point cloud with a scanning interval of 0.067 mm/pixel for each concrete fracture surface. Figure 7c displays the reconstructed concrete surface by using fringe projection technology.
The accuracy of the measurement system was determined by measuring a standard cylinder. As shown in Figure 8a, the diameter of the standard cylinder is 99.3 mm. Figure 8b is one of the fringe patterns, and Figure 8c is the reconstructed surface. The obtained point cloud data were subjected to least squares fitting to obtain a cylindrical fitting diameter of approximately 98.67 mm, with a relative error of less than 1%. Therefore, it fully meets the accuracy requirements for measuring concrete fracture surfaces, as the minimum aggregate size of concrete sections is in the millimeter range.

3. Results and Discussion

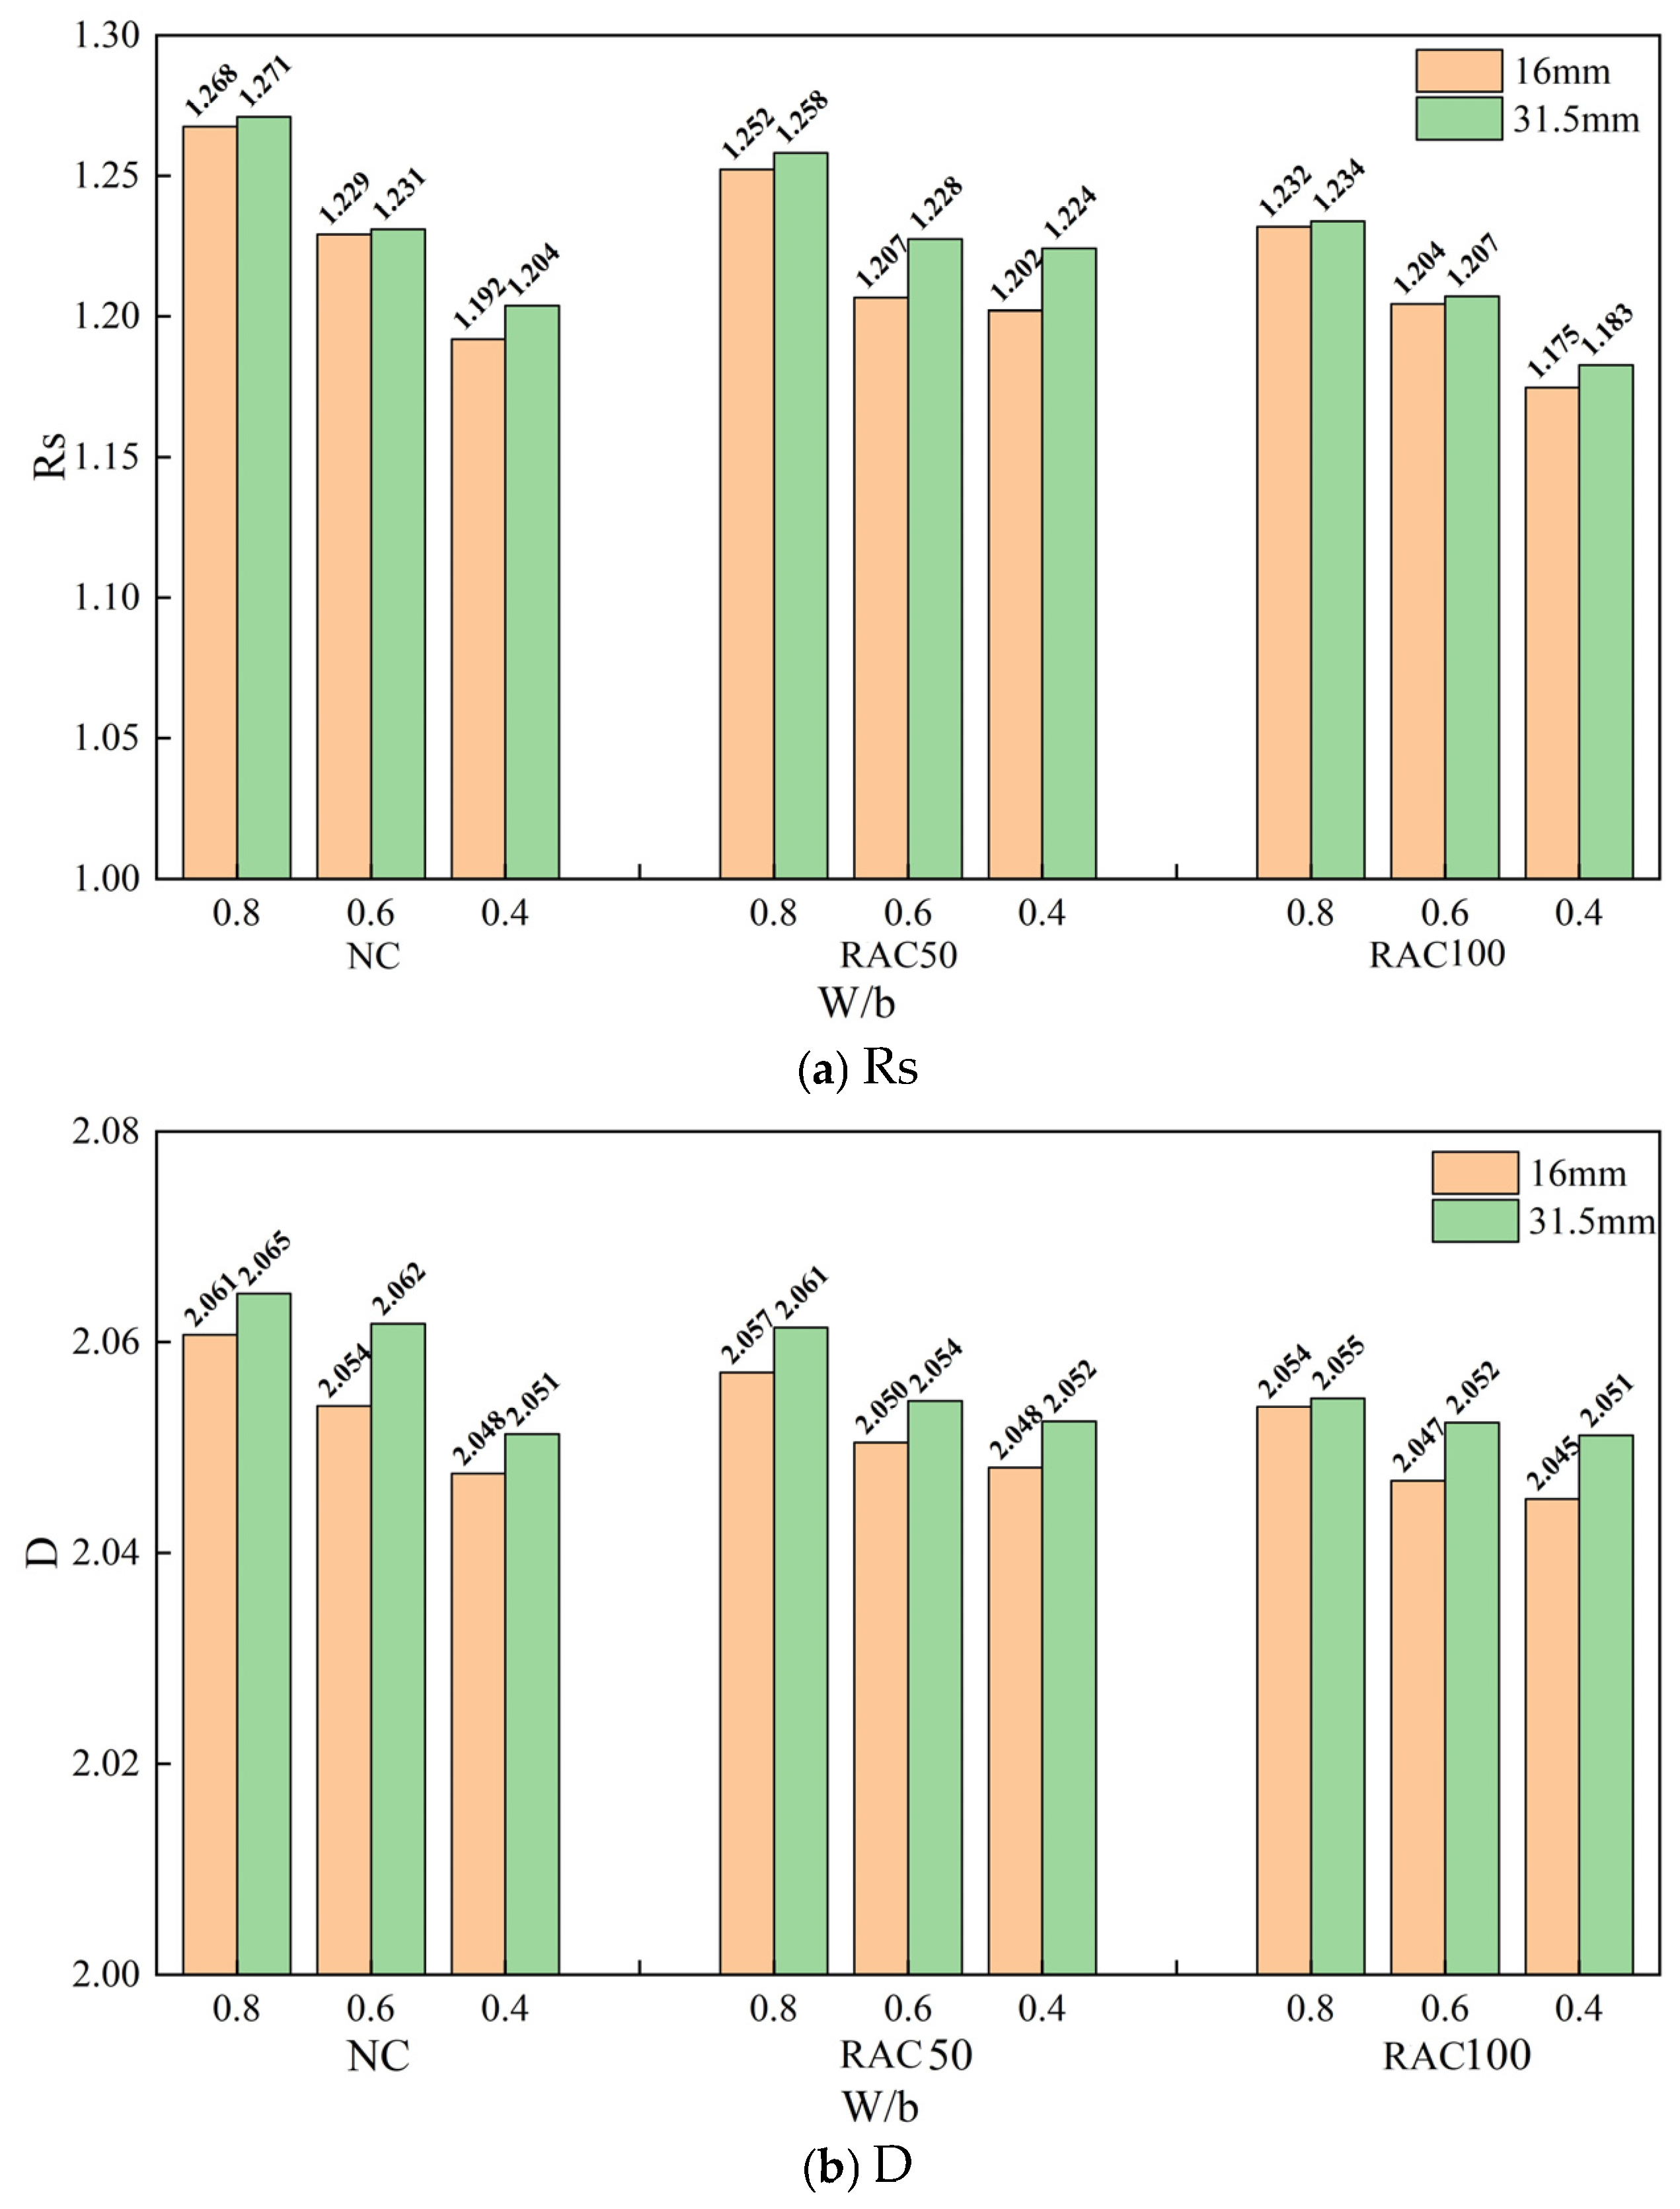
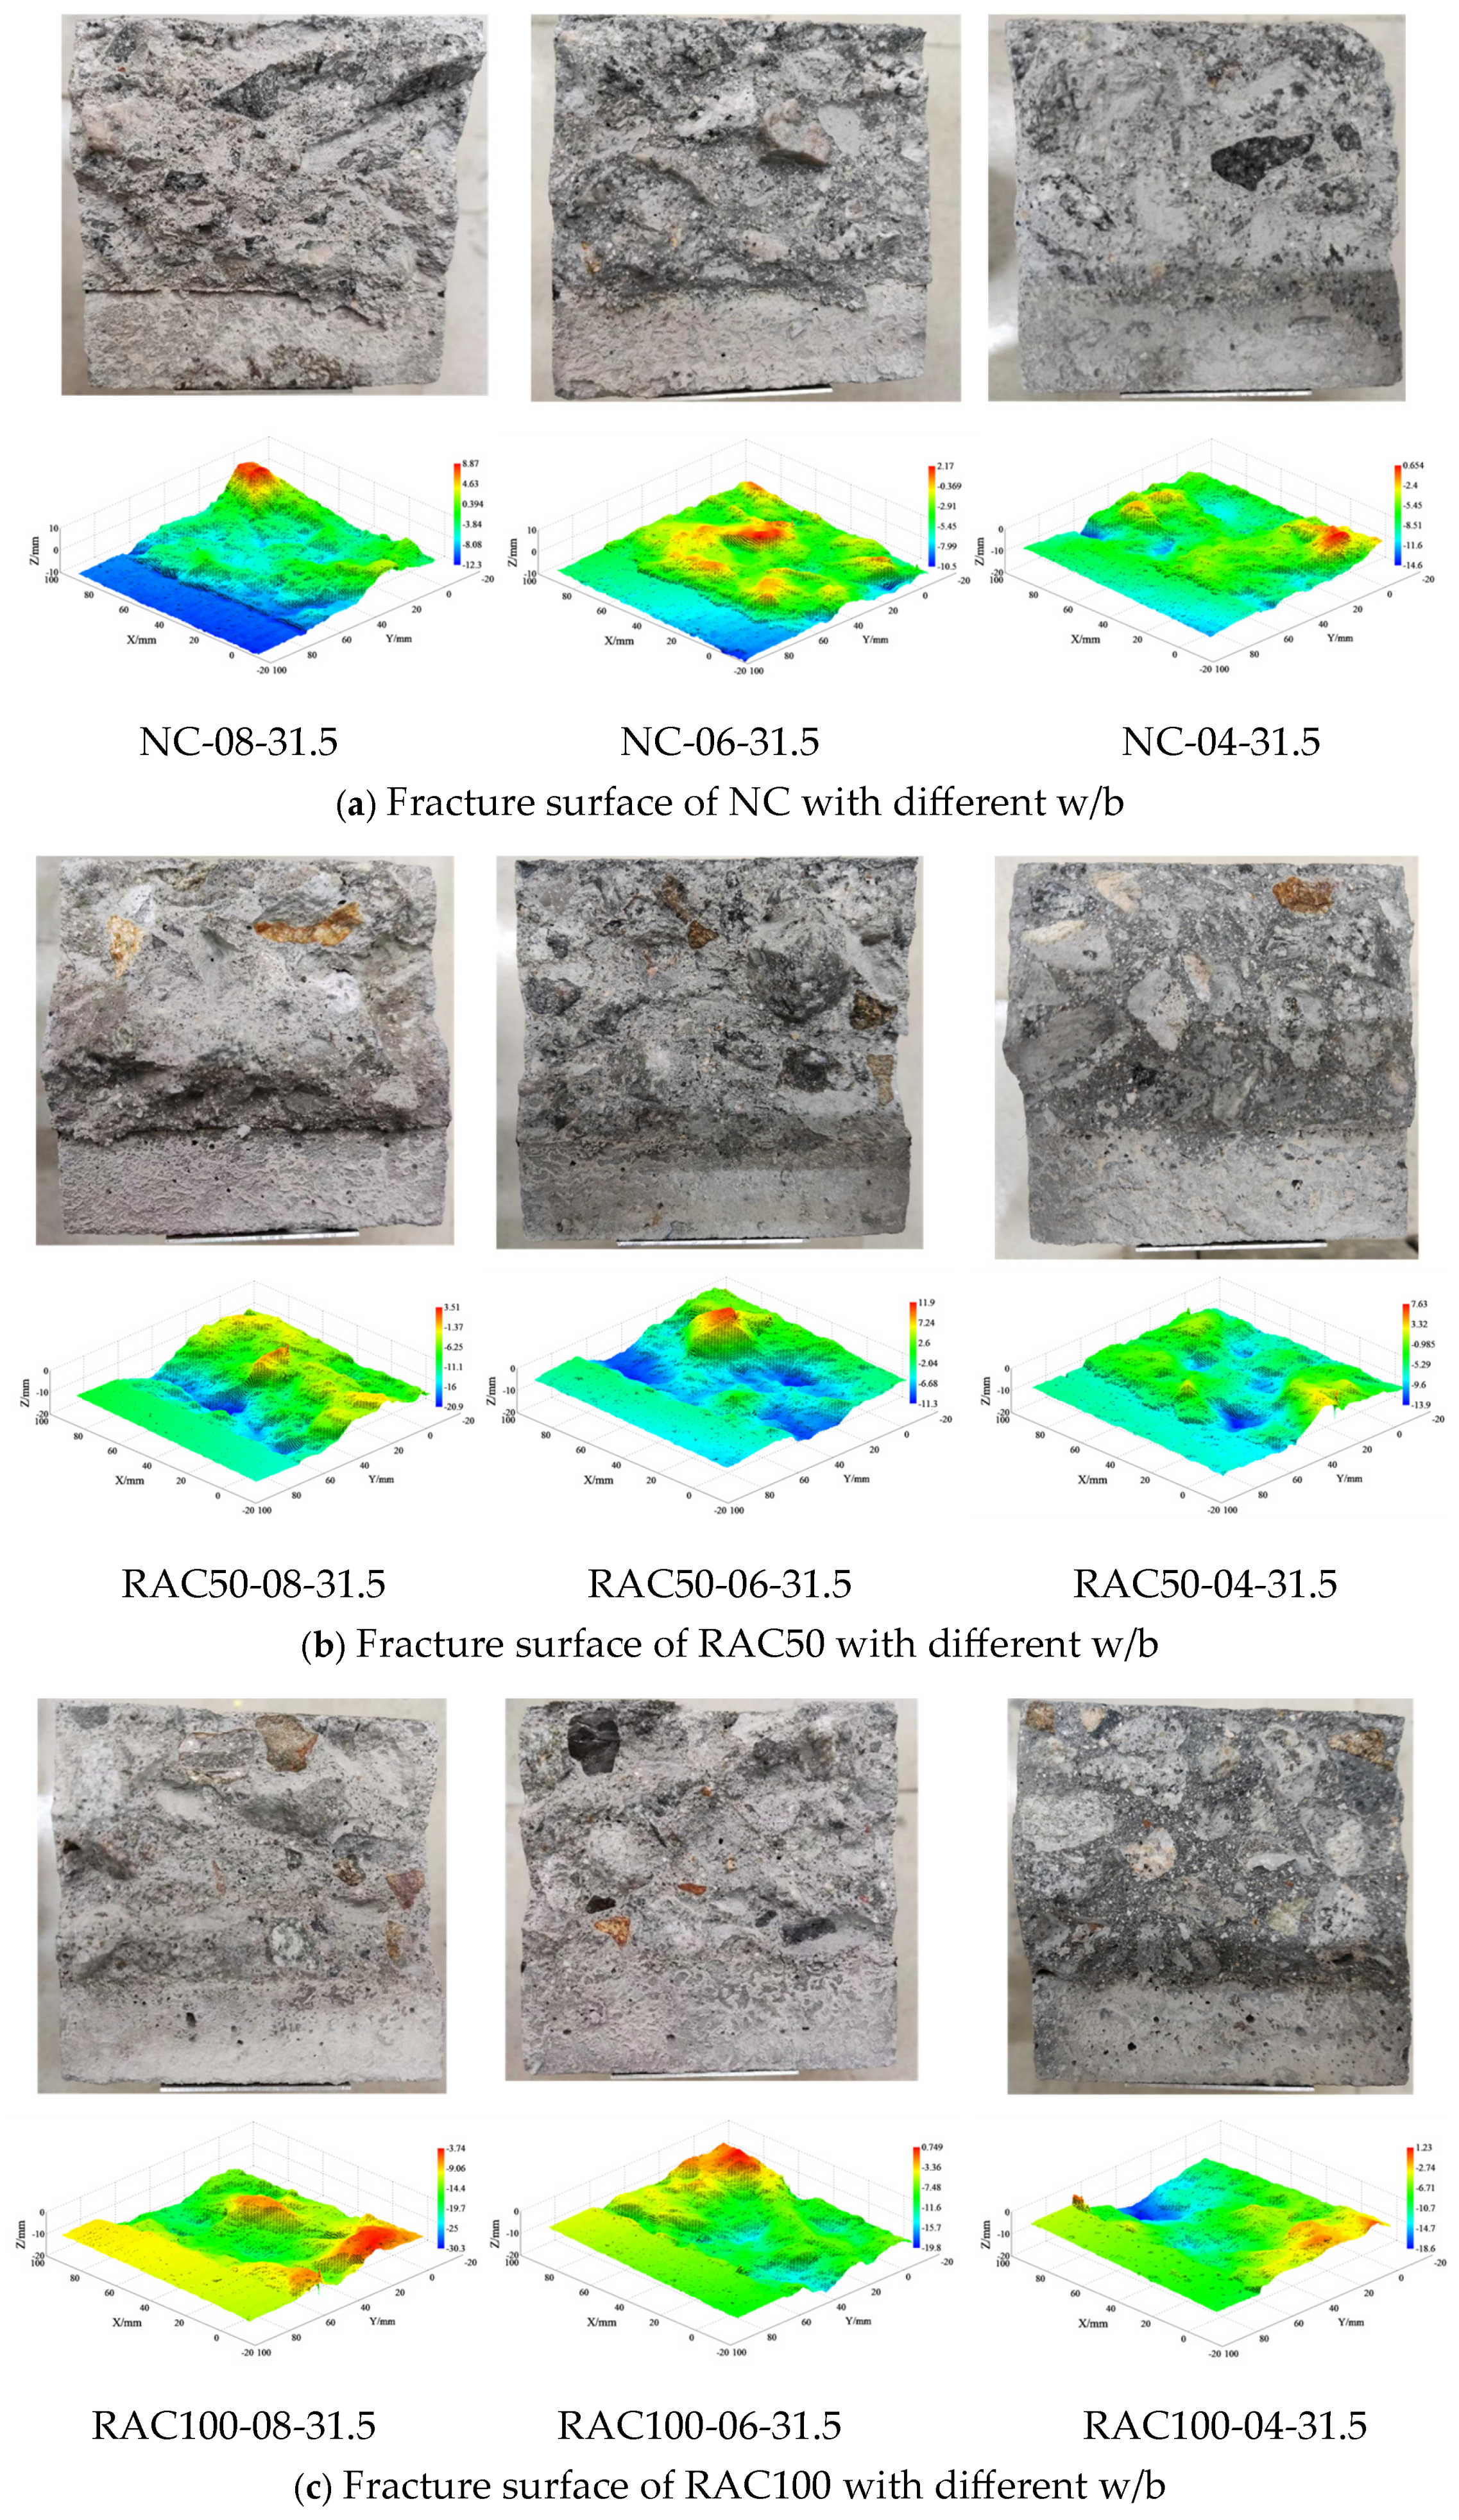
3.1. Roughness of the Fracture Surface

3.1.1. Effect of the Water-to-Binder (w/b) Ratio

Figure 9a,b respectively illustrate the bar charts depicting the surface roughness Rs and fractal dimension D of specimens with different w/b ratios. When the replacement rate of RA and the maximum aggregate size are consistent, both the surface roughness Rs and fractal dimension D decrease with the reduction in W/b. This may be because higher w/b ratios result in lower bond strength of the cement mortar, making cracks more likely to propagate along the edges of coarse aggregates, leading to more exposed aggregates and consequently rougher fracture surfaces. Conversely, lower w/b ratios increase the bond strength of the cement mortar, making cracks more likely to propagate through coarse aggregates, resulting in flatter fracture surfaces.
Figure 10a–c depict the fracture surface photographs and corresponding 3D reconstructions of NC, RAC50, and RAC100 with a maximum particle size of 31.5 mm, respectively. It can be observed that, regardless of the replacement ratio of RA, when w/b is 0.8, there is greater occurrence of aggregate debonding on the fracture surface, indicating that the fracture path mainly develops along the aggregate edges, while occurrences of aggregate fracture are relatively rare. Conversely, when the w/b ratio is 0.4, there is a significant increase in occurrences of aggregate fracture on the fracture surface, indicating that more cracks propagate through the aggregates. Moreover, from the corresponding 3D reconstructed surfaces, the changes in fracture surface are more pronounced at a w/b of 0.8 compared to 0.4, resulting in a rougher surface. This is mainly attributed to the reduction in strength of the hydration products in the interface at higher w/b ratios, making cracks more likely to originate and propagate in the interface region.
Figure 11a,b present the microstructures of NC and RAC observed through scanning electron microscopy (SEM), respectively. The old mortar refers to the mortar in the recycled aggregate, which can be seen in the part labeled as ‘old mortar’ in Figure 11b. Its structure is relatively rough, with some cracks and partially detached particles on the surface. The area labeled as ‘new mortar’ in the figure appears to have a more compact structure and shows characteristics of fresh cement hydration products, similar to the mortar shown in Figure 11a. The microstructure of NC mainly consists of natural aggregates (NA), cement mortar, and the interface transition zone (ITZ) between them. While the microstructure of RAC is relatively complex, with multiple interfaces: the ITZ between NA and old mortar (L1), the ITZ between old and new mortar (L2), and the ITZ between NA and new mortar (L3). This complexity results in the possibility of more intricate fracture paths in recycled aggregate concrete [35]. Figure 12a,b respectively present two potential fracture paths in NC and three potential fracture paths in RAC. In Figure 12a, path ① represents the dominant fracture path when a higher w/b ratio (with lower mortar performance) is used. In this case, cracks propagate along the interface, leading to higher surface roughness. Path ② in Figure 12a corresponds to the dominant fracture path when a lower w/b ratio (with higher mortar performance) is used. Here, cracks pass through the natural aggregate, resulting in a smoother fracture surface.
For Figure 12b, due to the presence of multiple interfaces in the microstructure of RAC, its fracture paths are more complex compared to NC. Path ① in Figure 12b represents the dominant fracture path when a higher w/b ratio (with lower performance of the new mortar) is used. In this case, the performance of the new mortar is lower than that of the old mortar in the recycled aggregates, and cracks propagate along the edges of the aggregates, leading to higher fracture surface roughness. Path ② in Figure 12b corresponds to the dominant fracture path when a moderate w/b ratio (with improved performance of the new mortar) is used. Here, the new mortar’s performance is slightly better than that of the old mortar, and cracks pass through the old mortar in the recycled aggregates, but when they encounter the natural aggregates, they propagate along their edges, resulting in a reduction in fracture surface roughness. Path ③ in Figure 12b represents the dominant fracture path when a lower w/b ratio (with higher performance of the new mortar) is used. In this case, the new mortar’s performance is significantly higher, and cracks pass through the aggregates, leading to a smoother fracture surface.
It is found that when w/b decreases from 0.8 to 0.4, with a maximum aggregate size of 16 mm and RA replacement rates of 0%, 50%, and 100%, the surface roughness Rs decreases by 5.96%, 4.02%, and 4.65%, respectively, while the fractal dimension D-2, l n A ( r ) / l n r , decreases by 26.31%, 12.89%, and 12.47%, respectively. Correspondingly, for a maximum aggregate size of 31.5 mm, the surface roughness decreases by 5.28%, 2.70%, and 4.14%, while l n A ( r ) / l n r decreases by 19.84%, 14.93%, and 7.22%, respectively. Clearly, the rate of change in l n A ( r ) / l n r is larger than that of the surface roughness Rs, indicating that the fractal dimension is more sensitive to surface morphology. This is mainly because the fractal dimension considers the size effect of surface complexity and more details and local features, while the surface roughness Rs mainly reflects the overall shape of the surface.
It is also observed that when the recycled aggregate replacement rate is 0%, the reduction in surface roughness with decreasing the w/b ratio is the most significant, indicating that its surface roughness is most sensitive to the w/b ratio. However, when the recycled aggregate content is 50% or 100%, the decrease in the surface roughness of recycled aggregate concrete is relatively low. This is mainly because recycled aggregate concrete includes both natural aggregates and recycled aggregates, with a complex microstructure containing multiple interfaces. The fracture path may include the three paths shown in Figure 12b, and the degree of curvature of the fracture path is also related to the proportion of old mortar of recycled coarse aggregates to natural aggregates.

3.1.2. Effect of the Replacement Ratio Ra

Figure 13a,b respectively illustrate the surface roughness Rs and fractal dimension D of concrete specimens with different recycled aggregate replacement rates (Ra). The results indicate that regardless of the particle size, when the w/b is 0.8 or 0.6, the surface roughness Rs and fractal dimension D decrease with an increase in the replacement rate of recycled aggregate. When the recycled aggregate replacement rate increases from 0% to 100% with a maximum aggregate size of 16 mm, the surface roughness Rs decreases by 2.81% and 2.02% for w/b ratios of 0.8 and 0.6, respectively, while the fractal dimension D-2, l n A ( r ) / l n r , decreases by 16.79% and 10.89%, respectively. Correspondingly, for a maximum aggregate size of 31.5 mm, the surface roughness Rs decreases by 2.92% and 1.94%, while l n A ( r ) / l n r decreases by 13.66% and 8.74%, respectively, for w/b ratios of 0.8 and 0.6. As shown in Figure 10, for w/b ratios of 0.8 and 0.6, when the recycled aggregate replacement rate is 0%, the predominant fracture path is along the edges of natural aggregates, leading to a significant surface depth difference. When the recycled aggregate replacement rate is 50%, the natural aggregates on the interface mainly undergo debonding, while some recycled aggregates fracture, resulting in a flatter surface. With an increase in the recycled aggregate content to 100%, more fractures occur in the recycled aggregates, resulting in a smoother variation in surface.
However, when the w/b ratio is 0.4, there is no significant trend in the variation of surface roughness with the recycled aggregate replacement rate, and the fractal dimension remains almost unchanged. Therefore, considering both roughness Rs and fractal dimension D, it can be inferred that the surface roughness does not vary significantly with the change in the recycled aggregate replacement rate at this w/b ratio, and all fracture surfaces for the w/b ratio of 0.4 are smoother. This is mainly because at a lower w/b ratio, the strength of the cement mortar exceeds that of most aggregates, and the crack path penetrates NA and RA, as shown in Figure 12b, resulting in relatively small surface roughness.

3.1.3. Effect of the Maximum Aggregate Particle Size

The results in Figure 13 also indicate that, for a w/b ratio of 0.8, when the replacement rate of recycled aggregate is 0%, 50%, and 100%, the roughness Rs of the specimens with a maximum aggregate size of 31.5 mm is respectively 0.27%, 0.47%, and 0.16% higher than that of specimens with a maximum aggregate size of 16 mm. Meanwhile, the fractal dimension D-2, l n A ( r ) / l n r , is 0.66%, 10.09%, and 4.27% higher, respectively. Similarly, for a w/b ratio of 0.6, the Rs values are 0.14%, 1.7%, and 0.22% higher, and l n A ( r ) / l n r are 8.1%, 10.69%, and 10.27% higher, respectively. In the case of a w/b ratio of 0.4, the Rs values are 0.99%, 1.81%, and 0.68% higher, and l n A ( r ) / l n r are 8.68%, 7.94%, and 9.68% higher, respectively.
Overall, regardless of the w/b ratio or the replacement rate of recycled aggregate, the surface roughness of specimens with a maximum aggregate size of 31.5 mm is slightly greater than that of specimens with 16 mm, as shown in Figure 14. This is primarily because the interface changes generated when cracks pass through the edges of larger aggregates are more pronounced than those generated when passing through the edges of smaller aggregates [36].

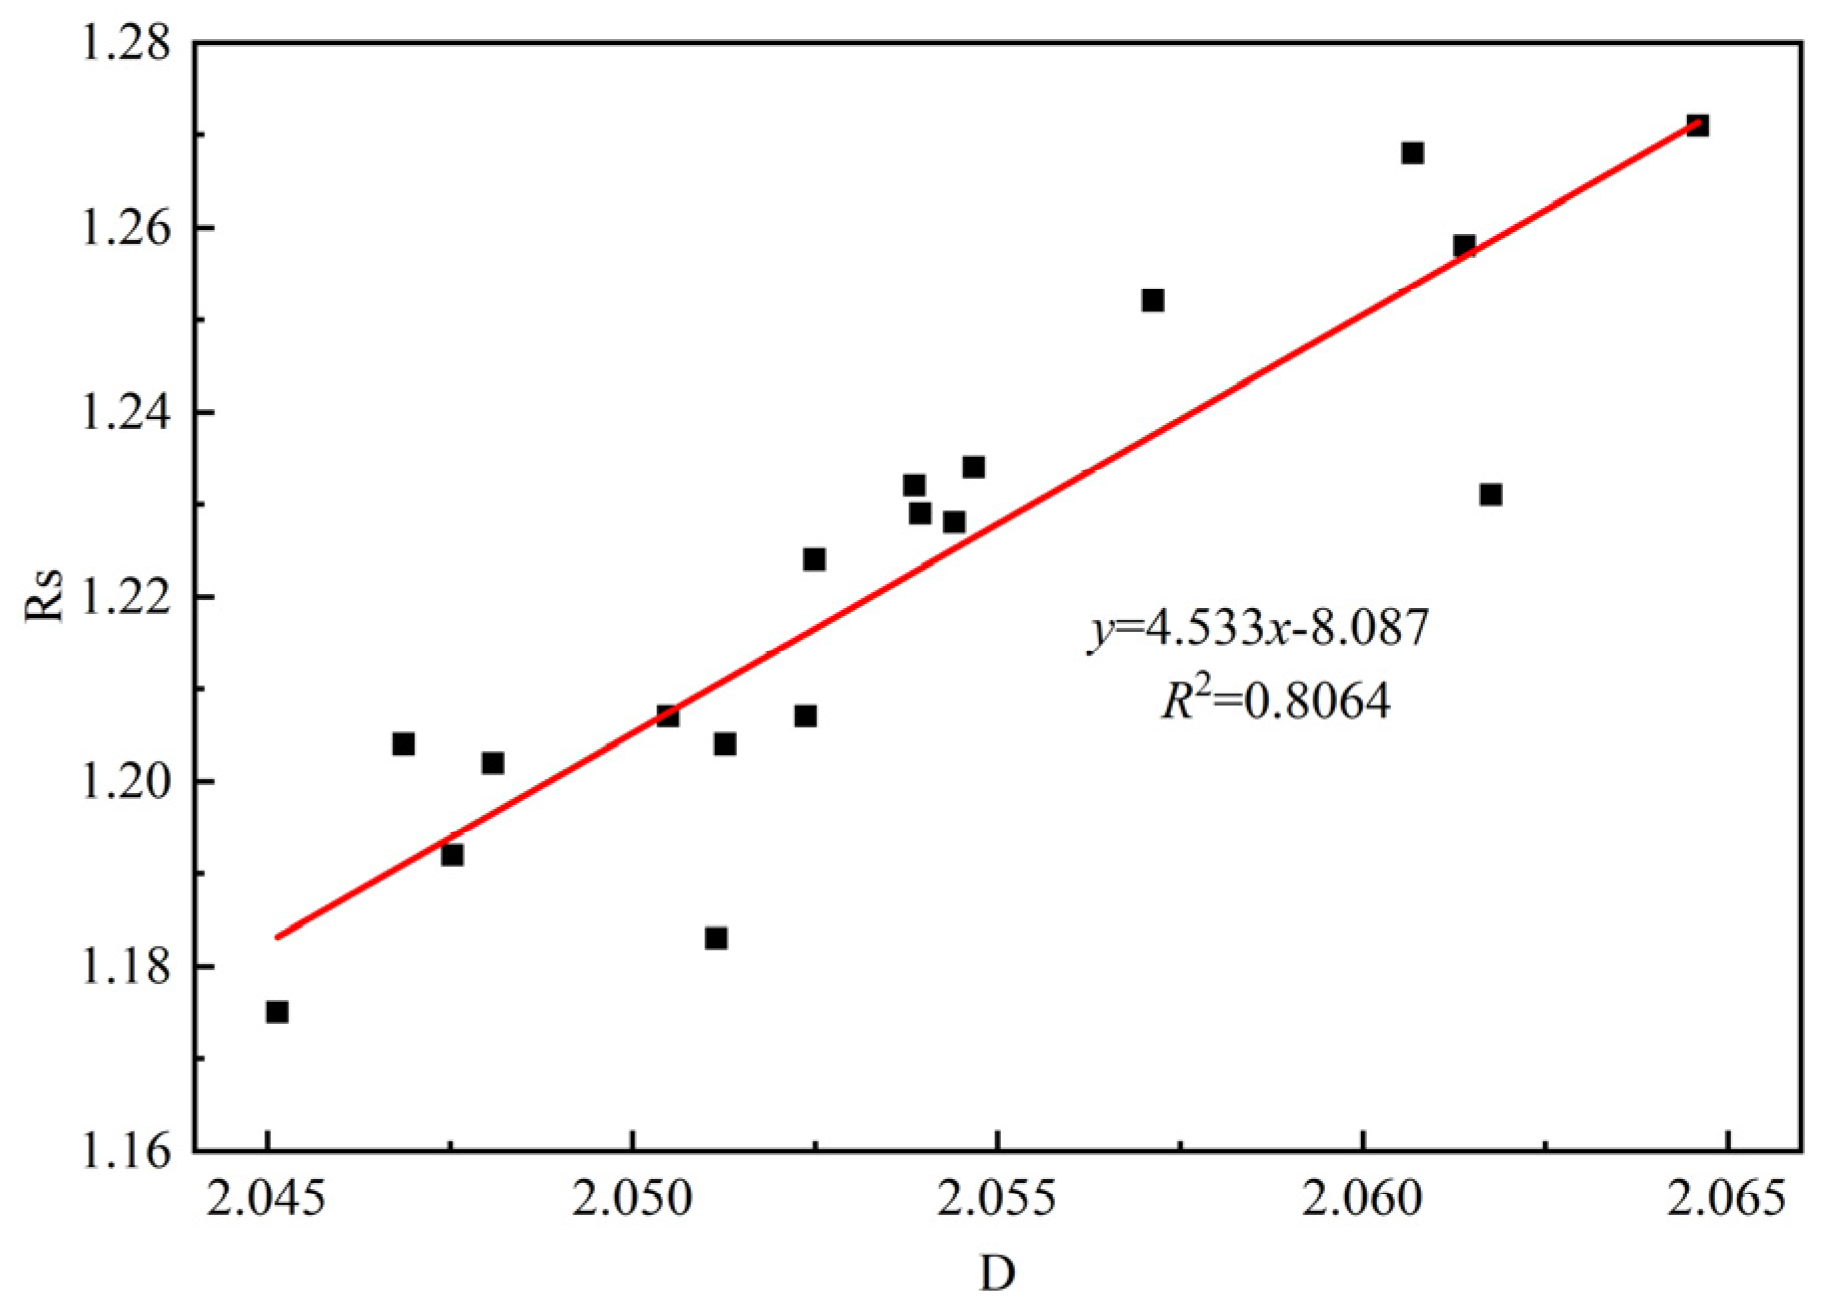
3.1.4. Relationship Between Rs and D

Figure 15 shows the relationship between the fracture surface roughness and fractal dimension for recycled concrete. It indicates that there is a positive correlation between the roughness Rs and the fractal dimension D of the recycled aggregate concrete fracture surface. This is because an increase in fractal dimension D indicates greater irregularity and complexity of the concrete fracture surface, leading to an increase in roughness Rs. This relationship provides a basis for analyzing concrete fracture surface metrics.

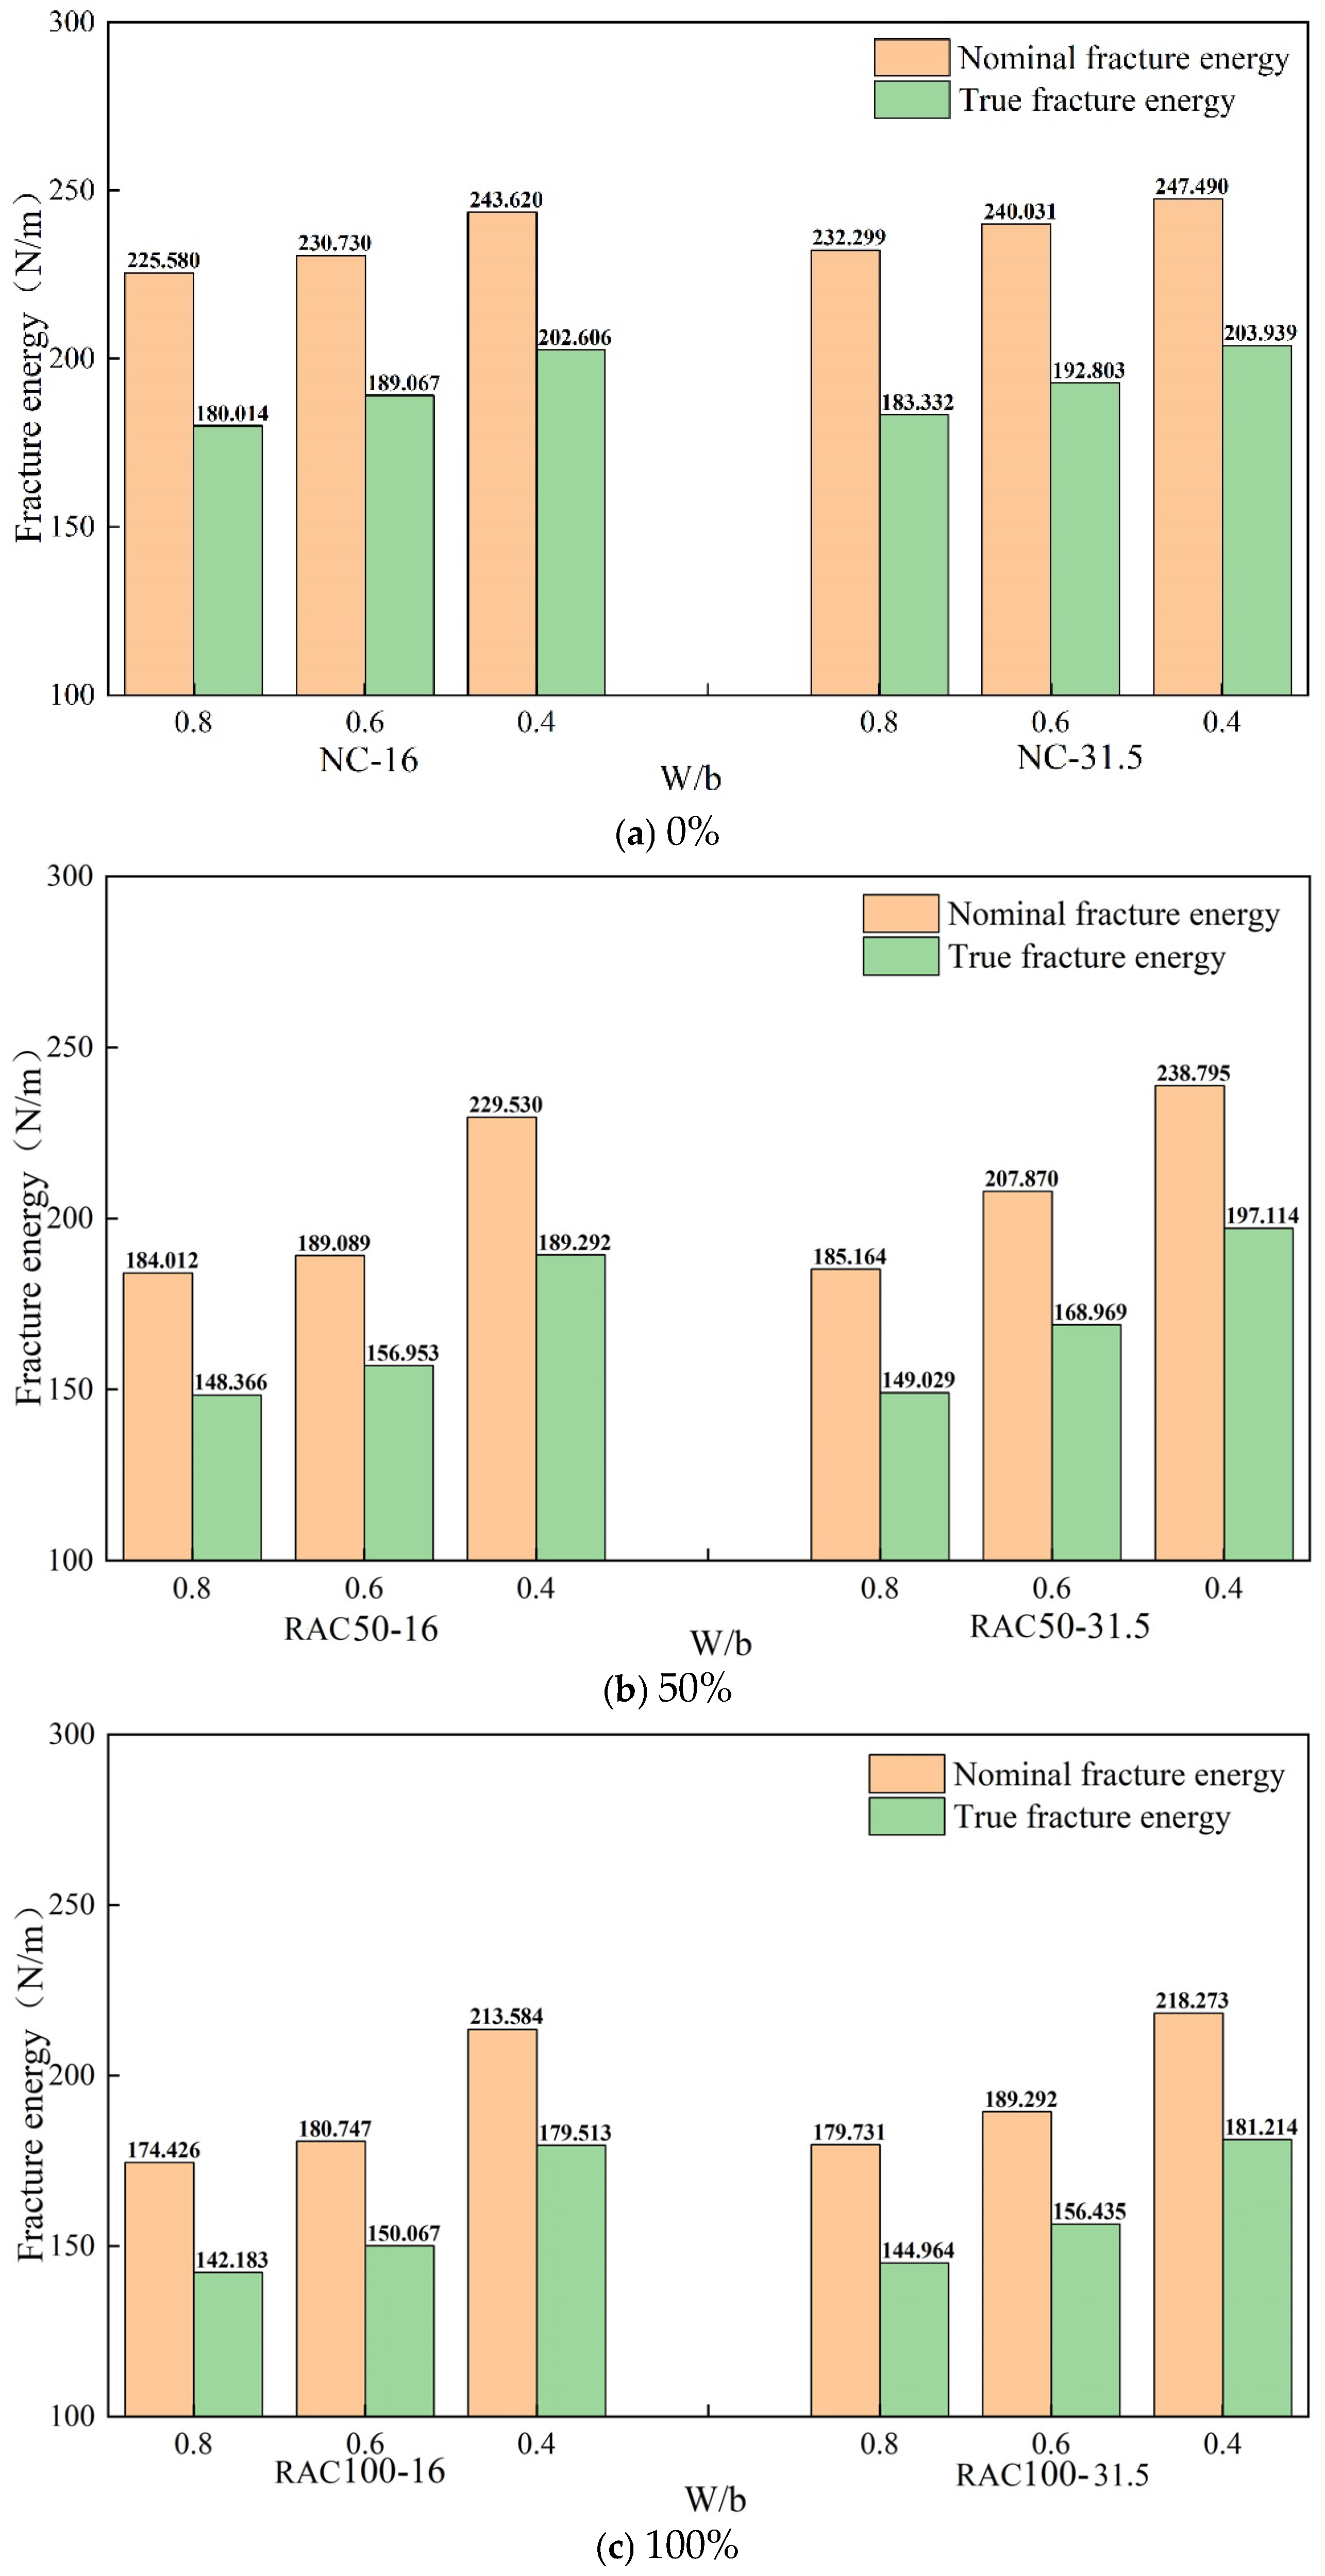
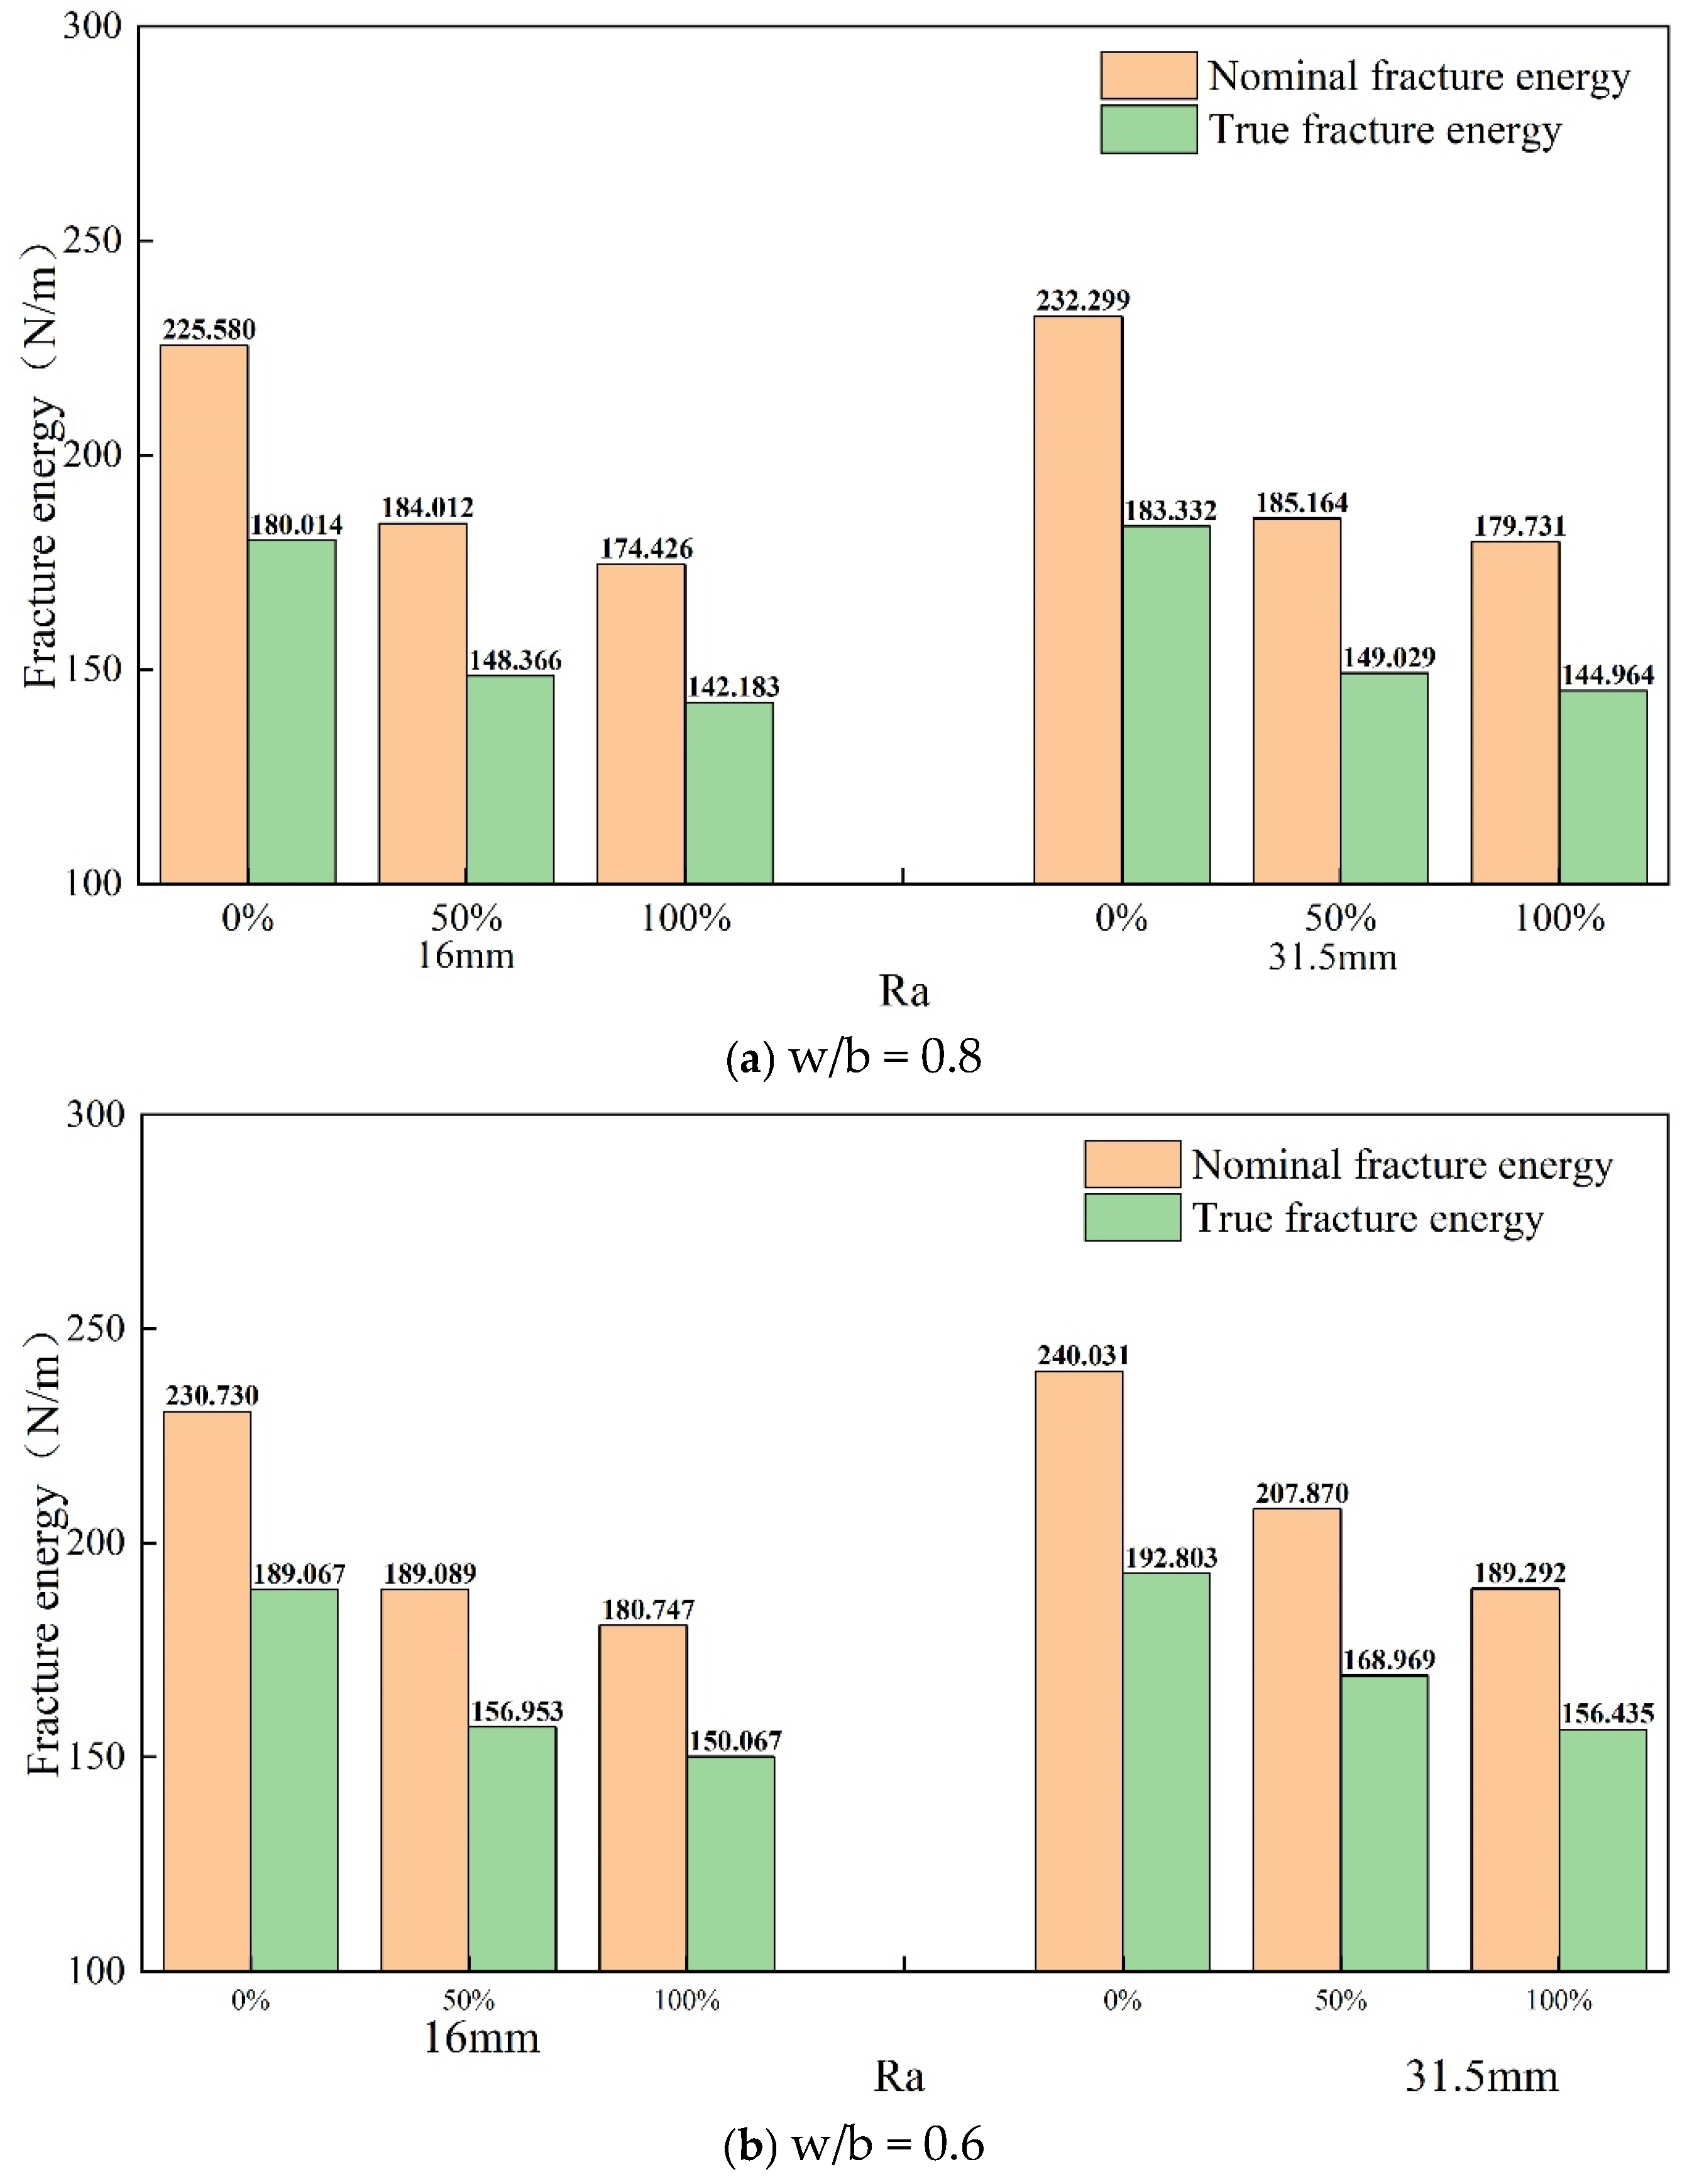
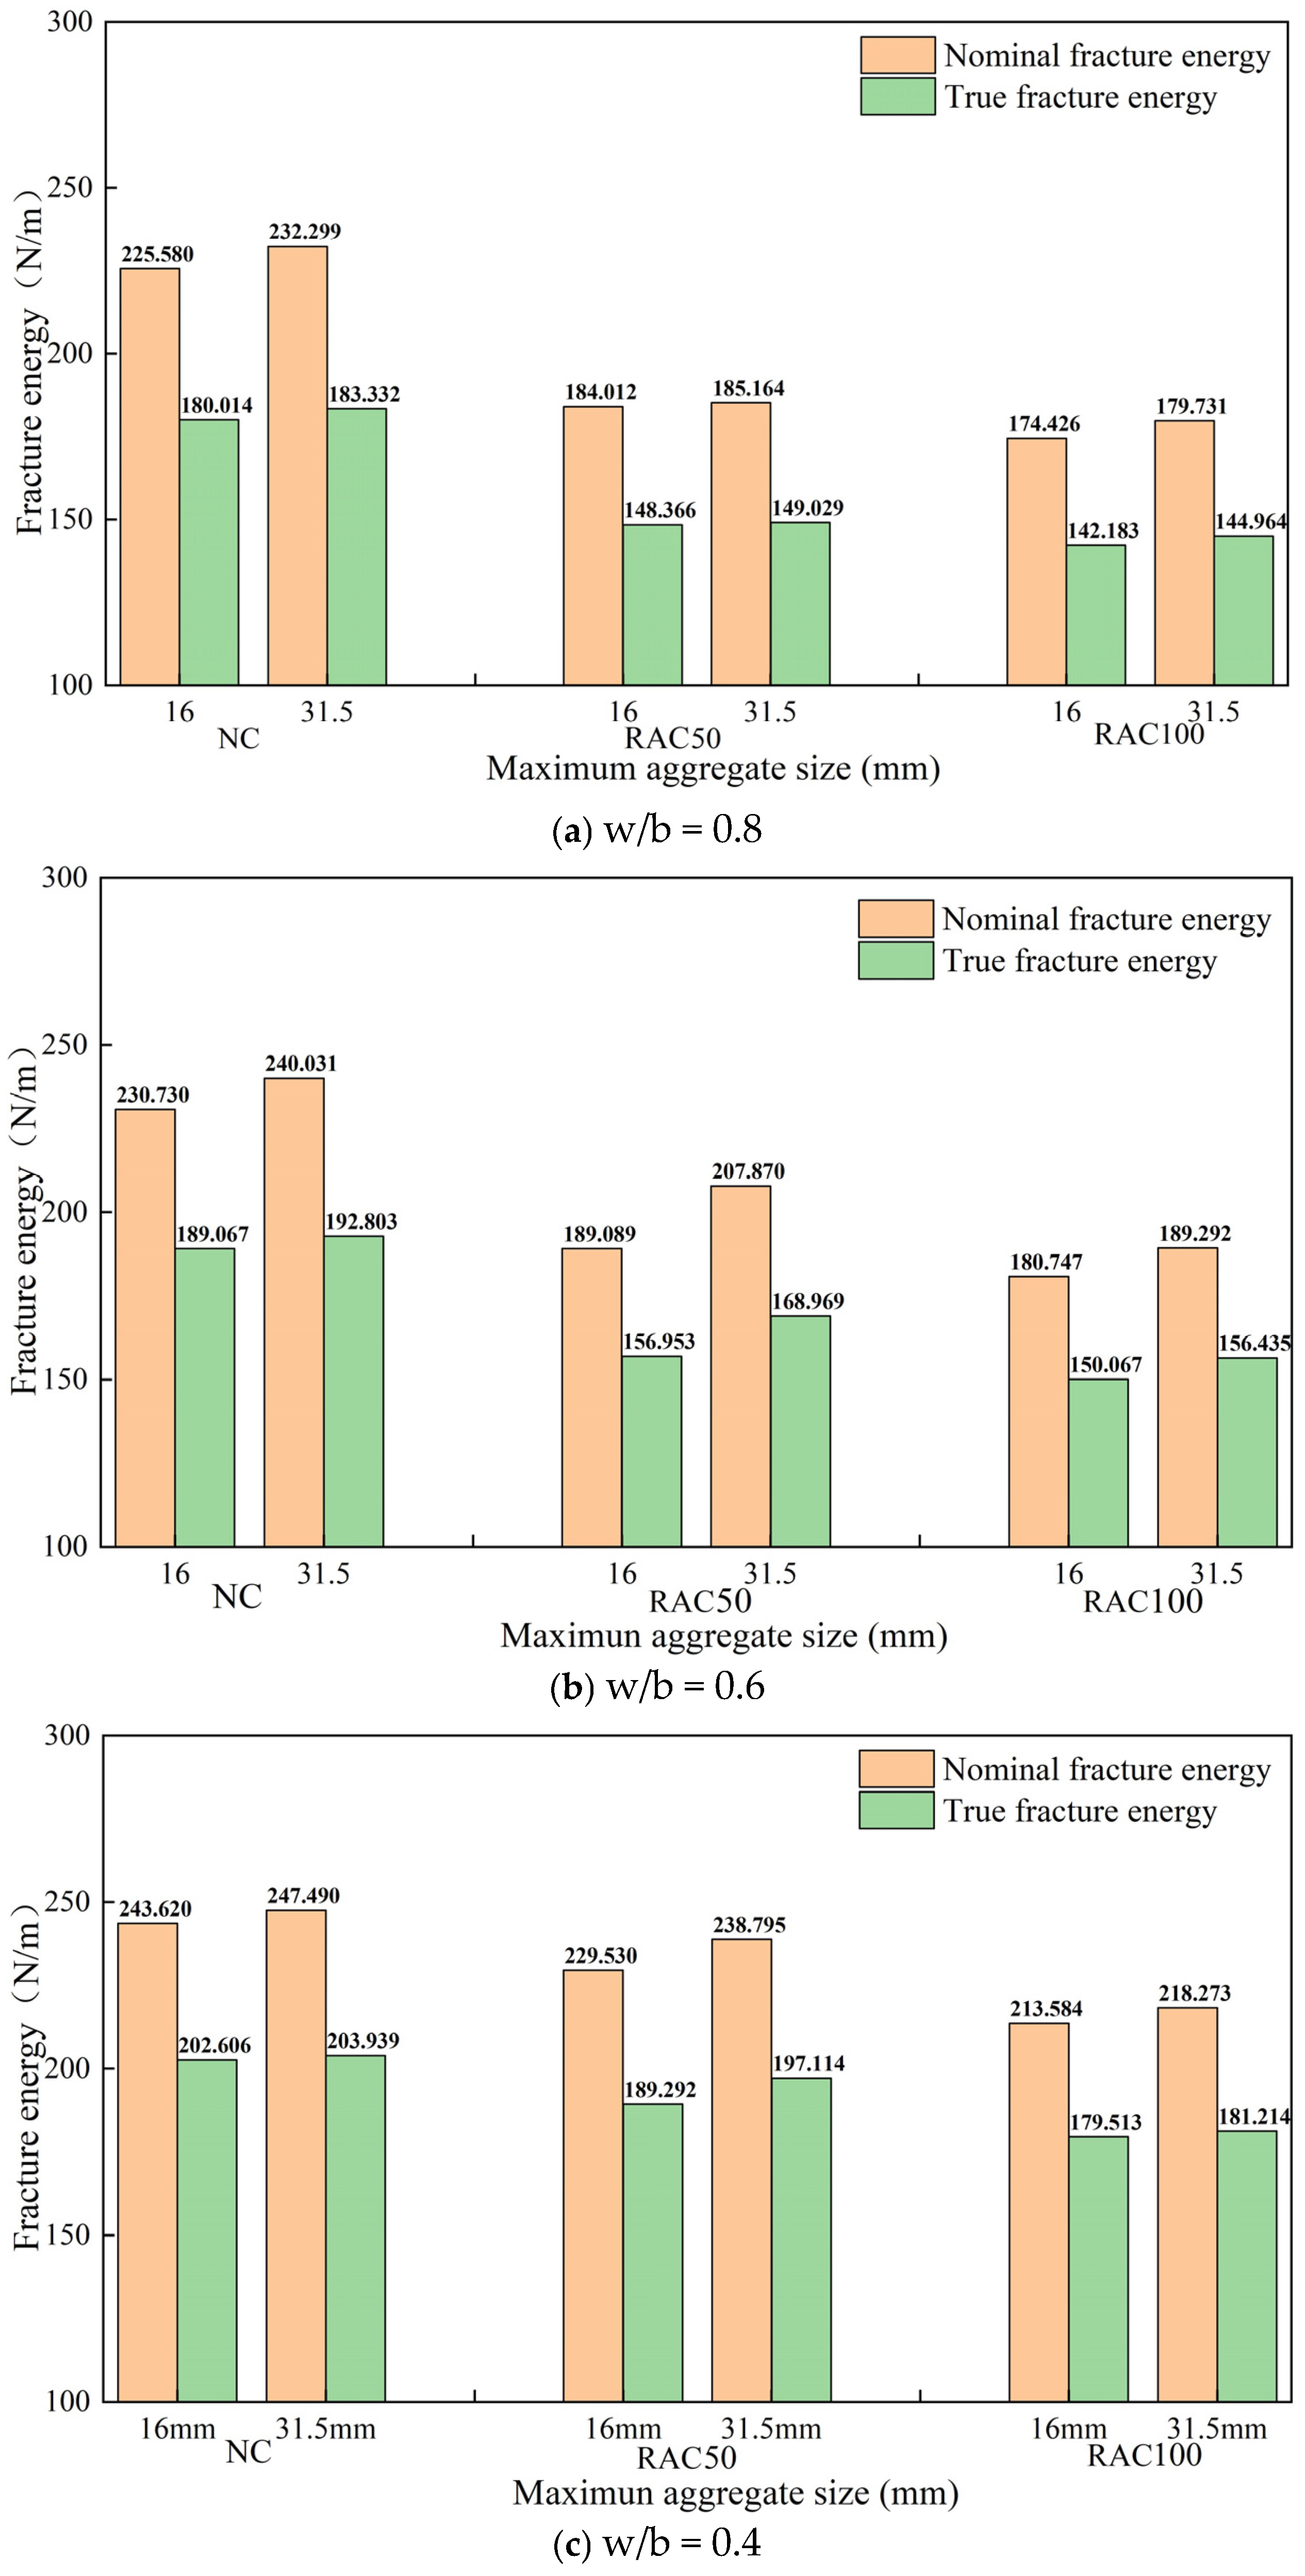
3.2. Fracture Energy

3.2.1. Comparison

Figure 16 illustrates the fracture energy obtained from various calculation methods for all recycled aggregate concretes. It is evident from the result that the true fracture energy is consistently lower than the nominal fracture energy. Specifically, the true fracture energy obtained from method [20] is approximately 11% to 17% lower than the nominal fracture energy, while method [8] yields true fracture energy values approximately 28% to 36% lower than the nominal fracture energy, while the true fracture energy obtained from this study is approximately 16% to 21% lower than the nominal fracture energy. Additionally, the results obtained in this study fall within the range between those obtained from method [20] and method [8]. Furthermore, the trends for different methods are consistent, indicating a certain degree of reliability in the results obtained from the proposed method.

3.2.2. Effect of w/b Ratio

Figure 17a–c illustrate the effect of the w/b ratio on the fracture energy of concrete specimens with recycled aggregate replacement rates of 0%, 50%, and 100%, respectively. It is evident that under the condition of a 0% replacement rate of recycled aggregates, the nominal fracture energy values for a maximum aggregate size of 16 mm at w/b ratios of 0.8, 0.6, and 0.4 are 225.58 N/m, 230.73 N/m, and 243.62 N/m, respectively, and the true fracture energy values are 180.014 N/m, 189.067 N/m, and 202.606 N/m, respectively. Compared to the nominal fracture energy, the true fracture energy decreased by 20.20%, 18.06%, and 16.84%, respectively. For recycled aggregate concrete with a maximum aggregate size of 31.5 mm, the nominal fracture energy values are 232.299 N/m, 240.031 N/m, and 247.49 N/m, respectively, and the true fracture energy values are 183.332 N/m, 192.803 N/m, and 203.939 N/m, respectively. Compared to the nominal fracture energy, the true fracture energy decreased by 21.08%, 19.68%, and 17.60%, respectively.
In the case of recycled concrete with a 50% replacement rate of recycled aggregates, when the w/b ratio is 0.8, 0.6, and 0.4, the nominal fracture energy for a maximum aggregate size of 16 mm is 184.012 N/m, 189.089 N/m, and 229.53 N/m, respectively, and the true fracture energy is 148.366 N/m, 156.953 N/m, and 189.292 N/m, respectively. Compared to the nominal fracture energy, the true fracture energy decreased by 19.37%, 17.00%, and 17.53%, respectively. For recycled aggregate concrete with a maximum aggregate size of 31.5 mm, the nominal fracture energy is 185.164 N/m, 207.87 N/m, and 238.795 N/m, respectively, and the true fracture energy is 149.029 N/m, 168.969 N/m, and 197.114 N/m, respectively. Compared to the nominal fracture energy, the true fracture energy decreased by 19.52%, 18.71%, and 17.45%, respectively.
In the case of recycled aggregate concrete with a 100% replacement rate of recycled aggregates, when the w/b ratio is 0.8, 0.6, and 0.4, the nominal fracture energy for a maximum aggregate size of 16 mm is 174.426 N/m, 180.747 N/m, and 213.584 N/m, respectively, while the true fracture energy is 142.183 N/m, 150.067 N/m, and 179.513 N/m, respectively. Compared to the nominal fracture energy, the true fracture energy decreased by 18.49%, 16.97%, and 15.95%, respectively. For recycled aggregate concrete with a maximum aggregate size of 31.5 mm, the nominal fracture energy is 179.731 N/m, 189.292 N/m, and 218.273 N/m, respectively, while the true fracture energy is 144.964 N/m, 156.435 N/m, and 181.214 N/m, respectively. Compared to the nominal fracture energy, the true fracture energy decreased by 19.34%, 17.36%, and 16.98%, respectively.
Since the roughness of the fracture surface in recycled aggregate concrete ranges between 1.1 and 1.3, the true fracture energy is consistently less than the nominal fracture energy. With the same replacement rate of recycled aggregates and maximum aggregate size, the reduction rate of true fracture energy compared to nominal fracture energy decreases as the w/b ratio decreases. This is primarily because the surface roughness of the fracture decreases with a lower w/b ratio. When the w/b ratio is the same, regardless of the aggregate size, the reduction rate of true fracture energy decreases as the content of recycled aggregates increases, mainly due to the decrease in surface roughness with higher recycled aggregate content. Additionally, regardless of the replacement rate of recycled aggregates, the reduction rate of true fracture energy is higher for larger aggregates compared to smaller aggregates, primarily due to the greater surface roughness associated with larger aggregates.
The results also indicate that both nominal and true fracture energies increase as the w/b ratio decreases. This is because a lower w/b ratio promotes more complete hydration reactions in the concrete, reducing porosity and thereby enhancing its mechanical properties. Additionally, a lower w/b ratio increases the concentration of cement paste, which improves the bond strength between the cement paste and the aggregates. This enhanced bonding capacity can prevent the propagation of cracks, thus improving the fracture toughness of the concrete. Analysis of the fracture surface roughness also shows that when the w/b ratio is lower, the surface roughness is relatively lower as well. This indicates that more aggregates have fractured on the surface, requiring more energy for the overall material to fracture.
When the w/b ratio is reduced from 0.8 to 0.4, for a maximum aggregate size of 16 mm, the nominal fracture energy for recycled aggregate replacement rates of 0%, 50%, and 100% increases by 7.4%, 19.83%, and 18.33%, respectively, while the true fracture energy increases by 11.15%, 21.62%, and 20.8%, respectively. For a maximum aggregate size of 31.5 mm, the nominal fracture energy for recycled aggregate replacement rates of 0%, 50%, and 100% increases by 6.14%, 22.46%, and 17.66%, respectively, and the true fracture energy increases by 10.10%, 24.39%, and 20%, respectively. Clearly, regardless of the maximum aggregate size and the recycled aggregate replacement rate, the reduction in the w/b ratio has a greater impact on the true fracture energy than on the nominal fracture energy. This is primarily because the reduction in the w/b ratio not only increases the total energy consumed during the fracture but also decreases the actual area (or roughness) of the fracture surface.

3.2.3. Effect of the Replacement Ratio of RA

Figure 18a–c illustrate the impact of the recycled aggregate replacement rate on the fracture energy for different w/b ratios of 0.8, 0.6, and 0.4. It is evident that regardless of the w/b ratio and the maximum aggregate size, both the nominal fracture energy and true fracture energy decrease as the replacement rate of recycled aggregate increases. This is mainly because recycled aggregates have lower strength and toughness compared to natural aggregates, leading to a reduction in the tensile and compressive strength of the concrete. Additionally, the microstructure of recycled aggregate concrete is relatively complex, with multiple interfaces that complicate the fracture path and hinder energy transfer, thus reducing fracture energy.
When the replacement rate of recycled aggregate increases from 0% to 100%, for a maximum aggregate size of 16 mm, the nominal fracture energy decreases by 22.68%, 21.66%, and 12.33%, and the true fracture energy decreases by 21.02%, 20.63%, and 11.40% for w/b ratios of 0.8, 0.6, and 0.4, respectively. For a maximum aggregate size of 31.5 mm, the nominal fracture energy decreases by 22.63%, 21.14%, and 11.81%, and the true fracture energy decreases by 20.93%, 18.86%, and 11.14% for w/b ratios of 0.8, 0.6, and 0.4, respectively.
These results show that, regardless of the maximum aggregate size and w/b ratio, the impact of the replacement rate of recycled aggregate on the true fracture energy is smaller than that on the nominal fracture energy. This is primarily because although the incorporation of recycled aggregate reduces the total energy at fracture, it also decreases the roughness of the fracture surface. Moreover, the reduction in the w/b ratio significantly enhances the fracture energy of recycled aggregate concrete more than that of normal concrete. This might be due to the multiple interfaces present in recycled aggregates. When the w/b ratio is lowered, the bond strength of the cement mortar increases, helping to reduce the detachment between recycled aggregates and the cement mortar. Consequently, the fracture path more frequently traverses through the recycled aggregates, resulting in a more pronounced enhancement in the fracture energy of recycled aggregate concrete.

3.2.4. Effect of the Maximum Aggregate Particle Size

Figure 19a–c present the influence of maximum aggregate size on fracture energy for different w/b ratios and RA replacement rates. It is evident that for concretes with a w/b ratio of 0.8, when the recycled aggregate replacement rates are 0%, 50%, and 100%, the nominal fracture energy for specimens with a maximum aggregate size of 31.5 mm compared to 16 mm increases by 2.89%, 0.62%, and 2.95%, respectively, while the true fracture energy increases by 1.81%, 0.44%, and 1.92%, respectively. For a w/b ratio of 0.6 and replacement rates of 0%, 50%, and 100%, the nominal fracture energy increases by 3.87%, 9.03%, and 4.51%, while the true fracture energy increases by 1.94%, 7.11%, and 4.07%, respectively. For a w/b ratio of 0.4 and replacement rates of 0%, 50%, and 100%, the nominal fracture energy increases by 1.56%, 3.88%, and 2.15%, while the true fracture energy increases by 0.65%, 3.97%, and 0.94%, respectively.
These results indicate that, regardless of the w/b ratio or recycled aggregate content, specimens with larger maximum aggregate sizes exhibit slightly higher fracture energies. This can be attributed to several factors [37,38]: larger aggregates create more complex crack paths, requiring more energy for crack propagation; they provide stronger internal support and connectivity within the concrete structure; they reduce stress concentration by having smaller surface areas for bonding with the cement paste; and they increase the roughness and actual area of the fracture surface, thereby requiring more energy for fracture.
When the maximum aggregate size increases from 16 mm to 31.5 mm, the growth rate of true fracture energy is lower than that of nominal fracture energy. This suggests that true fracture energy, which considers the actual fracture surface area, increases with surface roughness. Larger aggregates create a rougher surface, spreading the energy over a larger area, leading to a smaller increase in true fracture energy compared to nominal fracture energy. Nominal fracture energy, being a simplified measure, does not account for detailed surface characteristics, thus showing a more significant increase as aggregate size increases due to the higher energy needed to initiate and propagate cracks. In summary, larger aggregates increase the overall energy required to create and propagate cracks (nominal fracture energy), but the energy per unit of the fractured surface area (true fracture energy) increases less due to the roughness and complexity introduced by the larger aggregates.

4. Conclusions

By using fringe projection technology, this paper investigates the effects of the recycled aggregate replacement rate, water-to-binder (w/b) ratio, and maximum aggregate size on the fracture surface roughness and fracture energy of recycled aggregate concrete. The following key conclusions were drawn:
1 It is established that a decrease in the water-to-binder ratio leads to a significant reduction in the surface roughness (Rs) and fractal dimension (D) of recycled aggregate concrete. This is attributed to the increased bond strength of the cement mortar at lower w/b ratios, which causes cracks to propagate through the aggregates rather than along their edges, resulting in smoother fracture surfaces.
2 It is systematically shown that under higher w/b ratios (0.8 and 0.6), both the surface roughness and fractal dimension decrease as the recycled aggregate replacement rate increases. However, at a w/b ratio of 0.4, these parameters are not significantly affected by the recycled aggregate replacement rate, indicating that the strength of the cement mortar at this lower ratio surpasses that of most aggregates, causing cracks to propagate through the aggregates themselves, leading to minimal changes in surface roughness.
3 The study quantifies that across various w/b ratios and recycled aggregate replacement rates, larger aggregates result in slightly higher surface roughness compared to smaller aggregates. This is due to more pronounced interface changes around larger aggregates, leading to more complex and rougher fracture paths.
4 It is explicitly demonstrated that true fracture energy is consistently lower than nominal fracture energy, with the difference becoming more pronounced with an increasing recycled aggregate replacement rate and aggregate size. Both nominal and true fracture energies increase as the w/b ratio decreases, due to more complete hydration reactions and reduced porosity at lower w/b ratios, which enhance the mechanical properties of the concrete.
These findings not only enhance the scientific understanding of the fracture mechanisms in recycled aggregate concrete, but also provide valuable insights for optimizing mix design by examining the effects of the water-to-binder ratio and aggregate size on fracture behavior. This supports the practical application of recycled aggregate concrete in engineering, promotes the sustainable use of recycled aggregates in construction, and helps reduce the consumption of natural resources.

Author Contributions

Conceptualization, M.D.; Methodology, M.D. and C.H.; Software, W.H.; Validation, C.H., X.W., J.D. and J.C.; Investigation, W.H., C.H. and X.W.; Resources, J.D.; Writing—original draft, M.D., W.H. and J.C.; Writing—review & editing, M.D. and J.C.; Funding acquisition, J.C. All authors have read and agreed to the published version of the manuscript.

Funding

This research was supported by the Natural Science Foundation of Guangdong Province (Grant Nos. 2022A1515010769 and 2024A1515012817). The Article Processing Charge (APC) was funded by the Guangzhou Basic and Applied Basic Research Foundation (Grant No. 2023A04J1618).

Data Availability Statement

The data presented in this study are available on request from the corresponding author.

Conflicts of Interest

The authors declare no conflict of interest.

References

  1. Xiao, J.; Tang, Y.; Chen, H.; Zhang, H.; Xia, B. Effects of recycled aggregate combinations and recycled powder contents on fracture behavior of fully recycled aggregate concrete. J. Clean. Prod. 2022, 366, 132895. [Google Scholar] [CrossRef]
  2. Zhang, K.; Zhang, Q.; Lin, W.; Ou, J. Material and structural properties of recycled coarse aggregate concrete made with seawater and sea-sand: A review. J. Build. Eng. 2024, 87, 109042. [Google Scholar] [CrossRef]
  3. Ficker, T.; Martišek, D. Digital fracture surfaces and their roughness analysis: Applications to cement-based materials. Cem. Concr. Res. 2012, 42, 827–833. [Google Scholar] [CrossRef]
  4. Ma, J.; Wang, T.; Li, G.; Zhan, Q.; Wu, D.; Chang, Y.; Xue, Y.; Zhang, Y.; Zuo, J. Concrete surface roughness measurement method based on edge detection. Vis. Comput. 2023, 40, 1553–1564. [Google Scholar] [CrossRef]
  5. Yan, A. Influence of concrete composition on the characterization of fracture surface. Cem. Concr. Compos. 2003, 25, 153–157. [Google Scholar] [CrossRef]
  6. Yan, A. Effect of fracture path on the fracture energy of high-strength concrete. Cem. Concr. Res. 2001, 31, 1601–1606. [Google Scholar] [CrossRef]
  7. Zhang, H.; Wei, D.M. Fractal effect and anisotropic constitutive model for concrete. Theor. Appl. Fract. Mech. 2009, 51, 167–173. [Google Scholar] [CrossRef]
  8. Issa, M.A.; Issa, M.A.; Islam, M.S.; Chudnovsky, A. Fractal dimension––A measure of fracture roughness and toughness of concrete. Eng. Fract. Mech. 2003, 70, 125–137. [Google Scholar] [CrossRef]
  9. Tirassa, M.; Fernández Ruiz, M.; Muttoni, A. Influence of cracking and rough surface properties on the transfer of forces in cracked concrete. Eng. Struct. 2020, 225, 111138. [Google Scholar] [CrossRef]
  10. Santos, P.M.D.; Júlio, E.N.B.S. A state-of-the-art review on roughness quantification methods for concrete surfaces. Constr. Build. Mater. 2013, 38, 912–923. [Google Scholar] [CrossRef]
  11. Tonietto, L.; Gonzaga, L., Jr.; Veronez, M.R.; Kazmierczak, C.S.; Arnold, D.C.M.; Costa, C.A.D. New Method for Evaluating Surface Roughness Parameters Acquired by Laser Scanning. Sci. Rep. 2019, 9, 15038. [Google Scholar] [CrossRef] [PubMed]
  12. He, Y.; Zhang, X.; Zhang, Y.; Zhou, Y. Effects of particle characteristics of lightweight aggregate on mechanical properties of lightweight aggregate concrete. Constr. Build. Mater. 2014, 72, 270–282. [Google Scholar] [CrossRef]
  13. Dai, M.; Wang, X.; Cheng, C.; Chen, Z.; Deng, J. Efficient Evaluation of Concrete Fracture Surface Roughness Using Fringe Projection Technology. Materials 2023, 16, 4430. [Google Scholar] [CrossRef] [PubMed]
  14. Grigoriadis, K. Use of laser interferometry for measuring concrete substrate roughness in patch repairs. Autom. Constr. 2016, 64, 27–35. [Google Scholar] [CrossRef]
  15. Khalilpour, S.; BaniAsad, E.; Dehestani, M. A review on concrete fracture energy and effective parameters. Cem. Concr. Res. 2019, 120, 294–321. [Google Scholar] [CrossRef]
  16. Peng, J. Comparison of regression analysis for estimation of initial and total fracture energy of concrete. Multiscale Multidiscip. Model. Exp. Des. 2023, 7, 173–190. [Google Scholar] [CrossRef]
  17. Beygi, M.H.A.; Kazemi, M.T.; Nikbin, I.M.; Vaseghi Amiri, J.; Rabbanifar, S.; Rahmani, E. The influence of coarse aggregate size and volume on the fracture behavior and brittleness of self-compacting concrete. Cem. Concr. Res. 2014, 66, 75–90. [Google Scholar] [CrossRef]
  18. Guo, Y.; Chen, X.; Liu, J.; Chen, T.; Wu, J. Effect of interface roughness on fracture energy and fracture process zone of rock-concrete specimens. Fatigue Fract. Eng. Mater. Struct. 2022, 46, 574–589. [Google Scholar] [CrossRef]
  19. Wu, K.-R.; Yan, A.; Liu, J.-y.; Zhang, D.; Yao, W. Reconstruction and analysis of 3-D profile of fracture surface of concrete. Cem. Concr. Res. 2000, 30, 981–987. [Google Scholar] [CrossRef]
  20. Yan, A.; Wu, K.-r.; Yao, W.; Zhang, D. Study on the Actual Fracture Energy of Concrete Materials. J. Build. Mater. 2001, 4, 346–350. [Google Scholar]
  21. Mechtcherine, V. Fracture mechanical behavior of concrete and the condition of its fracture surface. Cem. Concr. Res. 2009, 39, 620–628. [Google Scholar] [CrossRef]
  22. Liu, J.; Wu, K.; Zhang, D. Application of Image Analysis Technology in the Study of Concrete Fracture Surface. China Concr. Cem. Prod. 1999, 2, 6–9. [Google Scholar]
  23. Xiao, J.; Li, H.; Yuan, J. Application of Digital Image Technique in Behavior Analysis of Recycled Aggregate Concrete. J. Build. Mater. 2014, 17, 459–464. [Google Scholar]
  24. An, X.-z.; Ma, X.-n.; Shen, Y.-l. Effect of Replacement Rate of Brick-containing Recycled Coarse Aggregates on Fracture Concrete Performance. Sci. Technol. Eng. 2020, 20, 5751–5756. [Google Scholar]
  25. Lu, Z.; Liu, G.; Wu, Y.; Dai, M.; Jiang, M.; Xie, J. Recycled aggregate seawater–sea sand concrete and its durability after immersion in seawater. J. Build. Eng. 2023, 65, 105780. [Google Scholar] [CrossRef]
  26. Lee, K.M.; Park, J.H. A numerical model for elastic modulus of concrete considering interfacial transition zone. Cem. Concr. Res. 2008, 38, 396–402. [Google Scholar] [CrossRef]
  27. Otsuki, N.; Miyazato, S.; Yodsudjai, W. Influence of recycled aggregate on interfacial transition zone, strength, chloride penetration and carbonation of concrete. J. Mater. Civ. Eng. 2003, 15, 443–451. [Google Scholar] [CrossRef]
  28. Muhammad, F.; Harun, M.; Ahmed, A.; Kabir, N.; Khalid, H.R.; Hanif, A. Influence of bonded mortar on recycled aggregate concrete properties: A review. Constr. Build. Mater. 2024, 432, 136564. [Google Scholar] [CrossRef]
  29. Luo, B.; Wang, D.; Mohamed, E. The process of optimizing the interfacial transition zone in ultra-high performance recycled aggregate concrete through immersion in a water glass solution. Mater. Lett. 2023, 338, 134056. [Google Scholar] [CrossRef]
  30. Sun, C.; Chen, Q.; Xiao, J.; Ge, W. Study on aggregate interlock behavior of pre-cracked recycled aggregate concrete without stirrups. J. Build. Eng. 2021, 39, 102257. [Google Scholar] [CrossRef]
  31. Dai, M.; Yang, F.; Liu, C.; He, X. A dual-frequency fringe projection three-dimensional shape measurement system using a DLP 3D projector. Opt. Commun. 2017, 382, 294–301. [Google Scholar] [CrossRef]
  32. GBT 50081-2019; Code for Design of Concrete Structures. China Standards Press: Beijing, China, 2019.
  33. DLT 5332-2005; Standard for Inspection and Evaluation of Highway Engineering Construction Quality. China Architecture & Building Press: Beijing, China, 2005.
  34. Dabbaghi, F.; Fallahnejad, H.; Nasrollahpour, S.; Dehestani, M.; Yousefpour, H. Evaluation of fracture energy, toughness, brittleness, and fracture process zone properties for lightweight concrete exposed to high temperatures. Theor. Appl. Fract. Mech. 2021, 116, 103088. [Google Scholar] [CrossRef]
  35. Shang, X.; Yang, J.; Wang, S.; Zhang, M. Fractal analysis of 2D and 3D mesocracks in recycled aggregate concrete using X-ray computed tomography images. J. Clean. Prod. 2021, 304, 127083. [Google Scholar] [CrossRef]
  36. Ben Ftima, M.; Lemery, J. Asymptotic fracture energy for nonlinear simulation of mass concrete structures. Constr. Build. Mater. 2021, 271, 121542. [Google Scholar] [CrossRef]
  37. Zhou, F.P.; Barr, B.I.G.; Lydon, F.D. Fracture properties of high strength concrete with varying silica fume content and aggregates. Cem. Concr. Res. 1995, 25, 543–552. [Google Scholar] [CrossRef]
  38. Kumar, C.N.S.; Krishna, P.V.V.S.S.R.; Kumar, D.R. Effect of fiber and aggregate size on mode-I fracture parameters of high strength concrete. Adv. Concr. Constr. 2017, 5, 613–624. [Google Scholar]
Figure 1. Raw materials.
Fractalfract 09 00159 g001
Figure 2. Specimen curing site.
Fractalfract 09 00159 g002
Figure 3. Cube compressive strength test: (a) the specimens; (b) loading.
Fractalfract 09 00159 g003
Figure 4. Cube splitting tensile test: (a) the specimens; (b) the bracket; (c) loading.
Fractalfract 09 00159 g004
Figure 5. The fracture test: (a) dimensions; (b) specimens; (c) loading.
Fractalfract 09 00159 g005aFractalfract 09 00159 g005b
Figure 6. Microscopic test: (a) SEM; (b) ion sputtering machine; (c) specimen after gold coating.
Fractalfract 09 00159 g006
Figure 7. Concrete surface measurement.
Fractalfract 09 00159 g007aFractalfract 09 00159 g007b
Figure 8. Standard cylinder measurement.
Fractalfract 09 00159 g008
Figure 9. Roughness and fractal dimension for different w/b ratios.
Fractalfract 09 00159 g009
Figure 10. Fracture surface morphology for the maximin aggregate size of 31.5 mm.
Fractalfract 09 00159 g010
Figure 11. Microstructure of concrete obtained from SEM: (a) NC; (b) RAC.
Fractalfract 09 00159 g011
Figure 12. Fracture paths in (a) NC; (b) RAC.
Fractalfract 09 00159 g012
Figure 13. Roughness and fractal dimension for different Ra: (a) roughness (b) fractal dimension.
Fractalfract 09 00159 g013aFractalfract 09 00159 g013b
Figure 14. Fracture surface morphology for different maximin aggregate sizes.
Fractalfract 09 00159 g014
Figure 15. The relationship between surface roughness and fractal dimension.
Fractalfract 09 00159 g015
Figure 16. Fracture energy obtained from different methods [8,20].
Fractalfract 09 00159 g016
Figure 17. Effect of w/b ratio on the true fracture energy for different RA contents.
Fractalfract 09 00159 g017
Figure 18. Effect of recycled aggregate replacement rate on the true fracture energy for different w/b ratios.
Fractalfract 09 00159 g018aFractalfract 09 00159 g018b
Figure 19. Effect of maximum aggregate size on the fracture energy for different w/b ratios.
Fractalfract 09 00159 g019
Table 1. Specimen parameters.
Concrete
Number
SpecimenW/BCement (kg)Sand (kg)Water (kg)RA (kg)NA (kg)
1NC-08-160.80287.04753.33229.6301130
2RAC50-08-16565565
3RAC100-08-1611300
4NC-08-31.50.80287.04753.33229.6301130
5RAC50-08-31.5565565
6RAC100-08-31.511300
7NC-06-160.60378.97663.65227.3801130
8RAC50-06-16565565
9RAC100-06-1611300
10NC-06-31.50.60378.97663.65227.3801130
11RAC50-06-31.5565565
12RAC100-06-31.511300
13NC-04-160.40561.22484.29224.4901130
14RAC50-04-16565565
15RAC100-04-1611300
16NC-04-31.50.40561.22484.29224.4901130
17RAC50-04-31.5565565
18RAC100-04-31.511300
Note: NC-0m-f represents the normal concrete with W/B 0.m and maximum aggregate particle size f. RACn-0m-f represents the corresponding recycled aggregate concrete with RA content n%.
Table 2. Dimensions and quantities of the test specimens.
ExperimentDimension (mm)GroupNumber of Each GroupTotal Number
Compressive strength test100 × 100 × 10018354
Split tensile strength test150 × 150 × 15018354
Fracture test100 × 100 × 40018590
Table 3. Compressive strength (MPa).
Specimenw/b Ratio
0.80.60.4
NC-1630.67437.52248.688
RAC50-1625.91234.45548.279
RAC100-1624.91232.70146.408
NC-31.535.4145.42657.046
RAC50-31.534.02843.23154.911
RAC100-31.531.89241.66350.78
Table 4. Split tensile strength (MPa).
Specimenw/b Ratio
0.80.60.4
NC-162.6733.4044.676
RAC50-162.6593.3154.608
RAC100-162.6363.2243.942
NC-31.53.3134.0144.804
RAC50-31.53.223.9934.684
RAC100-31.53.0743.7354.178
Disclaimer/Publisher’s Note: The statements, opinions and data contained in all publications are solely those of the individual author(s) and contributor(s) and not of MDPI and/or the editor(s). MDPI and/or the editor(s) disclaim responsibility for any injury to people or property resulting from any ideas, methods, instructions or products referred to in the content.

