1. Introduction
Malware software, commonly known as malware, is used by cyber criminals. They use it to obtain information about individuals and their activities. They use it to track activities on the Internet and obtain sensitive information about accounts as well. Malware software has defense systems, which can be hidden from antivirus programs [
1].
The most common form of malware is adware. In the present era, marketing is essential. Today, the Internet and smartphones are usually used for marketing. We see many advertisements when we use a mobile application or visit a website. There are many possibilities for adware attacks in such contexts. Cyber criminals can obtain information about whether or not they use an app [
2]. Much work has been devoted to studying the behavior of malware, and many methods have been developed to protect individuals and computers from it. For example, machine learning processes have been used [
2] for this purpose, and malware behavior has been compared using machine learning and deep learning techniques [
3].
A general taxonomy of malware is presented in [
4]. Malware belongs to different categories, such as the following viruses, viruses, trojans, spyware (adware, keylogger, trackware, cookie, riskware, sniffer), ransomware, scareware, diallerware, bots (spamware, reverse shell), rootkit (bootkit), backdoor, browser hijackers, and downloaders. Authors have also described malware concealment techniques such as encryption, packing, obfuscation, polymorphism, and metamorphism. Three methods of malware analysis—static, dynamic, and hybrid—can be used to detect it.
Malware propagation resembles transmitting infectious diseases in humans and other living bodies. It is a form of ’Mathematical Epidemiology’; the most commonly used model is the ‘Susceptible, Infected, and Recovered model’ (see [
5] and the references therein). Much work has focused on classical calculus in this area. Now, researchers are working on fractional calculus. Fractional calculus is the generalization of the ordinary derivative and integral concepts [
6,
7,
8].
The initially introduced Riemann–Liouville and Caputo fractional derivatives had some kernel difficulties. So, to overcome these difficulties, the Caputo and Fabrizio fractional derivative was introduced (2015), with the kernel in the form of an exponential function. Atangana and Baleanu replaced this the following year with the Mittag–Leffler function [
9,
10]. Over time, the new concept of “fractal” opened a vast field for researchers. The concepts of differentiation and integration were introduced [
11] to solve differential equations using three kinds of kernels, i.e., power law, exponential decay, and Mittag–Leffler.
This has attracted many researchers in science, technology, engineering, etc. Significant work was conducted on mathematical modeling in the form of the fractal–fractional derivative [
12]. Different models have been constructed for different diseases. Their solutions were found using concepts from pure mathematics [
13,
14,
15,
16,
17] and fractal theory [
18,
19], along with numerical simulations with different kernels [
20,
21,
22,
23,
24,
25].
Motivated by the application of fractal–fractional theory in many diseases, we decided to treat malware propagation using the concept of fractal–fractional derivatives. We considered the malware propagation ’Susceptible, Infected and Removed’ model, as it is a basic model used in epidemiology. Investigating different malware propagation models, we decided to consider the model in [
26]. The authors described this model as involving two main aspects: the variable infection rate and the time delay factor. These two variables capture real-world malware outbreaks’ irregular, nonlinear dynamics, such as their varying infection rates due to different network topologies, system vulnerabilities, or user behaviors. They aimed to develop an accurate model that can be used to predict malware propagation in computer networks. As fractional derivatives introduce a novel way to model these nonlinear, irregular, and scale-invariant behaviors, these derivatives enable a better representation of complex time-dependent processes.
Classical models often represent the propagation of malware in networked systems by assuming constant infection rates and immediate spread. However, in real-world networks, malware spread is influenced by factors such as varying infection rates, delays in propagation, and complex network topologies. This research introduces a novel modeling approach based on fractal–fractional derivatives, which accounts for the nonlinear, time-varying dynamics of malware propagation. The scientific problem is the lack of accurate and realistic models for malware propagation that can account for the complexity, variability, and delays in real-world scenarios. Our model addresses this gap using advanced mathematical techniques to understand these dynamics better and predict them.
Our goal was to investigate the behavior of this model under changes in fractal orders and fractional orders with an exponential decay kernel. We wanted to find a solution that can give us better estimates of the parameters to prevent malware propagation. We also wanted to explore its physical significance. This model is different because it involves a nonlinear function to represent an undetermined dynamical parameter that varies due to the sensitivity of the infection rate. We wanted to improve the accuracy of malware spread predictions, optimize security responses, and design more resilient defense strategies.
This paper is structured as follows: laying the groundwork of our research,
Section 2 provides essential definitions and theorems. In
Section 3, we present a classical mathematical model, and
Section 4, we describe a fractal–fractional mathematical model. The model is converted into a fixed-point problem in
Section 5. The existence, uniqueness, and stability of the solution are established in
Section 6,
Section 7 and
Section 8.
Section 9 constitutes a computational algorithm using a two-point Lagrangian interpolation formula due to its accuracy, convergence, and simplicity. MATLAB R2016a was used to implement the codes for arbitrary fractal and fractional orders and key parameters.
Section 10 discusses the simulation results, and in
Section 11, we conclude this paper.
3. Description of Model
Now, we describe the mathematical model using ordinary differential equations. Feng et al. [
26] presented a model of malware propagation on the Internet for the states known as susceptible, infected, and removed/recovered, with the assumption that the total number of nodes in the network at time
is
. It was also assumed that all nodes change as time passes. In the model, the susceptible state indicates that a node can be easily exploited; the infected state mean that during the infected period, it remains infectious and can also infect its neighboring nodes; and the removed/recovered state means that an installed detection tool helps identify and remove malware or a node was installed with a software patch to eliminate node vulnerability to malware.
The symbols and meanings of the variables and parameters of the model (
1) are given in the following
Table 1.
Considering the definitions of the states in Feng et al. [
26], we present the model as ordinary differential equations as
is the infection rate, which depends on many factors discussed in this paper, so we defined
, where
is a nonlinear function of ℵ. Again, we assume
, which is an undetermined dynamical operator. To determine this, the authors defined
, where
is used to adjust the sensitivity of the infection rate to the number of infected nodes
[
26].
Definition 10. The disease-free equilibrium point for the model is Definition 11. Now, we find the threshold of the system.
Take disease classAssumeandthen,andMoreover,Evaluating and at the disease-free equilibrium point, we obtainandThe threshold of the system isat point E. 6. Existence of Solution
For existence, we prove the following theorem based on Theorem 1 [
24].
Theorem 4. Suppose that ∃, , and satisfy the following three conditions:
(): and
with and
(): and , and
(): with for every n, .
Then, we say that has a fixed point, and a solution of the FF model exists.
Proof. Take
so that
for each
Consider
Utilizing
, we deduce
Now, applying the definition of the norm,
After simplification using the beta function and value of
, we have
We can write this as
Furthermore, we define
with the condition
for , which is zero otherwise;
then, for each
, we can write Equation (
12) as
Equation (
13) implies that
is a
-
-
Now, we assume that , such that .
and
Now applying
, we have
This implies
is
-
(*)
Also, from (), we see that for some in , , implies . (**)
Next, we take such that as and for all n.
Applying the definition of , we obtain and () implies
Hence, for all n. (***)
The statements (*), (**), and (***), satisfy the conditions of Theorem 1. Hence, has a fixed point. Thus, is a solution of the ff model. □
Now, we define the following theorem based on Theorem 2 to establish the existence of the solution to the ff model.
Theorem 5. Let Ξ be a Banach space, be a bounded and closed set in Ξ, and be an open set in with . Then, there exists a compact, continuous operator F from with conditions () and (), which satisfies one of the two conditions:
(a) G has a fixed point in ,
or
(b) there exist and such that ,
where
(): suppose , and there exist and , where is an increasing function satisfying condition ∀ and ;
(): Ii , then ∃ a number s such that , where
Then, a solution to our model exists, provided that the conditions above are satisfied.
Proof. Take
as
and
for some positive
.
To show that is compact on , we prove that is uniformly bounded and equicontinuous.
Since is continuous, this implies is continuous.
Now, for
in
, we have
Using (
), we have
After simplification of the integral and applying the value of
, we obtain
Now, applying the norm, we obtain the following:
This shows that
is uniformly bounded.
Now, for
such that
and
arbitrarily. If we take
, then
Now,
implies
.
This proves that is equicontinuous. Hence, it is proved that is compact.
As
satisfies the basic conditions of Theorem 5, it satisfies one. For this purpose, using (
), we construct
where
is defined above. Hence, we can write
Assume
and
, where
. For
and
, we have
which is impossible. So, we can say that the first condition
possesses a fixed point in
. □
7. Uniqueness
In this section, we prove uniqueness with the theorems using the Lipschitz condition.
Theorem 6. Let and we suppose that
,
then (where
for some .
Moreover, , where , and , then are Lipschitz functions with values:
where .
Proof. Consider
for each
; then, we have
Hence,
is Lipschitz with respect to
with
.
Taking
for each
, we have
Hence,
is Lipschitz with respect to ℵ with
.
Considering
for each
, we take
Hence,
is Lipschitz with respect to
with
. □
Using Theorem 6, we prove Theorem 7 to examine the uniqueness of the solution.
Theorem 7.
If for some and
where ; then, the ff model has a unique solution if for .
Proof. Suppose there exist two solutions,
and
, concerning condition 1 for the ff model. Then, we can write
Take
Since
is taken with respect to
and
, after integration and simplification,
Hence, using the previous results,
As
, which is possible when
. Thus,
.
Similarly, we take
as
is related to
ℵ and
. So, after integration and simplification, we have
Hence, we obtain
As
, the above condition holds when
. This implies that
.
Similarly, consider
Take
since
is taken with respect to
and
. After integration and simplification, we have
By using the previous results,
As
, the possibility is
. Thus,
. That is,
. Hence, the solution is unique. □
9. Numerical Algorithm
For a numerical scheme of our fractal−fractional model, we proceed as many other authors have [
20,
21,
22,
23]. First, we take
and
,
in model (
8) and obtain
Consider
Taking the difference between consecutive terms, we have
Approximating the
functions using two-point Lagrange interpolation polynomials on
, we write
Hence,
By integrating the above integral according to the limits and taking
, we have
In the original model for
and
,
depends on
and
. We take
. Then,
and
where
Hence, our algorithm is
10. Simulations Based on Computational Algorithm
We determined the effect of different fractal and fractional orders,
,
,
, and
, using Matlab R2016a. The values of the parameters and initial conditions are defined in the
Table 2.
Now, we analyze the results.
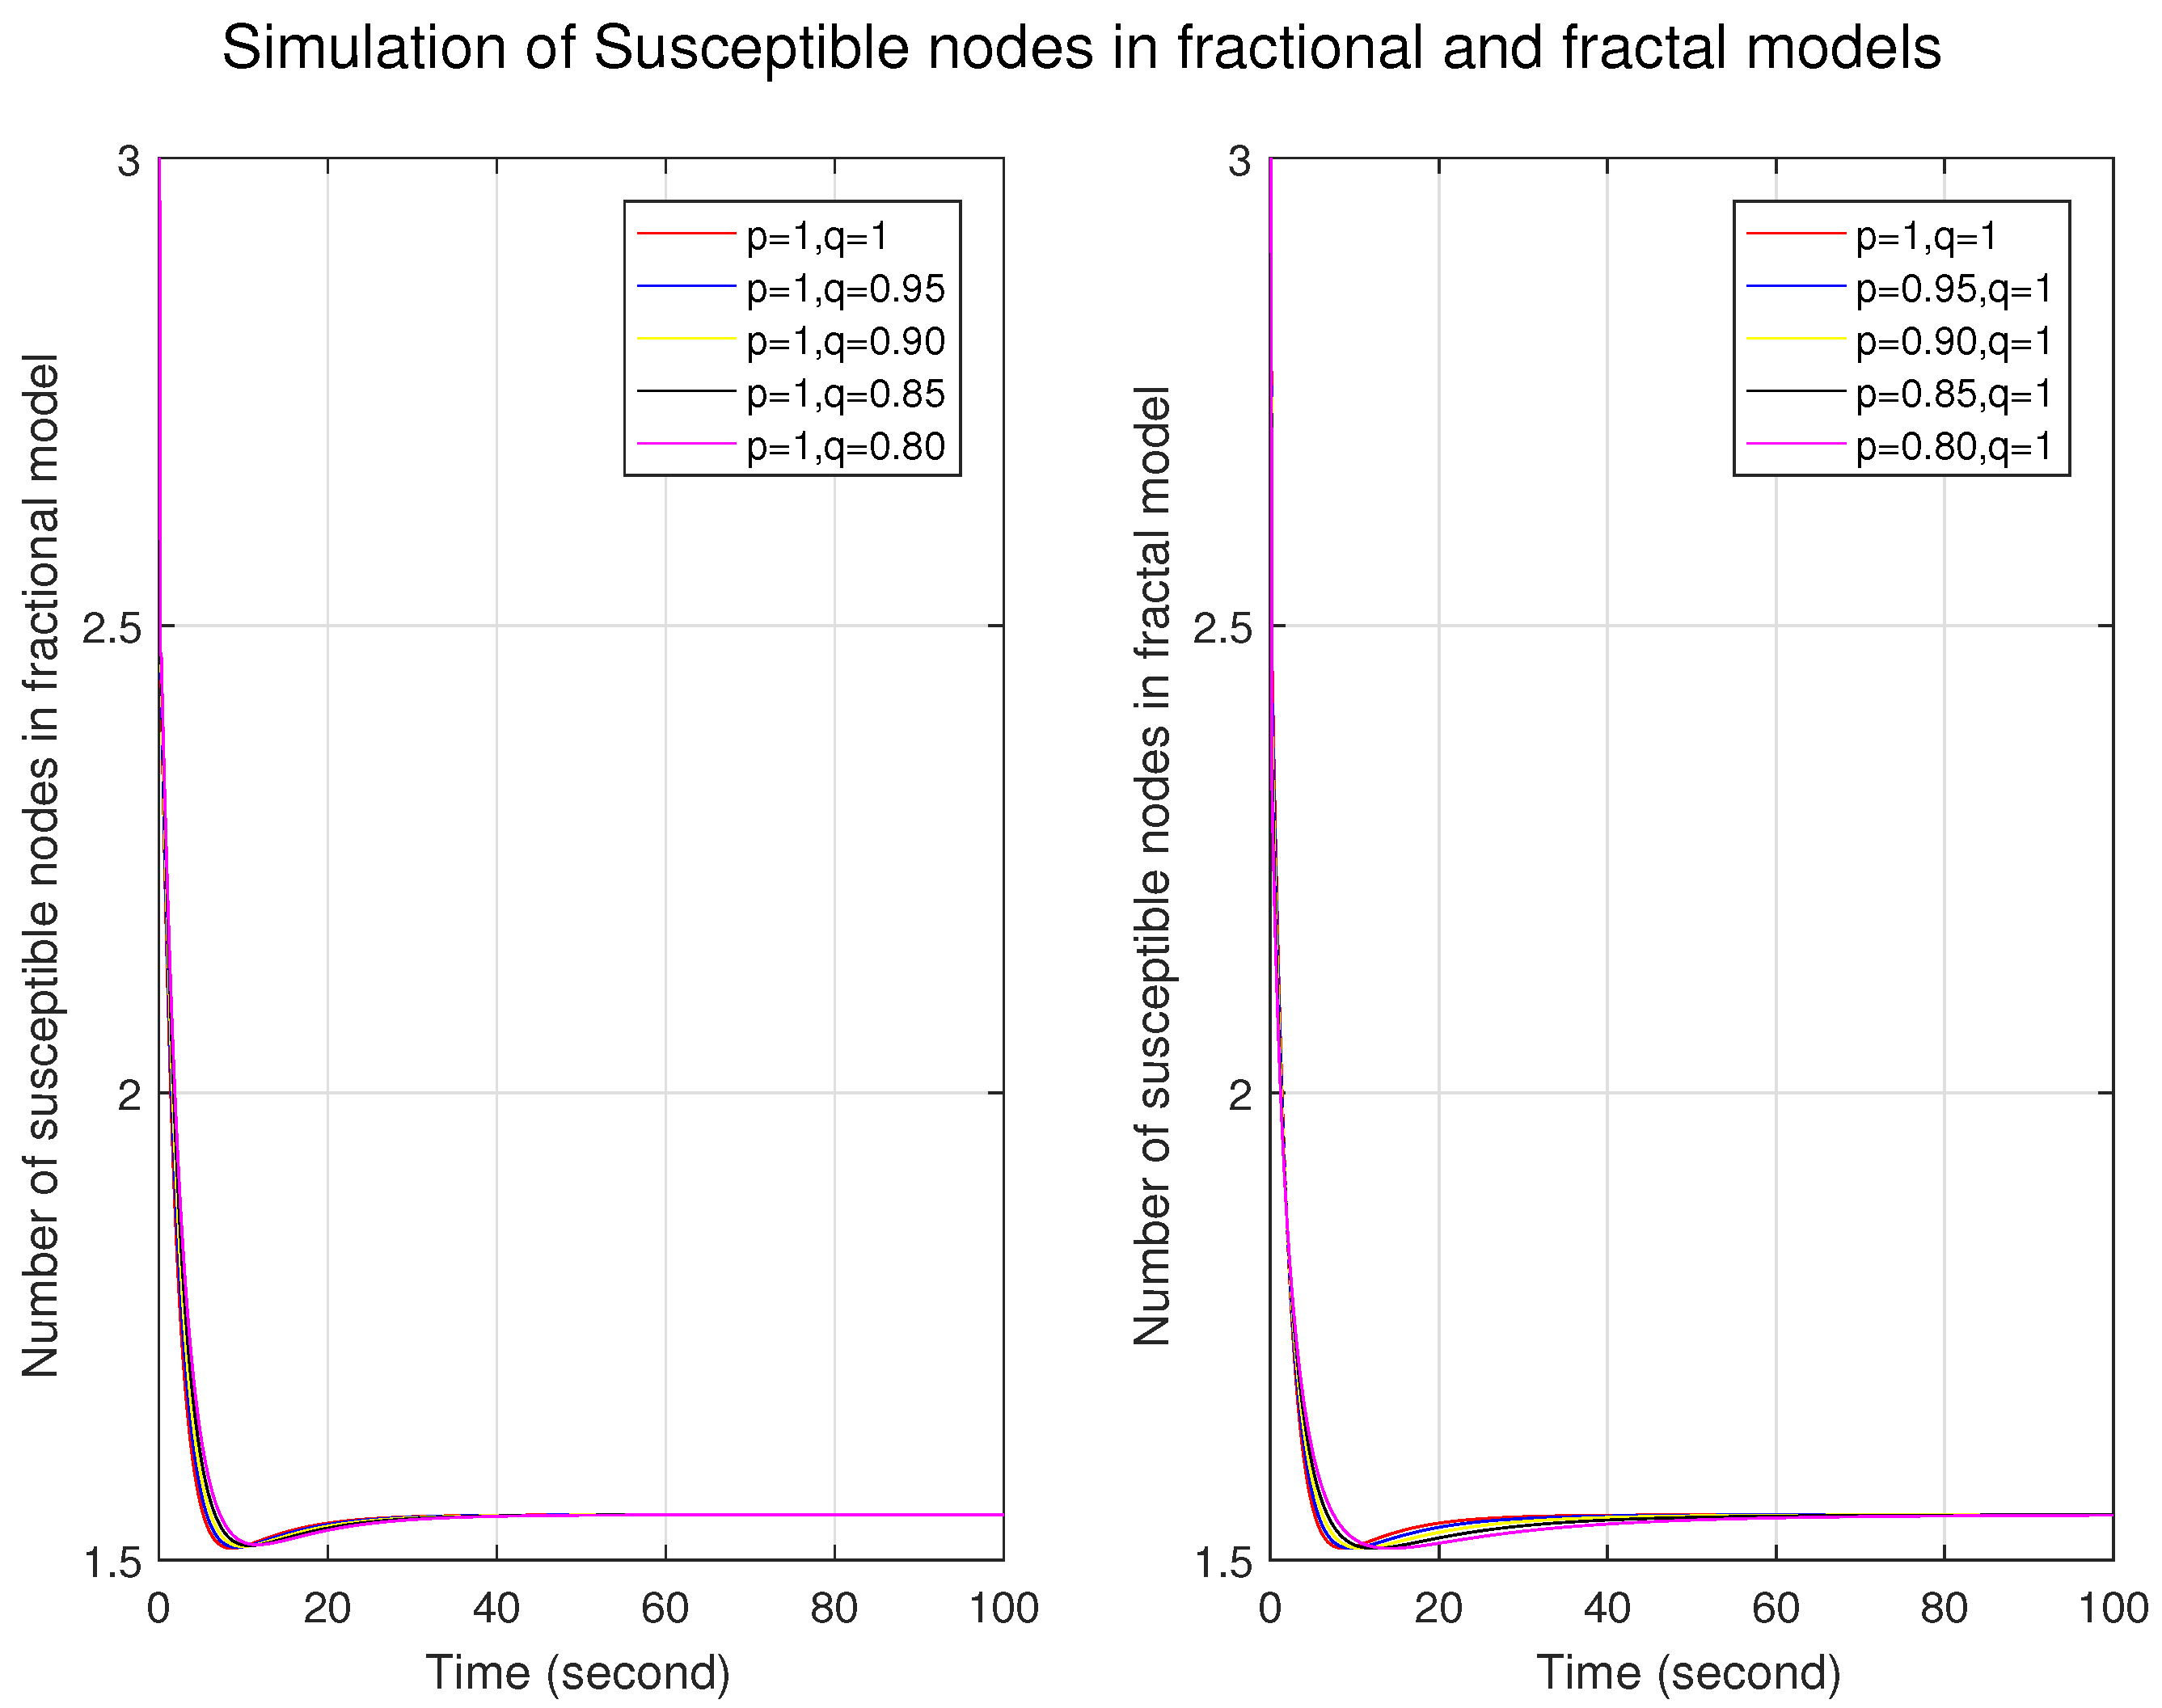
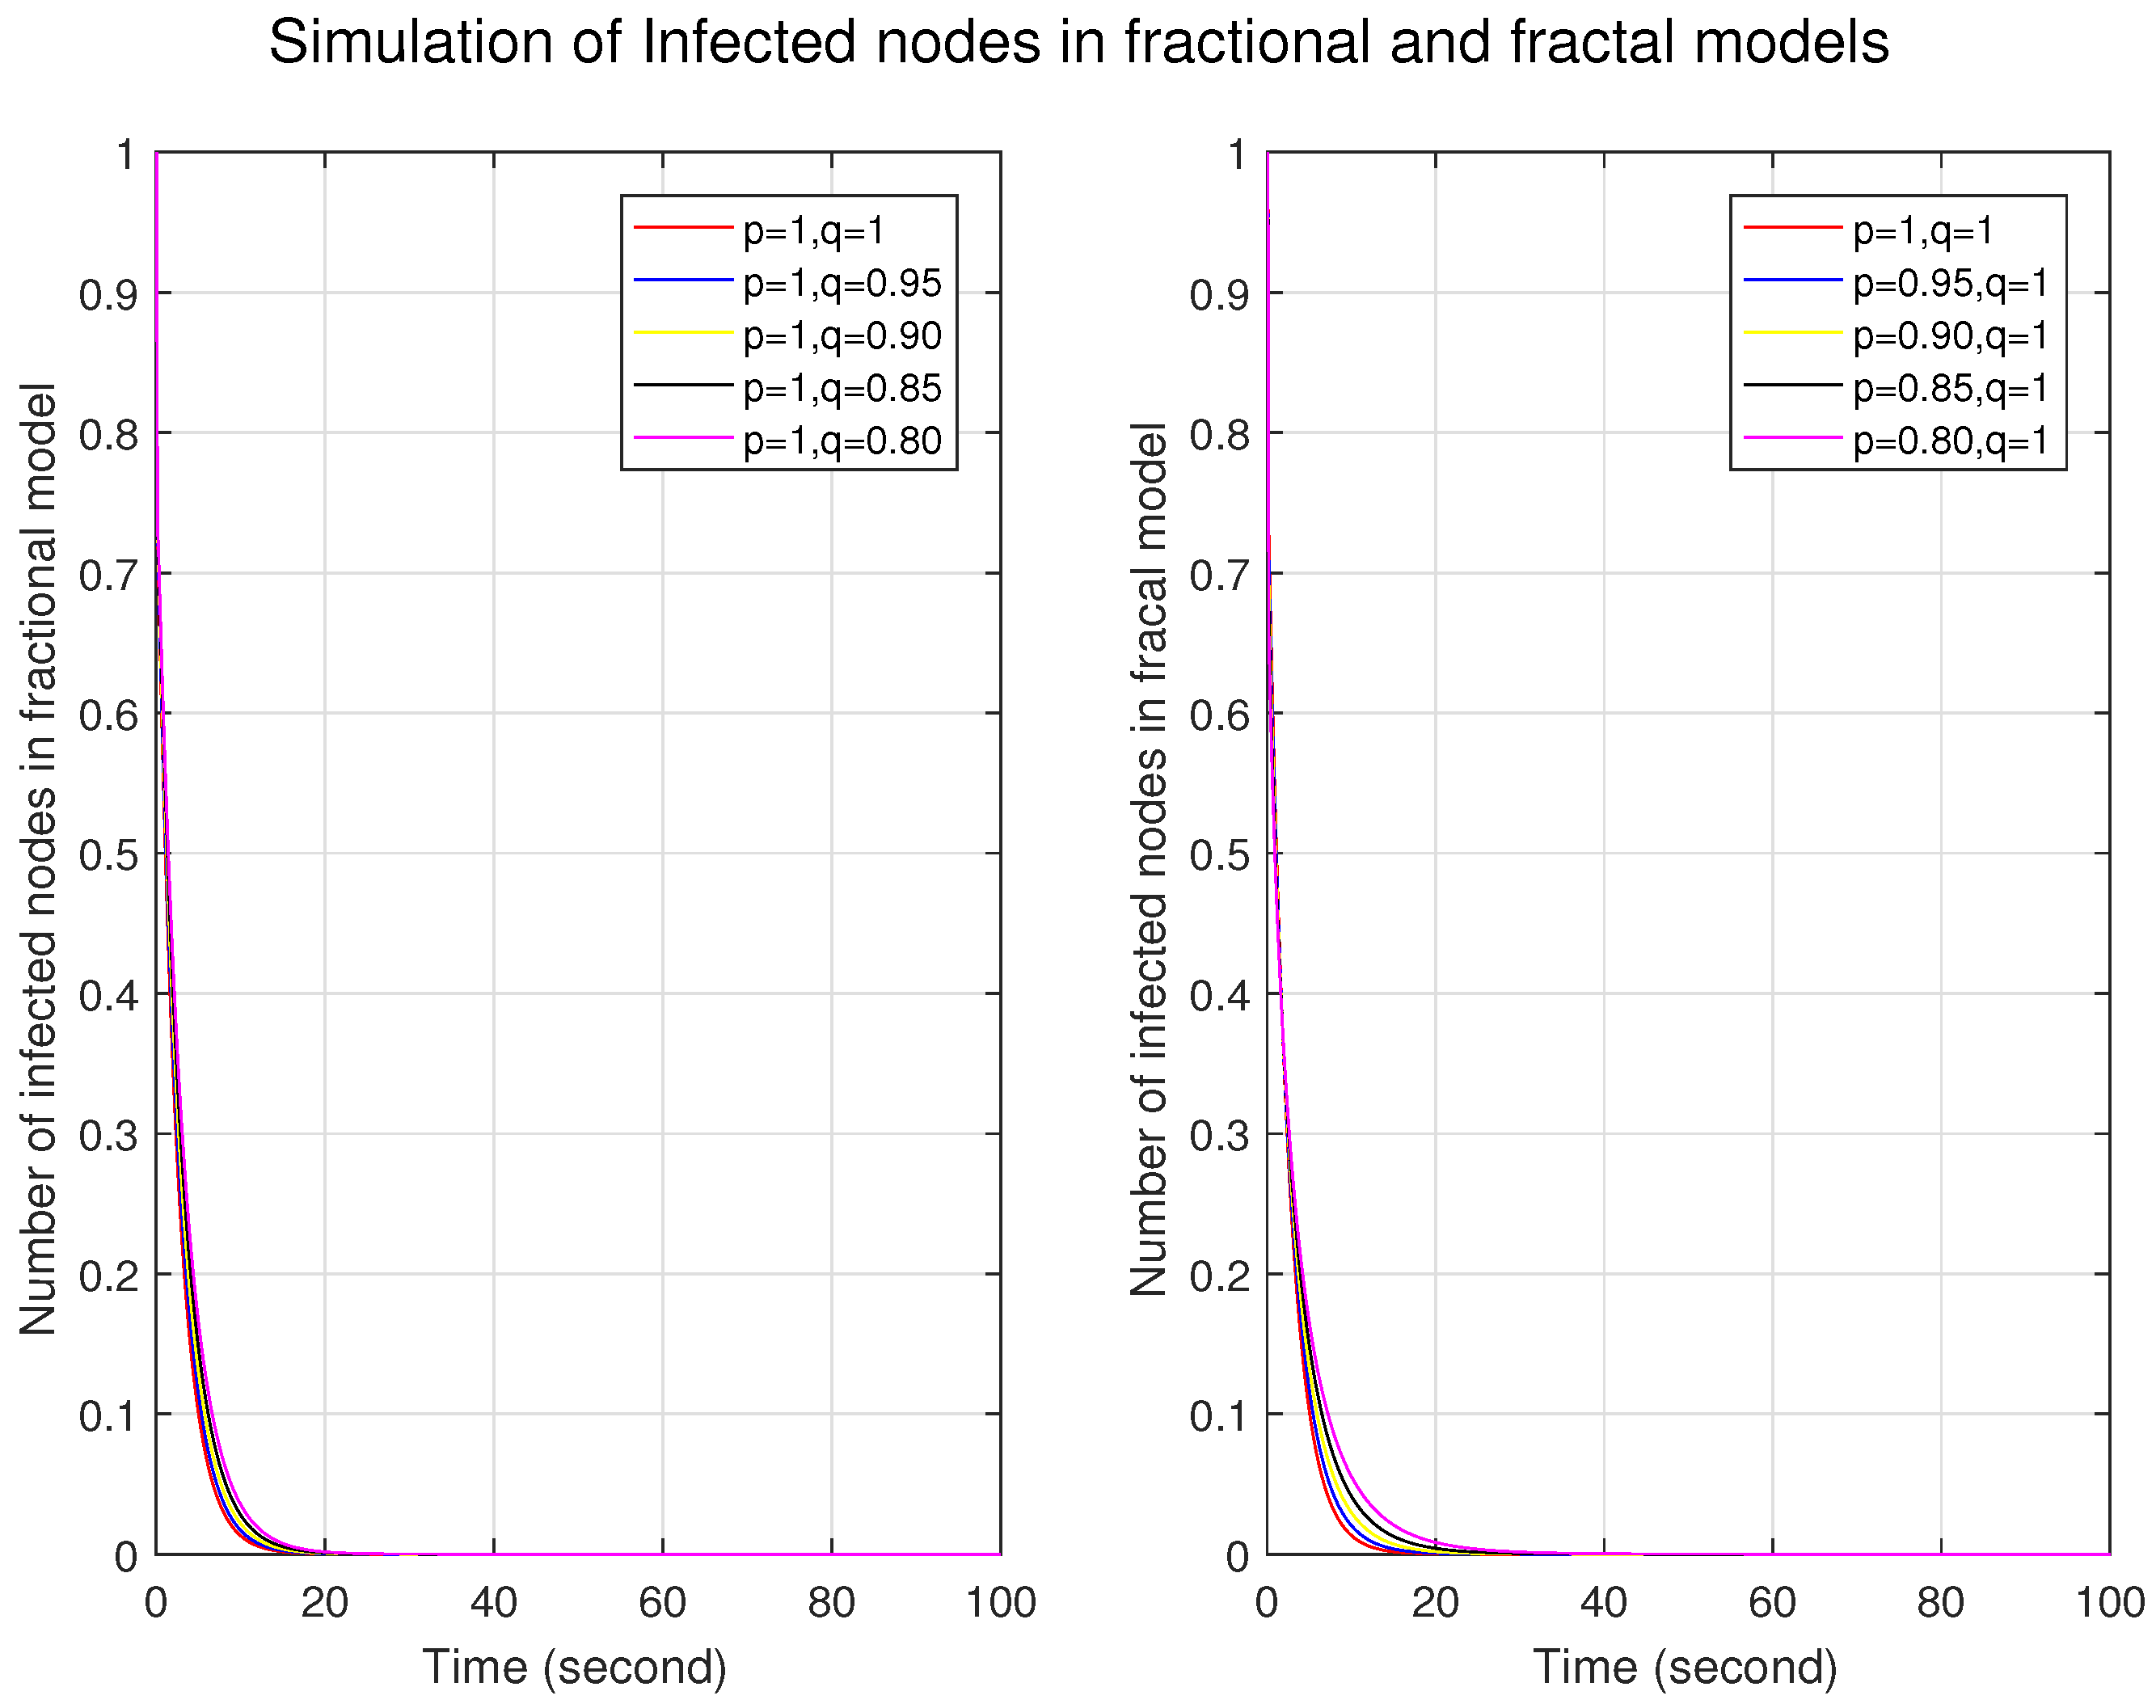
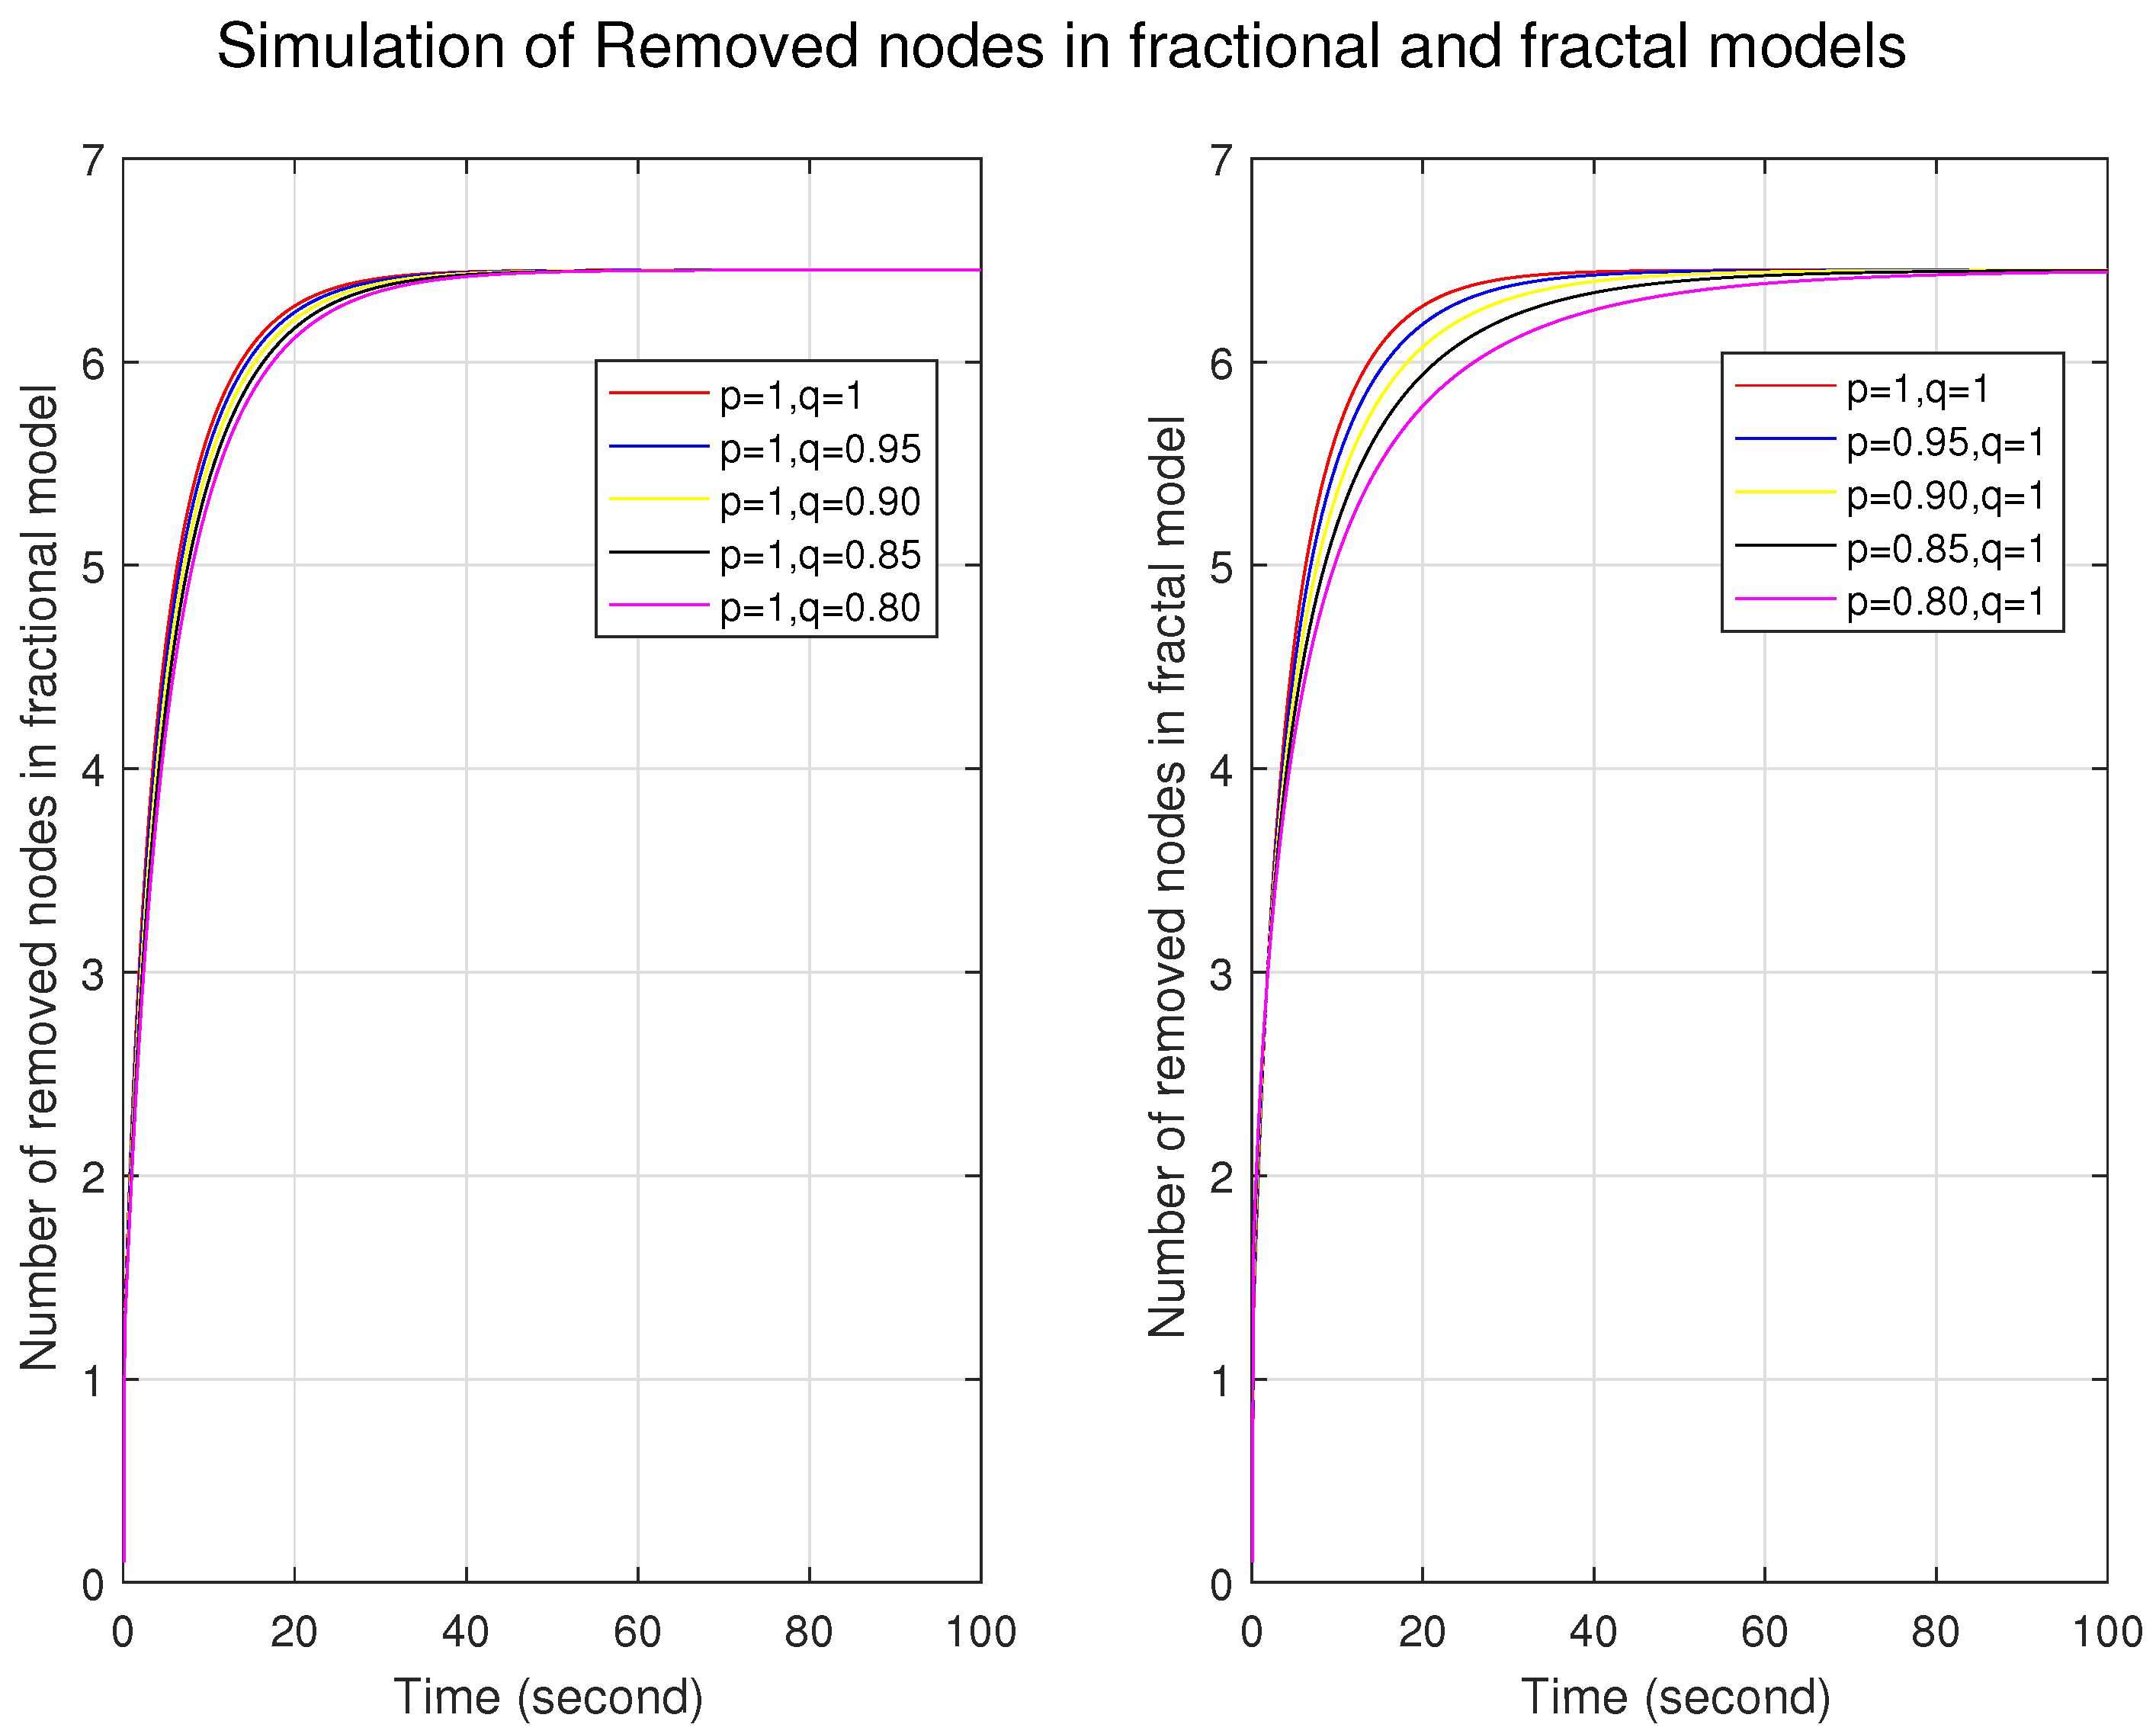
Figure 1,
Figure 2 and
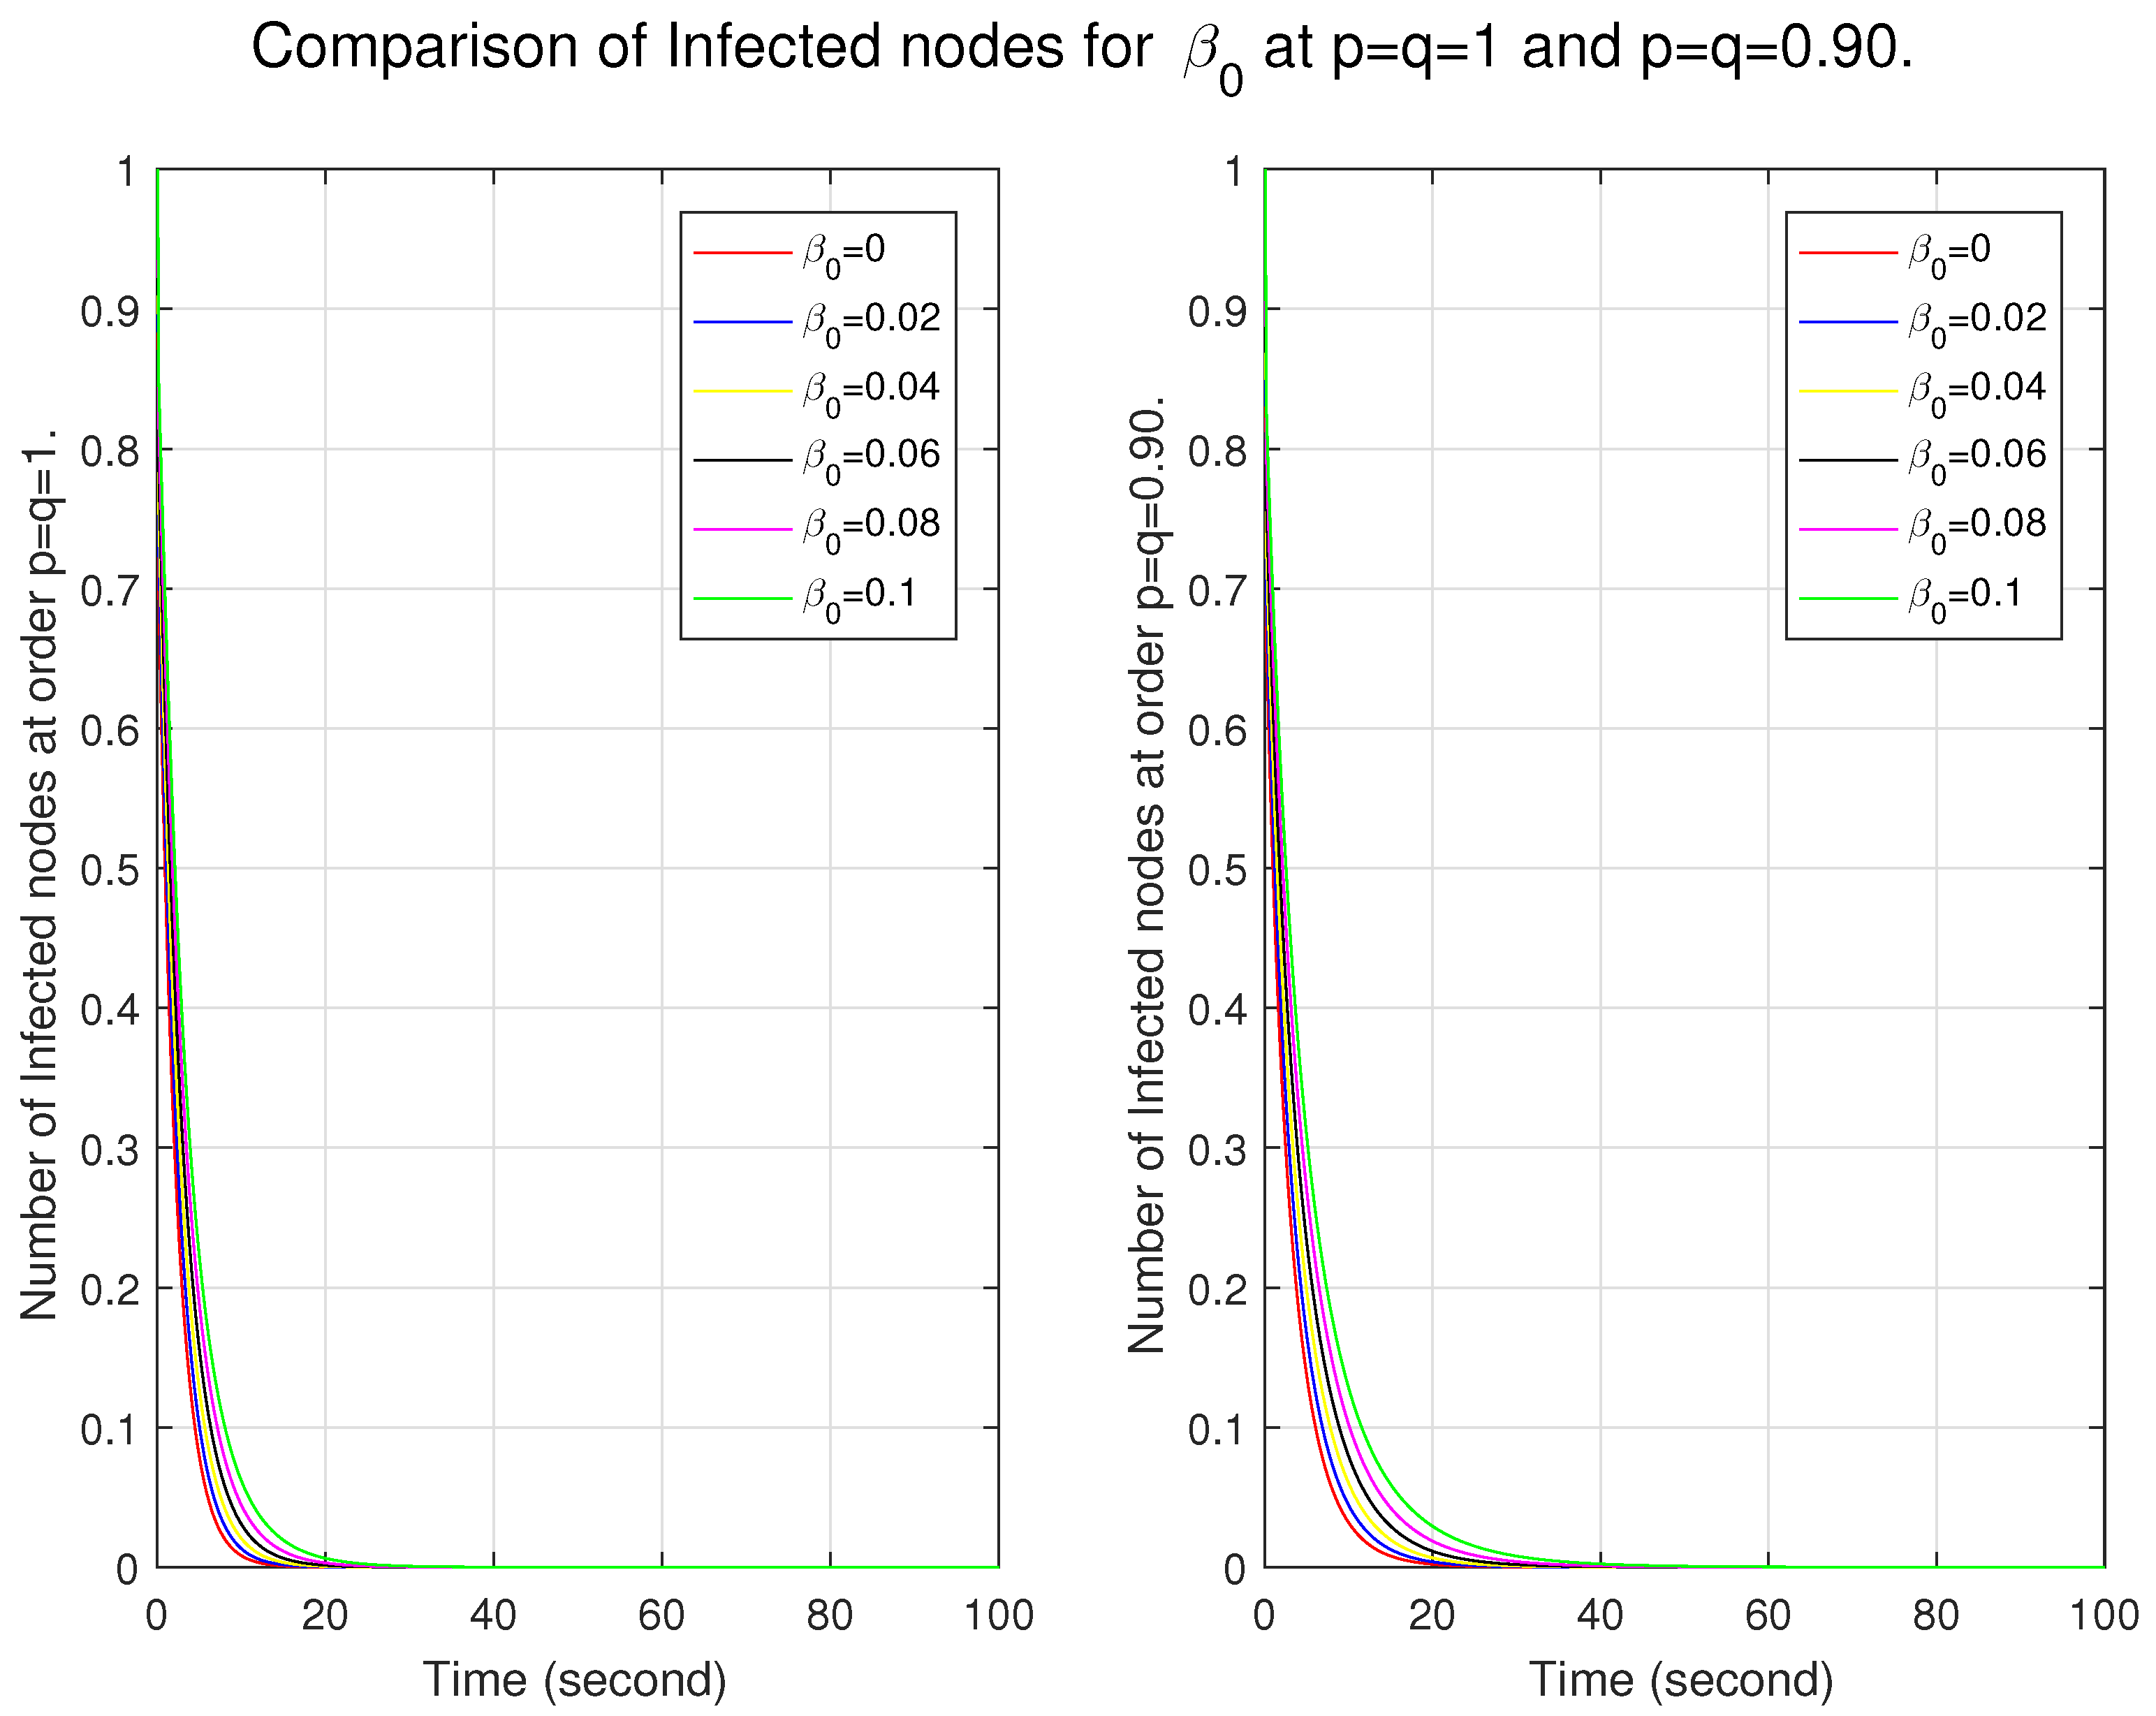
Figure 3 illustrate the simulations of the susceptible, infected, and removed nodes for the fractal and fractional models independently. First, we constructed a fractional model by taking different fractional orders with fractal orders of one. Similarly, the fractal model was built by taking different fractal orders with a fractional order of one. We can observe that the graphs for the trajectories of the nodes in the fractional model are very close to each other, which shows that the nodes are firmly connected and indicates a more homogeneous structure with fewer variations. In contrast, the distance between the nodes at different orders represents long-range corrections and depicts a more heterogeneous and complex structure. For fractal models, in
Figure 1, initially at lower fractal orders, the number of nodes is more significant and then it decreases, which shows that, initially, the system has a strong memory effect and, as time passes, the memory effect decays. In
Figure 2 and
Figure 3, the number of infected nodes increases, and the number of removed nodes decreases for lower fractal orders. This shows that the system has a strong memory effect in the fractal model.
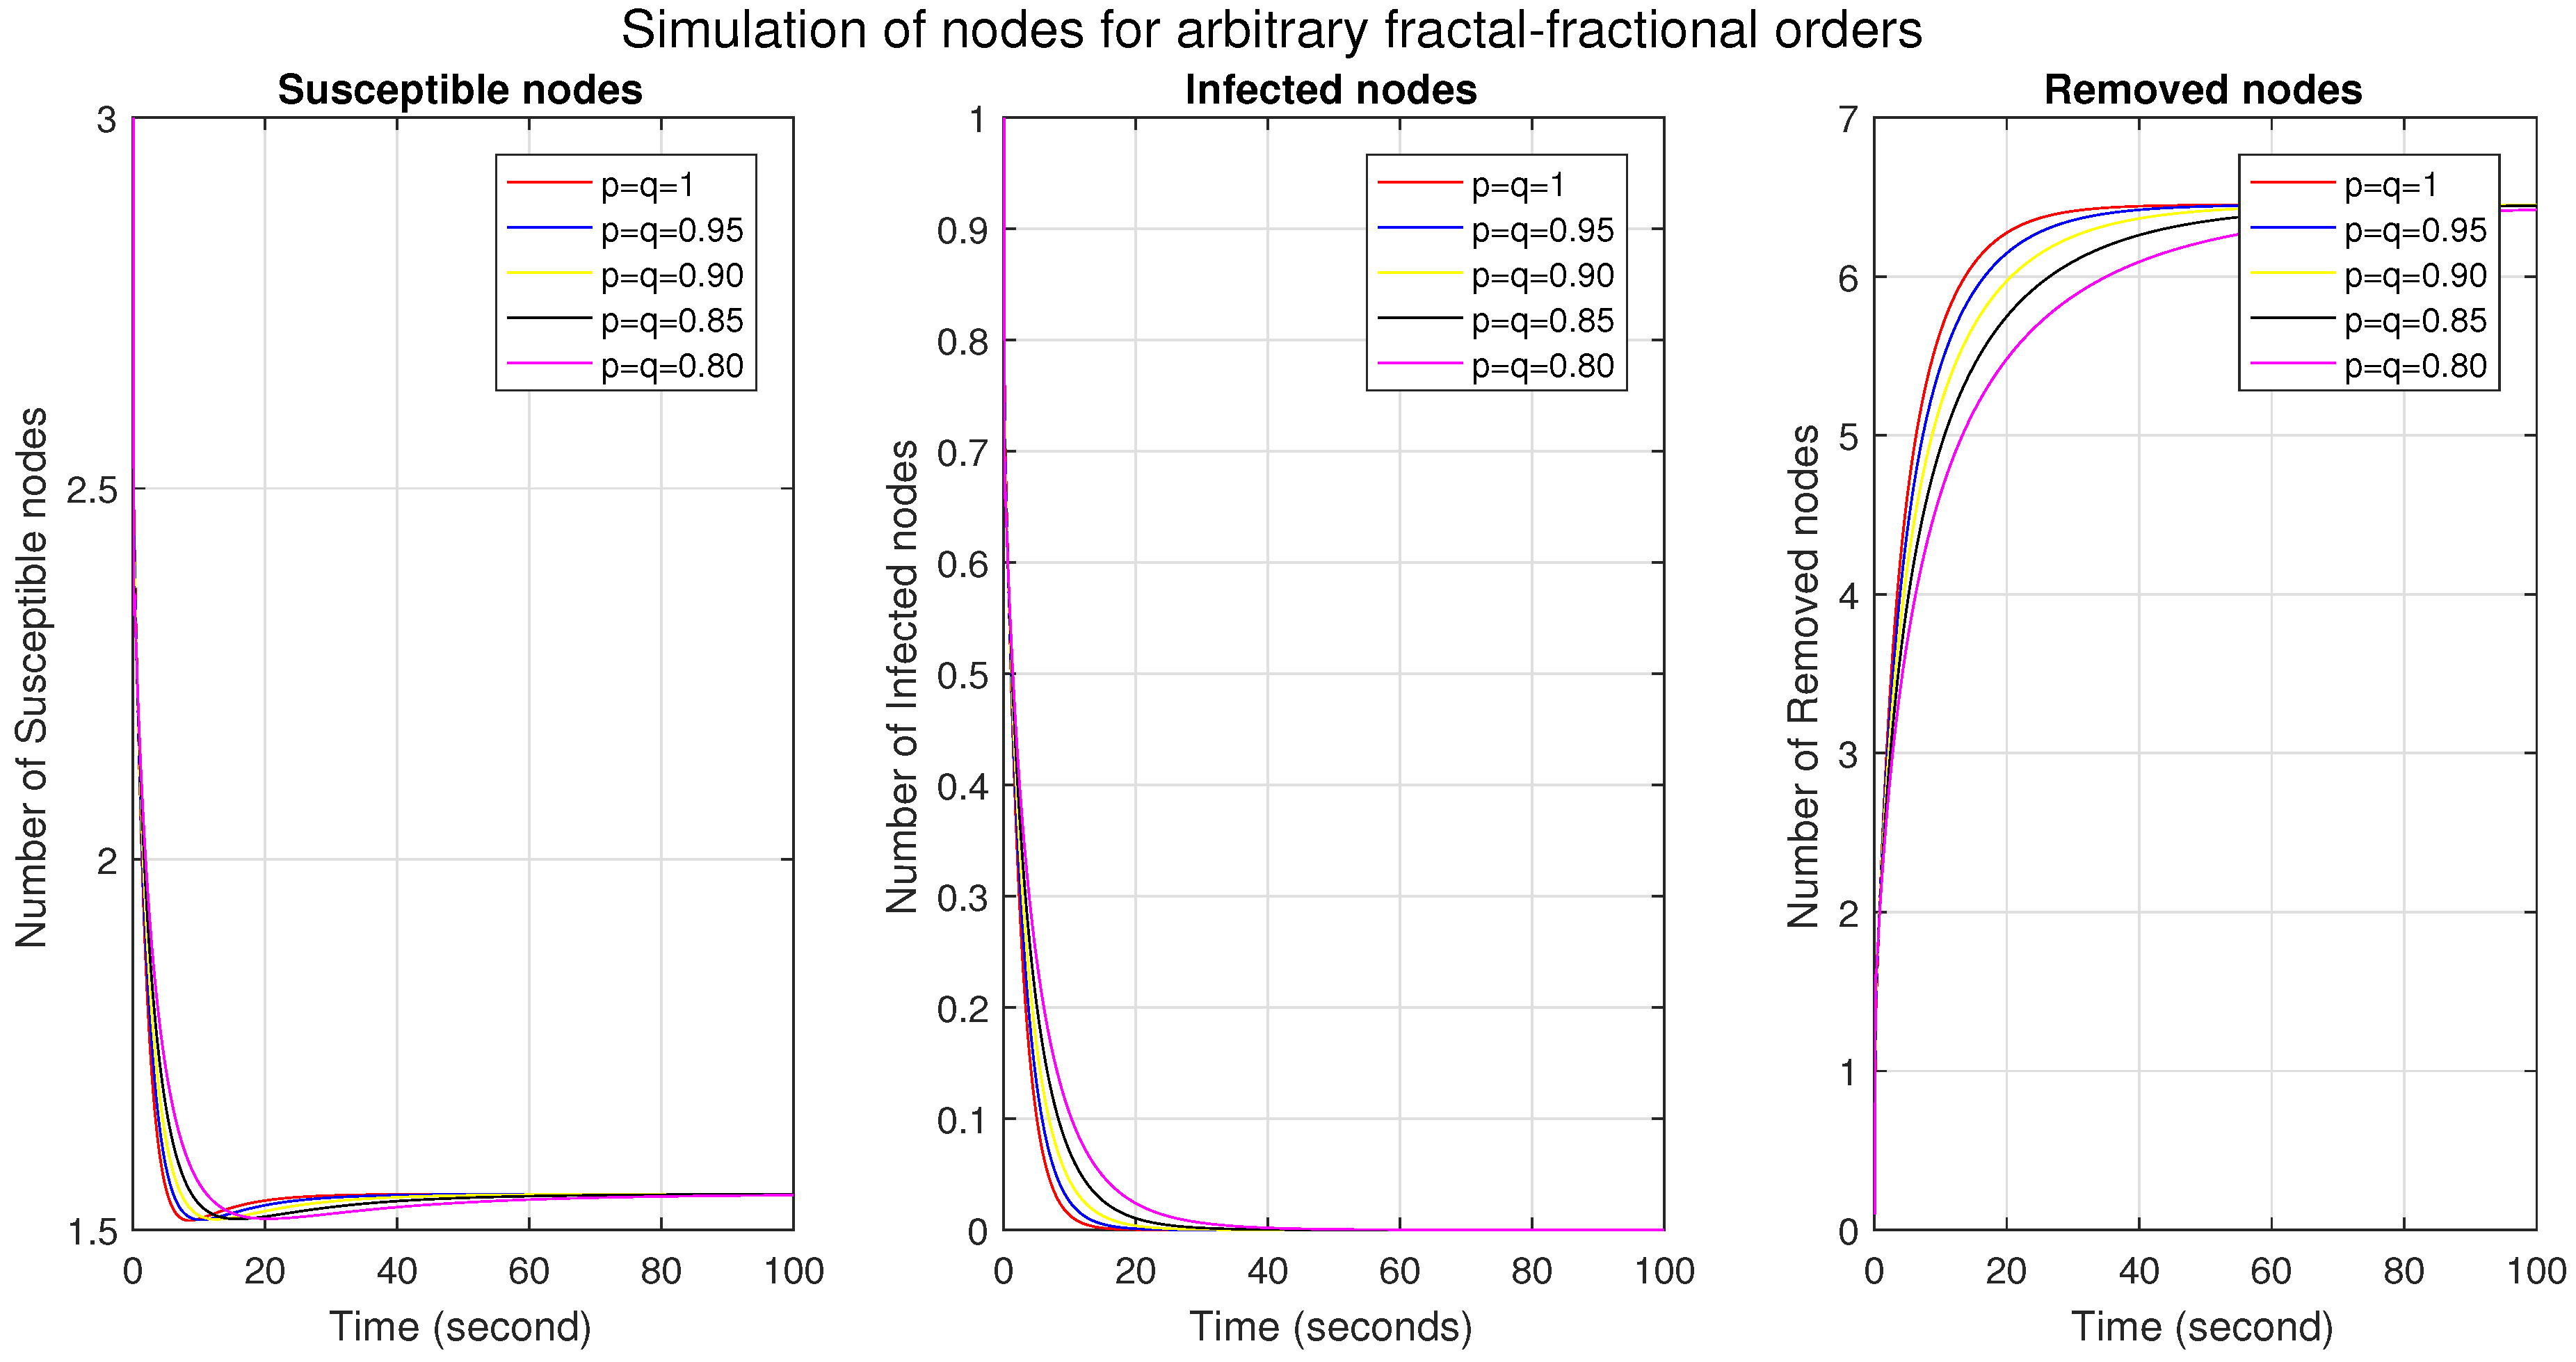
Figure 4 shows the simulations of the susceptible, infected, and removed/recovered nodes under the combined effect of different ff orders. We see that, in
Figure 1, as the ff order decreases, the number of susceptible nodes is more significant initially, then decreases, and finally converges. This means that, initially, there is a higher degree of connectivity and vulnerability to infection; a decrease shows a reduction in both connectivity and vulnerability, probably due to increased immunity, and convergence shows that the system has become stable. The effect of the ff orders shows that the memory effect is stronger initially; after that, it decays with time. In
Figure 2, the more significant number of nodes at lower ff orders indicates a more substantial memory effect and a higher potential for epidemic spread. We also observe that several infected nodes become zero early at higher ff orders, which indicates increased resilience and improved system immunity. It also indicates lower infection transmission rates and increased isolation. In
Figure 3, the reduced number of removed nodes in the lower orders shows longer persistence, a higher prevalence of infection, and a longer and stronger memory effect. In
Figure 5, we compare the classical and ff models, which shows the behavior of all nodes in a single figure.
Now, we show the impact of
and
(involved in the function of
ℵ) in the classical and ff models. We examine the graphs in two ways. First, we discuss the behavior of the nodes for different ff orders in each model. Secondly, we compare the behavior of these nodes between the models. In
Figure 6, as
increases, the number of nodes also increases; this shows that the system may be more susceptible to infection, may exhibit a faster spread of infection due to a larger pool of infected nodes, and may show nonlinear dynamics, where small changes in
lead to significant changes in the number of infected nodes. It also represents that the system has a more substantial memory effect. From the comparison, we see that in the lower ff model, the system is more flexible in becoming infectious and has a more significant memory effect. Here, the variable
varies proportionally to the sensitivity of infection, and
has a constant value. In
Figure 7, we see the effect of this varying variable. Although there seems to be a slight difference, it plays a role in the system’s dynamics in coordination with other parameters.
In
Figure 8, we see the effect of
on
,
ℵ, and
for the classical and ff models. The first column shows that as
increases, each model’s number of susceptible nodes decreases. We can say that it shows a strong immune response, a decreased risk of infection, more resilience to infection, and the ability to eradicate infection. Moreover, comparing both models, we see that the number of nodes in the lower ff model is smaller. It shows increased complexity, slower spread of infection, increased clustering, improved resilience, and enhanced robustness. In the second column, the trajectories are very close to each other for different values of
between the models. This depicts that the system may have reached a saturation point and exhibited diminishing returns. Also, for the ff model at 0.90, the number of nodes is greater, representing increased complexity, faster speed of infection, increased vulnerability, and reduced resilience. Similarly, in the third column, the number of removed nodes is greater for a higher real-time immune rate for both models. This shows an effective immune response capable of eliminating infected nodes efficiently, greater resilience in the system, and enhanced system robustness. From the comparison, we know that the number of nodes is less in the ff model at the 0.90 level, which results in a strong memory effect and increased system complexity.
Figure 9 shows the behavior of
(loss rate of immunity). From the first column, it can be seen that the number of susceptible nodes increases as the lost rate of immunity increases in both models. Furthermore, the ff model at 0.90 exhibits robustness to immunity loss and may introduce unique effects that mitigate the impact of immunity loss, producing an effective immune response with increased resilience. In the second column, the number of infected nodes remains the same for different rates of immunity loss in each model, showing that the immune response may have reached a saturation point, and the system reached an equilibrium state. It also shows the robustness and resilience of the system. Moreover, the number of infected nodes approaches zero earlier in the classical model. This means that the ff model at 0.90 shows a delayed eradication of infection, has a slower immune response, has lower efficiency, and has increased system vulnerability. Similarly, the number of removed nodes decreases with increasing loss of immunity in each model in the third column. This shows reduced immune efficiency, longer persistence, increased vulnerability, and reduced system resilience. Comparing the models, the ff model at 0.90 removes fewer nodes than the classical model, indicating impaired immune function, persistence of infection, vulnerability, and s decrease in system resilience.
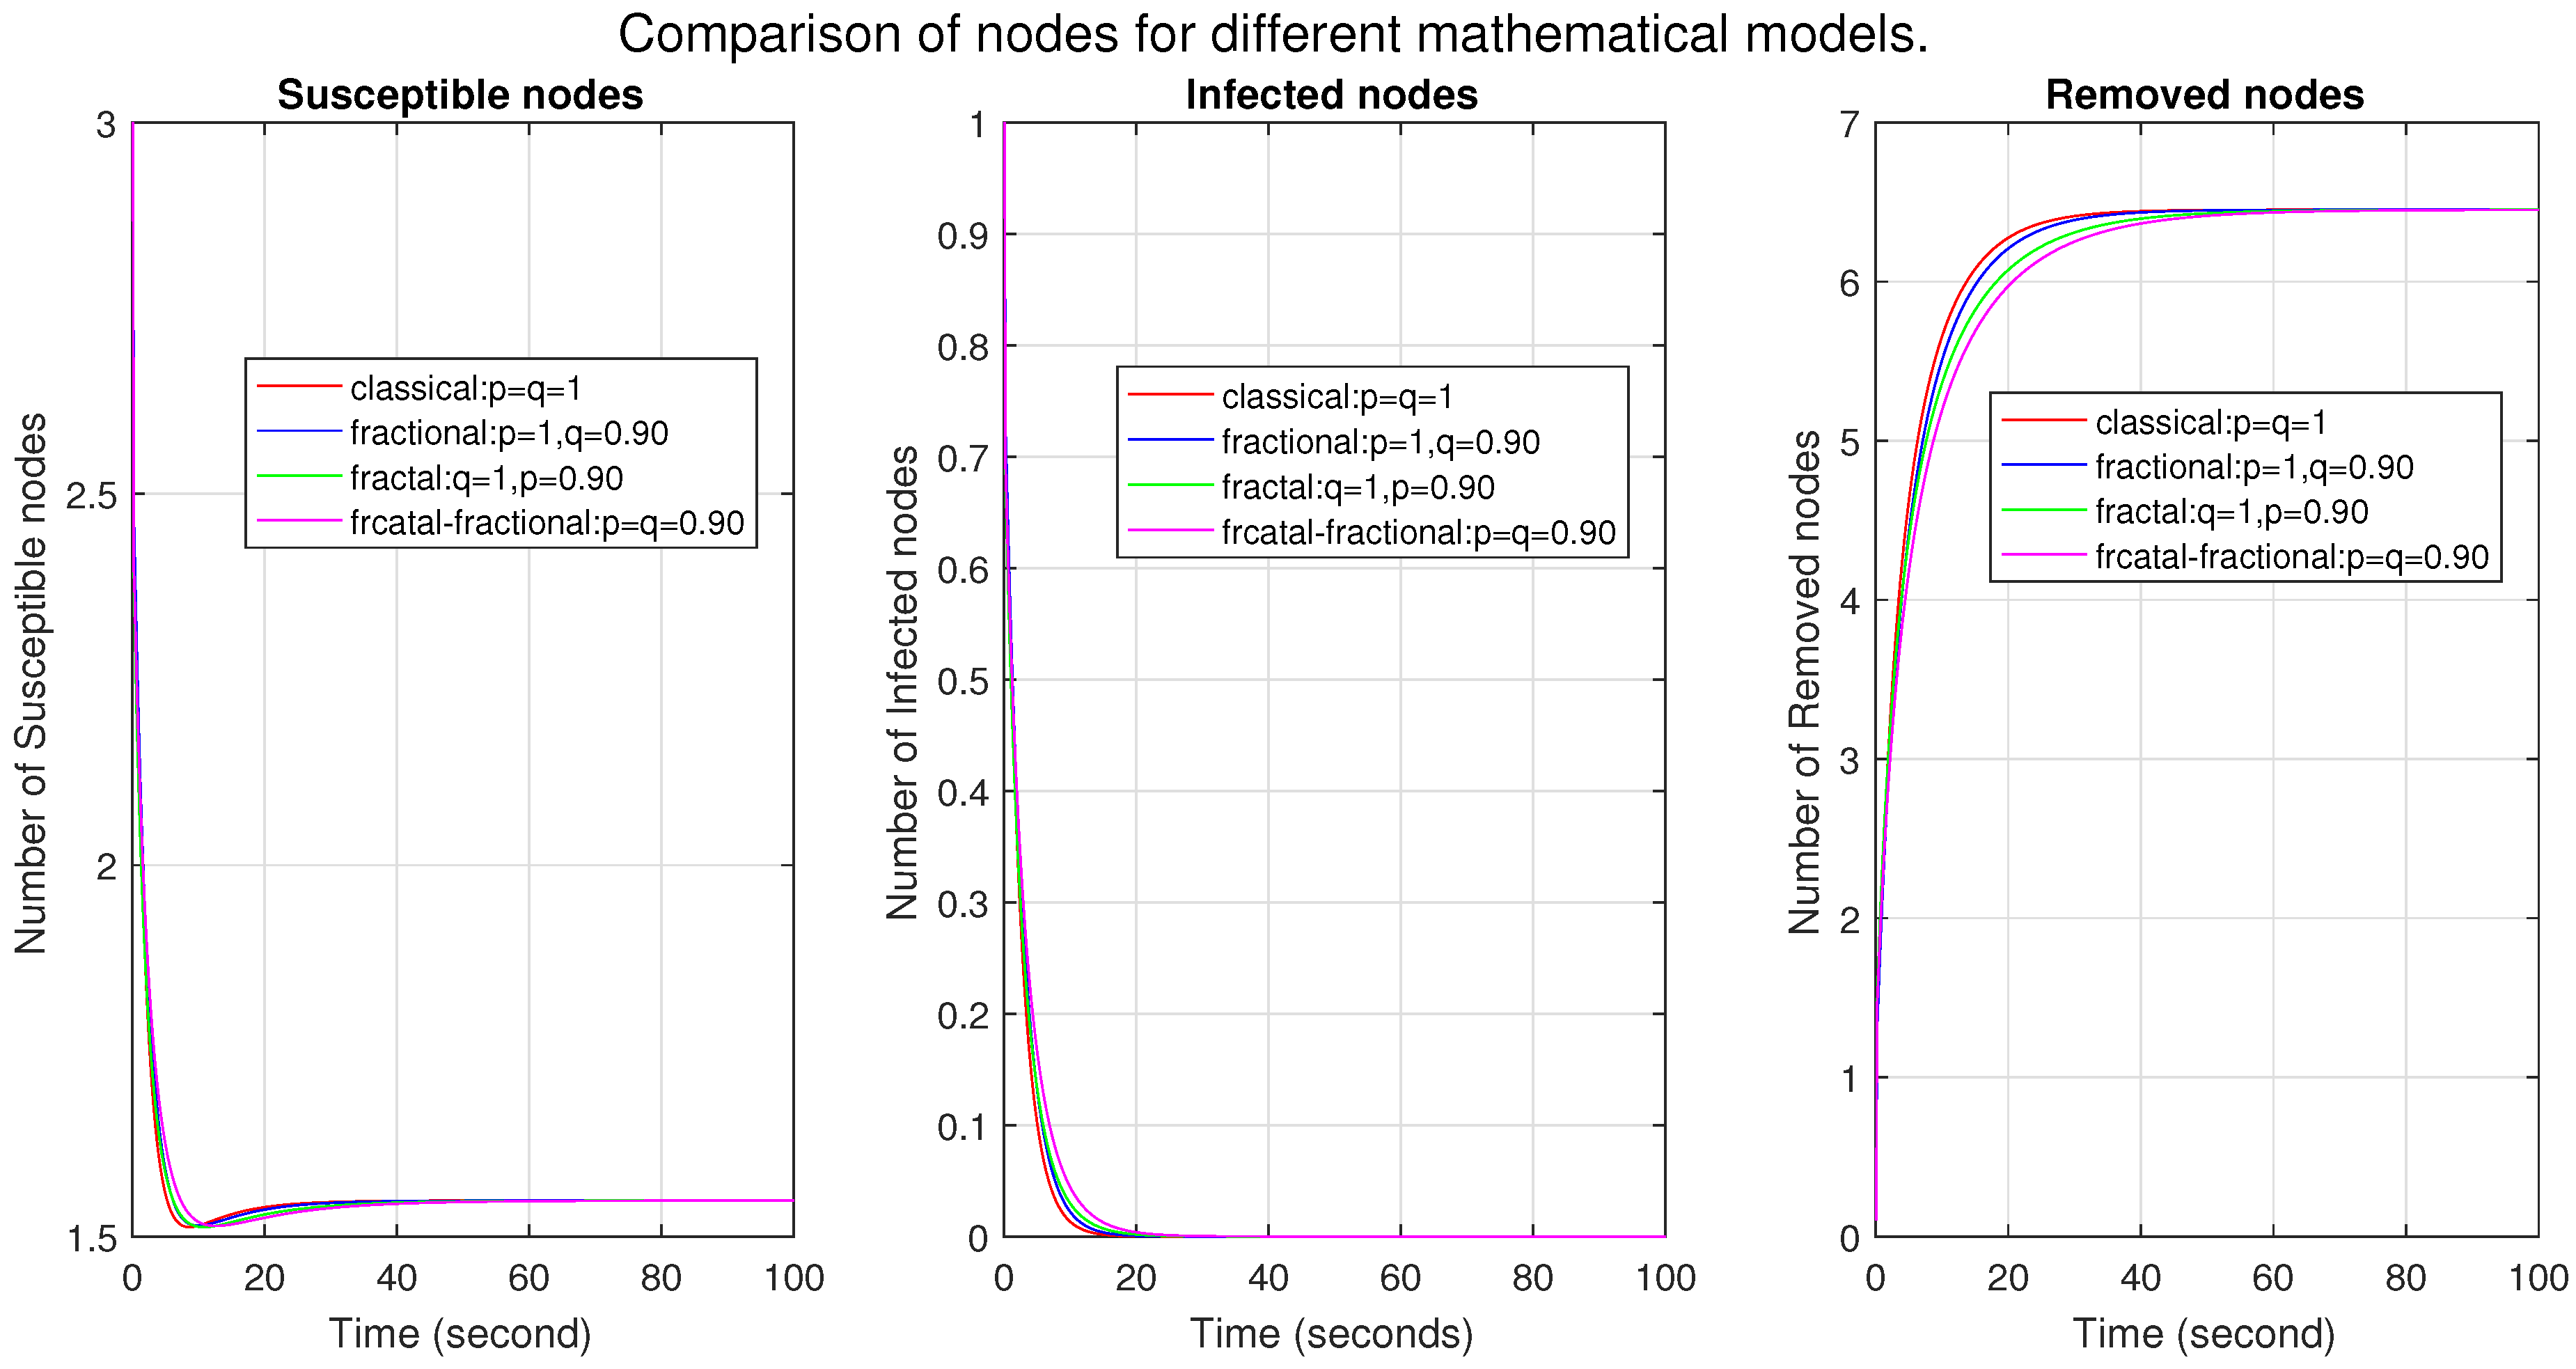
In
Figure 10, we compare four mathematical models: classical, fractional, fractal, and fractal–fractional. The first two figures show that the number of susceptible and infected nodes is the highest in the ff model, then in the fractional, fractal, and classical models. This shows that the fractal–fractional model is more effective at expressing the complexity of malware propagation, and the fractional model may also be used in some cases. However, the fractal and classical methods are unsuitable for complex systems. The higher number of nodes represents a more profound memory effect and a strong correlation between nodes. Moreover, the convergence indicates that the system is stable. Similarly, in the third figure, the number of removed nodes in the fractal–fractional model is the lowest, which shows a strong memory effect and strong correlation. The convergence figure indicates the stability of the system. In
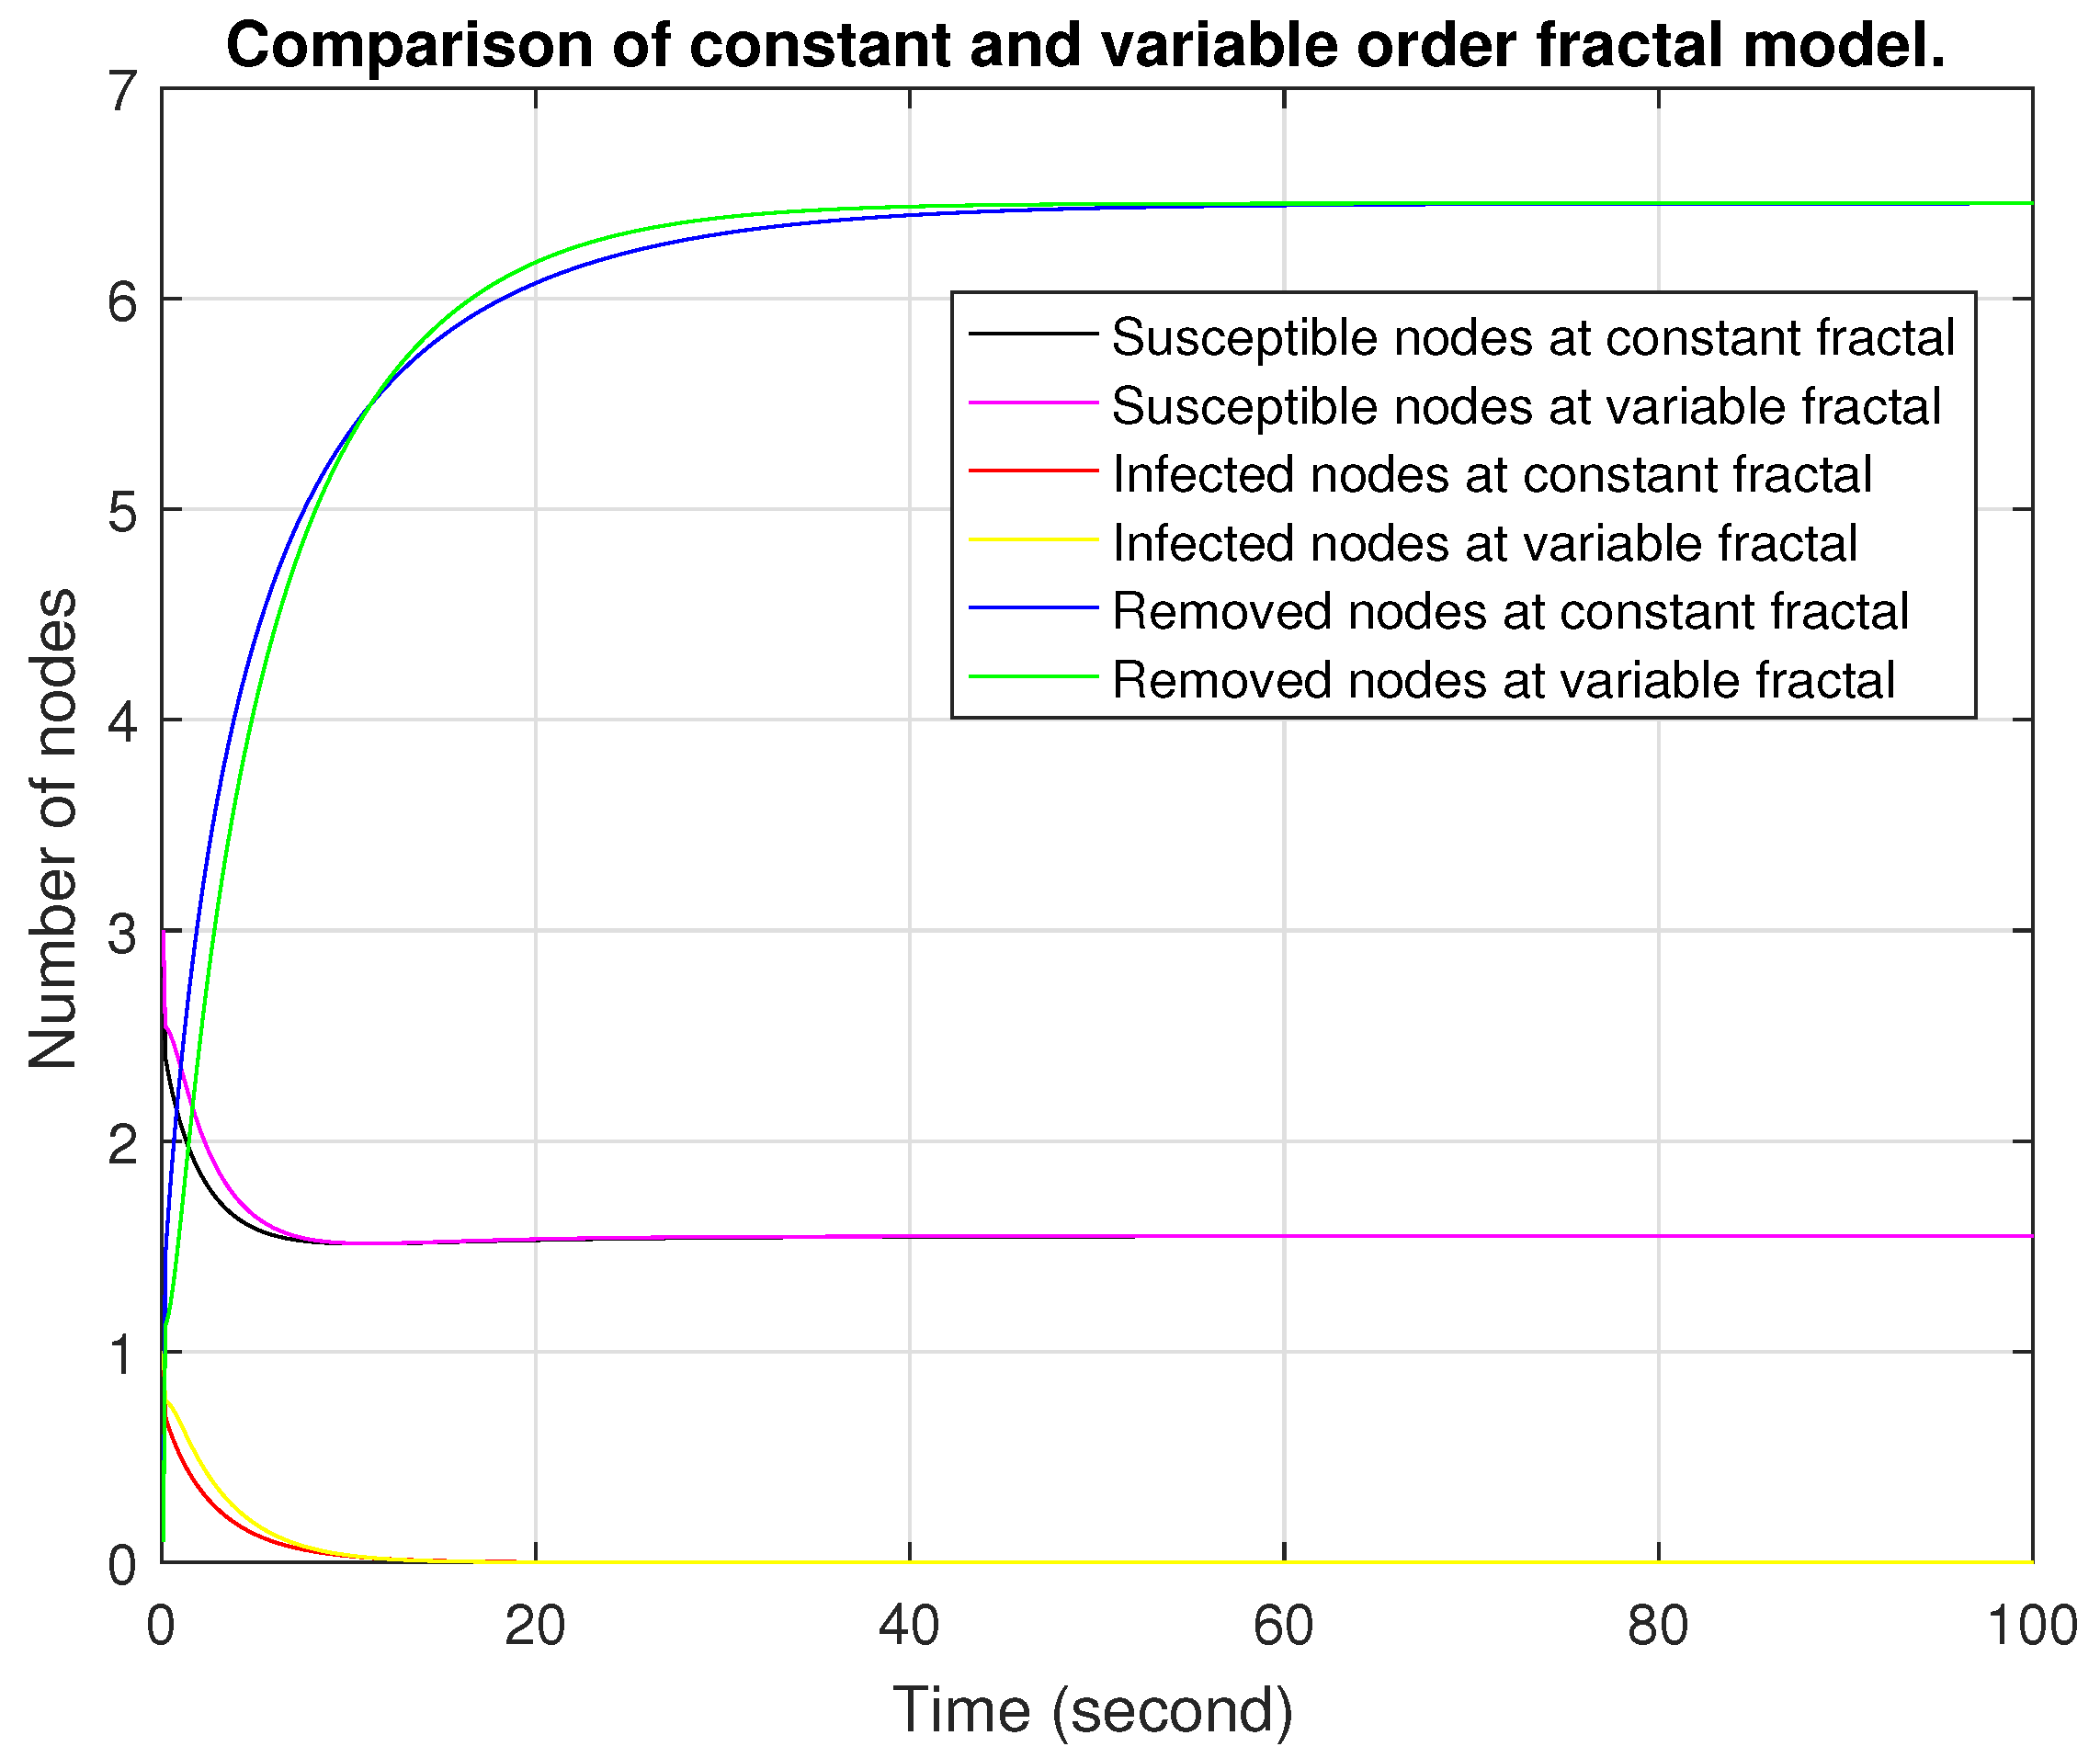
Figure 11, we see the difference between the constant and variable fractional orders. Similarly,
Figure 12 compares the constant and variable fractal orders. We take the variable fractional order as
and the variable fractal order as
. As time passes, we see that the susceptible and infected nodes merge rapidly; this means that the variable order becomes constant. The number of nodes in the variable order is greater than in the constant order, indicating that the variable order provides an advantage in removing nodes, which leads to more effective epidemic control and a more adaptive system. The variable fractional and fractal orders represent more effective control strategies.
11. Conclusions
This paper discussed a mathematical deterministic model of malware propagation with a time-delay factor and a variable infection rate in the form of a fractal–fractional derivative. A classical mathematical model was converted into a fractal–fractional model with an exponential decay kernel and was formulated as a fixed-point problem, showing that the solution exists. Existence was examined using a theorem based on contraction and the Leray–Schauder criteria. The uniqueness and stability were checked using the theorems defined for the ff model. Simulations were performed by creating a numerical scheme that verified our theory. Our model was examined as a fractional, fractal, and fractal–fractional model. The behavior of the nodes for lower FF orders explains the stronger memory effects, sensitivity to extrinsic factors, and flexibility to recover from infections. It also shows that the removed nodes achieve a greater confinement of infection and perseverance at lower levels of FF orders. We compared the ff model and the behavior of different parameters: , , and for , and . Observing the graphs, we explored the nodes’ sensitivity, convergence, stability, and memory effects. This predictive behavior may facilitate the identification of vulnerabilities in computer systems. It enables the development of antivirus strategies and specialized software to eliminate infections in network nodes. The graphs showed that the effects of malware can be managed by choosing appropriate parameters. We also compared four methods (classical, fractional, fractal, and fractal–fractional). We discussed the cases for which these models may be more suitably used. Moreover, we tried to determine the impact of variable-order fractional and variable-order fractal derivatives. Sometimes, we saw a minimal difference; it may play a role in malware propagation, as small changes may cause large perturbations. Our results may help develop cyber-security antivirus software through examining memory effects. Some forms of such malware are Nimda, red worms, Slammer worms, Witty worms (worms), Wanna Cry, NotPetya (Ransomware), Mirai, Srizbi(Botnets), and Zeus, Emotet (Trojans). Our method faces some limitations: the lack of adequate, accurate data and limited software package resources caused hurdles in evaluating the results. For future work, we are interested in exploring different advanced mathematical models concerning kernels, different computational algorithms, and different variable orders of derivatives to understand the propagation of malware. We also want access to accurate data so that this methodology can be used efficiently in cybersecurity systems.

 ,
, 


