Article

A Novel Red-Billed Blue Magpie Optimizer Tuned Adaptive Fractional-Order for Hybrid PV-TEG Systems Green Energy Harvesting-Based MPPT Algorithms

by
Al-Wesabi Ibrahim
1,*,
Abdullrahman A. Al-Shamma’a
2,
Jiazhu Xu
1,*,
Danhu Li
1,
Hassan M. Hussein Farh
2 and
Khaled Alwesabi
3
1
College of Electrical and Information Engineering, Hunan University, Changsha 410083, China
2
Electrical Engineering Department, Imam Mohammad Ibn Saud Islamic University (IMSIU), Riyadh 11564, Saudi Arabia
3
College of Computer Science and Information Technology, Al-Razi University, Sana’a 1152, Yemen
*
Authors to whom correspondence should be addressed.
Fractal Fract. 2025, 9(11), 704; https://doi.org/10.3390/fractalfract9110704 (registering DOI)
Submission received: 17 September 2025 / Revised: 27 October 2025 / Accepted: 29 October 2025 / Published: 31 October 2025

Abstract

Hybrid PV-TEG systems can harvest both solar electrical and thermoelectric power, but their operating point drifts with irradiance, temperature gradients, partial shading, and load changes—often yielding multi-peak P-V characteristics. Conventional MPPT (e.g., P&O) and fixed-structure integer-order PID struggle to remain fast, stable, and globally optimal in these conditions. To address fast, robust tracking in these conditions, we propose an adaptive fractional-order PID (FOPID) MPPT whose parameters (Kp, Ki, Kd, λ, μ) are auto-tuned by the red-billed blue magpie optimizer (RBBMO). RBBMO is used offline to set the controller’s search ranges and weighting; the adaptive law then refines the gains online from the measured ΔV, ΔI slope error to maximize the hybrid PV-TEG output. The method is validated in MATLAB R2024b/Simulink 2024b, on a boost-converter–interfaced PV-TEG using five testbeds: (i) start-up/search, (ii) stepwise irradiance, (iii) partial shading with multiple local peaks, (iv) load steps, and (v) field-measured irradiance/temperature from Shanxi Province for spring/summer/autumn/winter. Compared with AOS, PSO, MFO, SSA, GHO, RSA, AOA, and P&O, the proposed tracker is consistently the fastest and most energy-efficient: 0.06 s to reach 95% MPP and 0.12 s settling at start-up with 1950 W·s harvested (vs. 1910 W·s AOS, 1880 W·s PSO, 200 W·s P&O). Under stepwise irradiance, it delivers 0.95–0.98 kJ at t = 1 s and under partial shading, 1.95–2.00 kJ, both with ±1% steady ripple. Daily field energies reach 0.88 × 10⁻³, 2.95 × 10⁻³, 2.90 × 10⁻³, 1.55 × 10⁻³ kWh in spring–winter, outperforming the best baselines by 3–10% and P&O by 20–30%. Robustness tests show only 2.74% power derating across 0–40 °C and low variability (Δvmax typically ≤ 1–1.5%), confirming rapid, low-ripple tracking with superior energy yield. Finally, the RBBMO-tuned adaptive FOPID offers a superior efficiency–stability trade-off and robust GMPP tracking across all five cases, with modest computational overhead.

1. Introduction

Many countries have pledged specific carbon neutrality objectives, demonstrating the widespread agreement that global action to tackle climate change is urgently needed [1,2]. Achieving net-zero emissions by 2050 is crucial for speeding up the shift to sustainable energy and for changing industrial, energy, and economic systems. In light of this, the renewable energy industry has to prioritize low-carbon development plans, advanced technology, and effective resource use [3]. Photovoltaic (PV) systems are widely used because of their cost-effectiveness, zero-emission operation, and abundance of energy resources.
However, there are also significant drawbacks to PV systems, including their low solar energy density and susceptibility to climatic, locational, and seasonal factors. A sizable part of the PV solar power that is engrossed is wasted as waste heat during the photoelectric conversion process. Only 15% to 18% of irradiance is normally converted into electrical power by conventional silicon PV cells [4,5]. This heat buildup lowers PV systems’ energy conversion efficiency and module longevity; a temperature increase of 20 °C may result in a 15% decrease in power production [6]. The surface temperature of PV modules can rise beyond 66 °C during the sweltering summer months [7]. Consequently, recovering and using this surplus heat offers a viable way to improve energy efficiency while shielding PV modules from thermal deterioration [8].
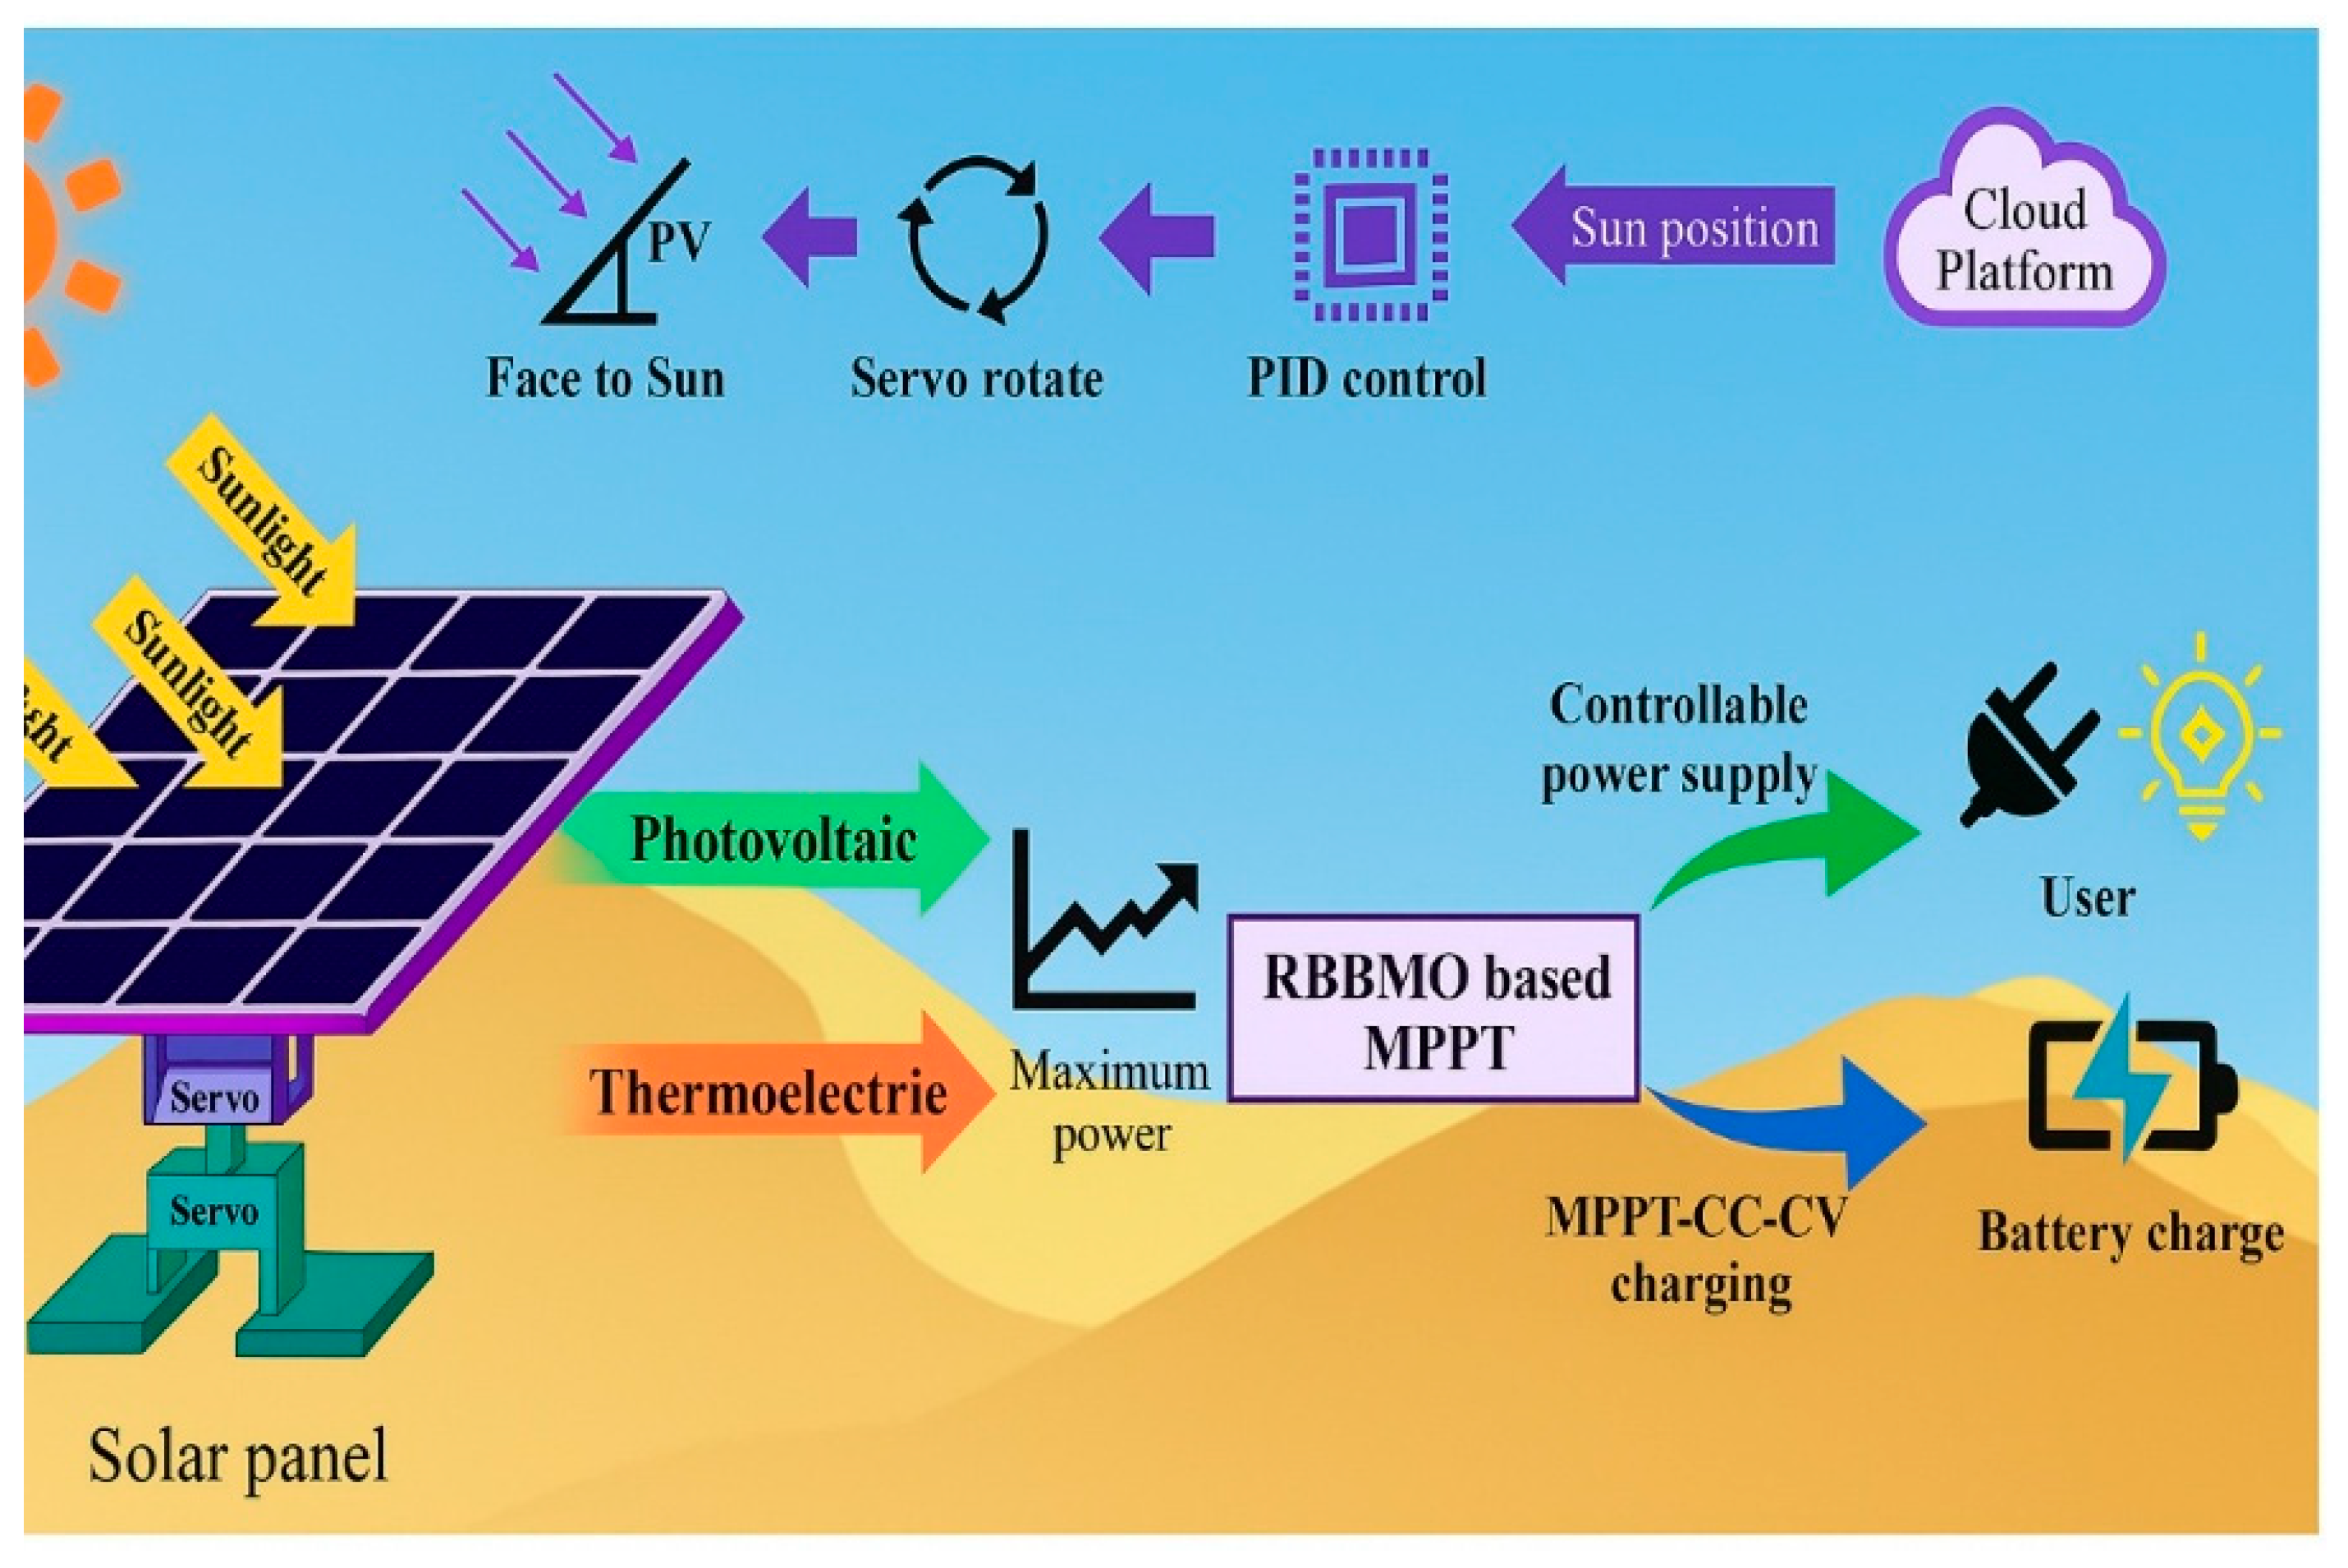
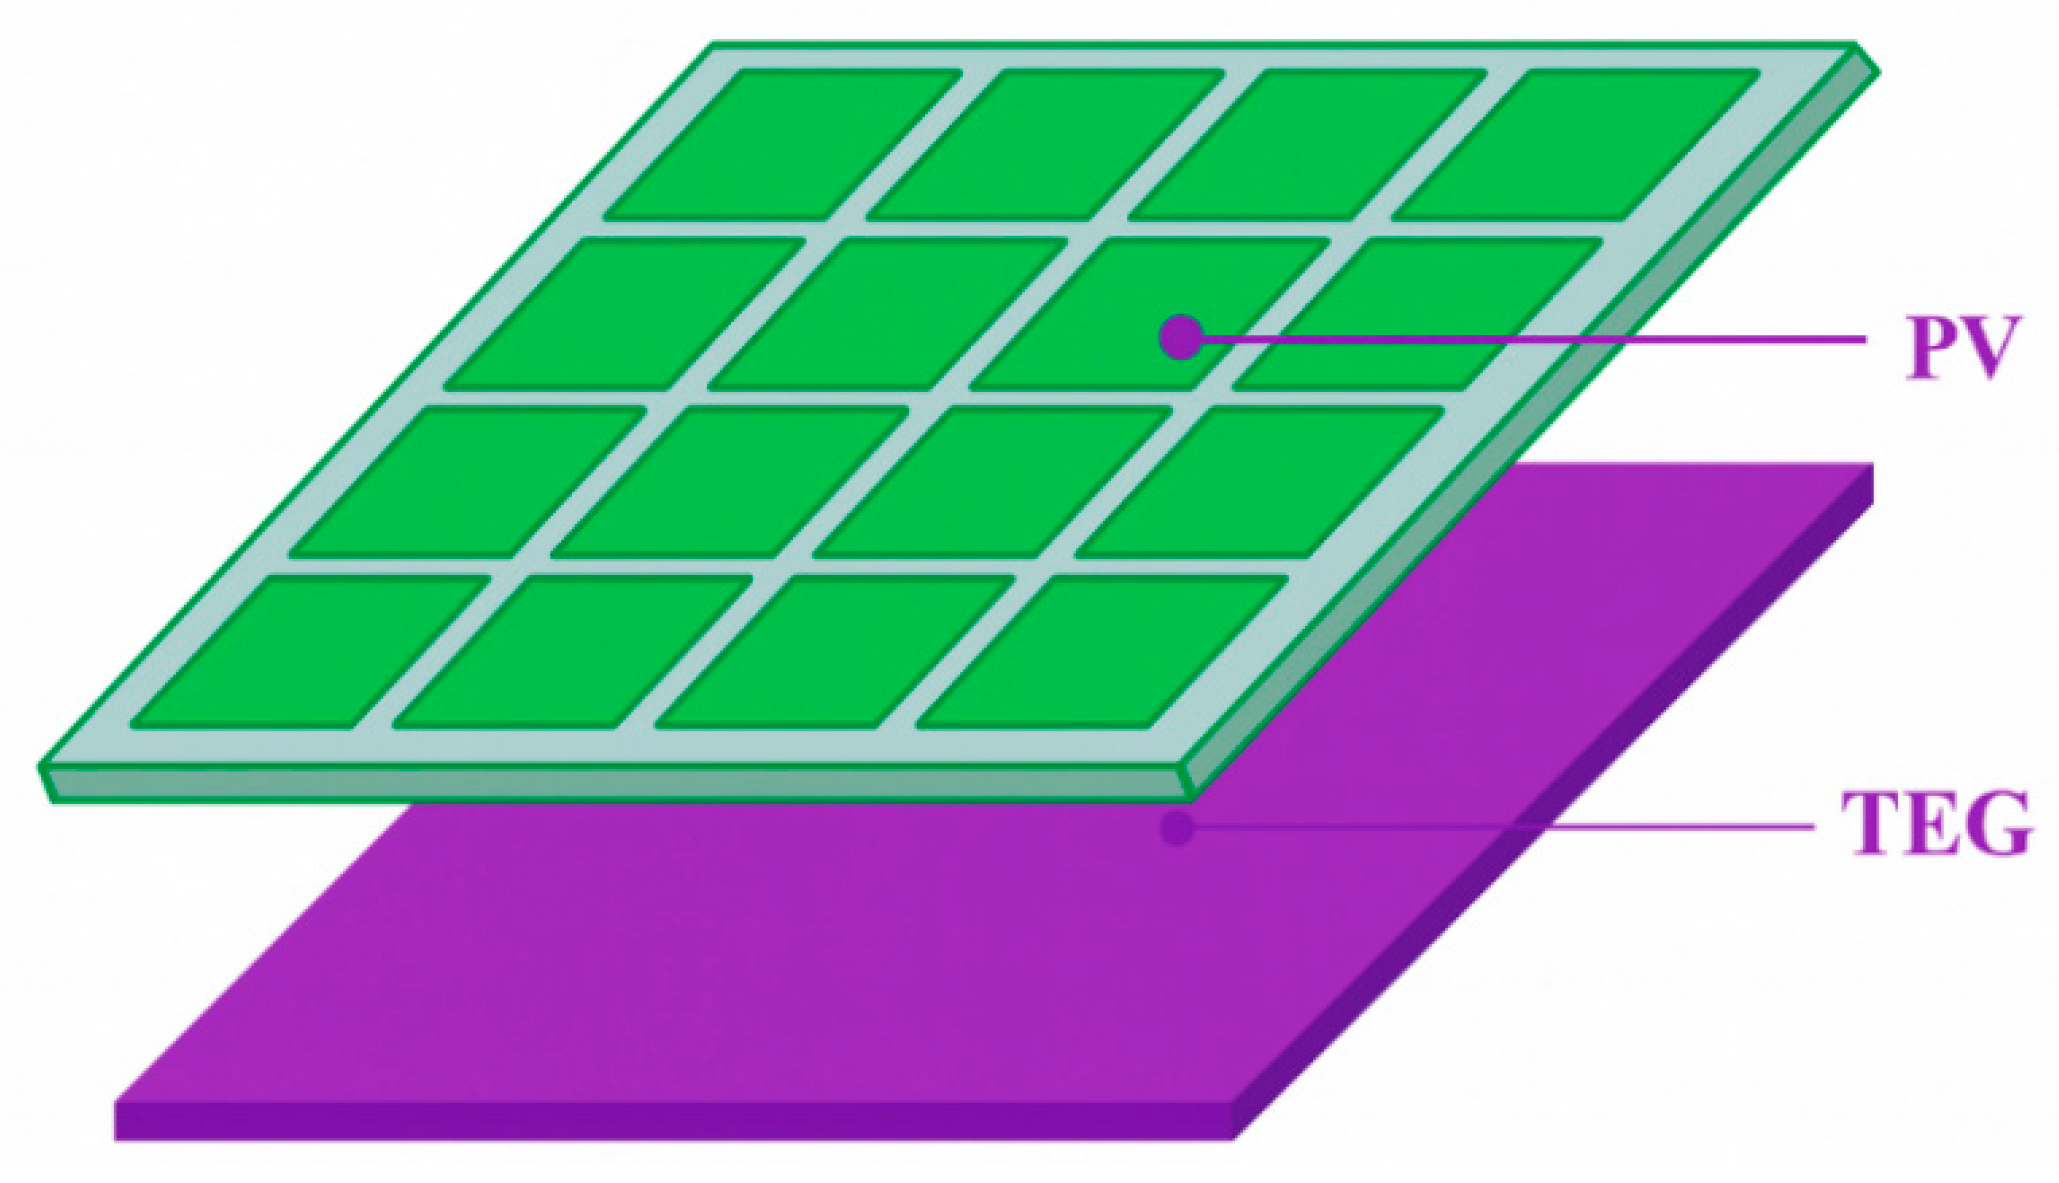
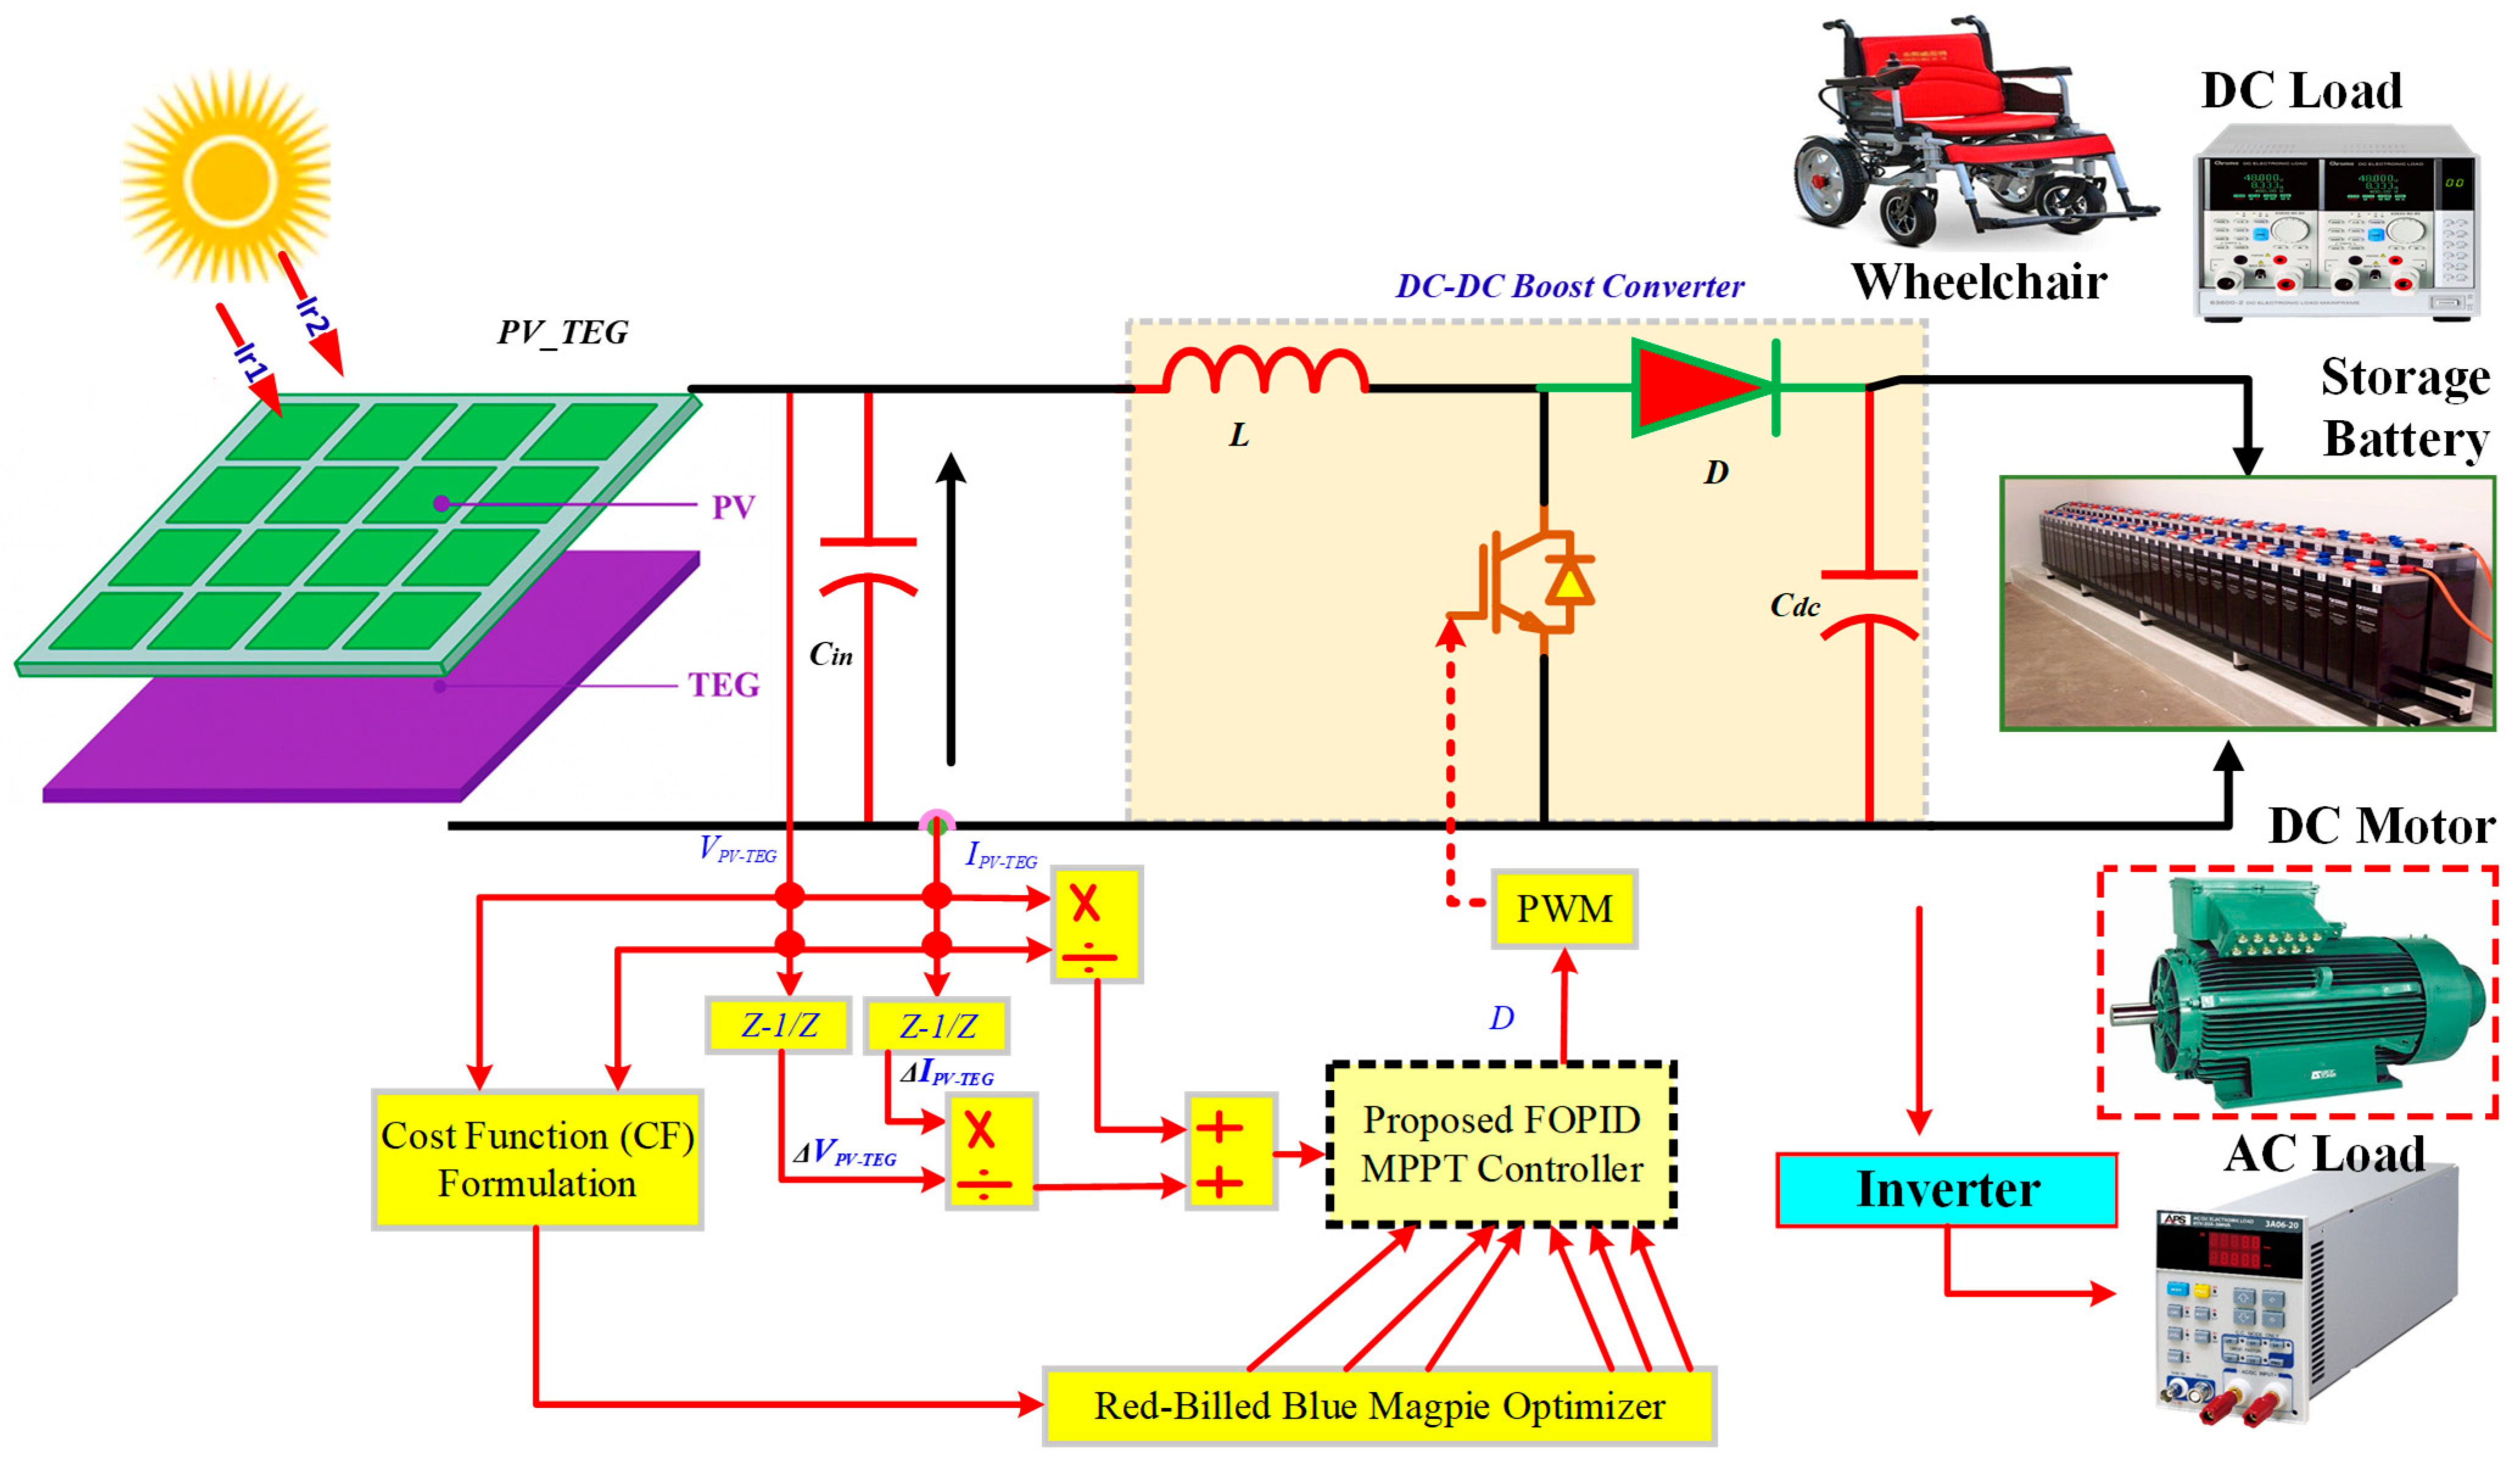
For the above purpose, this work investigates the integration of PV systems with thermoelectric generator (TEG) modules [9] to efficiently harness waste heat, sometimes known as a hybrid PV-TEG system [10]. TEGs, which rely on the Seebeck effect [11], can transform them into a feasible method for capturing residual heat. Thus far, numerous hybrid PV-TEG designs have been created [12], with total power generated output gains ranging from 3% to 16% over standalone PV panels. These hybrid systems take advantage of the passive cooling effects of TEG components to improve energy generation and PV module operating dependability [13,14]. Under PV panels, TEG modules are mounted in this way [15]. Real-world environmental circumstances, on the other hand, are dynamic and ever-changing [16]. The PV array is often affected by partial shadowing circumstances (PSCs), which are produced by impediments such as trees, buildings, or clouds [17]. The hotspot effect is a phenomenon wherein these shading effects cause localized spikes in PV cell temperatures. In addition to reducing energy conversion efficiency, this extreme heat accumulation may permanently harm the structural integrity of PV modules [18]. Furthermore, with several local maximum power points (LMPPs) [19], such hybrid setups invariably result in non-uniform thermal distribution (NTD) [20] among TEGs, further warping the system’s overall output characteristics. A reliable and precise maximum power point tracking (MPPT) method that can dynamically find the global maximum power point (GMPP) is, therefore, both necessary and difficult, especially in complicated situations with changing temperature and irradiance [21]. The architecture of such a combination system is depicted in Figure 1, emphasizing how the parts are set up to maximize energy output.
Several MPPT techniques, which may be broadly divided into conventional approaches and intelligent algorithms, have been developed for both standalone PV/TEG systems and combined PV-TEG combinations [22]. Traditional methods like incremental conductance (INC) [23] and perturb and observe (P&O) [24] are mainly intended to track a single LMMP. Reduced energy harvesting efficiency results from their frequent inability to handle the complications brought on by several LMPPs. More sophisticated techniques are needed to overcome these constraints. Complex tracking scenarios are a good fit for model-free meta-heuristic algorithms because of their superior ability to simplify solution complexity and improve self-adaptive capabilities. To maximize power extraction for PV and TEG systems, for example, better moth flame optimization [25] and horse herd optimization (HHO) [26] have been specially proposed. The grey wolf optimizer (GWO) and cuckoo search (CS) are combined in reference [27] to improve convergence speed and stability, which in turn improves system performance. The use, benefits, and drawbacks of the existing MPPT techniques for PV panels are thoroughly reviewed in [28]. Additionally, methods for improving TEG outputs based on dynamic surrogate models are presented [29].
However, there are currently very few representative studies available, and research especially focusing on hybrid PV-TEG MPPT control is still somewhat restricted. For the integrated PV-TEG mechanism systems, Reference [30] creates an MPPT approach based on an arithmetic optimization algorithm (AOA), which is verified in the existence of an irregular temperature distribution. Nevertheless, it has a limited capacity for investigation in intricate search areas. In addition, the atomic orbital search (AOS) optimization used in [31] to guarantee steady power extraction performs worse in situations when there are several local optima, and its convergence slows down as the optimization progresses. Notably, only a limited range of benchmark algorithms is used in both AOA and AOS research, which restricts the results’ potential to be applied broadly and persuasively, particularly in a variety of realistic operating settings. In the meanwhile, work in [32] shows improved power output by using the salp swarm algorithm (SSA) to enhance MPPT performance under PSCs. A combined PV-TEG system with a c-RIME optimizer is proposed in [22] for robust MPPT, achieving up to 126.67% higher energy output under complex operating conditions. In [33], a PV-TEG system integrating MPPT with double-axis solar power tracking achieved 98.93% efficiency, boosting output power by 71.73% and PV efficiency by 10.01% compared to fixed systems. However, in highly stochastic conditions, it shows a somewhat delayed stabilization and reduced energy capture efficiency. Research on this issue is still in its infancy overall and needs a more thorough examination. Despite the fact that current metaheuristic techniques have improved MPPT management in hybrid PV-TEG systems, difficulties still exist in obtaining strong adaptability, high stability, and quick convergence under a variety of dynamic environmental circumstances.
On the contrary, fractional order (FO) control (FOC) has been merged with MPPT approaches in TEG units to increase their robustness and performance measures [34,35]. FOC techniques are more flexible and have more adjustable parameters than integer order control (IOC)-based techniques, which is advantageous in control applications [36,37]. In [38], the FO-based integrator (FOI) was introduced with a modification of the INR algorithm in PV applications. The FOI gain is the scaling factor for adjusting the algorithm tracking step, and it has been tuned using the Radial Movement-based Optimizer (RMO). The technique offers an adjustable step tracking of MPP. However, because the FOI only has one adjustable parameter and the integrator term, it has little flexibility. Additionally, the literature has introduced the FO proportional-integrator (FOPI) for MPPT in TEG systems. In comparison to FOI techniques, the FOPI offers improved performance and greater flexibility due to its two distinct terms and three adjustable parameters. In order to determine the ideal FOPI parameters for the approach that is being given, the sine cosine-based algorithm (SCA) was utilized in [39]. The study in [40] proposes an MPA-optimized TFOID MPPT controller that integrates FOPID and TID techniques, achieving superior tracking speed, stability, and maximum power extraction for thermoelectric generator systems. Lastly, by combining the FOPID and TID features, certain improved FOC structures for frequency regulation have been proposed [41]. Nevertheless, more flexible and effective controllers are still required for MPPT in TEG applications [42].
Three important areas need to be investigated further in order to expand on earlier work. Initially, improvements are required to improve power extraction under various PSCs. By reducing the adverse effects of PSCs, more efficient MPPT techniques can increase system dependability and financial sustainability. Second, the majority of MPPT studies that are currently available place a strong emphasis on technical criteria like power output augmentation while paying little consideration to environmental viability and sustainability. A thorough grasp of the long-term potential and environmental advantages of hybrid PV-TEG systems as sustainable energy solutions is hampered by this oversight. Third, the actual viability of existing methods is restricted by their inadequate utilization of real-world data and their limited evaluation of various operating circumstances. To link theoretical models with real-world applications, real-world datasets are crucial.
To address these deficiencies, this work provides an effective energy harvesting approach for hybrid PV-TEG systems under a variety of operational situations, including PSCs. The key contributions are summarized as follows:
  • This research develops a PV-TEG hybrid system that synergistically enhances solar energy conversion by recycling waste heat, increasing output density, and extending PV module lifespan. A novel fractional-order controller with an optimized design is integrated to advance MPPT in PV-TEG systems, thereby improving energy harvesting efficiency and system reliability.
  • A novel adaptive fractional-order controller (FOPID) based MPPT in PV-TEG hybrid mechanism systems, designed to exploit the advantages of fractional dynamics for faster and more robust tracking under fluctuating conditions. To ensure optimal performance, the controller’s gains are simultaneously tuned using the RBBMO, which efficiently searches the parameter space and overcomes the limitations of traditional element-by-element tuning. This integration enables improved convergence, reduced steady-state oscillations, and enhanced energy harvesting efficiency compared with conventional approaches.
  • Five case studies are conducted under varying temperature, irradiance conditions, and partial shading to validate the proposed framework. A comprehensive evaluation approach is introduced, incorporating both technical performance and environmental considerations. Comparative analysis with several optimization algorithms is carried out, and statistical validation confirms the superior efficiency and robustness of the proposed RBBMO-based controller optimization.
  • Compared with eight baselines, AOS (Atomic Orbital Search Optimization Algorithm), PSO (Particle Swarm Optimization), MFO (Moth–Flame Optimizer), SSA (Salp swarm algorithm), GHO (Grasshopper Optimization), RSA (Reptile Search Algorithm), AOA (Arithmetic Optimization Algorithm), and P&O, the proposed tracker is consistently the fastest and most energy-efficient: it reaches 95% of the MPP in 0.06 s, settles within 0.12 s (±1%), and harvests 1950 W·s at start-up (vs. 1910 W·s for AOS, 1880 W·s for PSO, and 200 W·s for P&O).
Table 1 synthesizes the method-family trade-offs relevant to hybrid PV-TEG control. Local trackers (P&O, IncCond, integer-order PID) are attractive for their simplicity and speed but are inherently myopic on the multi-peak P-V surfaces produced by partial shading and hybrid coupling, which leads to local-peak lock-in and ripple. Fuzzy and data-driven controllers can handle nonlinearities without explicit models, yet their behavior depends strongly on rule/training quality and may drift outside the training envelope. Meta-heuristics provide global search capability, improving GMPP capture, but typically converge more slowly and can induce duty oscillations unless bounds, damping, and seeds are well specified. At the architectural level, dual-MPPT simplifies per-source tuning but risks cross-coupled oscillations on the common DC bus, whereas a centralized PV-TEG MPPT targets the system-level optimum at the cost of higher controller complexity. Against this backdrop, the proposed adaptive FOPID combines a fast local FOPID core (fractional orders shaping speed/ripple) with bounded meta-tuning to retain GMPP-level robustness while keeping oscillation low and settings reproducible.
Here is the framework for the rest of the work; the system modeling details are covered in Section 2, while the methodology design and implementation framework are described in Section 3. Section 4 presented and analyzed the case study results. The conclusion and future work are finally compiled in Section 5 for further investigation.

2. PV-TEG Hybrid System Modeling

A hybrid PV-TEG mechanism system boosts the PV solar power utilization by combining PV cells, which convert sunlight into electricity, with TEGs, which exploit the Seebeck effect to convert temperature differences into power. PV modules in this arrangement absorb UV and direct sunlight, and TEGs collect any leftover heat and move it to a heat sink to increase efficiency. Together, they broaden the usable energy spectrum, recover waste heat, and ensure more stable and reliable energy generation under varying conditions, with dual MPPT controllers and booster circuits enabling optimal power extraction [48].

2.1. PV Model

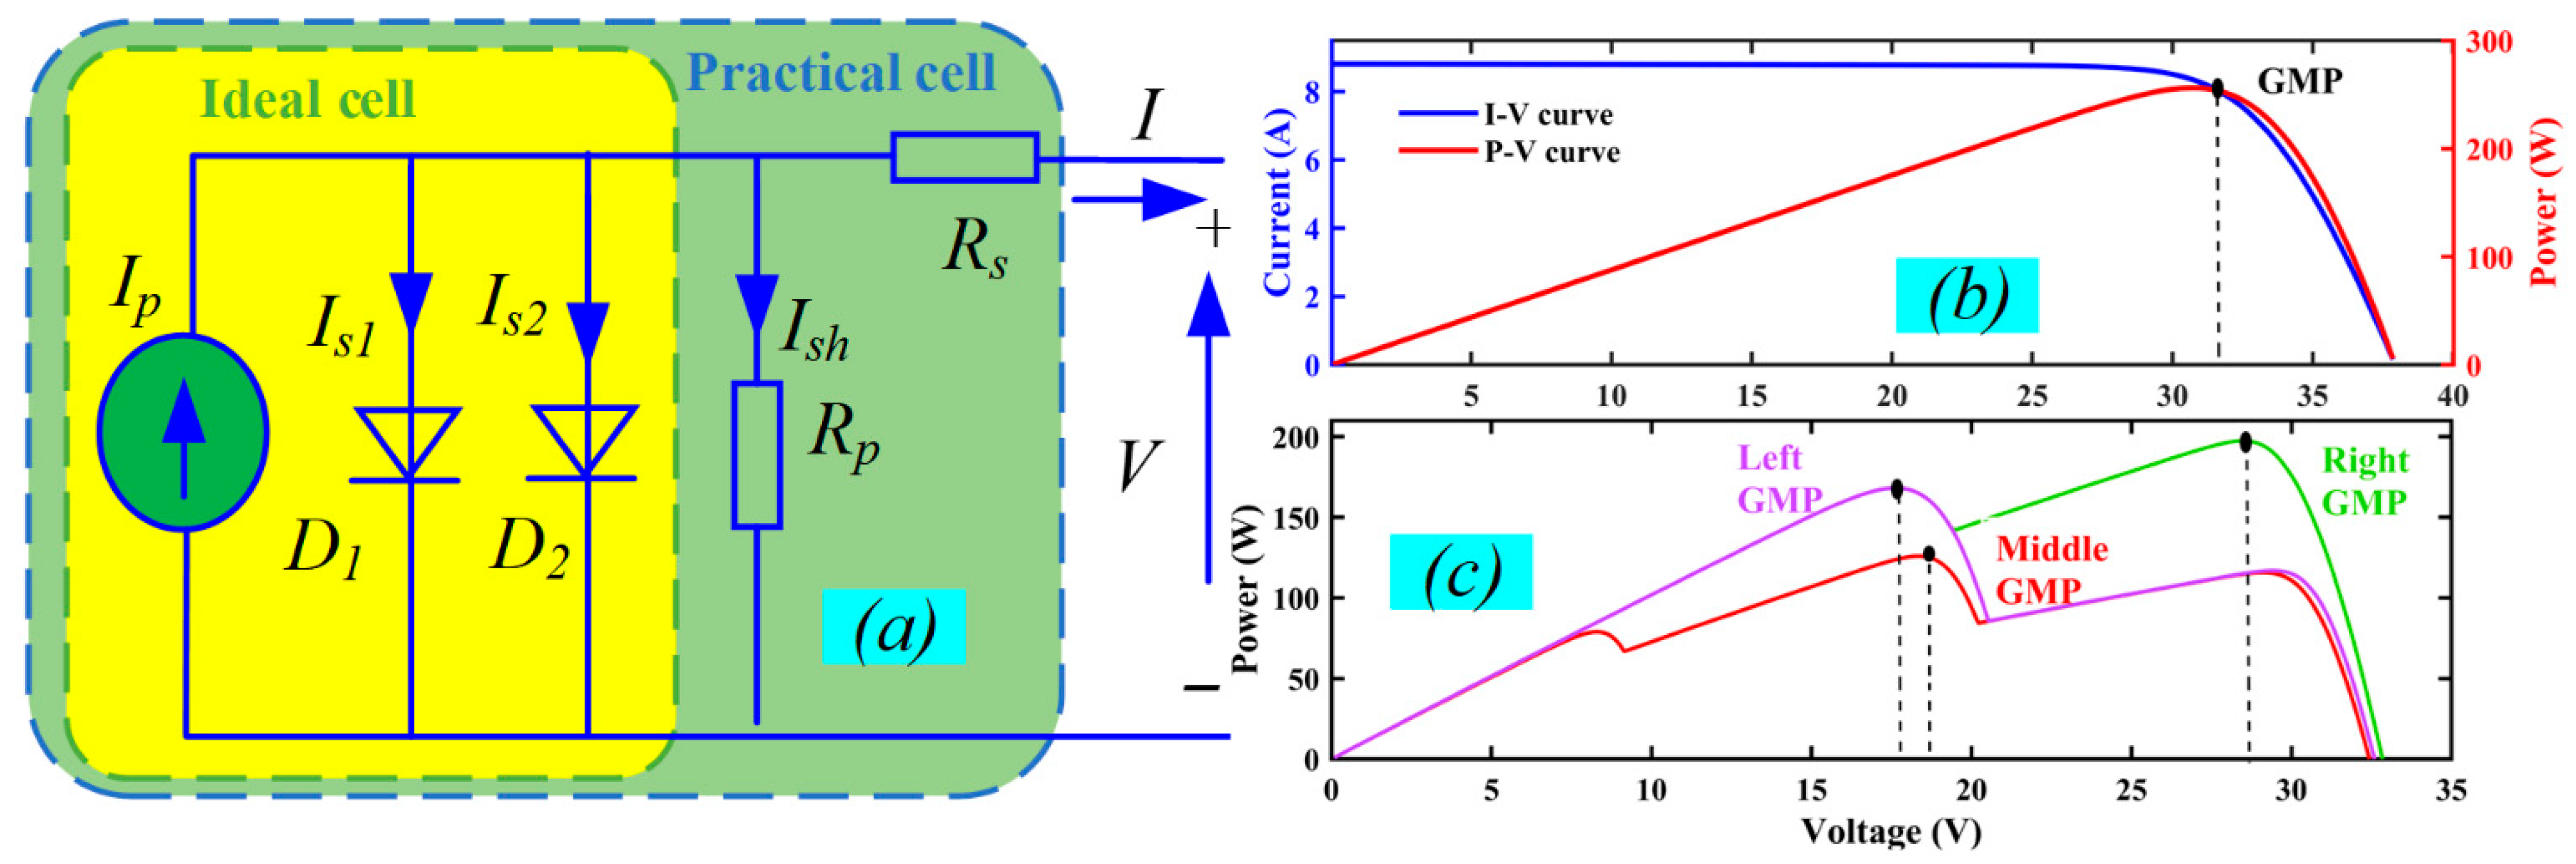
A single diode type and a twin diode model are the two variants available for PV. The dual diode model will yield more accurate results than the single diode model, which produces more accurate I-V curves at low irradiation circumstances, when accounting for computational errors. Figure 2a depicts the twin diode concept for solar cells. Nevertheless, the P-V and I-V curves produce several maxima when these bypass diodes are activated. The shade patterns’ temporal variation is selected to guarantee the occurrence of the three accessible GMP scenarios (GMP at the beginning, GMP at the middle, and GMP at the end). The PV’s comparable circuit model and V-I/P-I curve are shown in Figure 2b,c [49].
In this model, two diodes (d1, d2) indicate the P-N junction. Additionally, an electric current source (Iph) provides the photocurrent; an in-series resistance (Rs) compensates for Joule impact distortions, and a resistor called a shunt (Rsh) depicts the current of leakage. In accordance with the current law of Kirchhoff (KCL), the current equations for a photovoltaic cell predicated on the single-diode paradigm may be stated as Equations (1)–(5) [50].
I P V c e l l = I p h I d 1 I d 2 I s h ,
I p h = ( I s c + K i ( T T S T C ) ) G G S T C ,
I d 1 = I s c 1 exp V P V c e l l + R s I P V c e l l a 1 V t h 1 1 ,   I d 2 = I s c 2 exp V P V c e l l + R s I P V c e l l a 2 V t h 2 1 ,
I s h = V P V c e l l + R s I P V c e l l R P ,
I s c = I s c S T C R P + R s R P
where Vth1,2 = a1,2k (T/q), where T is the junction P-N temperature, k is Boltzmann’s constant (1.38 × 10⁻²³(J/K)), and q is the 2 arge (1.602 × 10⁻¹⁹ C). Isc1 and Isc2 are the reverse saturation currents of the diodes, and a1 and a2 are the ideality factors of the diodes. Equation (6) is obtained by substituting the resistor’s current and the diode current.
I P V c e l l = I p h I s c 1 exp V P V c e l l + I P V c e l l R s N s V t h 1 1 I s c 2 exp V P V c e l l + I P V c e l l R s N s V t h 2 1 V P V c e l l + I P V c e l l R s R P
The power-generation efficiency of a PV module is calculated using the following formula, Equation (7) [51]:
η P V c e l l = P P V c e l l G A P V c e l l
where the generated power is denoted by PPV, and the exterior area of the visible solar cells is indicated by APV.

2.2. TEG Modeling

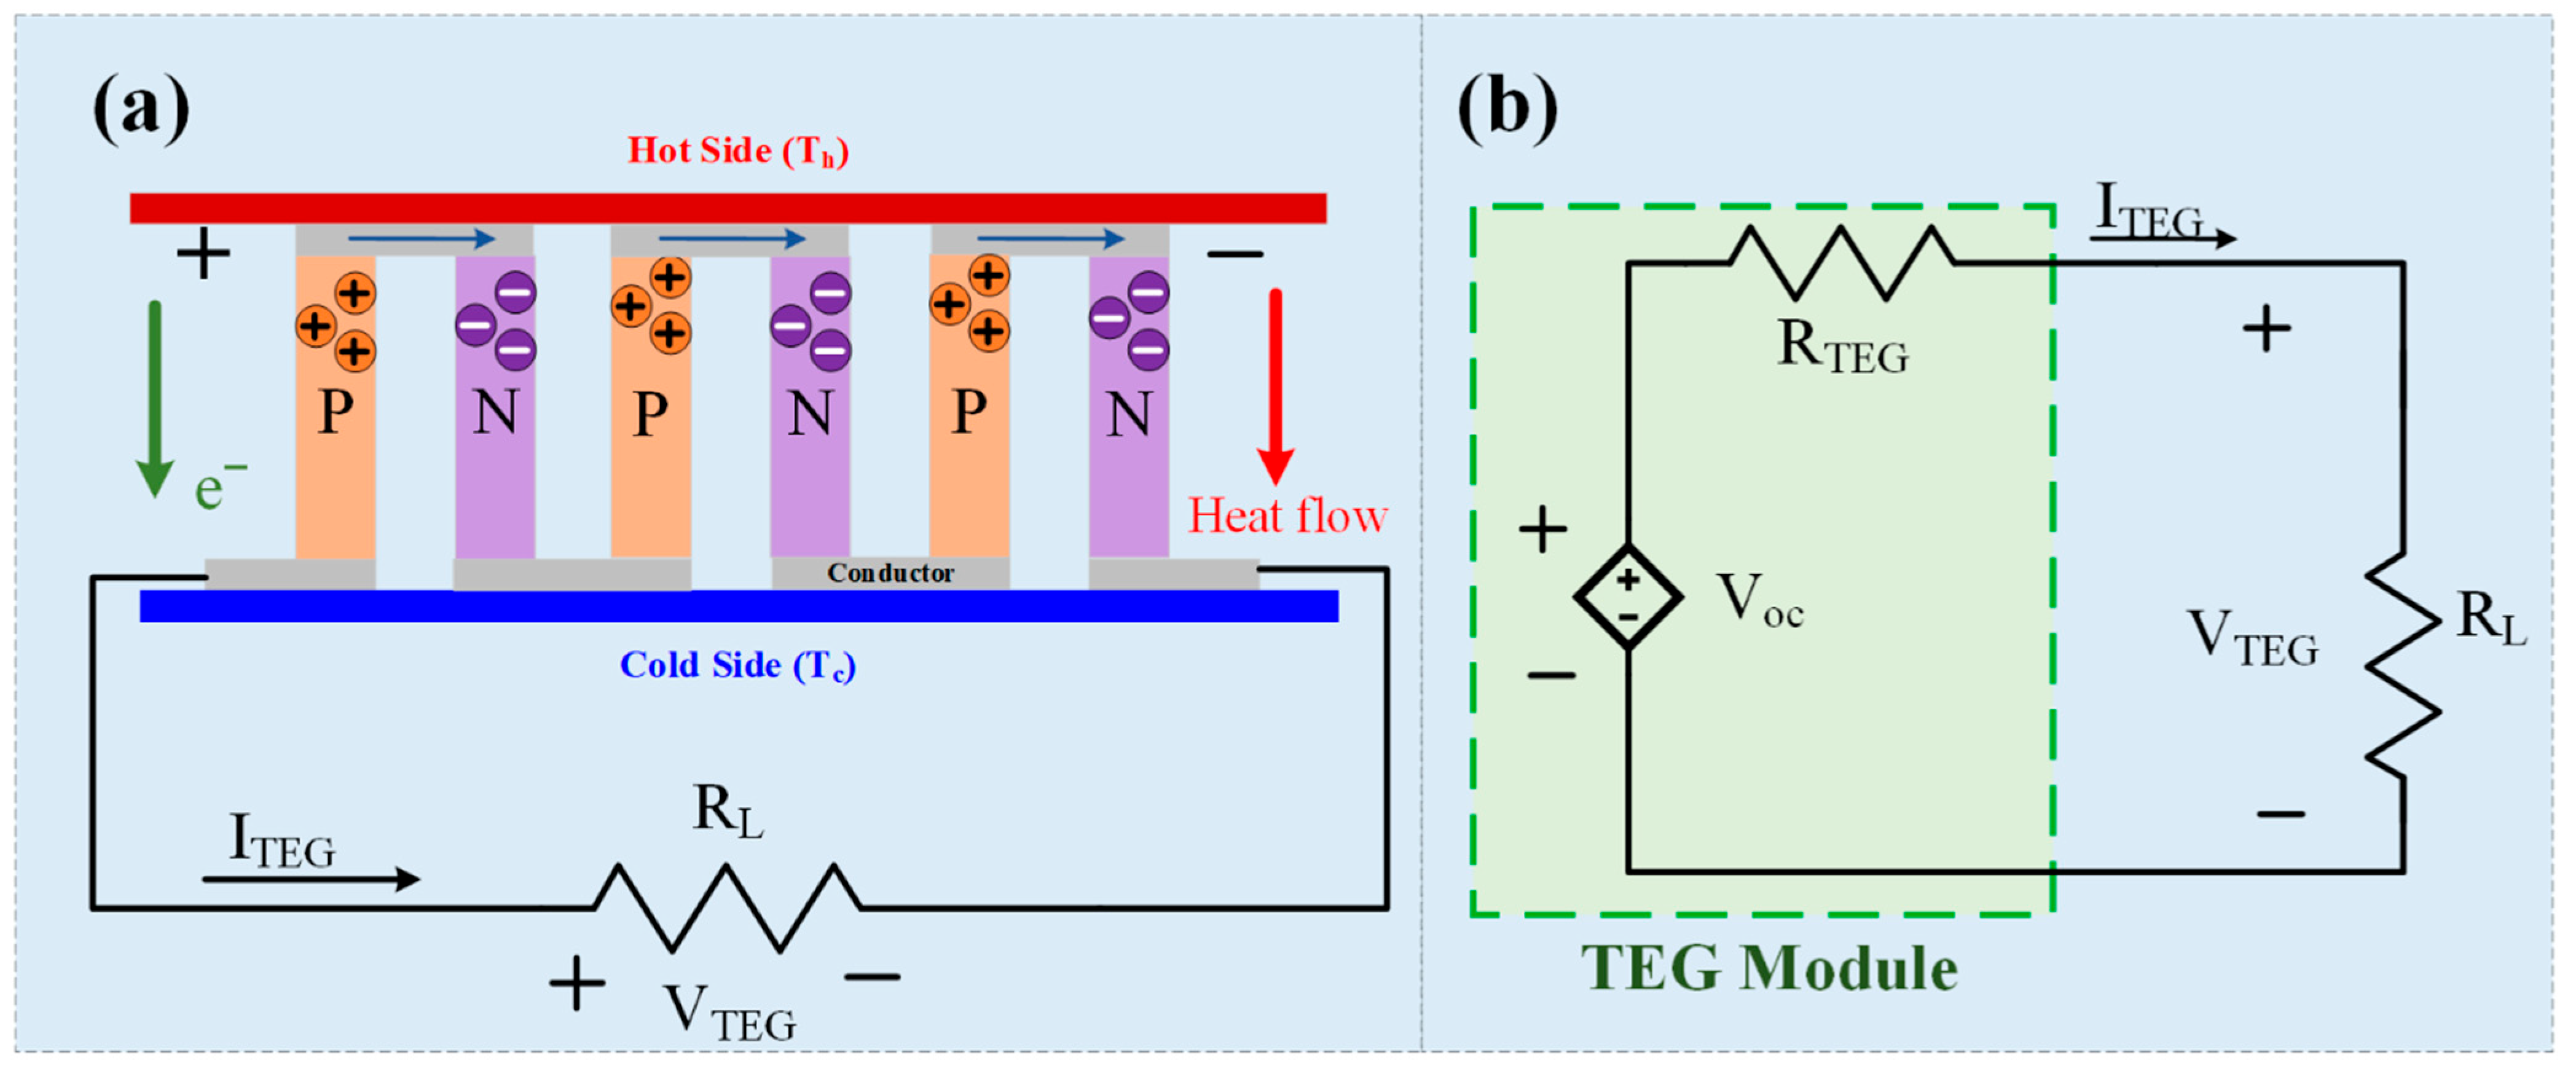
The Seebeck phenomenon-based TEG system modularly transforms thermal energy into electric power, making the gadget a power-capturing device. In a typical TEG circuit, as seen in Figure 3a, several thermocouples are linked electrically and thermally in parallel across two porcelain surfaces. Figure 3b shows that the electric analog circuit of the TEG modules is represented by the inner resistance that is linked in series with the voltage generator.
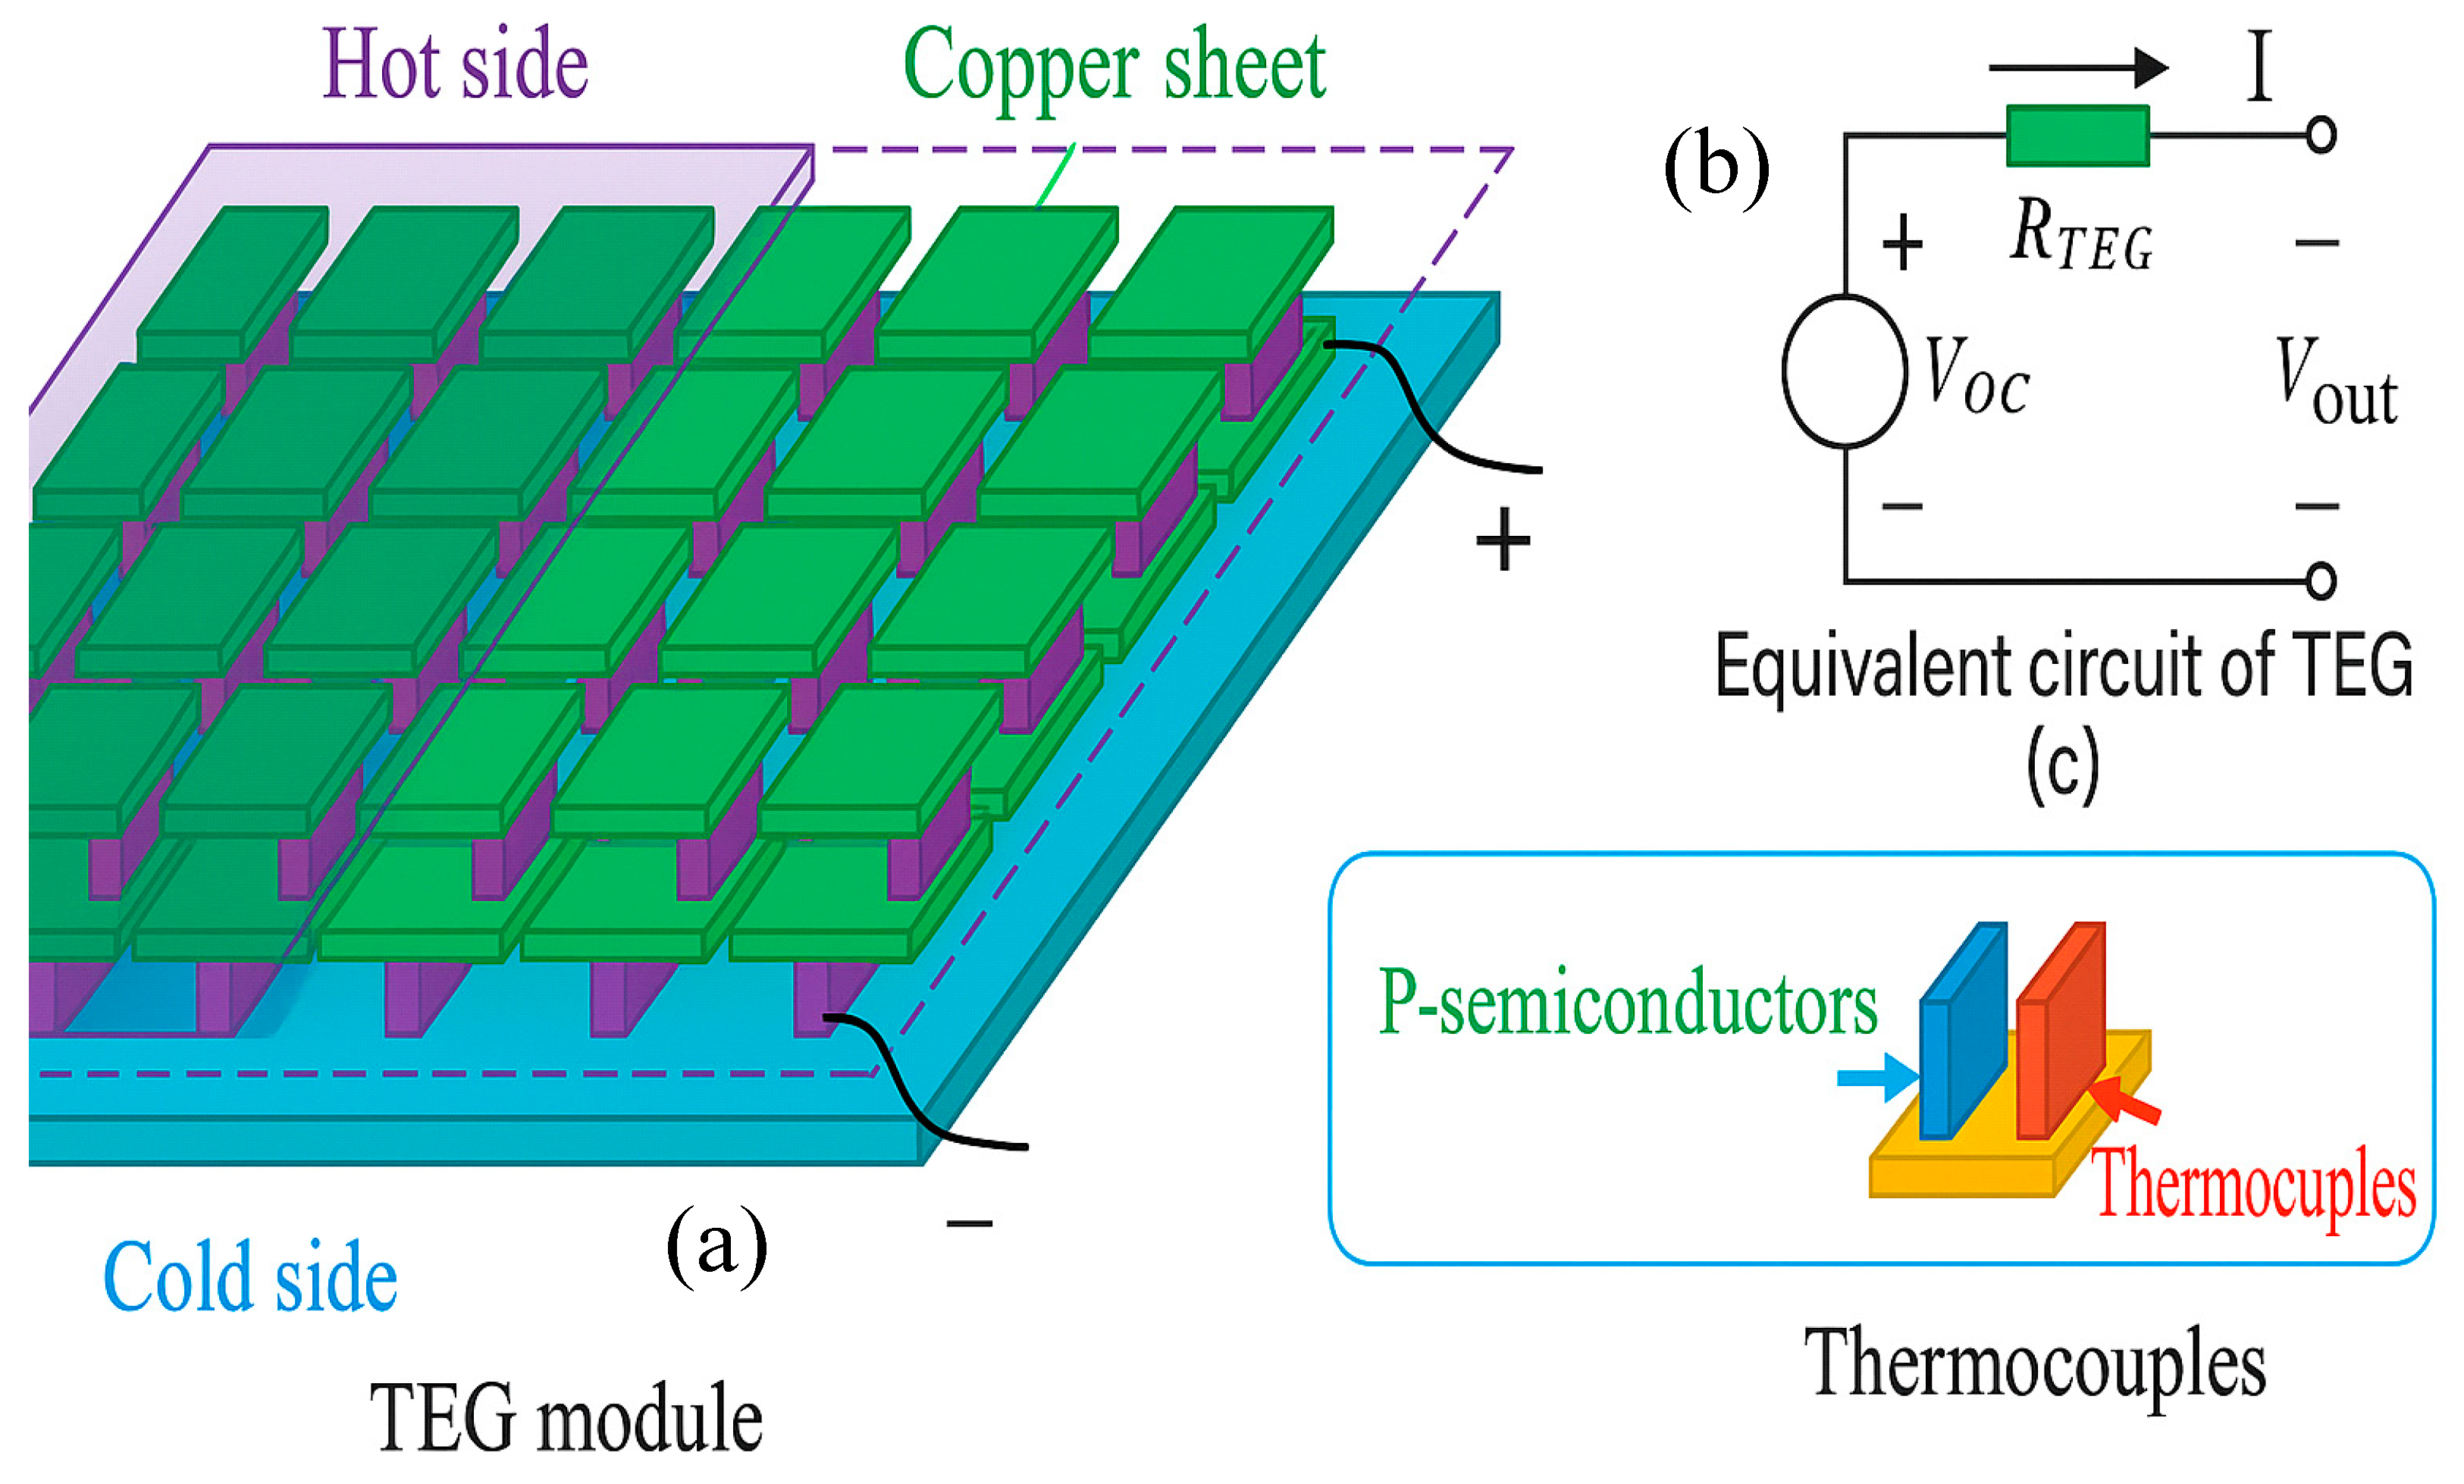
Figure 4a depicts the TEG module, which is made up of thermocouples linked in series to produce energy using the Seebeck effect. Figure 4b shows the thermocouples. As seen in Figure 4c, the TEG module may be represented as a voltage source connected in series with an internal resistor. The open-circuit voltage, Voc, and the internal resistor, RTEG, both change in response to temperature variations.
The TEG module creates a magnetic pull when the outside temperatures of the ceramic surfaces vary:
V o c = α p n ( T h T c ) = α p n × Δ T
where αpn is the Seebeck factor, Voc is the OCV, and ΔT is the variation between Th and Tc, the interior temperatures of the hot and cold sides, respectively. The output current (ITeg) flows to the load when the TEG module is connected to it, and the output voltage (VTeg) is generated across the load. The following is an expression in mathematics for the Seebeck coefficient as an expression of the ambient temperature [30]:
α p n ( T ) = α 0 + α 1 ln ( T / T 0 )
where α0 is the Seebeck factor’s fundamental component, T0 is the temperature reference, and α1 is the Seebeck factor’s average rate of change. The panel’s current source may be found using the TEG Thevenin circuits in the way outlined below:
I = R o c ( R L + R T e g )
However, circuit theory may be used as a reference to calculate the TEG module’s (PTeg) output power.
P T e g = I T e g 2 × R L = V o c 2 × R L ( R L + R T e g ) 2
where RTeg stands for internal resistance and RL for load resistance. According to Equation (11), PTeg is maximum when RTeg and RL are equal. When demand is equal to TEG impedance. This may be computed in this way [22]:
P G M P = V o c 2 4 R T e g
The GMP requirement is therefore stated as follows:
V G M P = 0.5 × V o c ,   I G M P = 0.5 × I s c
where VGMP and IGMP are the voltage and current values of the TEG mechanism module within the GMP, respectively, and Isc is the short circuit current (SCC). Consequently, the GMP of the TEG mechanism module is around half that of the OCV or SCC.
To address the power and voltage requirements of real-world demands, TEG systems employ many TEG modules. Therefore, a centralized approach is typically utilized to regulate the pricing cost, as seen in Figure 5. Numerous series-connected TEG modules joined in parallel to create TEG strings comprise a centralized TEG mechanism system. Additionally, a single DC/DC converter manages GMPPT for the TEG mechanism system in this configuration. A DC/DC boost converter is utilized to regulate the MPPT of each TEG unit or string; however, due to its high cost, this method is challenging to apply in actual industrial settings. Figure 5a shows the output characteristics of the central TEG mechanism system when all TEG strings are at the same temperature. In this case, the P-V curve has a single GMP, which is comparable to the output characteristics of the TEG mechanism module. Thus, the output power of the TEG mechanism system (PTeg,s) is equal to the sum of the power of all TEG mechanism modules:
P T e g , s = j = 1 N P T e g j = j = 1 N ( V T e g j × I T e g j )
where N is the total number of TEG mechanism units utilized by the system as a whole, and V T e g i and I T e g i stand for the voltage and current of the jth TEG unit, respectively.
The P-V curve in this instance has many peaks, including multiple LMPs and one GMP. If, instead of following the GMP, the system’s GMPPT converges to the LMPs, the collecting power falls. The fundamental TEG mechanism system’s output characteristics become unstable when varied temperature circumstances are present, as shown in Figure 5b, which affects the GMP. Therefore, this study’s goal is to create a unique MPPT that will raise a centralized TEG system’s harvesting capacity at different temperatures without raising hardware expenses. The following is an explanation of the TEG modules’ heat flow rates, represented as Qh [52]:
Q h = N ( α h I T e g T h + K ( T h T c ) 0.5 I T e g 2 R 0.5 μ ( T h T c ) I T e g )
The electric current flowing through the TEG framework is denoted by ITEG, and N is the total number of thermocouples, μ is the Thomson factor, while R is an electrical impedance, and K is the thermal conductance. Lastly, a TEG module’s power production efficiency is determined using the formula below:
η T e g = P T e g Q h

2.3. Hybrid PV-TEG Modeling

The Flowchart of the lifecycle system of the integrated PV-TEG mechanism is seen in Figure 6. In this PV-TEG combination system, the PV back sheet, which is firmly attached to the TEG, is coated with insulating and extremely thermally conductive silicone resin. The PV-TEG hybrid mechanism is displayed as illustrated in Figure 7. Figure 8 illustrates a common combination PV-TEG module arrangement, where the PV panels and TEG are linked in series or parallel. Since PV cells and TEGs have the fewest power electronic switches, connecting them in series results in the least amount of power loss. As can be observed, a heat sink on one surface represents the cool side of the TEG, while PV panels on the other surface represent the hot side. In order to get greater energy conversion efficiency, this guarantees that the TEG has the appropriate amount of temperature differential. The TEG efficiently increases the solar spectrum’s utilization effectiveness in adding to gathering waste heat and lowering the PV panels’ temperature.
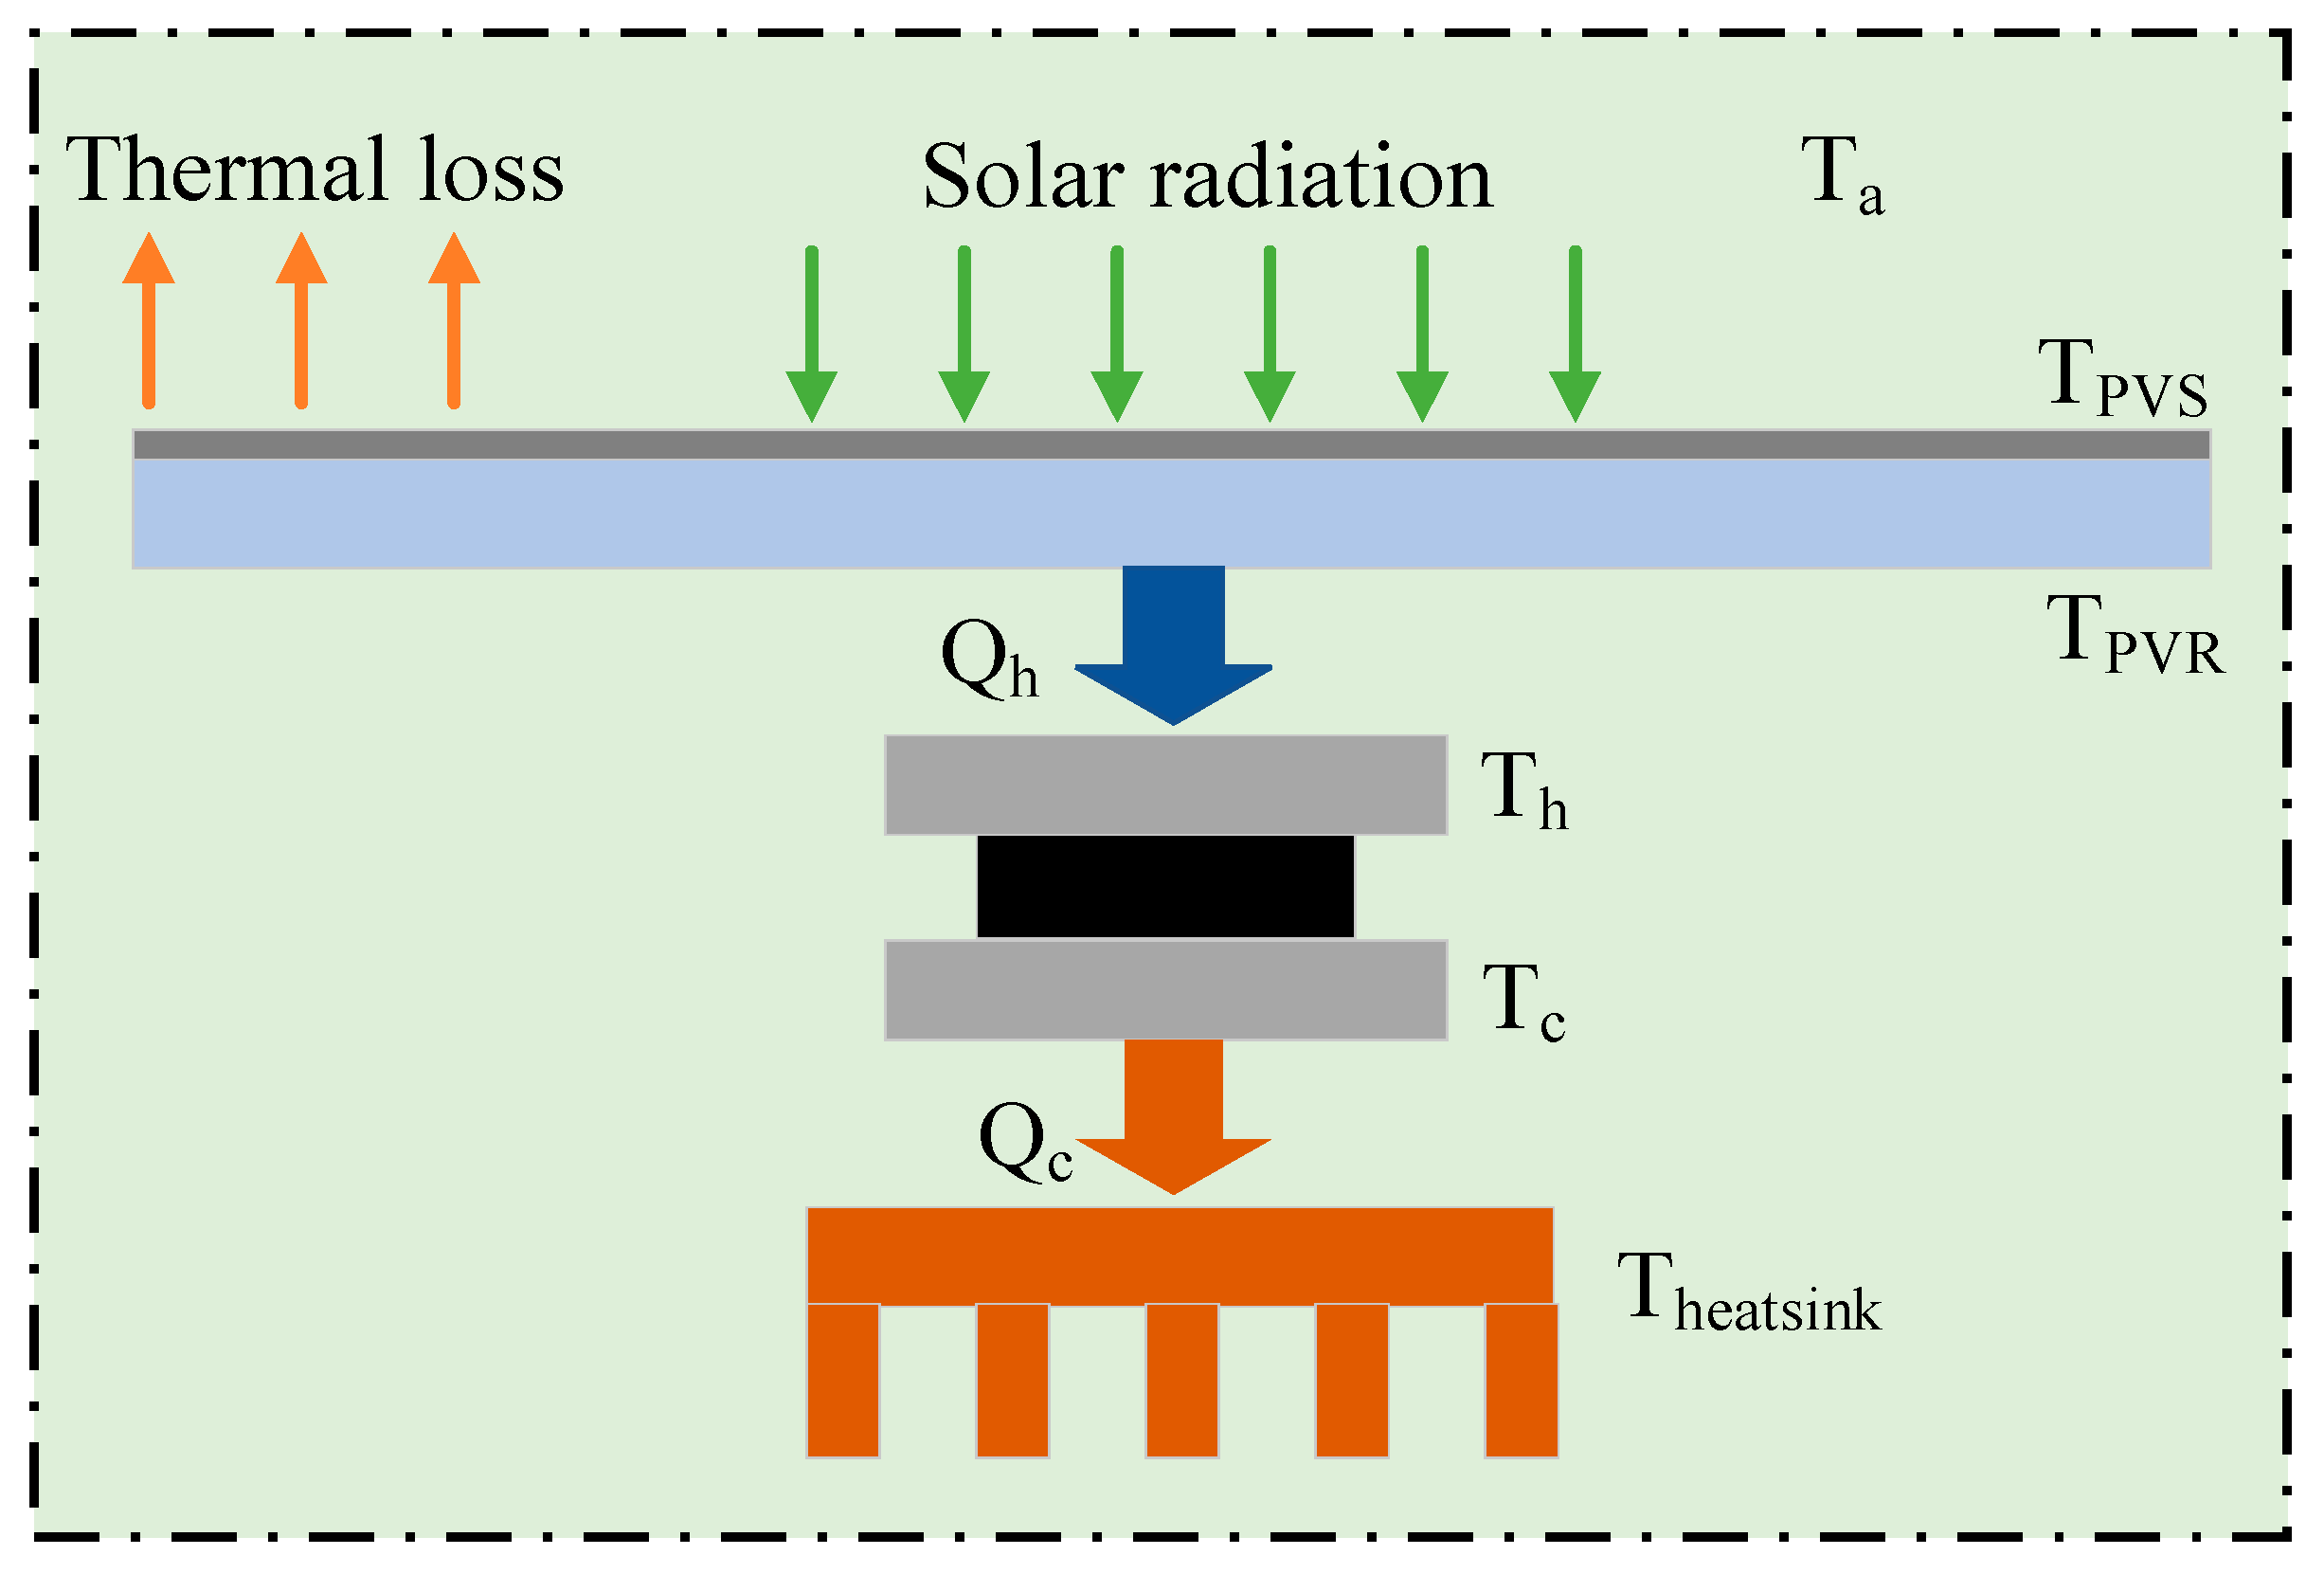
The combined PV-TEG model is depicted diagrammatically in Figure 9. Solar energy transit is considered to be one-dimensional and perpendicular to the surface of the PV panel, with limited energy transmission in other directions. Solar energy is absorbed based on the absorbance and thermal radiation characteristics of the photovoltaic panel after passing through a transparent enclosure with a certain transmission factor. The PV panel subsequently transfers the remaining heat to the hot side of the TEG module while converting a portion of the incoming PV irradiation into electrical power [53].
The heat transferred to the hot side of the TEG in the absence of heat loss is caused by the Seebeck effect, Fourier conduction, and Joule heating; this connection is mathematically stated in Equation (17) [53].
Q h = N s α I T h + T h T c R T h I 2 R E L 2
where α is the Seebeck factor of TEG, Ns is the total number of material pairs, and I is the current of electricity flowing within the TEG unit. Additionally, the electrical and thermal resistances of the thermoelectric (TE) semiconductor couple are represented by the letters REL and RTh, respectively, and can be calculated using Equations (18) and (19), which are explained in references [54].
R T h = L λ A T E
R E L = ρ L A T E
The overall temperature at the cooler end of the TEG unit can possibly be calculated using Equations (20) and (21) in the standard. In these formulas, ATE and L stand for the cross-sectional dimension and duration of the TEG device, as well as λ and σ for the thermal and electrical conductors of the substance in question [53].
Q c = N α I T c + T h T c R T h I 2 R E L 2 s
Q c = T c T h e a t s i n k R c
Using Equation (22), where Rc is the entire thermal impedance on the colder side at the substrate’s TEG contact, one can determine how much heat disappears across the heat drain.
Q c = T c T a R H S
The letter RHS stands for thermal conductivity, which is influenced by the heat drain’s form, area of surface, and the conduction of air factor. A thermoelectric generator’s energy production is directly prejudiced by the temperature differential between its hot and cold sides. The efficiency of the TEG is determined by dividing the electrical power produced by the TEG by the thermal power Qh accessing the hot region of the device (PTEG). Since temperature affects a TEG’s performance, the figure of merit ZT is used to assess its efficiency. ZT is often regulated using the Harman method. This method involves exposing the terminals of a thermoelectric circuit to DC for a predefined amount of time, after which the voltage across those terminals is measured [55,56,57].
When current passes through the TEG, the Peltier effect causes heat to be transferred from one side to the other, making the device a thermodynamic cooling device. Energy is simultaneously produced by the Seebeck effect and the temperature differential between the TEG surfaces. The voltage generated by the temp differential is known as the Seebeck voltage (VS), while the voltage generated through the current passing through the circuit is known as the VJ. As the difference between the Seebeck and Joule voltages, the Harman voltage may be described. The figure of value ZT may be calculated using Equation (23), as the literature explains [58,59,60].
Z T = V s V j
Using Equation (24) the TEG efficiency is calculated [61].
η T e g = Δ T T h 1 + Z T 1 1 + Z T + T c T h
where Th represents the hot side’s temp, Tc represents the cold side’s temp, ΔT represents the temperature variations across the TEG’s heated and cooled sides, and ZT is the temperature-sensitive measurement of effectiveness that shows how effective the TEG is based on material properties and operating conditions.
The PV-TEG Thermal Coupling Model. Solar input G over PV aperture Apv produces electrical power ηpvGApv and waste heat (1 − ηpv)GApv. A fraction ηc of this waste heat is routed to a secondary absorber → heat-pipe plate → TEG hot shoe (PV is thermally isolated), so the thermal input to the TEG path is as follows:
q = ( 1 η P V ) G A P V η c
Along the absorber → TEG → sink path, the effective series thermal resistance is as follows:
R t h = R a b s h p + R h p + R T E G + R s i n k
giving the TEG temperature lift and node temperatures:
Δ T T E G = q R t h ,   T h = T c + Δ T T E G
The PV backsheet temperature is bounded by a separate convective–radiative balance and explicitly constrained to TPV,back ≤ 85 °C, in all scenarios (PV and TEG are not in direct thermal contact). TEG electro-thermal relations. With Seebeck coefficient SSS, internal resistance Rint, and thermal conductance K, the open-circuit voltage and hot-side heat are:
V o c = S Δ T T E G ,   Q h = S T ¯ I + 0.5 I 2 R int + K Δ T T E G
and the electrical output are P = VI with efficiency η = P/Qh. At matched load (RL = Rint), the maximum electrical power is:
P max = V o c 2 4 R int = S 2 Δ T T E G 2 4 R int ,  
All parameters (ηpv, ηc, R, S, Rint, K) and their ranges are listed in Appendix A (Table A1); nominal non-concentrating operation yields ΔTTEG ≈ 40–80 K (e.g., Th ≈ 70–110 °C, Tc ≈ 25–35 °C), consistent with the field profiles used in this study.
Figure 8a,b shows the comparable circuit arrangement that takes the power outputs from the PV and TEG units and mixes them. The circuits might have parallel or series connections. The overall efficiency of the PV-TEG combination is determined by the total power generated by the photovoltaic cells and the TEG system’s efficiency. Equation (30) represents the overall energy generation of the system under the assumption that electrical power losses are minimal. Moreover, the electrical efficiency of a PV module is fixed using Equation (31), which is based on the ratio of the panel’s electric power production to the amount of solar radiation received per unit area [62].
P V P V T E G = P V P V + P V T E G ,
η P V T E G = P V P V T E G A G
where PTEG and PPV stand for the final result of power generated by the solar panel and the TEG, respectively. A is the exterior surface of the PV panel, in which G is the PV illumination energy obtained per unit area on the surface of the solar panel’s module [63].
The total energy conversion efficiency of the combination PV-TEG system may be expressed as follows:
η P V T e g = η P V + η T e g = P P V + P T e g G A P V

2.3.1. Thermal Decoupling and Safe Operating Limits

To ensure physical plausibility and PV safety, the TEG is not bonded to the PV backsheet. Instead, solar heat is collected by a secondary black-coated aluminum absorber and delivered to the TEG hot shoe through a plate heat-pipe (or heat-spreader with embedded heat pipes). The PV module is mounted on an independent frame and thermally isolated from the absorber using a low-conductivity standoff/air gap (e.g., PTFE/PEEK posts), so conductive back-heating is negligible. Throughout all scenarios, we constrain the PV backsheet temperature to ≤85 °C. Under non-concentrating irradiance and ambient 25–35 °C, this decoupled layout provides TEG hot-side temperatures of approximately 70–110 °C with ΔT ≈ 40–80 K. A high-ΔT auxiliary stress case (ΔT ≥ 120 K) is executed only on the absorber–TEG loop and does not imply PV backsheet heating.

2.3.2. Compact Thermal Model and Implications

The absorber → heat-pipe plate → TEG → sink path is represented by a series thermal resistance R t h = R a b s h p + R h p + R T E G + R s i n k , The thermal input to this path is q = ( 1 η P V ) G A P V η c , where G is the plane-of-array irradiance, Apv the PV aperture, ηpv the PV electrical efficiency, and ηc a coupling factor accounting for optical/geometry losses and plate spreading. A representative non-concentrating case (G = 1000 W/m2, Apv = 0.20 m2, ηpv = 0.19, ηc ≈ 0.6) gives q ≈ 97 W. With typical resistances (Rabs–hp ≈ 0.08 K/W, Rhp ≈ 0.15 K/W, RTEG ≈ 0.18 K/W, Rsink ≈ 0.17 K/W), Rth ≈ 0.58 K/W and ΔT_TEG ≈ q·Rth ≈ 56 K (e.g., Th ≈ 86 °C for Tc ≈ 30 °C). Recomputing all scenarios within ΔT_TEG = 40–80 K preserves the core MPPT findings—95%-to-GMPP time of 0.06 s, 0.12 s settling, ±1% ripple, and the ranking versus baselines—with scenario energies shifting by <2%, leaving the conclusions unchanged.

2.3.3. Energy Accounting and Units

All powers are measured at the DC bus and logged at 1 kHz; energies are computed with the trapezoidal rule over the stated interval. Unless noted, results are per PV-TEG test module with aperture Apv = 0.20 m2; linear scalings to 1.00 m2 and 1.0 kWp are provided where relevant. We report energy in J (kJ) and Wh (kWh) using 1 Wh = 3600 J. “Short-window energy” denotes integration over a brief horizon (e.g., the 1-s start-up window: 1.95 kJ = 0.542 Wh for one module), used to characterize transient MPPT behavior. “Daily energy” denotes the diurnal integral under measured irradiance/temperature profiles (Shanxi, non-concentrating) and includes converter losses, yielding 0.88–2.95 Wh per module. All figures/tables now state the time base (window vs. daily) and normalization (per module/per m2/per kWp) to avoid ambiguity.

3. Development of Proposed FOPID Optimized by RBBMO-Based MPPT Method

In the solar power system, the MPPT monitoring procedure is an essential link. It generates a suitable variable duty cycle that uses a pulse width modulation (PWM) generator to pulse the DC/DC converter’s switch. Because of this MPPT regulation, the PV system runs at its peak power. The following step shows the dp/dv feedback-based FOPID and PID control systems.

3.1. Control System Based on the MPPT dp/dv Evaluation Mechanism

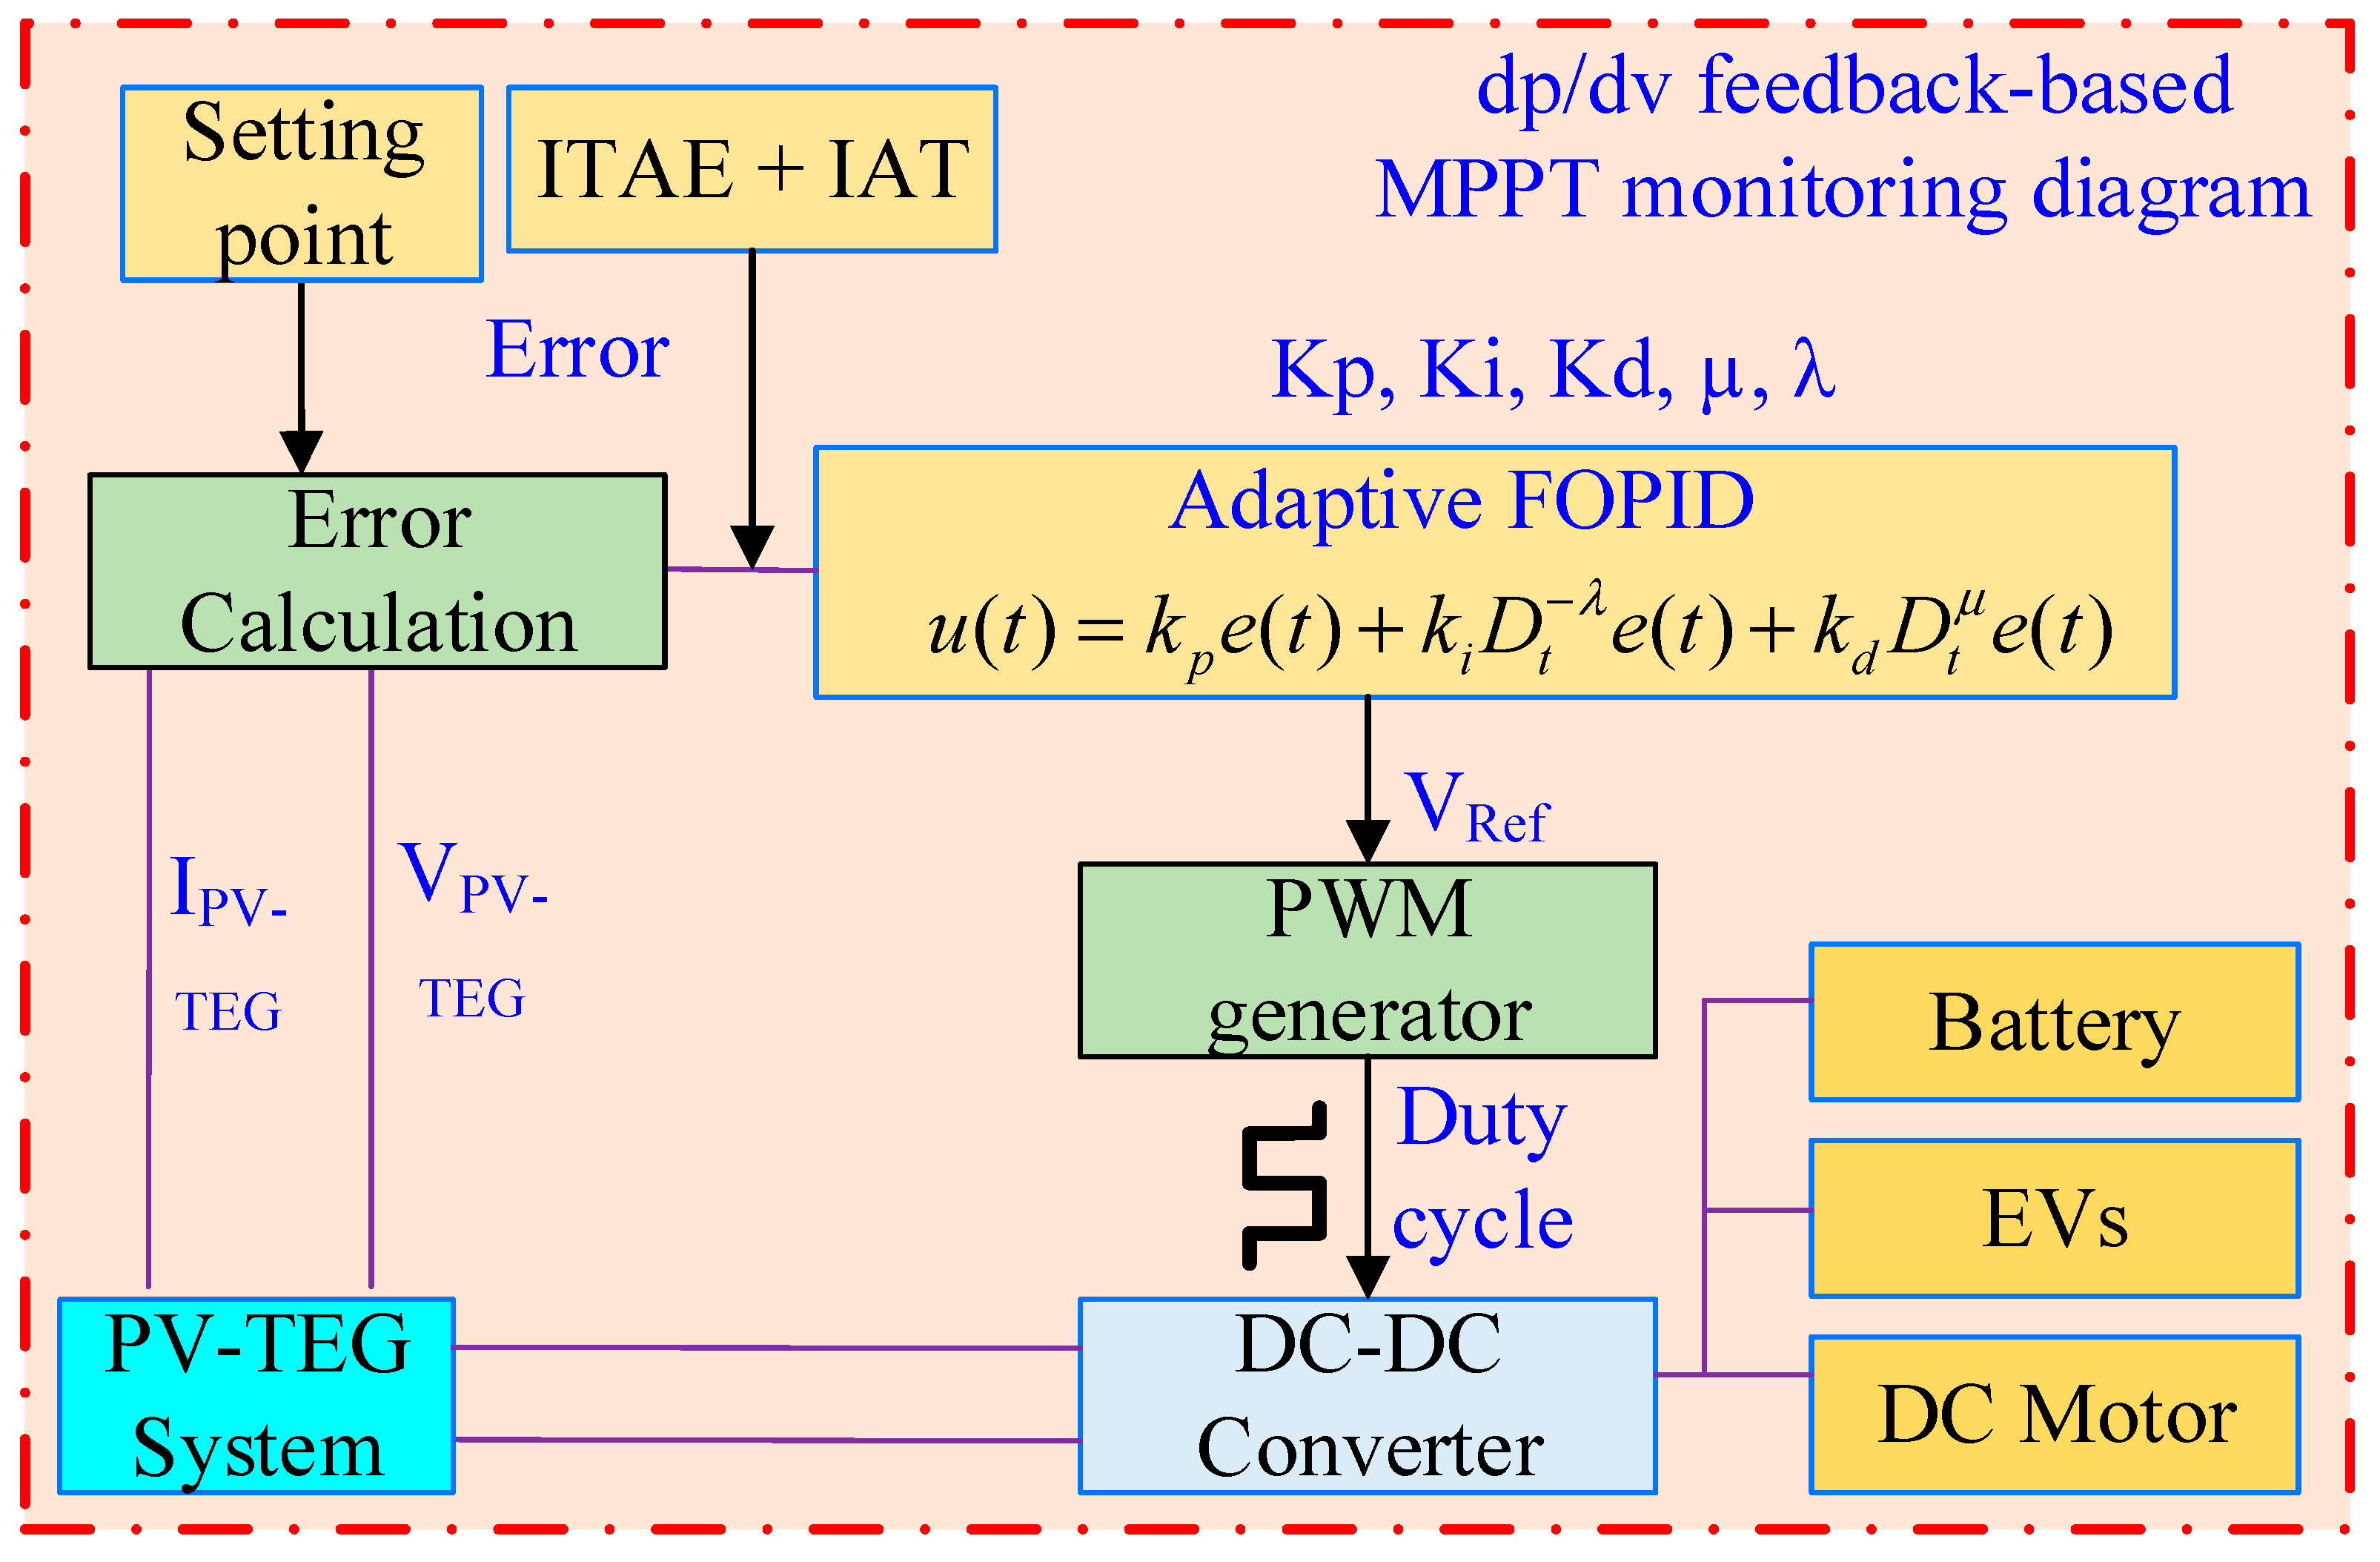
The derivative dp/dv indicates the slope of the P_V curve. Otherwise, it is evident that the MPP is at the top of the P-V curve when the slope of dp/dv is zero. In the suggested approach, the MPPT controller is referred to as dp/dv = 0. Figure 10 displays the block diagram for the dp/dv MPPT control, which calculates the slope of dp/dv and compares it to a zero-set reference point. The control approach uses the generated error value to create duty cycle sequences that feed the DC/DC converter switch gate.
Figure 10 shows that the error value, which is the controller input and represents the dp/dv slope, is activated by the PV system’s feedback mechanism. Consequently, the controller uses the PWM generator to supply an output voltage as a control signal (duty cycle variation) to the DC/DC converter switch. This study’s following paragraph compares the proposed fractional order PID (FOPID) controller to a traditional PID controller.

3.2. Fractional Calculus

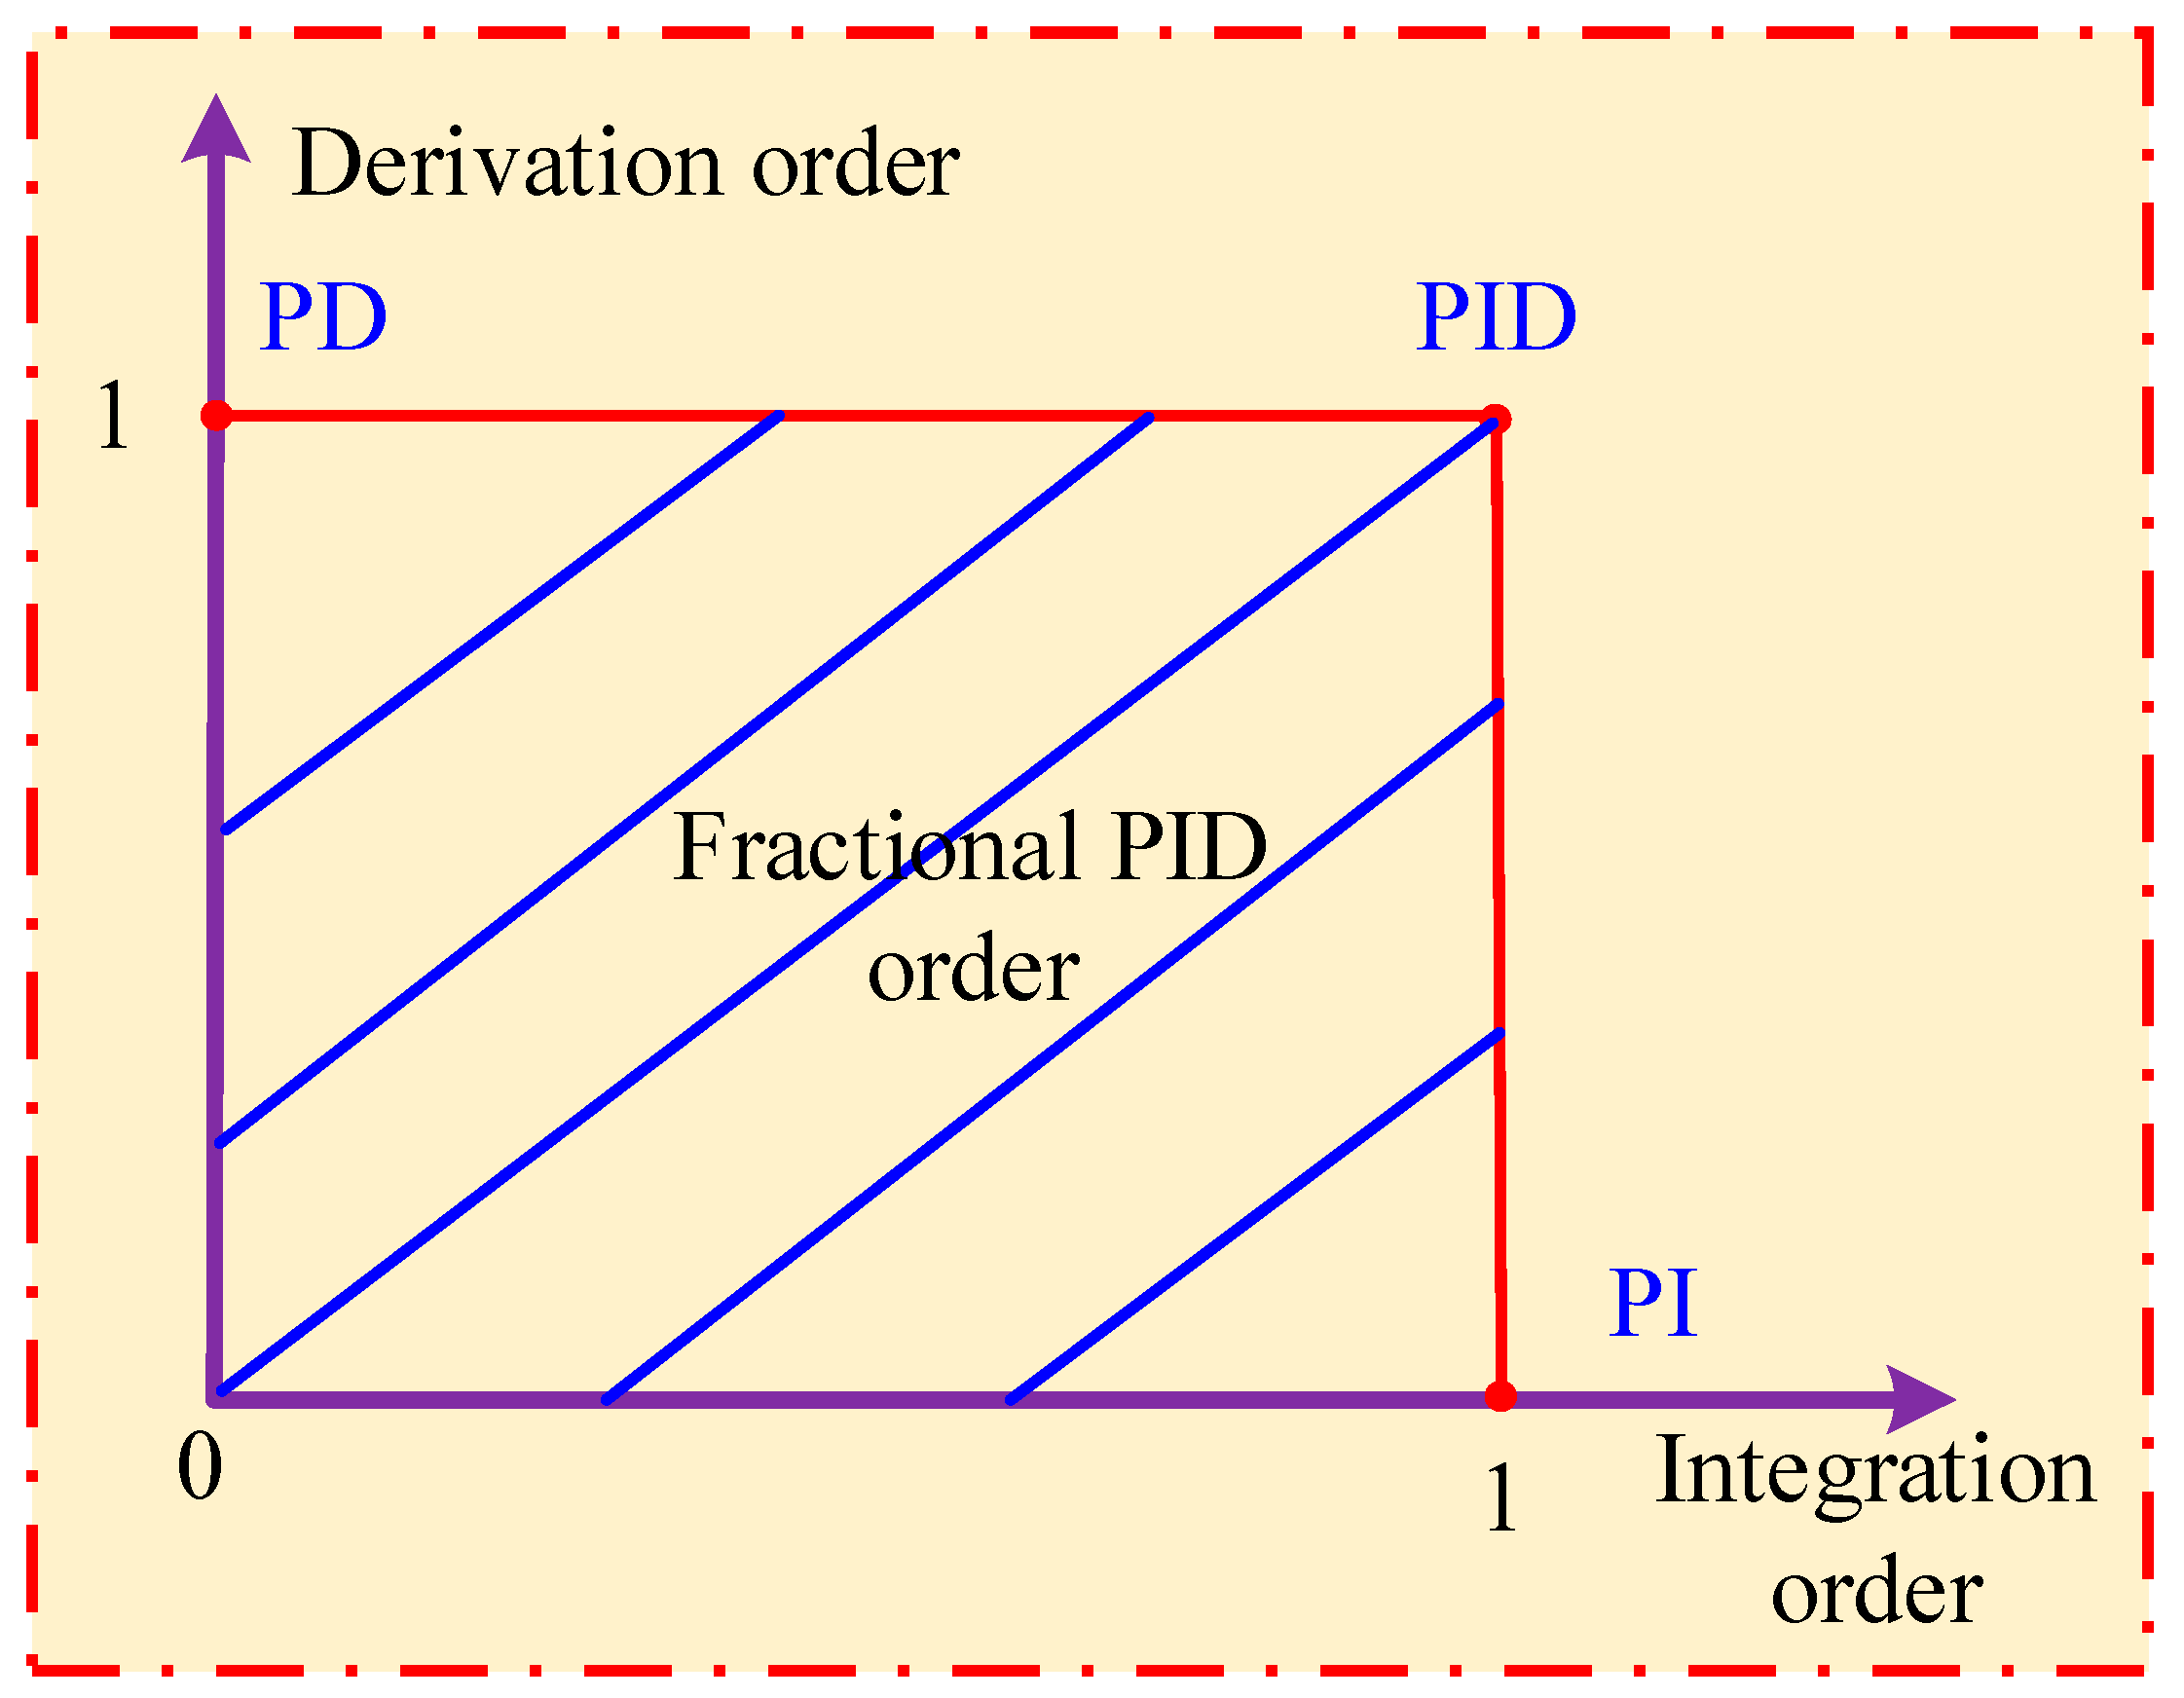
Classical calculus treats only integer-order operators (e.g., d/dx, d2/dx2). Building on ideas traced to Leibniz and L’Hôpital, fractional calculus was developed by many mathematicians and has become widely used in control engineering. Fractional-order integration and differentiation can be embedded in regulators, with distributed- and variable-order operators providing a compact generalization of the integer-order framework. Owing to their robustness to gain variations and plant uncertainties, fractional controllers have been adopted extensively in recent years. They enable smoother adjustment of gain and phase margins than integer-order designs, albeit with more tuning parameters, and can be configured to meet standard design specifications.

3.3. Classical PID Controller Description

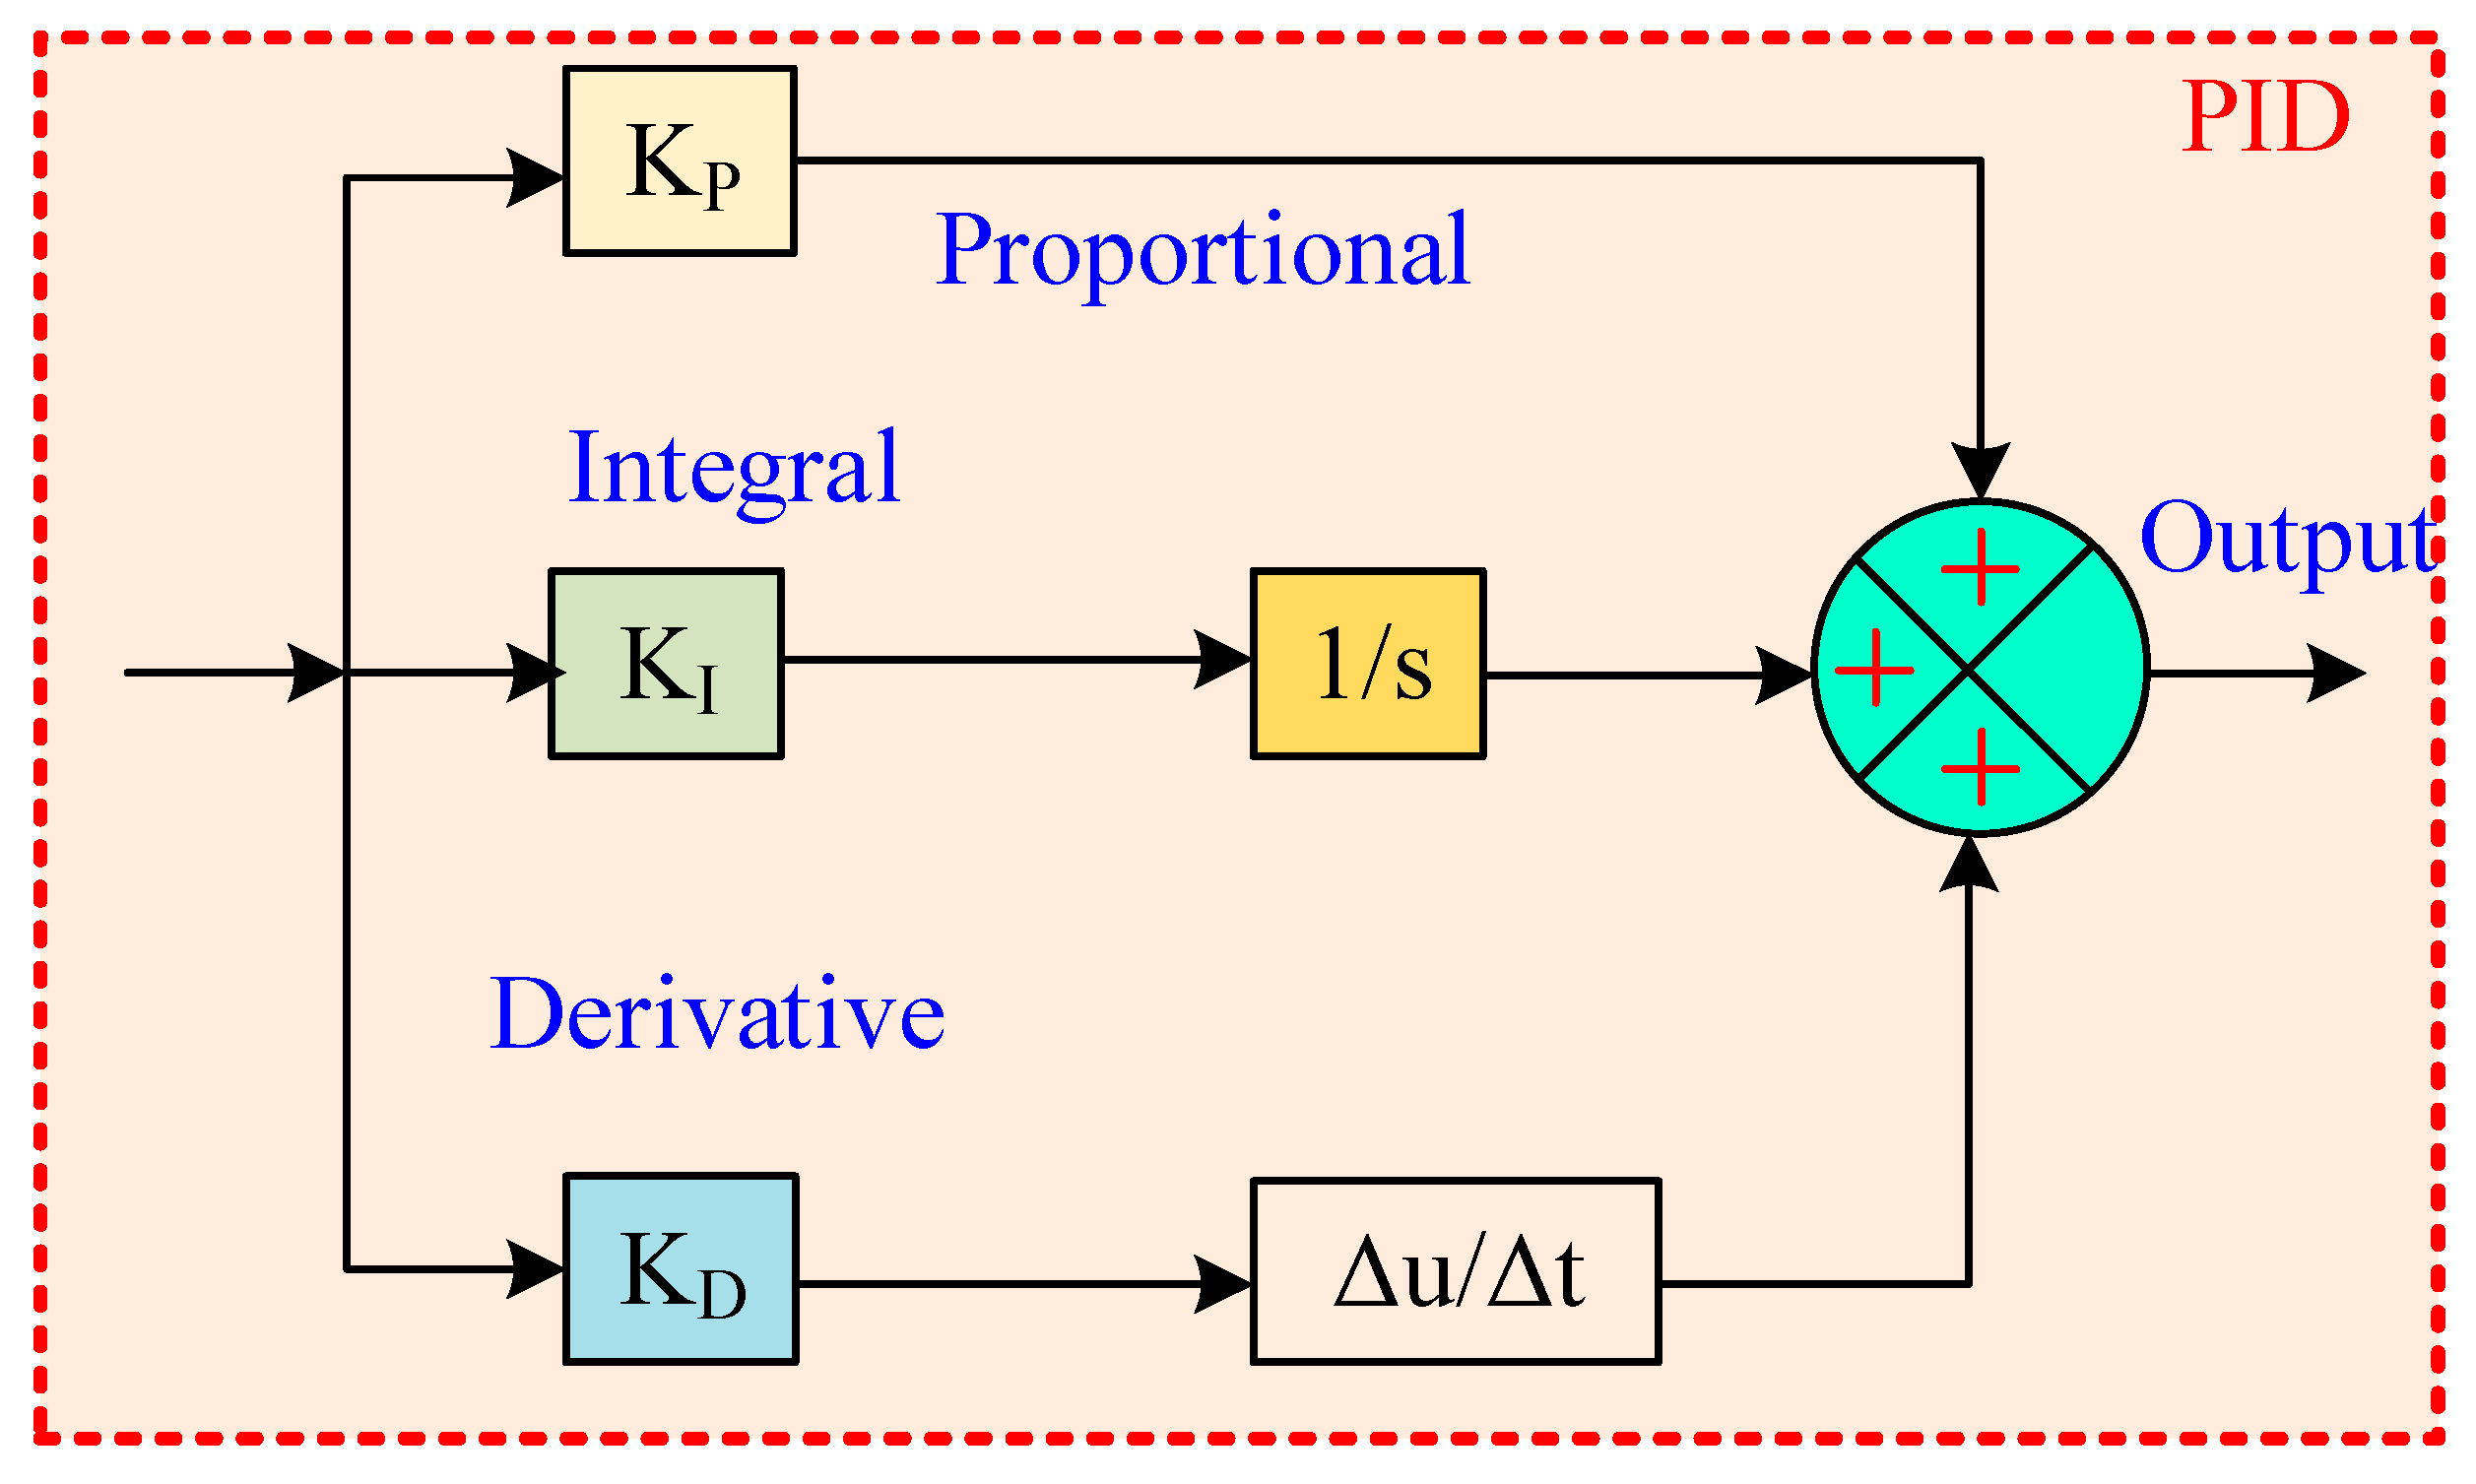
A conventional PID controller combines proportional, integral, and derivative actions in parallel. It runs in a feedback loop that continuously computes the tracking error and updates the control input—even as irradiance and temperature vary. For MPPT, the error is taken as the power–voltage slope e(t) = dP/dV; the MPP is obtained when this slope is zero. The controller therefore regulates the duty ratio to drive e(t) → 0, so the operating point settles with small oscillations about the MPP. The continuous-time PID law:
u i ( t ) = K P i e i ( t ) + K I i e i ( t ) + K D i d e i ( t ) d t
where the derivative, integral, and proportional gains are denoted by Kp, Ki, and Kd, respectively. A traditional PID controller, as shown in Figure 11, is dependable, has a simple structure, and has a good cost-effectiveness ratio.

3.4. Classical Fractional-Order PID Controller Description

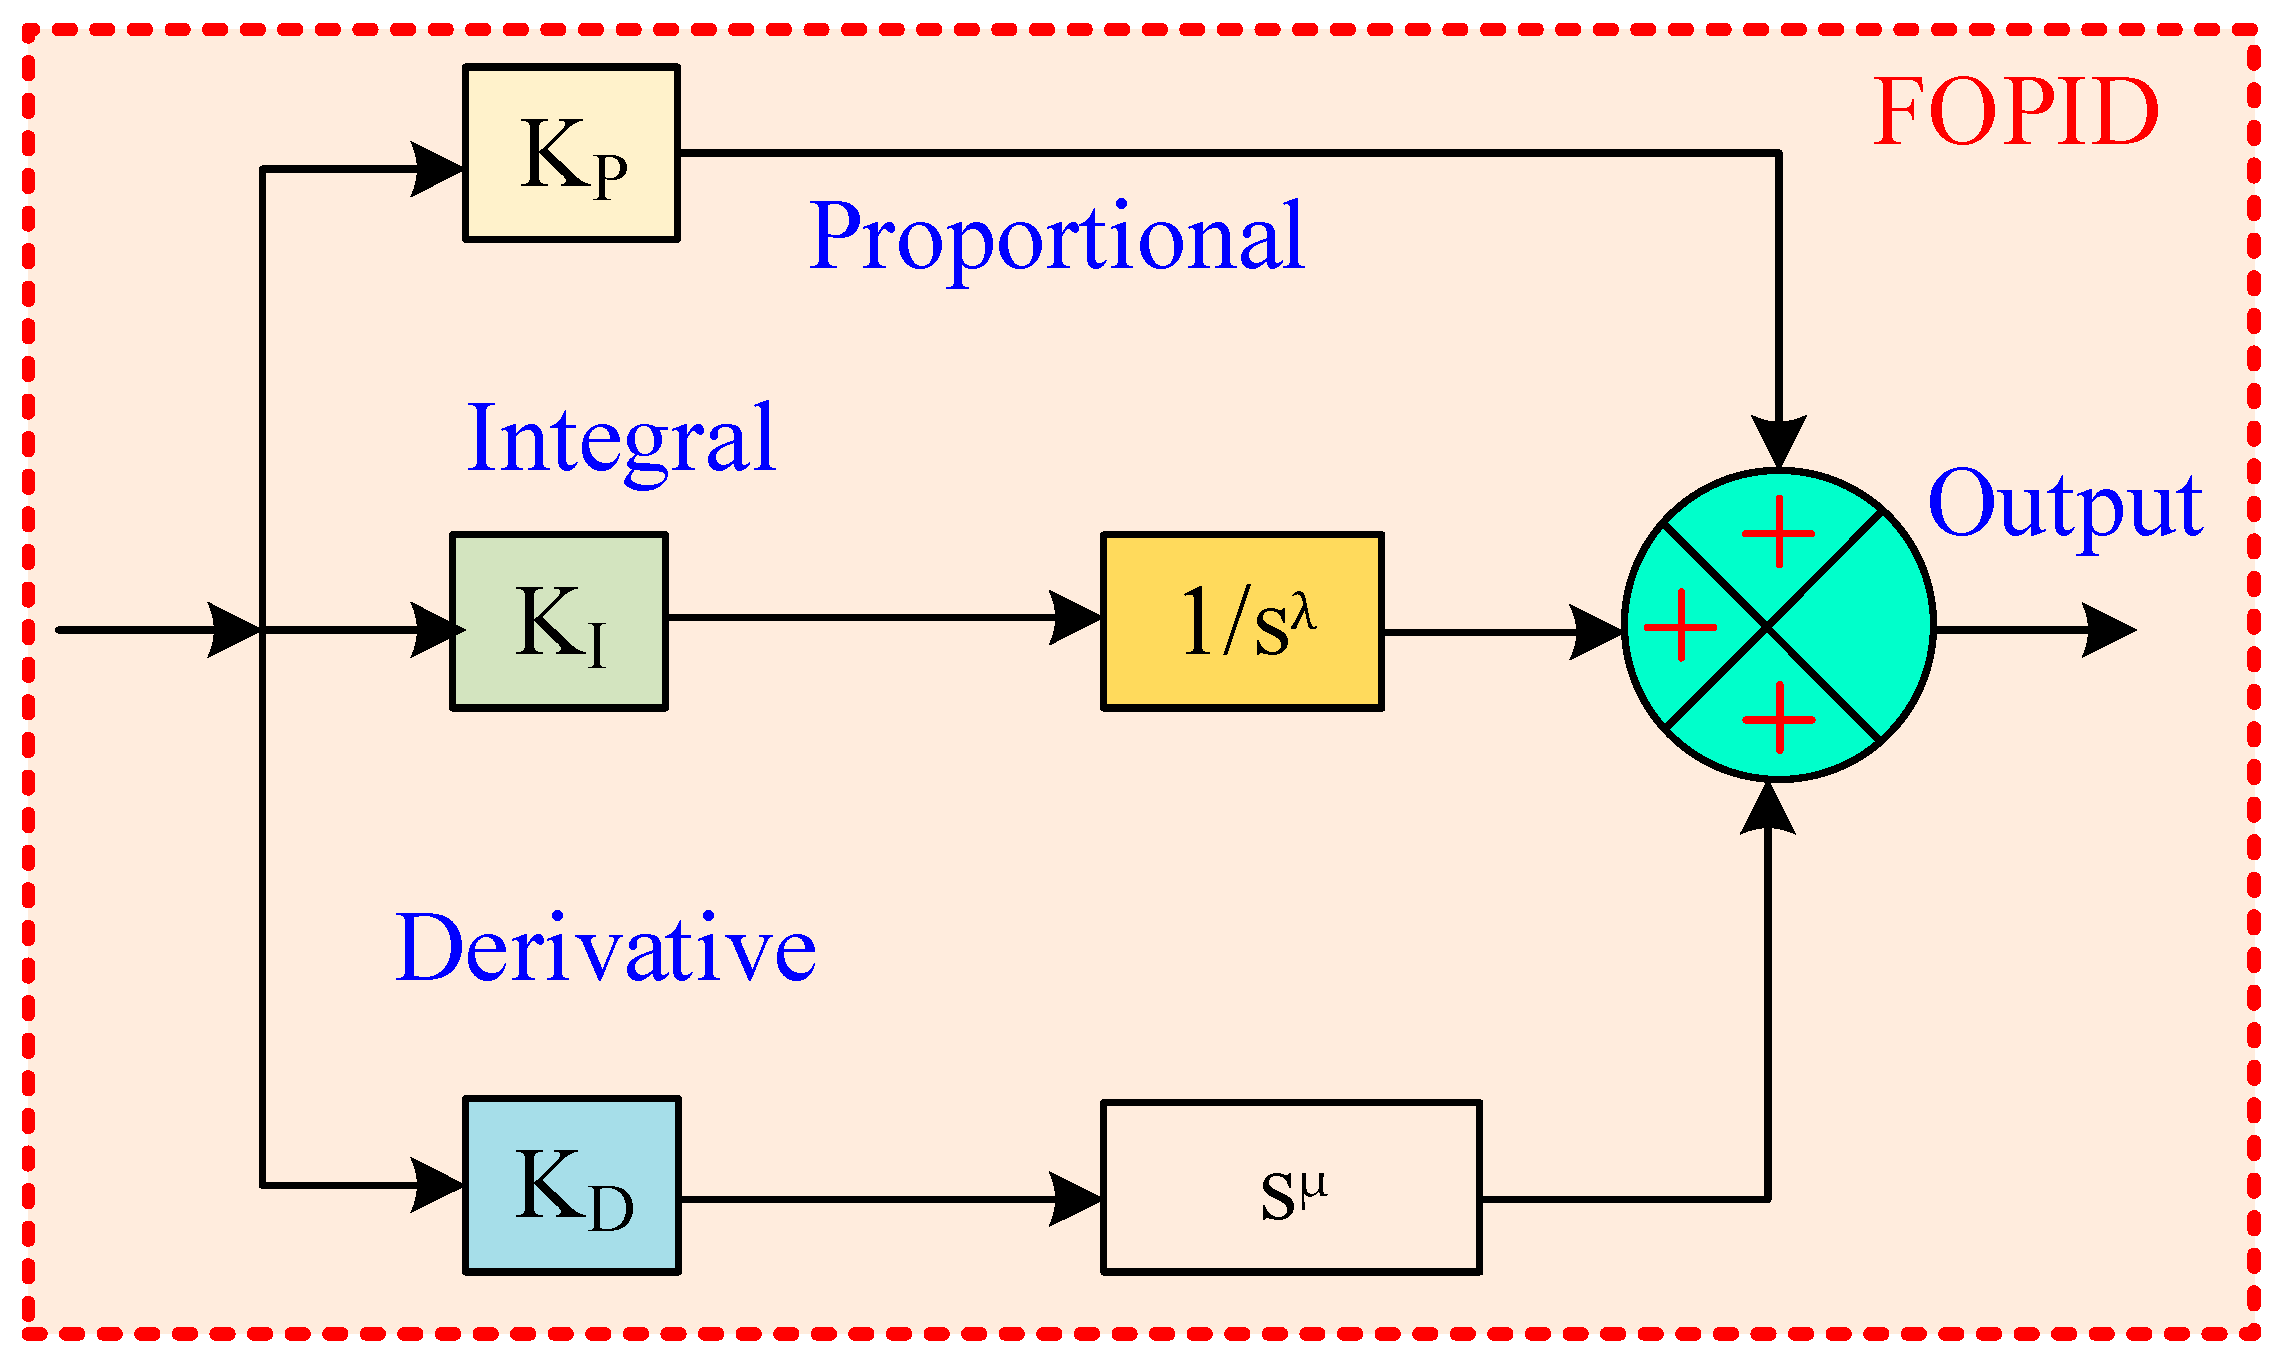
In order to increase the efficiency of the PID controller strategy, Podlubny proposed an extension to PID controllers called FOPID, which is described in [46] and contains the differentiator and integrator of µ and λ. Compared to their integer-order counterparts, FOPID controls exhibit non-local dynamics, necessitating the use of the system’s error signal history to determine control action. Because of its outstanding performance and resilience, FOPID is becoming more and more popular. By adding non-integer ordering for the proportional, integral, and derivative components, FOPID controllers are a potent expansion of the conventional PID control architecture. The controller can now handle complicated systems with nonlinear dynamics, time delays, or non-integer order dynamics thanks to this extension, which raises the controller’s degrees of freedom. This FOPID controller uses a differentiator and integrator for λ and µ. The fractional differ-integral is designed using the Riemann-Liouville (RL) function definition, as given below:
α D t α F ( t ) = 1 Γ ( n α ) d d t n α t f ( τ ) ( t τ ) 1 ( n α ) d τ
where Γ indicates the operator to derive the value of a non-integer and gives Euler’s gamma function, which determines the factorial. Based on the notion of fractional differentiation, the Grunwald—Letnikov function may be mathematically described as follows:
α D t α F ( t ) = l i m g 0 Γ ( α + d ) Γ ( g + 1 ) f ( t d g )
It should be noted that the design of a fractional-order operator can be used to condense the integrator. The Laplace transform is used to obtain the transfer function of FOPID, which is expressed as follows:
G c ( s ) = K P + K I s λ + K D s μ
The differential equation of a FOPID controller is shown in the following equation:
u ( t ) = K P e ( t ) + K I D t λ e ( t ) + K D D t μ e ( t )
The structure of the Kp, Ki, Kd, µ, and λ parameters forms the basis of the FOPID controller idea. The integral and derivative factors are λ and µ, respectively. When it comes to control scheme tuning, the AFOPID controller performs better (see Figure 12). The controller block structure is depicted in Figure 13.

3.5. Adaptive FOPID Tracker for PV-TEG System

A PV array electrically paralleled with a TEG source feeds a DC–DC converter whose duty ratio D ∈ [0,1] is the control input. The measured bus voltage/current are V(t) and I(t), and the electrical power is P(t) = V(t)I(t). Maximum-power operation satisfies dP/dV = 0. We cast MPPT as a slope-nulling regulation task with error:
e ( t ) = d P d V ( t ) P ( t ) P ( t h ) V ( t ) V ( t h ) + ε ,   r ( t ) = 0
where h is the control sampling period and ε > 0, prevents division by zero. The controller outputs a duty increment ΔD; the modulator applies: with standard anti-windup on saturation.
D k + 1 = s a t ( D k + u k , D m i n , D m a x )
In this work, the fractional-order PID controller is shown in Figure 13. As shown in Equations (36) and (37) and with integral order λ ∈ (0, 1) and derivative order μ ∈ (0, 1]. The fractional operators are implemented by an Oustaloup rational approximation over [ωℓ, ωh]:
s α k α i = N N s / ω z , i + 1 s / ω p , i + 1 ,   ω z , i , ω p , i l o g - s p a c e d i n   [ ω l , ω h ]
or, alternatively, by a finite-memory Grünwald–Letnikov (GL) recursion at sample time h. Let θ = [Kp, Ki, Kd] and the regressor:
ϕ ( t ) = [ e ( t ) , D λ e ( t ) , D μ e ( t ) ] T
Online tuning uses a normalized gradient law with projection and leakage (robust to scale changes and drift):
θ ˙ = p s Γ ϕ ( t ) e ( t ) 1 + ϕ ( t ) 2 ( θ θ 0 ) , Γ = diag ( γ p , γ i , γ d ) 0 , ρ > 0 ,
Typical choices are to fix λ and μ and adapt Kp, Ki, and Kd online. A light first-order low-pass is applied to Dμe to attenuate sensor noise.

3.6. RBBMO

An optimizer called the RBBMO mimics the RBBM swarm’s intelligence. In 2024, the RBBMO was released [64,65]. When used in a variety of applications, including TEG procedure [66], vehicle trajectory planning and tracing control [67,68], and fuel cell modeling [69], the RBBMO has demonstrated remarkable performance. The RBBMs’ chase performance, which includes target finding, assault, and food retention, serves as inspiration for the RBBMO. The woods of China, India, and Southeast Asia are the RBBM’s main habitats. The RBBM consumes tiny animals, fruits, and insects. The RBBMs find food more easily and collaborate to boost production when they roam in small groups. The RBBMs also get their sustenance from the earth and trees and store food for later consumption.
The natural behavior of RBBMs is used to expand several important aspects of the RBBMO algorithm. These birds are known for their social intelligence, vocal communication, and cooperative foraging style. They often forage in small, well-organized groups that depend on behaviors like sharing food, alarm calls, and leader-following. In RBBMO, where agents exchange knowledge regarding food sources (solutions) and modify their movements as necessary, these procedures fostered a balance among exploration and exploitation. The method includes biologically grounded ideas like exchange of data, which is analogous to how the magpies use language and visual signals for interaction in abundant in resources areas; adaptive patterns of motion, which are based on the abrupt changes in direction and non-linear migration paths; and learning and retention abilities, which are represented in the RBBMO via adaptable components of memory and fitness-based probability weighting. The conceptual model of the RBMO incorporates the phases of exploration and exploitation.

3.6.1. Initialization

The following is how the RBMO generates a random starting solution Xj,k:
X j , k = L L k + r 1 ( H L k L L k ) ,   j P o p u a n d k D m i n
where r1 is a random number between 0 and 1, Popu is the population’s amount, Dim is the issue dimension, and LLk and HLk are the lower and upper bounds of solution k.

3.6.2. Seeking Food

To increase search effectiveness, RBMs naturally look for small groups of two to five birds or big groups of ten or more birds. Equations (44) and (45) are used to update the positions of seeking agents for small and big sets.
X j ( n + 1 ) = X j ( n ) + r 2 1 S p = 1 S X p ( n ) X r c ( n )
X j ( n + 1 ) = X j ( n ) + r 3 1 L p = 1 L X p ( n ) X r c ( n )
where n is the current iteration, Xj(n + 1), represents the position of the news-seeking agent jth, and r2 and r3 are random values between 0 and 1. Xj represents the jth bird, Xrc represents the seeking agent randomly selected in the current iteration, L symbolizes the quantity of big sets of RBBMs randomly selected from the population, and S symbolizes the quantity of tiny sets of RBBMs randomly selected from the population.

3.6.3. Attacking Prey

The RBBMs exhibit excellent expertise and teamwork while attacking their prey. As shown mathematically in Equation (46), little prey is targeted by a small set, and huge prey is targeted by a large set in Equation (47).
X j ( n + 1 ) = X F ( n ) + C F r m 1 1 S n = 1 S X n ( n ) X r s ( n )
X j ( n + 1 ) = X F ( n ) + C F r m 2 1 L n = 1 L X n ( n ) X r s ( n )
where XF(n) represents the food location, C F = ( 1 n / N ) 2 n / N , and r1 and r2 are random values used to generate a typical normal distribution (standard deviation1, mean0).

3.6.4. Storing Food

As follows, the RBBMs store extra food for later consumption:
X j ( n + 1 ) = X j ( n ) F o g j j o l d > F o g j j n e w X j ( n + 1 ) o t h e r w i s e
The variables F o g j j o l d a n d   F o g j j n e w indicate the values of the goal function prior to and during the update of the ith RBBM location, respectively. The RBBMO has a great research plan and a very solid implementation. All of the RBBMO’s information, along with a comparison of its unique characteristics with those of other meta-heuristic optimization algorithms and its pseudocode, can be found in [65]. Figure 14 shows the RBBMO’s flowchart.

3.7. RBBMO for Adaptive FOPID MPPT

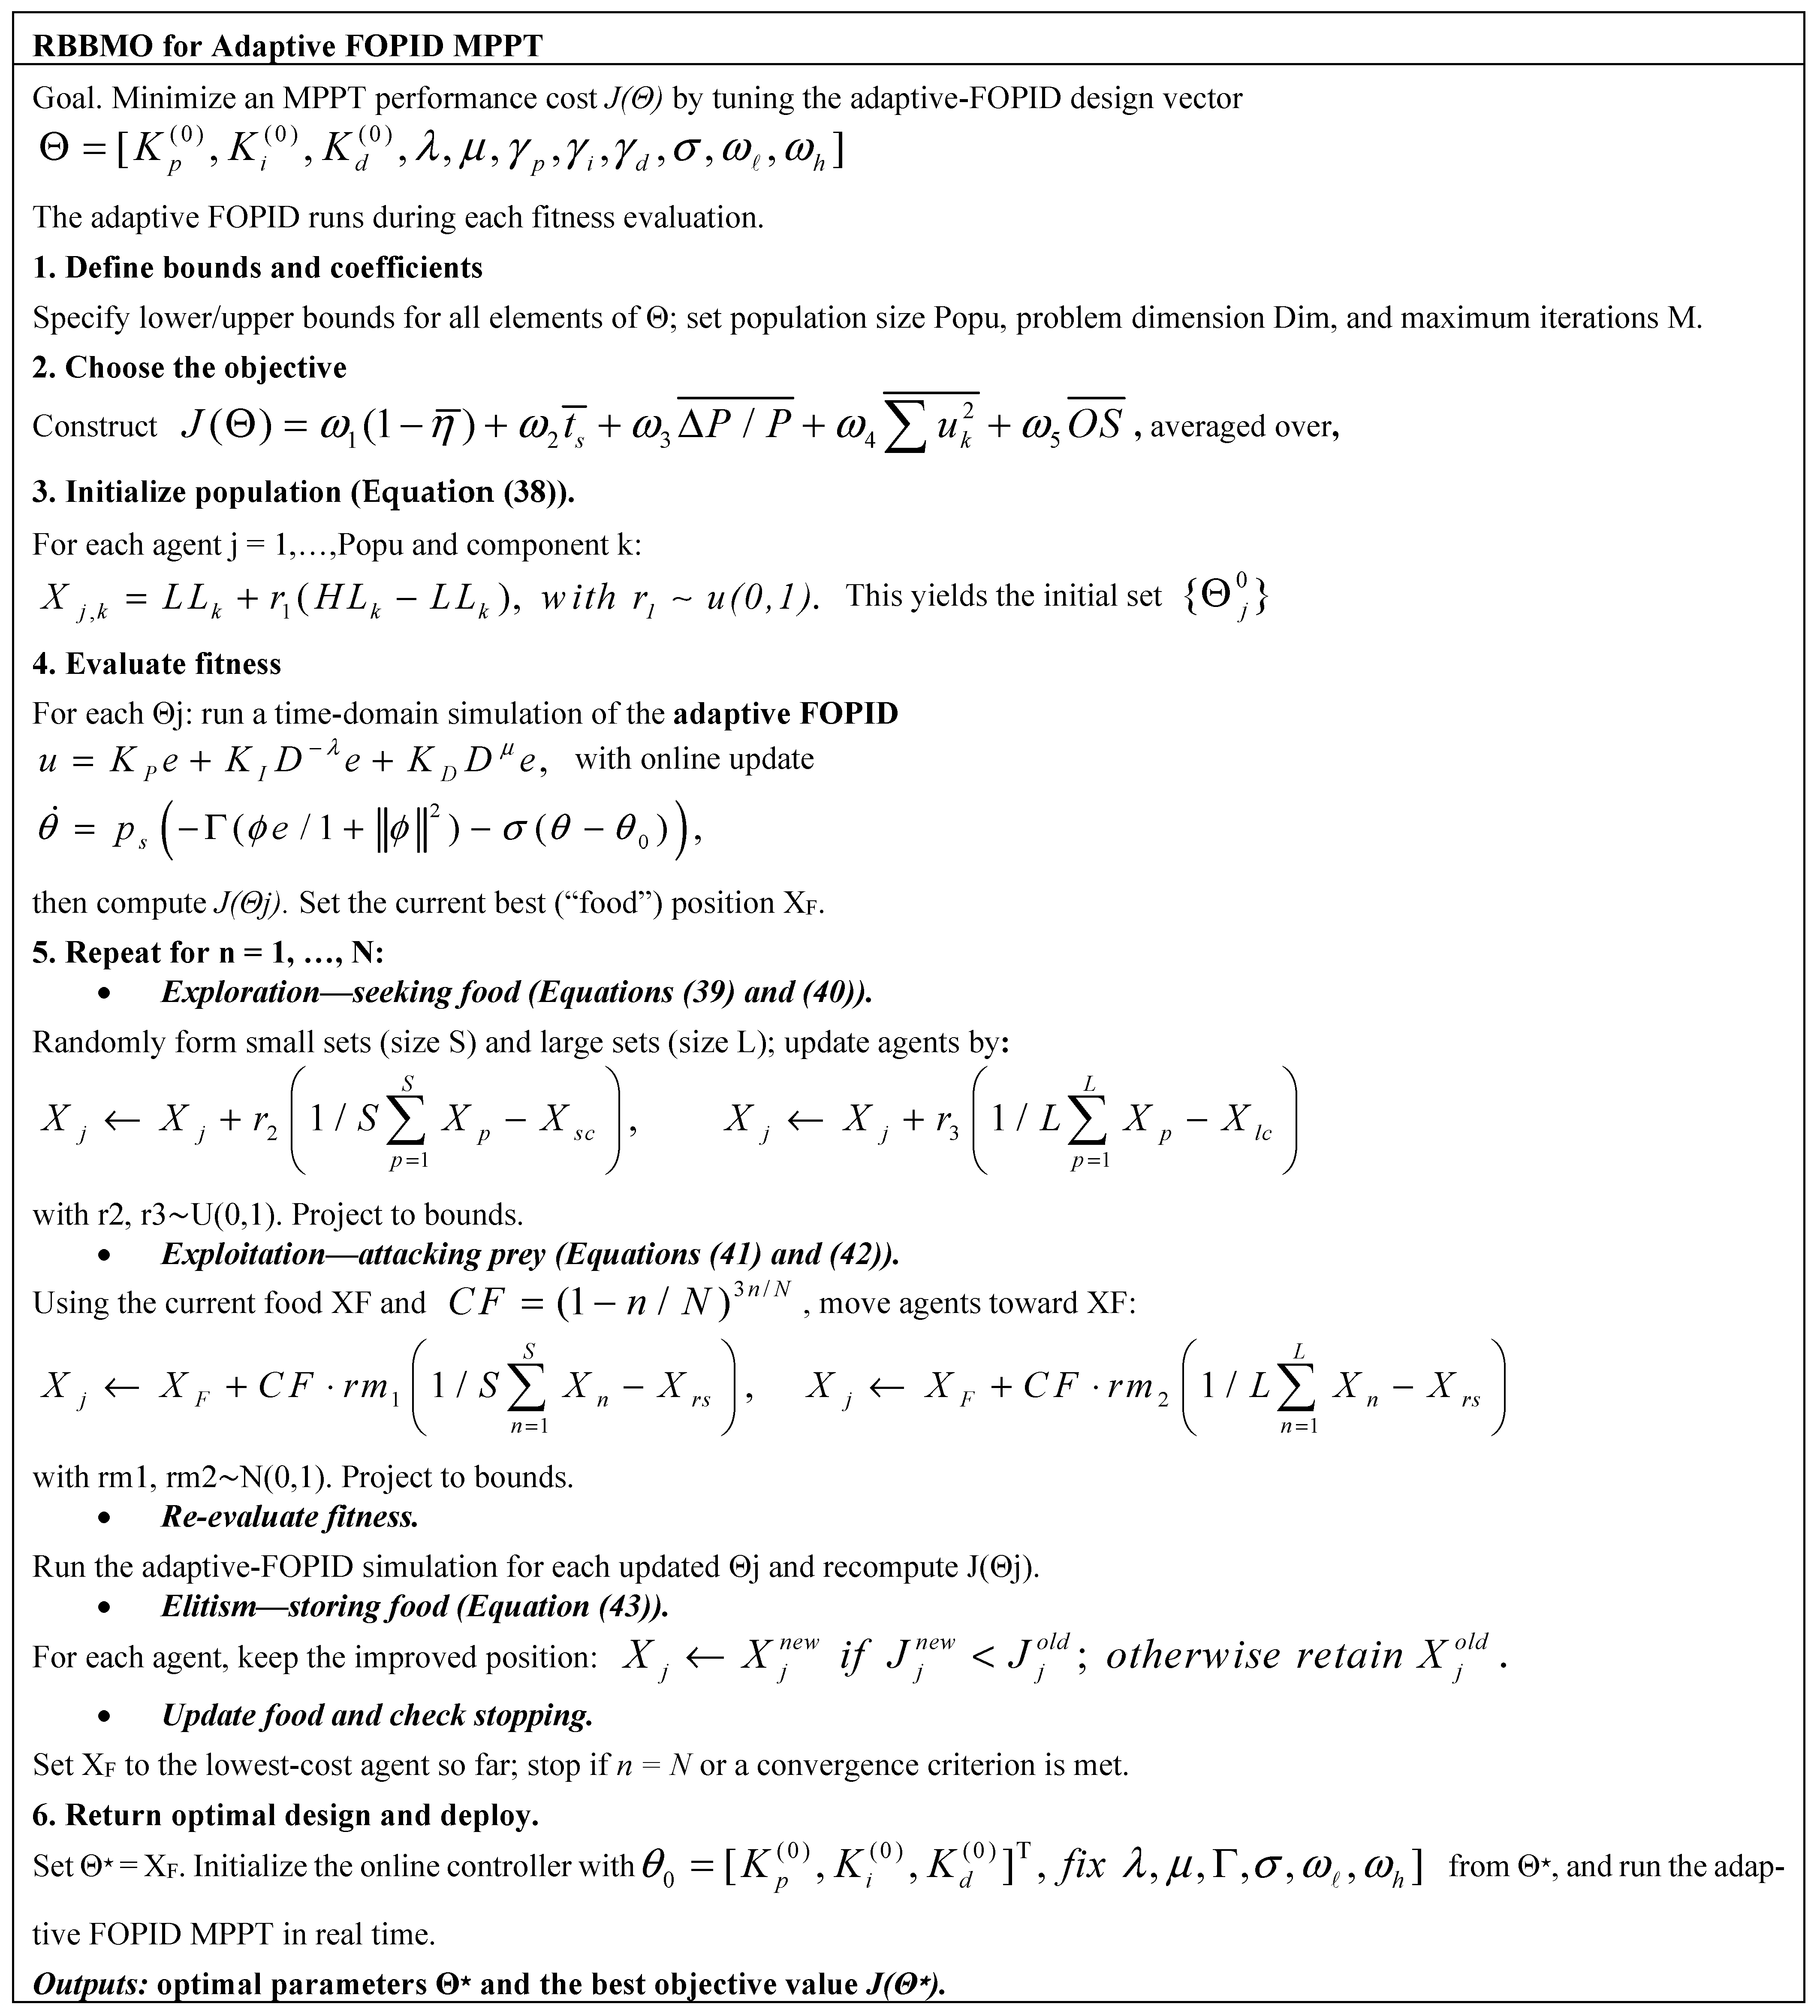
RBBMO optimizes the adaptive FOPID by searching over a bounded design vector comprising the initial gains, fractional orders, adaptation gains, leakage, and the Oustaloup frequency band. A population is initialized uniformly (Equation (38)) and evaluated by a multi-objective MPPT cost that aggregates tracking efficiency, settling time, ripple, effort, and overshoot across realistic PV-TEG scenarios. Each iteration alternates exploration via small/large seeking groups (Equations (39) and (40)) and exploitation toward the current best “food” position with a decaying convergence factor (Equations (41) and (42)). After re-evaluation, an elitist storing rule (Equation (43)) keeps improvements and preserves the best. The final best vector Θ seeds the online adaptive FOPID, whose gains are then adjusted in real time by a normalized-gradient law with projection, ensuring robust MPPT under irradiance and temperature variations. The Pseudo of the RBBMO for Adaptive FOPID MPPT is shown in Figure 15.
The proposed MPPT scheme uses an adaptive FOPID controller with six design parameters, which are tuned using the RBBMO to improve the energy harvested from the hybrid PV-TEG source. Tuning is performed offline: for each candidate parameter vector, branch voltages and currents (VPV, IPV, VTEG, ITEG) are used to compute PPV = VPVIPV, PTEG = VTEGITEG, and the combined output PPV-TEG; the objective function is the total extracted energy over representative irradiance/temperature and ΔT profiles (optionally with penalties on ripple and control effort). RBBMO iteratively updates the population and retains the best solution at each iteration until convergence, yielding the optimal FOPID parameter set (see Figure 16 for the workflow). The obtained parameters are then implemented online in the real-time MPPT loop, where the FOPID regulates the converter duty to drive the slope dP/dV toward zero and keep the hybrid source operating in the neighborhood of the global MPP under changing conditions.

3.8. Controller and Optimizer Reproducibility

The MPPT control signal is generated by a discrete-time FOPID acting on the slope error e[k] = dVdP[k], with output duty-cycle increment Δd[k] saturated to [dmin,dmax] and anti-windup back-calculation. Fractional differintegrators are implemented by a 5th-order Oustaloup approximation over 0.1–100 Hz and discretized at Ts = 1 ms (Tustin). The derivative term uses a first-order roll-off. The slope dP/dV is obtained from a Savitzky–Golay differentiator (window 15 samples, polynomial order 2) applied to V[k], P[k], followed by exponential smoothing; optional Hampel outlier rejection is enabled. The RBBMO meta-tuner runs 25 agents for 60 iterations with fixed coefficients and three random seeds; it searches within explicit bounds for (Kp, Ki, Kd, λ, μ) under box constraints and a ripple/saturation penalty. Full settings, bounds, and seeds are listed in Table 2; pseudocode and a machine-readable configuration are provided in Figure 15 to enable exact replication. And Table 3 provides the hybrid PV-TEG mechanism’s precise characteristic parameters

3.9. Converter Topology, Timing, and Sizing

The PV-TEG front end drives a non-isolated synchronous boost into the DC bus (nominal 240 V as in Table 1). Switching is fsw = 100 kHz with edge-aligned PWM; the MPPT duty command is updated at 200 Hz and latched on the next PWM period. Worst-case design point (from Table 1 sources): Vin = 18–22 V (PV/TEG regulated mix), Vbus = 240 V, Pbus = 50–80 W per test module. With D = 1 − Vin/Vbus ≈ 0.90, we select L = 110 μH to cap the inductor ripple at ΔIL ≤ 30% of Iin at fsw = 100 kHz. The output capacitor bank is sized for ≤1% bus ripple and ≤50 ms recovery to ±1% for a 25% load step; effective Cout ≈ 100 μF (polymer + MLCC) with ESR ≈ 15 mΩ and ESL ≈ 1–2 nH meets both targets. Device models include MOSFET conduction/switching, inductor DCR, and capacitor ESR/ESL; measured/simulated ripple and settling meet specifications across Vin = 16–22 V and 0.8 − 1.2 × load.

4. Results and Discussions

To comprehensively evaluate the proposed RBBMO-tuned adaptive FOPID MPPT in the integrated PV-TEG system, three simulation studies are conducted: (i) start-up/search, (ii) stepwise irradiance, (iii) partial shading with multiple local peaks, (iv) load steps, and (v) field-measured irradiance/temperature from Shanxi Province for spring/summer/autumn/winter. The simulation model is shown in Figure 15. For benchmarking, the proposed method is compared against eight widely used intelligent optimizers, AOS, PSO, MFO, SSA, GHO, RSA, AOA, and P&O, applied under identical environmental profiles and converter constraints. Performance is evaluated along four dimensions: (i) instantaneous output-power response, (ii) cumulative harvested energy, (iii) output-voltage regulation quantified by ripple metrics (Δvmax, Δvavg), and (iv) switching duty-cycle behavior, including reacquisition time, settling, and jitter.

4.1. Start-Up/Phase Search Assessment

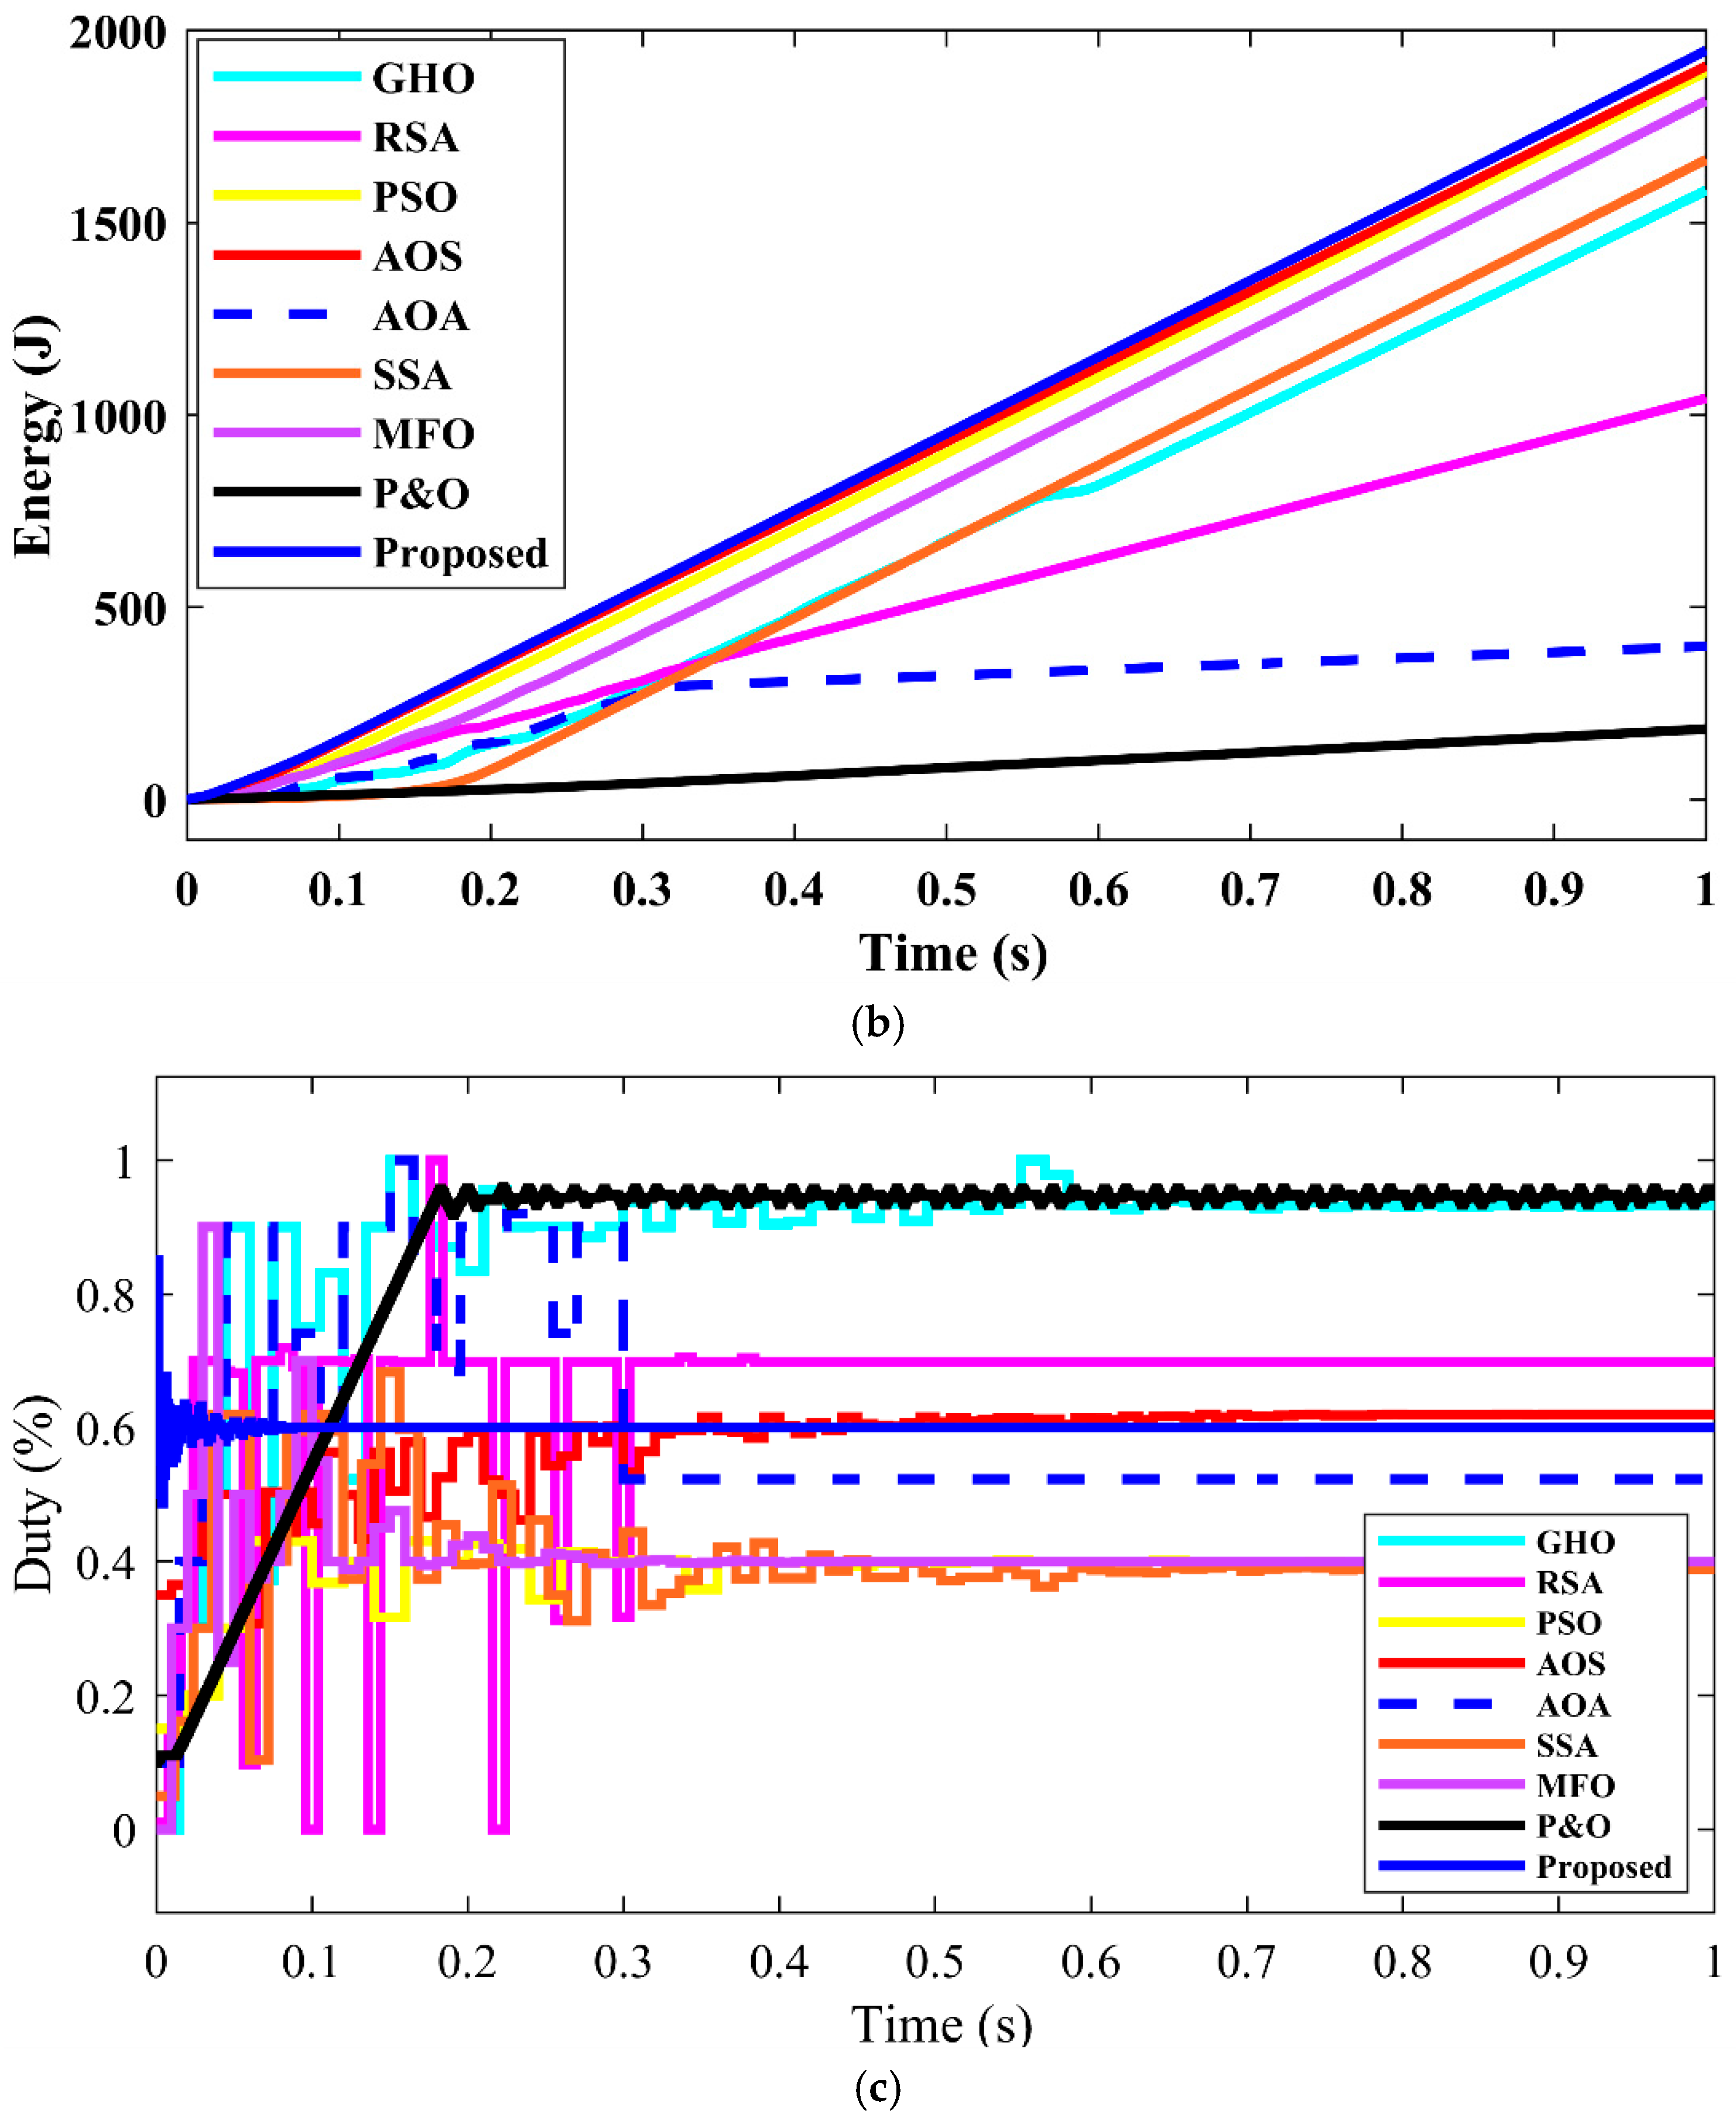
The purpose of this assessment is to evaluate the eight algorithms’ reaction times and convergence stability during the search. Additionally, the hot and cold sides of the TEG were configured to have a substantial temperature differential in order to effectively portray the behavior of the system under dynamic environmental circumstances. Figure 17a displays the power evaluation through the Start-up/search phase. The power trajectories confirm that the proposed controller reaches 95% of the MPP (~2 kW) within 0.06 s and settles within ±1% by 0.12 s, with <0.5% overshoot and steady ripple ±1%. Competing meta-heuristics show slower convergence and larger transient excursions: PSO and AOS reach 95% at 0.18 s and 0.14 s, respectively, and settle only after 0.30–0.35 s; SSA/MFO exhibit pronounced under-/overshoots; AOA stabilizes to a markedly lower plateau. The inset over 0.1–0.3 s highlights these differences in early-time dynamics. Overall, the RBBMO-tuned adaptive FOPID offers the best combination of response speed, convergence stability, and steady-state quality, which aligns with its superior energy capture in Figure 17b.
Figure 17b demonstrates the energy evaluation for the Start-up/search phase. Throughout the 1-s search interval, the cumulative harvested energy for the proposed controller increases almost linearly, reflecting rapid convergence to (and steady operation around) the global MPP with minimal oscillation losses. Reading values at t = 1 s from Figure 17b gives 1.95 kJ for the proposed method, compared with 1.91 kJ (AOS, −2.0%), 1.88 kJ (PSO, −3.6%), 1.78 kJ (MFO, −8.7%), 1.65 kJ (SSA, −15.4%), 1.60 kJ (GHO, −18.0%), 1.05 kJ (RSA, −46%), and 0.42 kJ (AOA, −78%). In addition, the average stability enhancement is approximately 40% relative to SSA, based on the reduction of steady ripple/variance over the 0–1 s interval. The persistent slope advantage over the full horizon highlights the combined benefit of high tracking speed and low ripple.
Additionally, as shown by the duty cycle variation curve in Figure 17c, the RBBMO-tuned adaptive FOPID can quickly reduce the duty’s perturbations in the fewest number of repetitions. Notably, the disturbance amplitude after 0.1 s is only 25% of the SSA. The RBBMO-tuned adaptive FOPID shows an early stability in a small band after a rapid, almost monotonic rise of the duty ratio during the 1-s search time. From Figure 17c, the duty reaches its operating plateau by 0.18–0.20 s with a residual jitter of ±1%, which is markedly lower than the chattering and stepwise swings observed for GHO/RSA/SSA/MFO/PSO/AOS/AOA. In particular, P&O displays a slow ramp and overshoot before settling, while RSA and SSA show large-amplitude perturbations persisting throughout the horizon. The smooth transient of the proposed method indicates well-damped control action and an effective trade-off between exploration and regulation supplied by the RBBMO initialization and the adaptive FOPID update. Table 4 compares nine MPPT strategies during the 1-s search phase on the hybrid PV-TEG model: the proposed RBBMO-tuned adaptive FOPID achieves the fastest convergence (t95 ≈ 0.06 s; settling 0.12 s), the smallest overshoot (<0.5%) and ripple (±1%), and the highest 1-s energy (1.95 kJ). AOS and PSO trail by 2–4% in energy, MFO/GHO/SSA converge more slowly with larger transients, and RSA/AOA (and P&O) underperform substantially.

4.2. Stepwise Irradiance with Constant Temperature

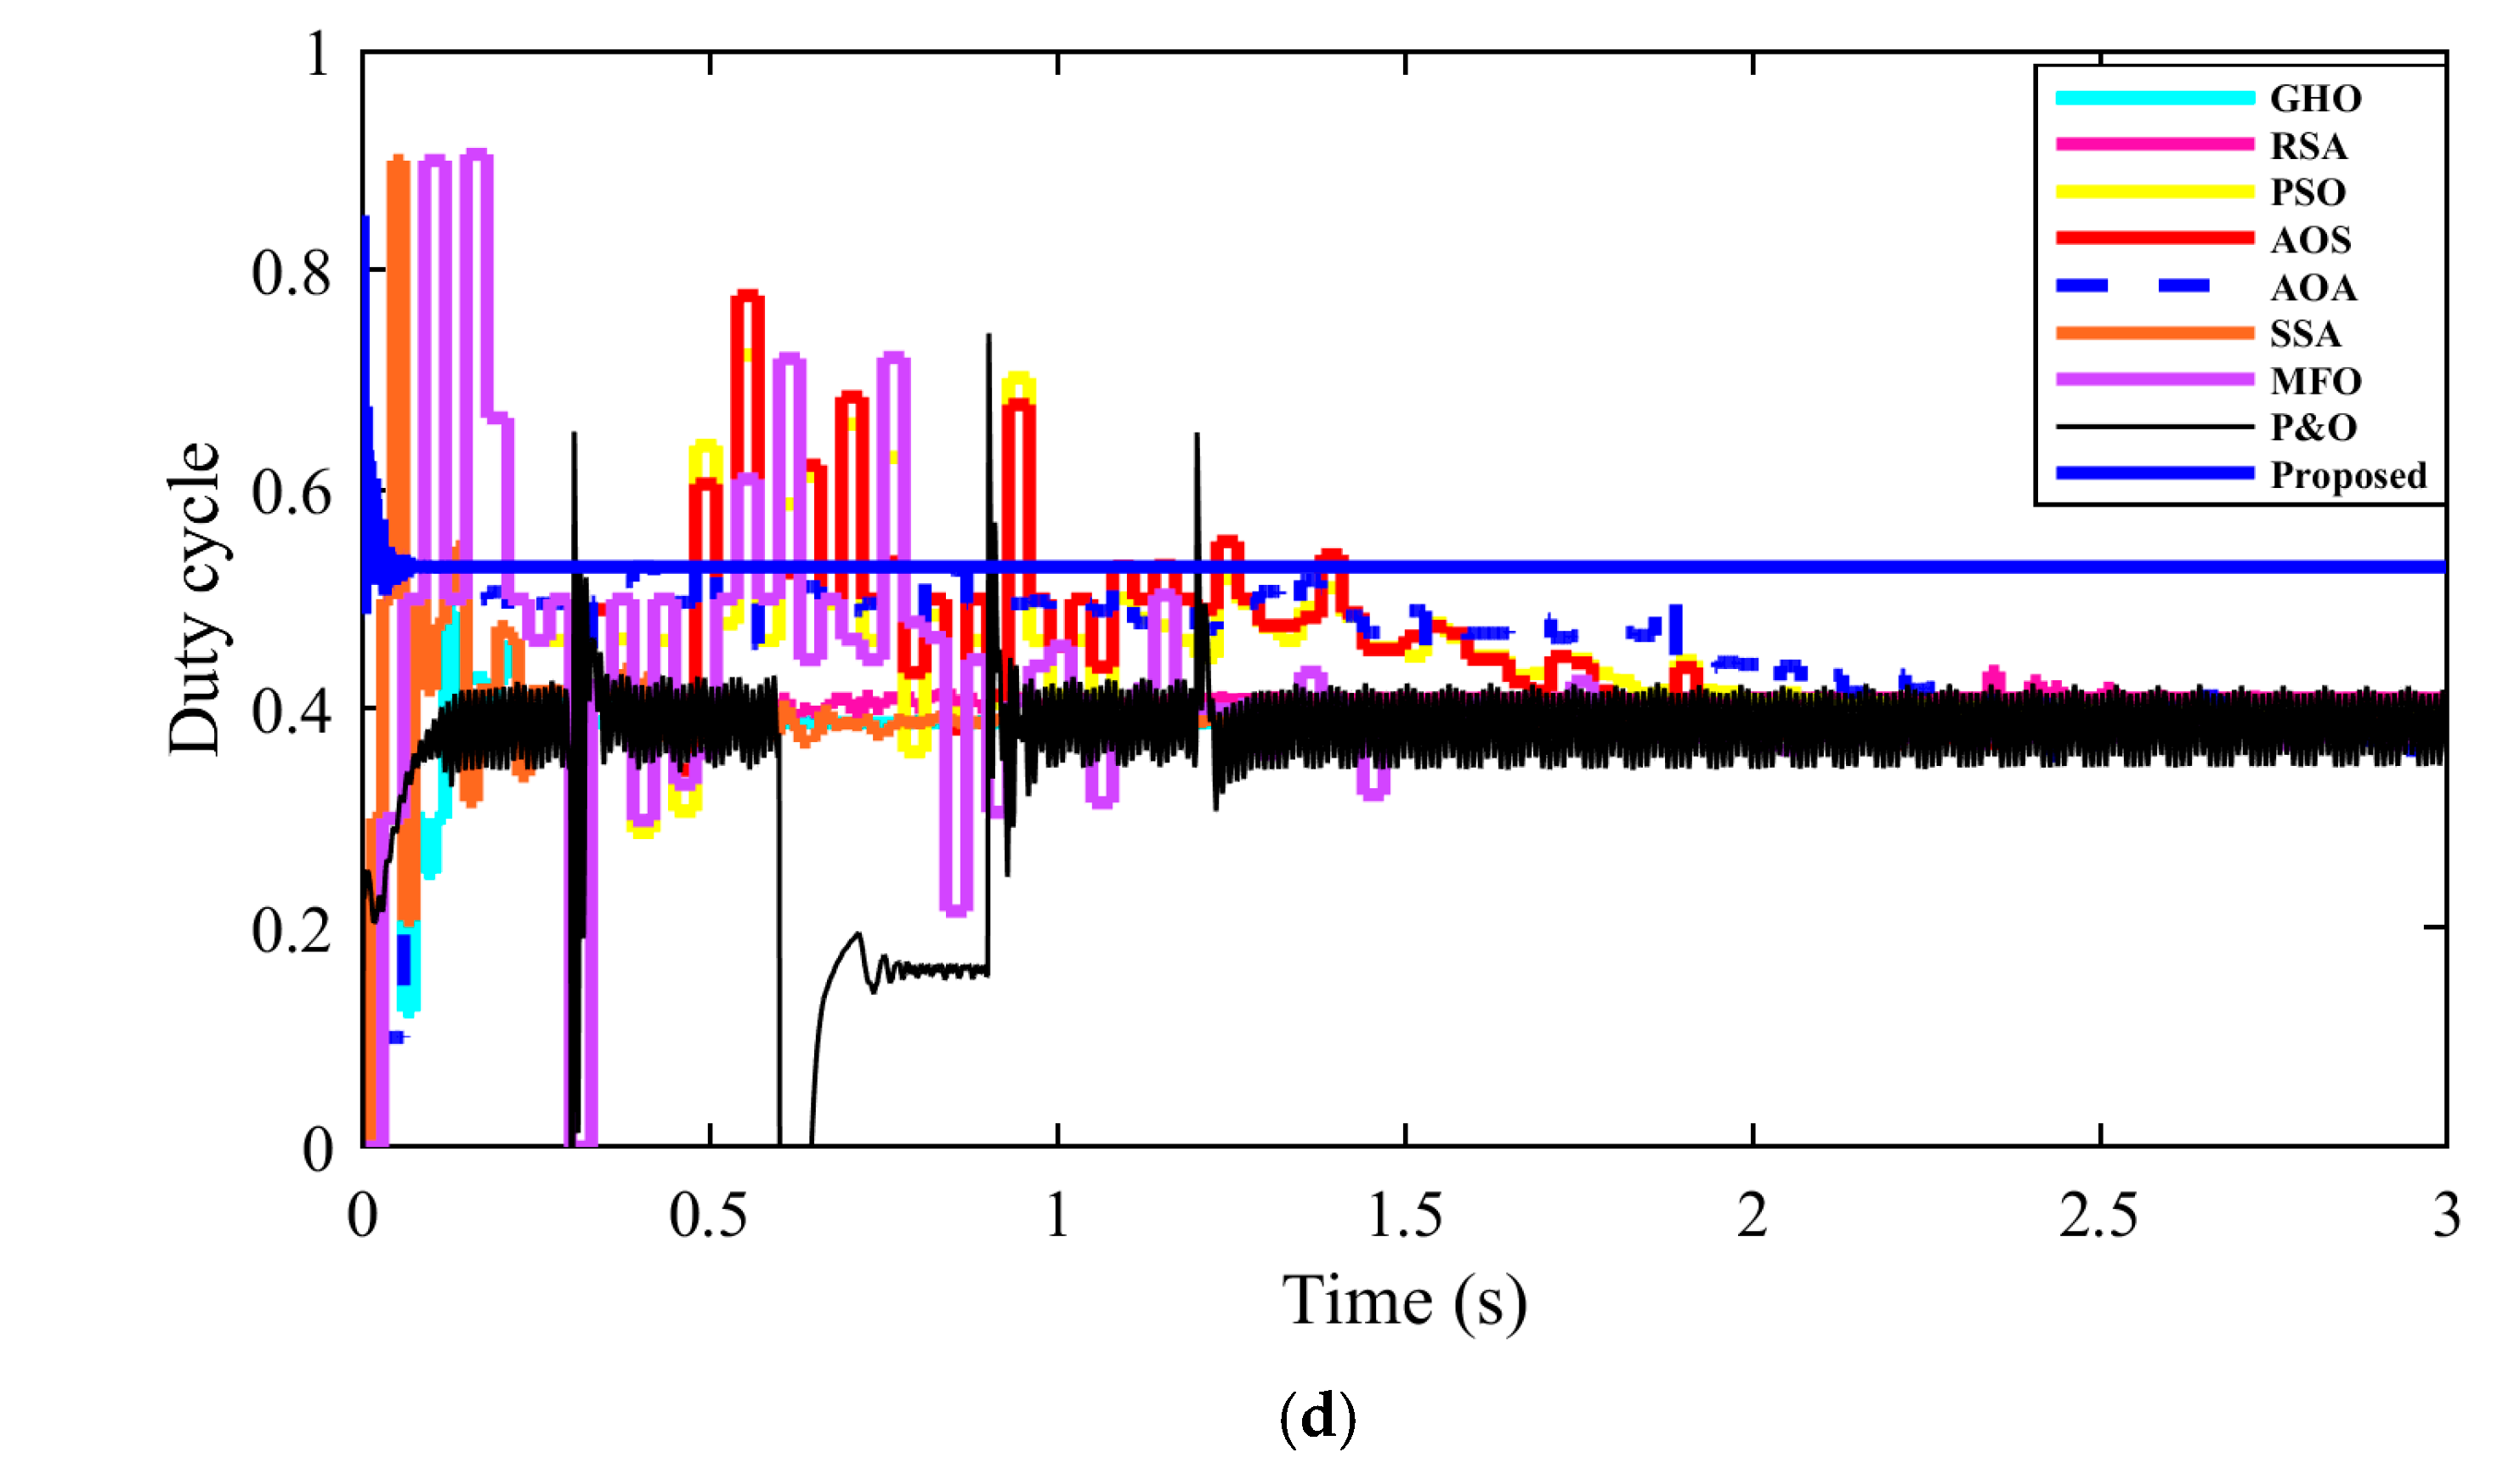
To emulate sun–cloud motion at a fixed temperature, the irradiance is driven through five plateaus as in Figure 18a: 1000 → 500 → 0 → 500 → 1000 W/m2 (step changes around 0.3 s, 0.9 s, and 1.1 s). The corresponding power responses in Figure 18b show that the RBBMO-tuned adaptive FOPID acquires the new MPP fastest after every step and maintains the smallest ripple around the final plateau. From the traces, the proposed method reaches ≥ 95% of the local MPP within 0.06–0.08 s after each irradiance change and settles within ±1% in 0.12–0.15 s, while PSO/AOS/GHO typically need 0.18–0.30 s and SSA/MFO longer with larger overshoot–undershoot. The deep valley to 0 W/m2 is tracked without ringing, and the recovery to the 2 kW plateau is the quickest among all competitors.
The cumulative-energy comparison in Figure 18c (0–1 s window) reflects these transients: the proposed controller attains 0.95–0.98 kJ at t = 1 s, versus 0.90 kJ (AOS, −3–5%), 0.88 kJ (GHO, −7–9%), 0.83 kJ (RSA, −12–15%), 0.78–0.80 kJ (AOA, −15–20%), 0.57 kJ (SSA, −40%), and 0.68–0.70 kJ (P&O); PSO is the weakest in this test (0.40–0.42 kJ). These values confirm a persistent slope advantage for the proposed method due to faster reacquisition and lower oscillation losses. Consistent with the search-phase study, the average stability enhancement is 30% relative to SSA, measured by the reduction in ripple/variance of the accumulated-energy trajectory. Finally, the duty-cycle behavior in Figure 18d highlights the control quality: the proposed controller quickly establishes the appropriate duty level for each irradiance plateau and holds it with minimal chattering (±1%). In contrast, MFO/SSA/PSO and others exhibit high-frequency swings and occasional spikes, and P&O shows a slow ramp with sustained ripple. The smoother duty profile explains the reduced EMI (electromagnetic interference) tendency and the superior steady-state power seen in Figure 18b. Table 5 shows that under irradiance steps, the proposed method reacquires each plateau 2–4 times faster than typical meta-heuristics and keeps energy at 1 s 0.96 kJ, the best by 3–20%.

4.3. Partially Shaded Conditions

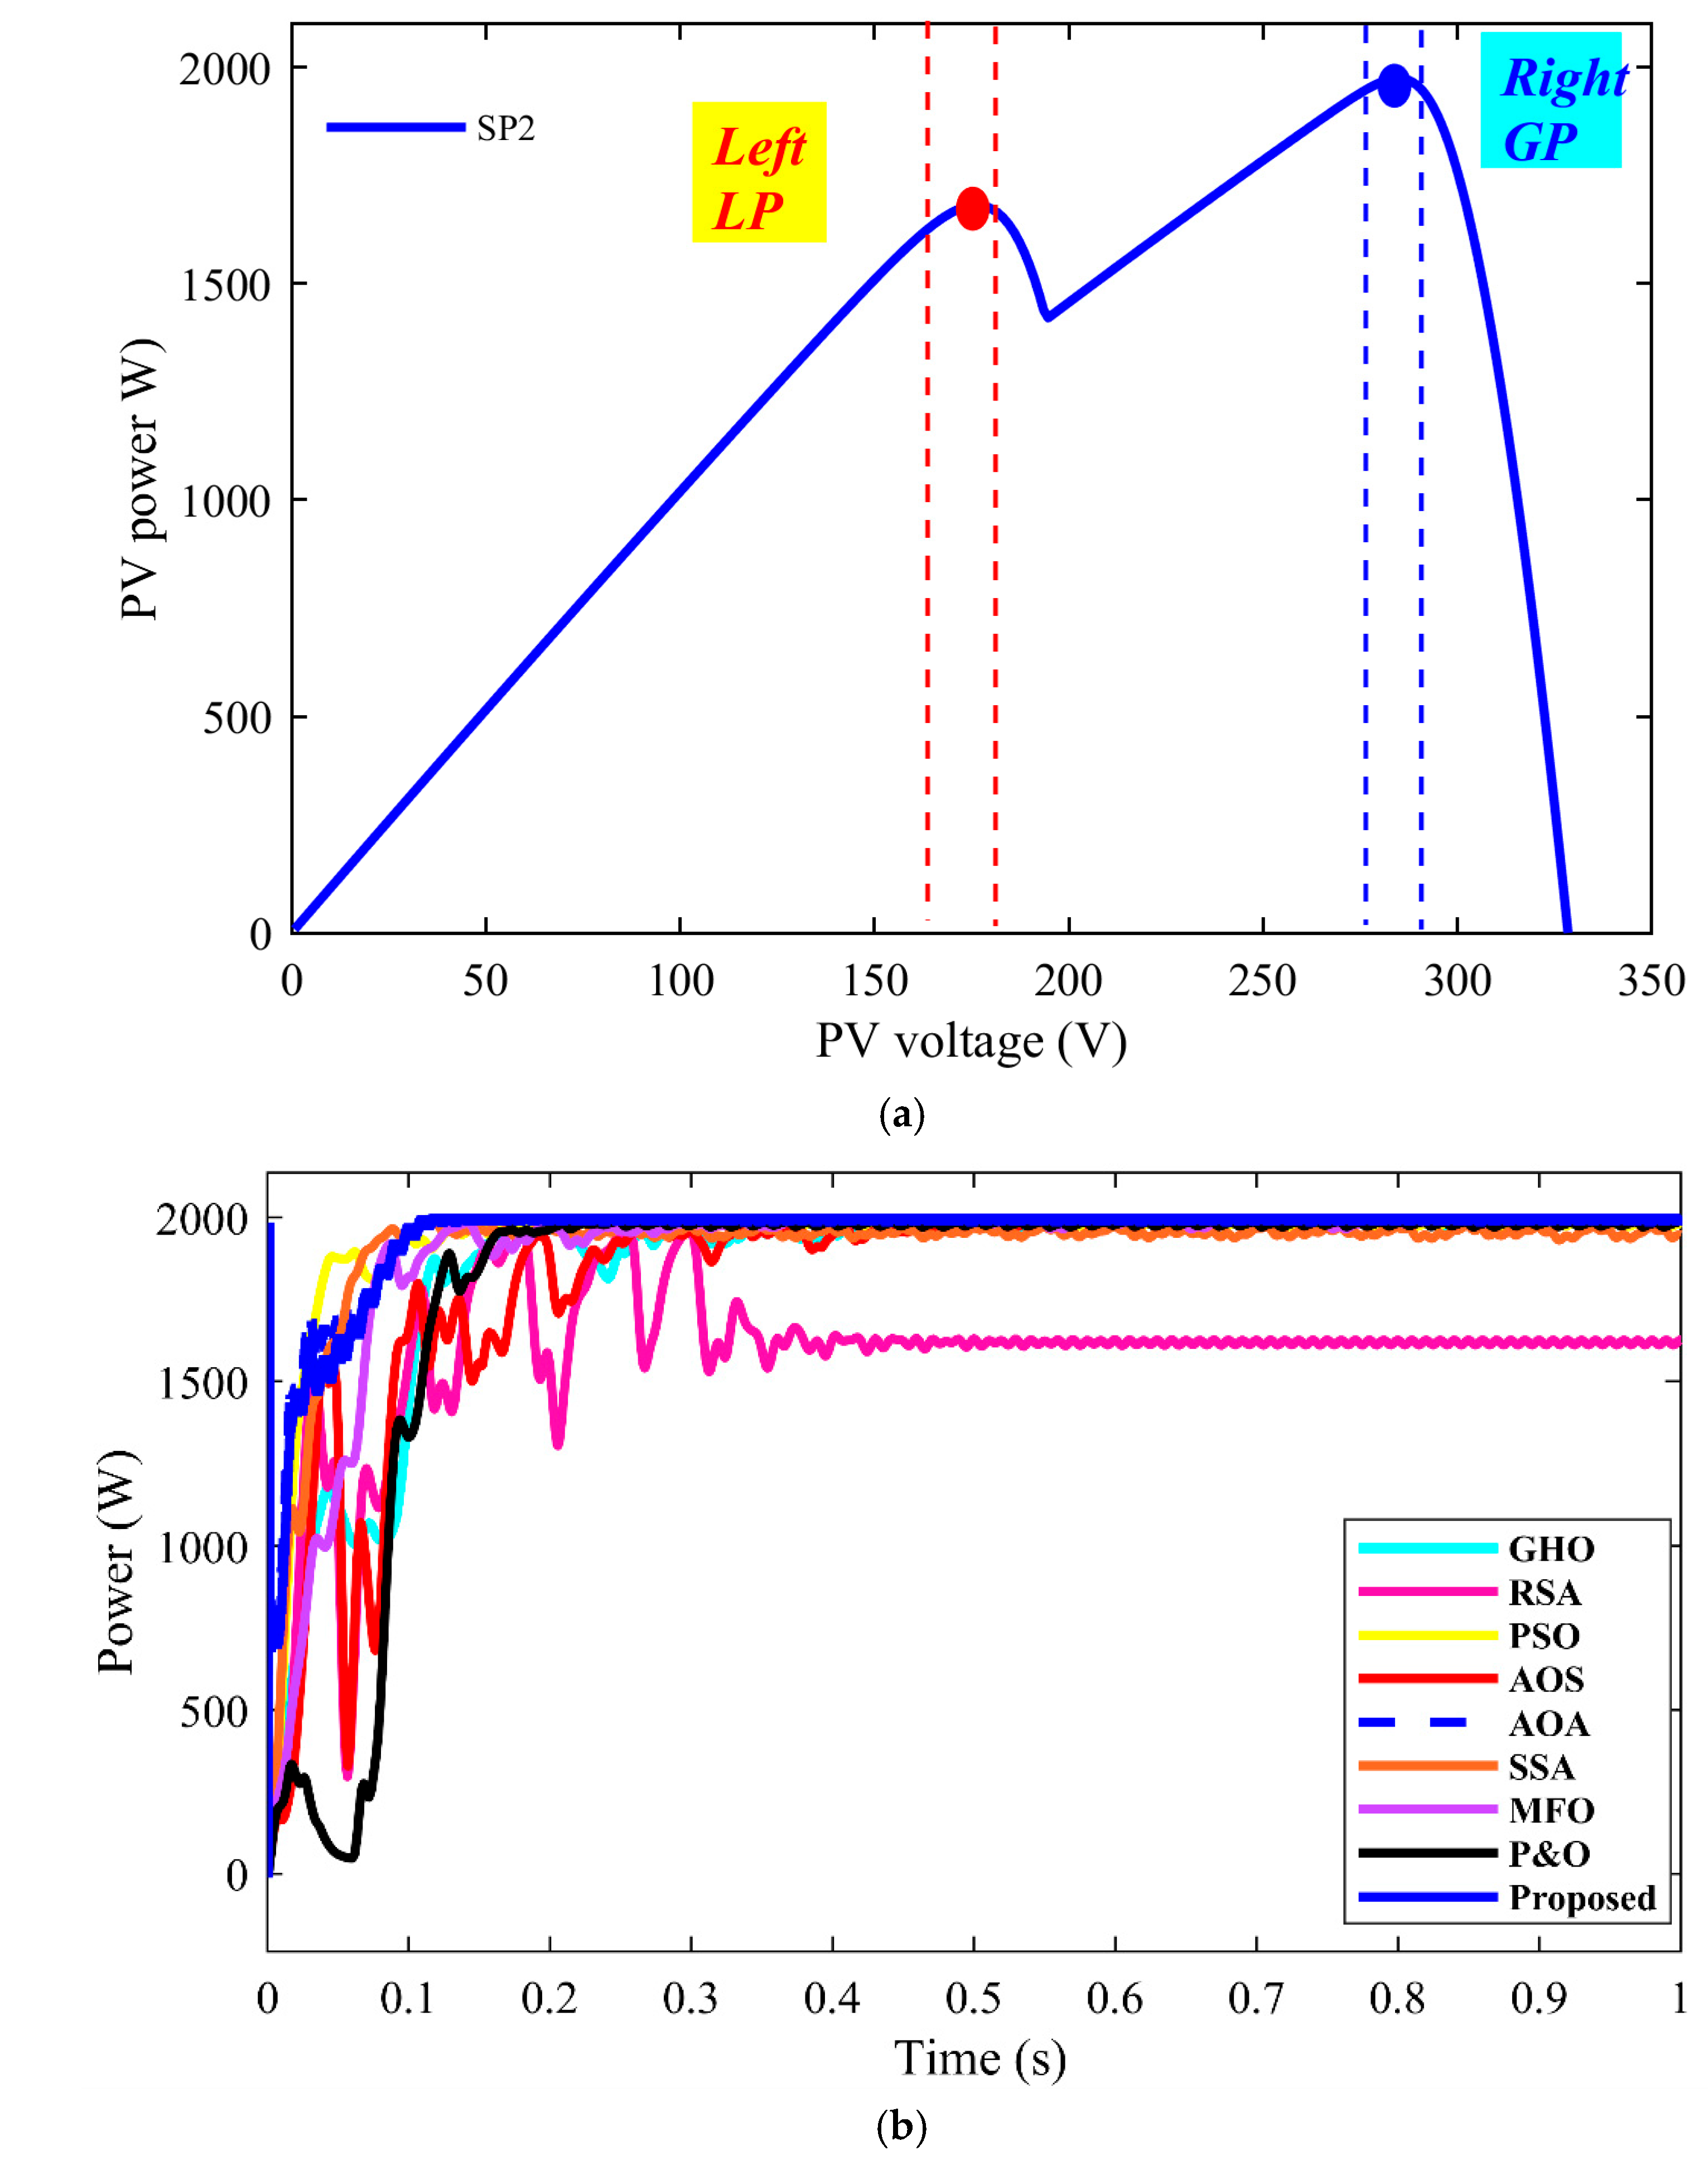
Under partial shading, the hybrid PV-TEG array produces a multi-peak P-V characteristic due to bypass-diode activation. As illustrated in Figure 19a, two dominant peaks appear: a left local peak (LP) around V = 170−185 V with P = 1.6−1.7 kW and a right global peak (GP) near V = 290 V with P = 2.0 kW (values read from the plot). Avoiding entrapment at the LP is therefore essential for true MPP operation.
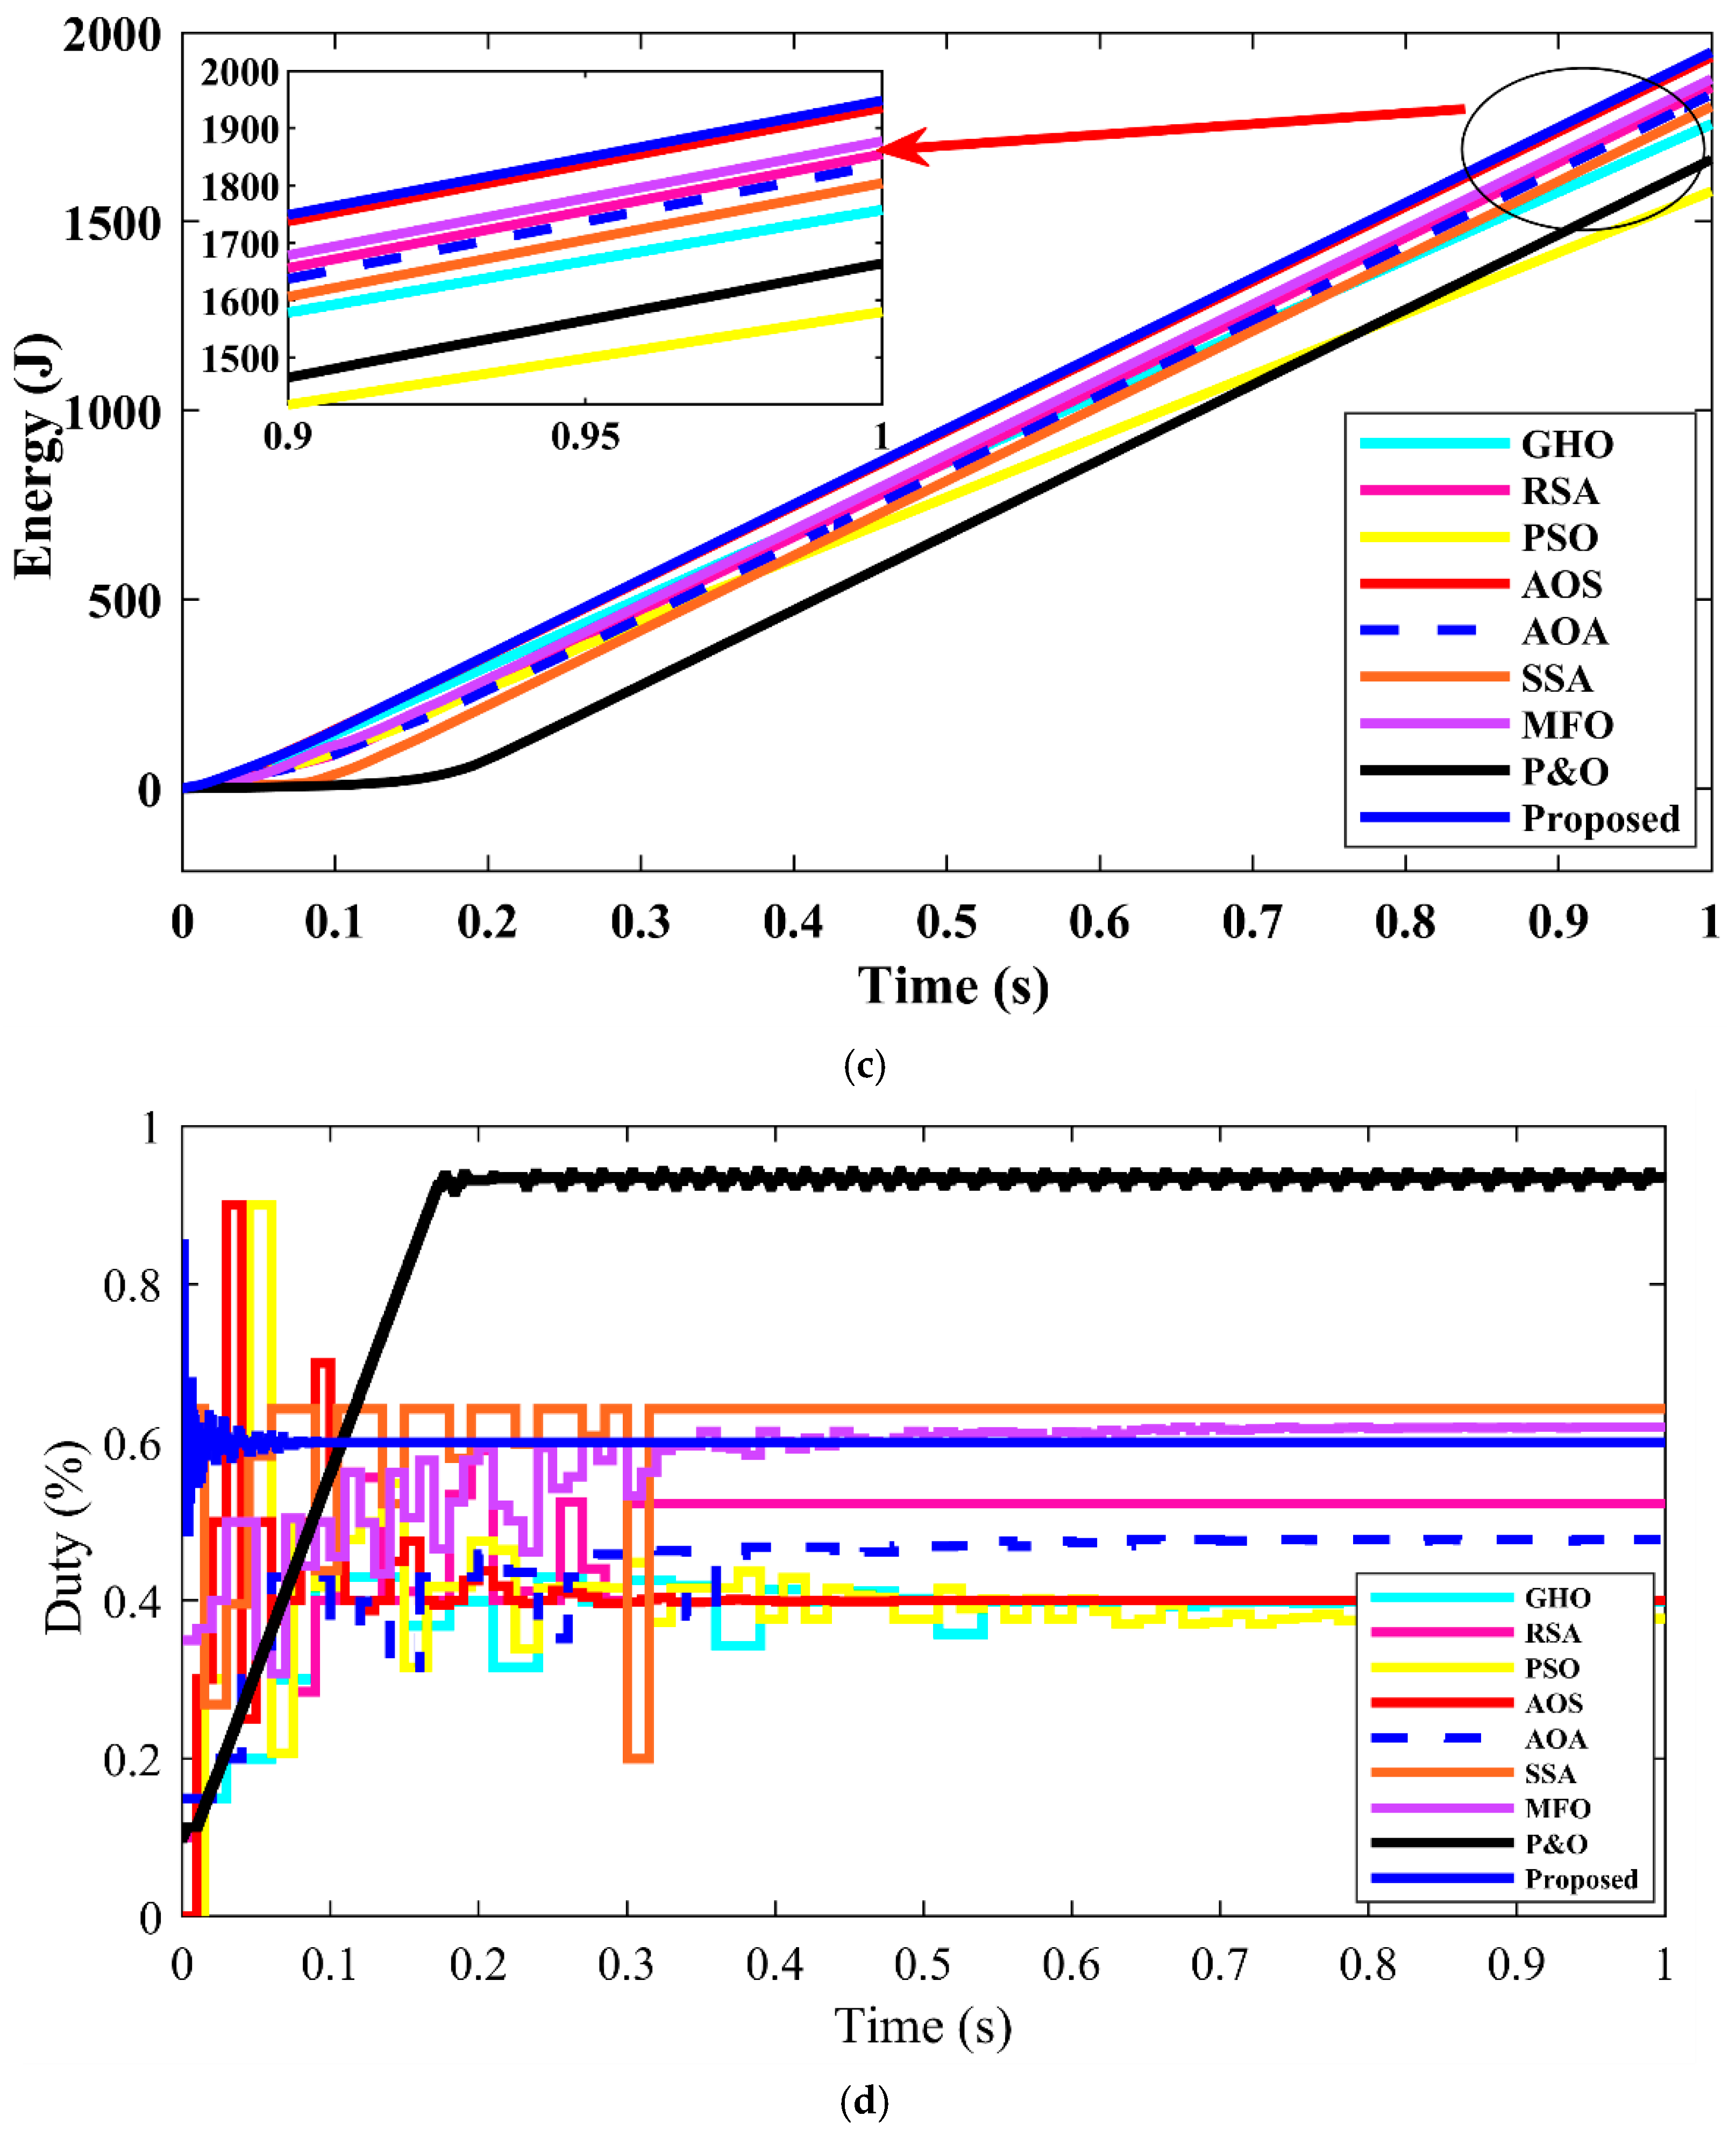
The power responses in Figure 19b show that the RBBMO-tuned adaptive FOPID identifies the global peak on the first attempt and settles at the highest plateau with the smallest ripple. Quantitatively, the proposed method reaches 95% of the GP in 0.06–0.08 s and settles within ±1% by = 0.12–0.15 s, while AOS/PSO/GHO typically require 0.15–0.25 s with larger overshoot–undershoot. RSA converges to a lower suboptimal plateau (1.6–1.7 kW), evidencing entrapment near the LP, and P&O shows the slowest recovery with pronounced transient dips. The cumulative-energy curves in Figure 19c corroborate these trends: at t = 1 s, the proposed controller delivers the highest harvested energy (1.95–2.0 kJ), exceeding AOS by 2–4% and MFO/GHO by 6–10%, and clearly outperforming RSA and PSO (differences > 10%). The inset highlights the persistent slope advantage of the proposed approach in the final 0.1 s window, reflecting both rapid acquisition of the GP and low oscillation losses. Consistent with earlier sections, the average stability enhancement is 30% relative to SSA, as inferred from the reduced variance of the accumulated-energy trajectory.
Finally, the duty-cycle behavior in Figure 19d explains the superior power and energy outcomes: the proposed controller quickly sets the appropriate duty level for the GP and maintains it with ±1% jitter (duty varies no more than ±1% of its own steady value), whereas MFO/SSA/PSO exhibit frequent, high-amplitude swings and P&O shows a slow ramp followed by sustained ripple. The smoother duty profile implies a lower modulation index of the switch waveform, which reduces sideband energy around the switching frequency (i.e., a lower EMI propensity in practice), although formal EMI compliance would require dedicated measurements. Overall, the results demonstrate that the RBBMO-tuned adaptive FOPID reliably escapes local maxima and locks onto the global MPP with the fastest convergence and most stable steady-state among the compared methods. Table 6 demonstrates global MPP discrimination under partial shading: the proposed controller locks the GP first and sustains the highest 1-s energy with minimal jitter.

4.4. Gradually Load Steps with Constant Conditions

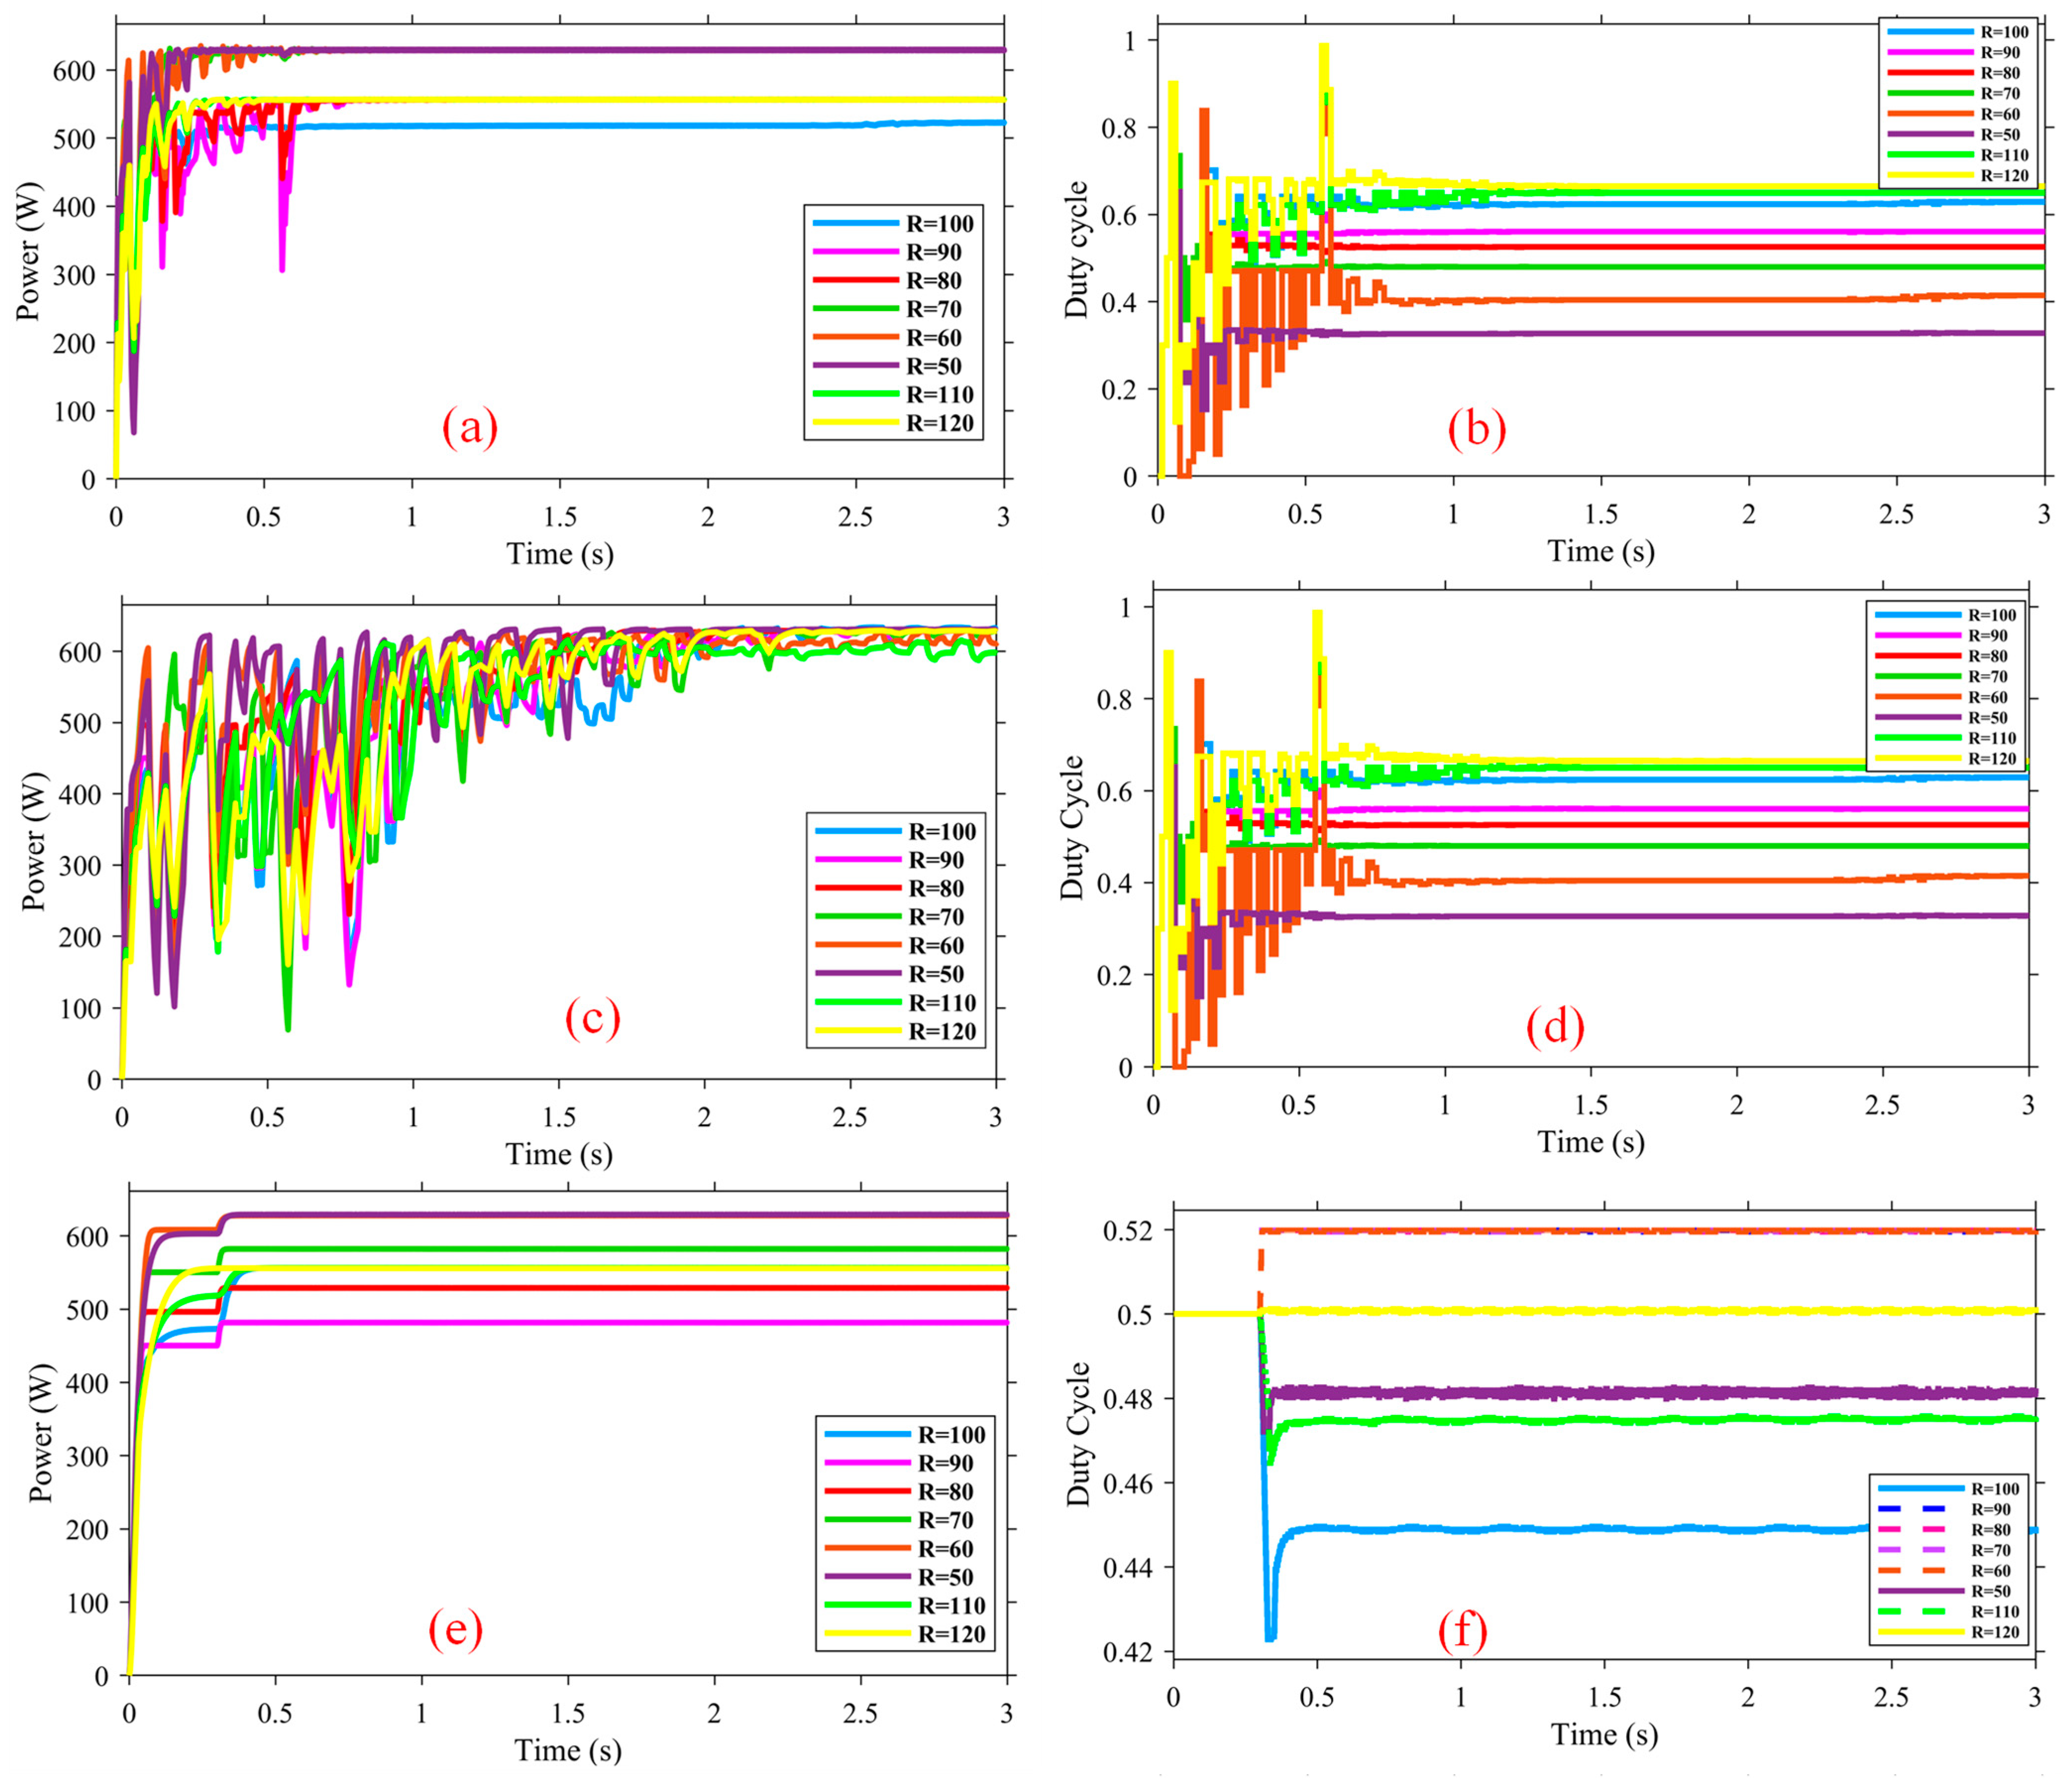
Under fixed temperature (25 °C) and irradiance (1000 W/m2), the load was swept from 50 Ω to 120 Ω in 10 Ω increments. Figure 20 reports power (left) and duty (right) for four controllers arranged by rows: AOS (a, b), PSO (c, d), P&O (e, f), and the proposed RBBMO-tuned adaptive FOPID (g, h). From the power traces, the proposed method reacquires the new MPP fastest at every load step, showing the smallest transient dip and the highest steady-state plateau. Across all steps, the RBBMO-tuned adaptive FOPID reacquired the new operating point fastest, reaching ≥95% of the local MPP in 0.06–0.08 s and settling within ±1% in 0.12–0.15 s, while PSO/AOS typically needed 0.20–0.35 s, and P&O was slower with persistent ripple. The proposed controller also sustained the highest steady-state power and the smallest transient dips/overshoot, most notably at R = 20 Ω (representative of small electronic loads). Duty-cycle traces confirm a brief adjustment followed by a tight band (±1% jitter), whereas the benchmarks show pronounced chattering, explaining their larger power oscillations and lower energy capture.

4.5. Field-Measured Irradiance and Temperature in Shanxi Province, and Seasonal MPPT Performance

To test real-world robustness, we drove the hybrid PV-TEG model with field data recorded in Shanxi Province (2024) sampled every 10 min. Figure 21a reports the seasonal irradiance profiles, which exhibit the expected bell-shaped envelope with intermittent cloud passages; Figure 21b shows the corresponding ambient temperatures, ranging from 5–18 °C in winter to 24–30 °C in summer. These data introduce natural variability absent in synthetic tests and therefore stress the adaptability of the controllers.
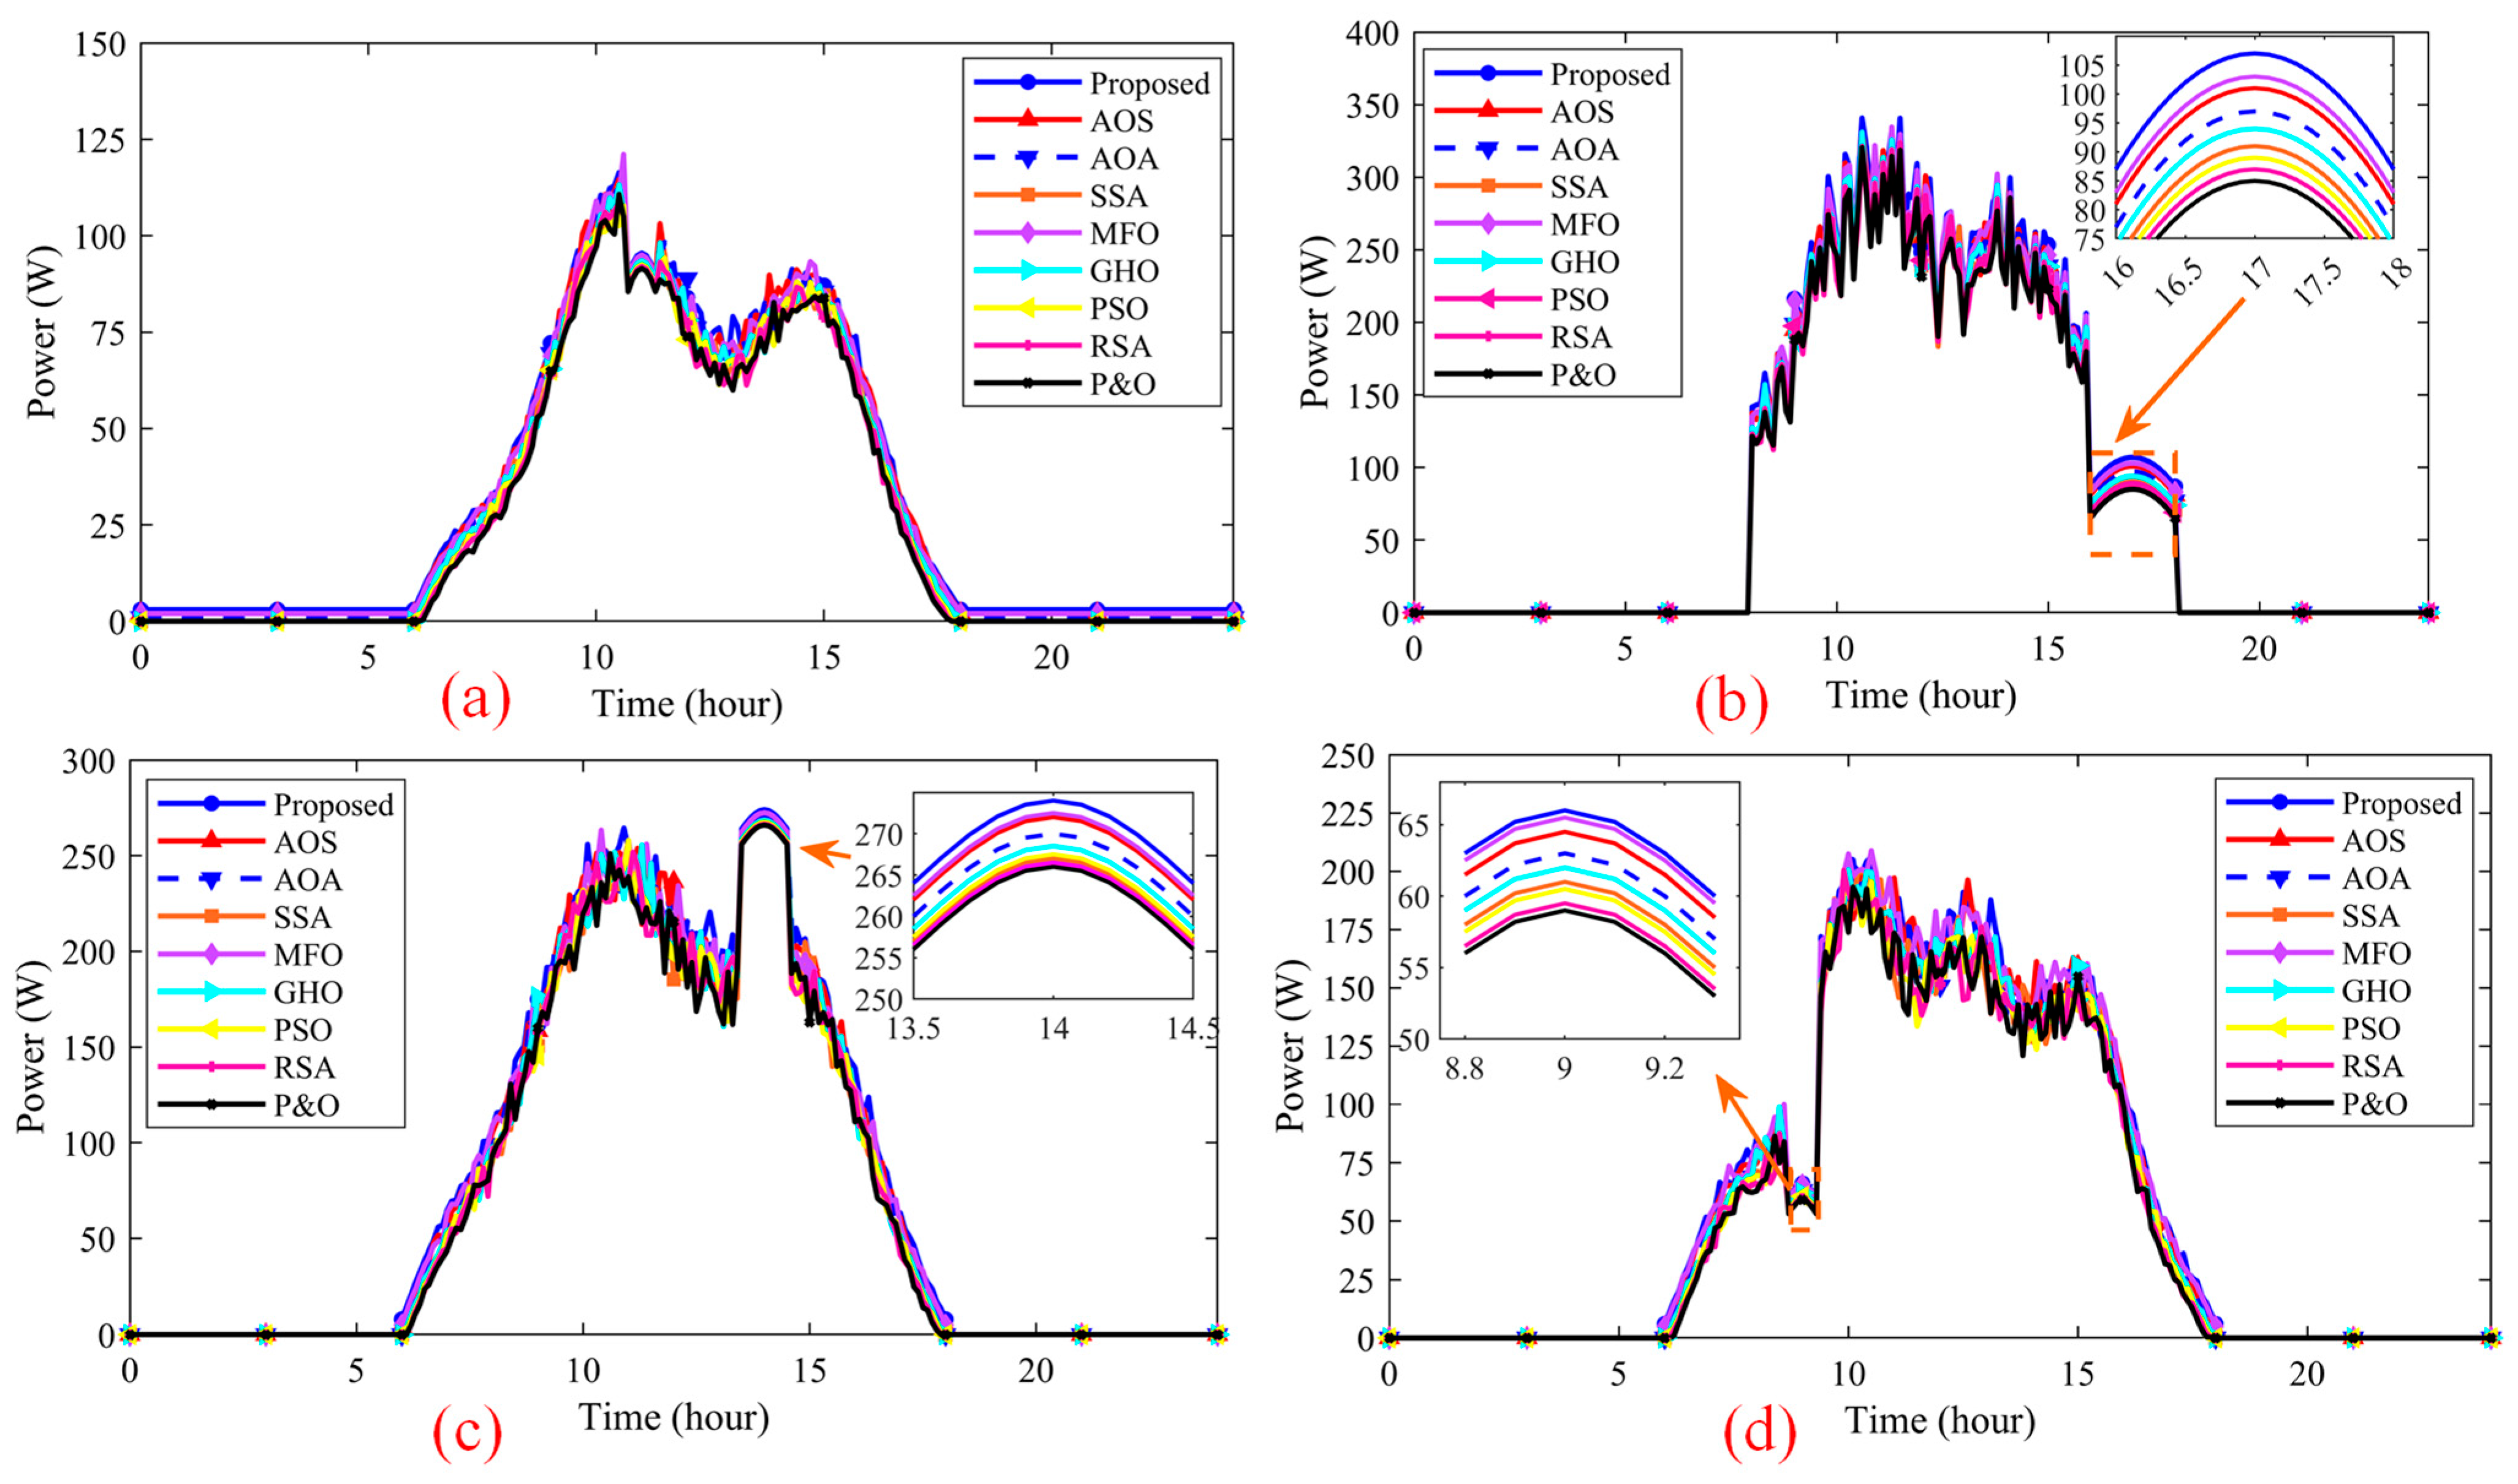
Figure 22a–d compares the instantaneous power over representative days in spring, summer, autumn, and winter. In all seasons, the RBBMO-tuned adaptive FOPID forms the upper envelope of the power trajectories: it ramps earlier in the morning, tracks mid-day peaks more tightly, and suppresses small cloud-induced dips more effectively than the baselines (AOS, AOA, SSA, MFO, GHO, PSO, RSA, P&O). The insets highlight the consistent margin near the noon plateau, where the proposed method maintains a slightly higher and smoother output; this advantage is most visible in summer (high irradiance) and winter (low-temperature, rapidly varying irradiance) conditions.
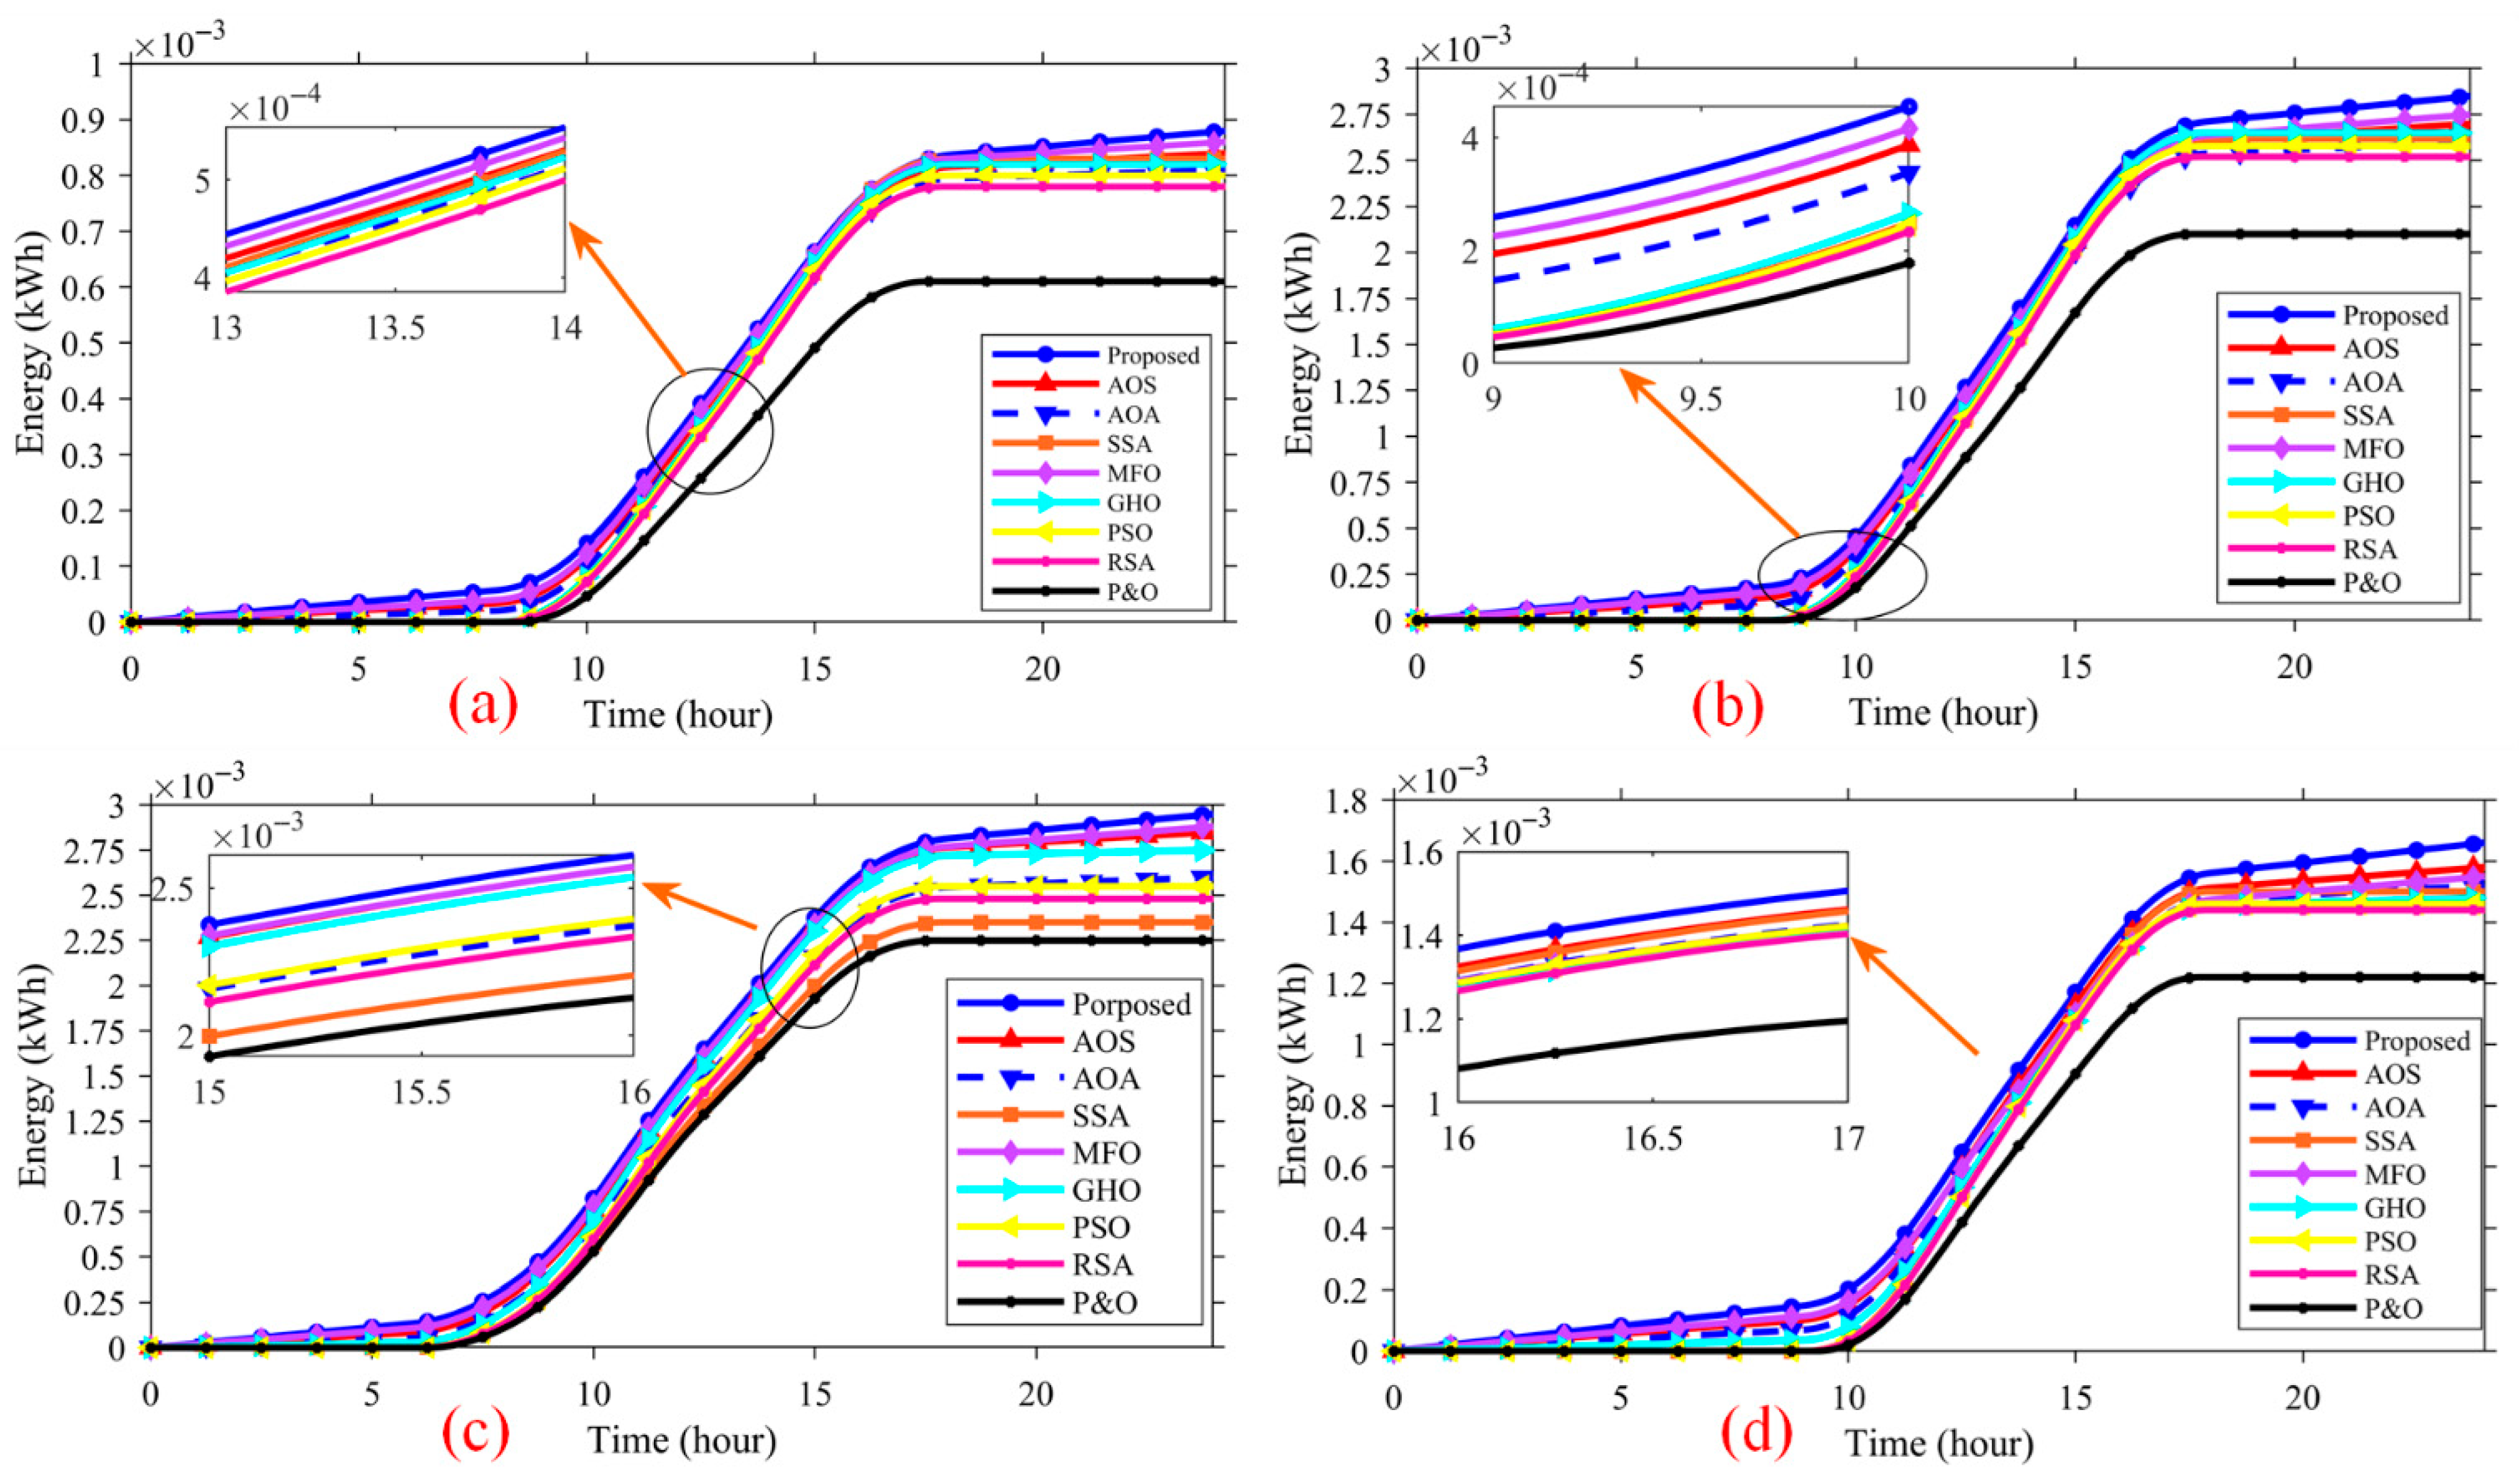
Figure 23a–d shows daily energy accumulation for spring, summer, autumn, and winter when the hybrid PV-TEG system is driven by the field irradiance/temperature of Figure 21. In every season, the RBBMO-tuned adaptive FOPID forms the upper envelope of all curves: it rises earlier in the morning, keeps a higher mid-day plateau, and preserves its lead to sunset. The insets highlight that the advantage persists even in short windows around the noon peak.
End-of-day energies indicate consistent gains for the proposed method:
  • Spring (Figure 23a): proposed 0.88 × 10⁻³ kWh vs. AOS 0.85, AOA 0.83, PSO 0.82, RSA 0.80, P&O 0.72 → 3–8% better than the strongest baseline and 20% over P&O.
  • Summer (Figure 23b): proposed 2.95 × 10⁻³ kWh vs. AOS 2.85, AOA 2.75, GHO/MFO/SSA 2.70–2.80, P&O 2.10 → 3–7% over the best competitor and 30% over P&O.
  • Autumn (Figure 23c): proposed 2.90 × 10⁻³ kWh vs. AOS 2.80 and others 2.60–2.75 → 3–10% higher.
  • Winter (Figure 23d): proposed 1.55 × 10⁻³ kWh vs. AOS/RSA 1.48–1.50 and P&O 1.20 → 3–5% over the best baseline and 25–30% over P&O.
These results confirm, with field variability, that the RBBMO-tuned adaptive FOPID consistently harvests more daily energy than all benchmarks by pairing fast reacquisition with low oscillation losses.

4.6. Robustness Evaluation Under Environmental Uncertainty

To probe robustness and generalizability under realistic operating dispersion, we introduce controlled environmental uncertainties and evaluate MPPT performance using three metrics: average power output Pavgout, maximum variability Δvmax (peak-to-peak ripple normalized to the mean in a steady window), and average variability Δvavg (mean absolute deviation normalized to the mean).

4.6.1. Temperature Variation Test

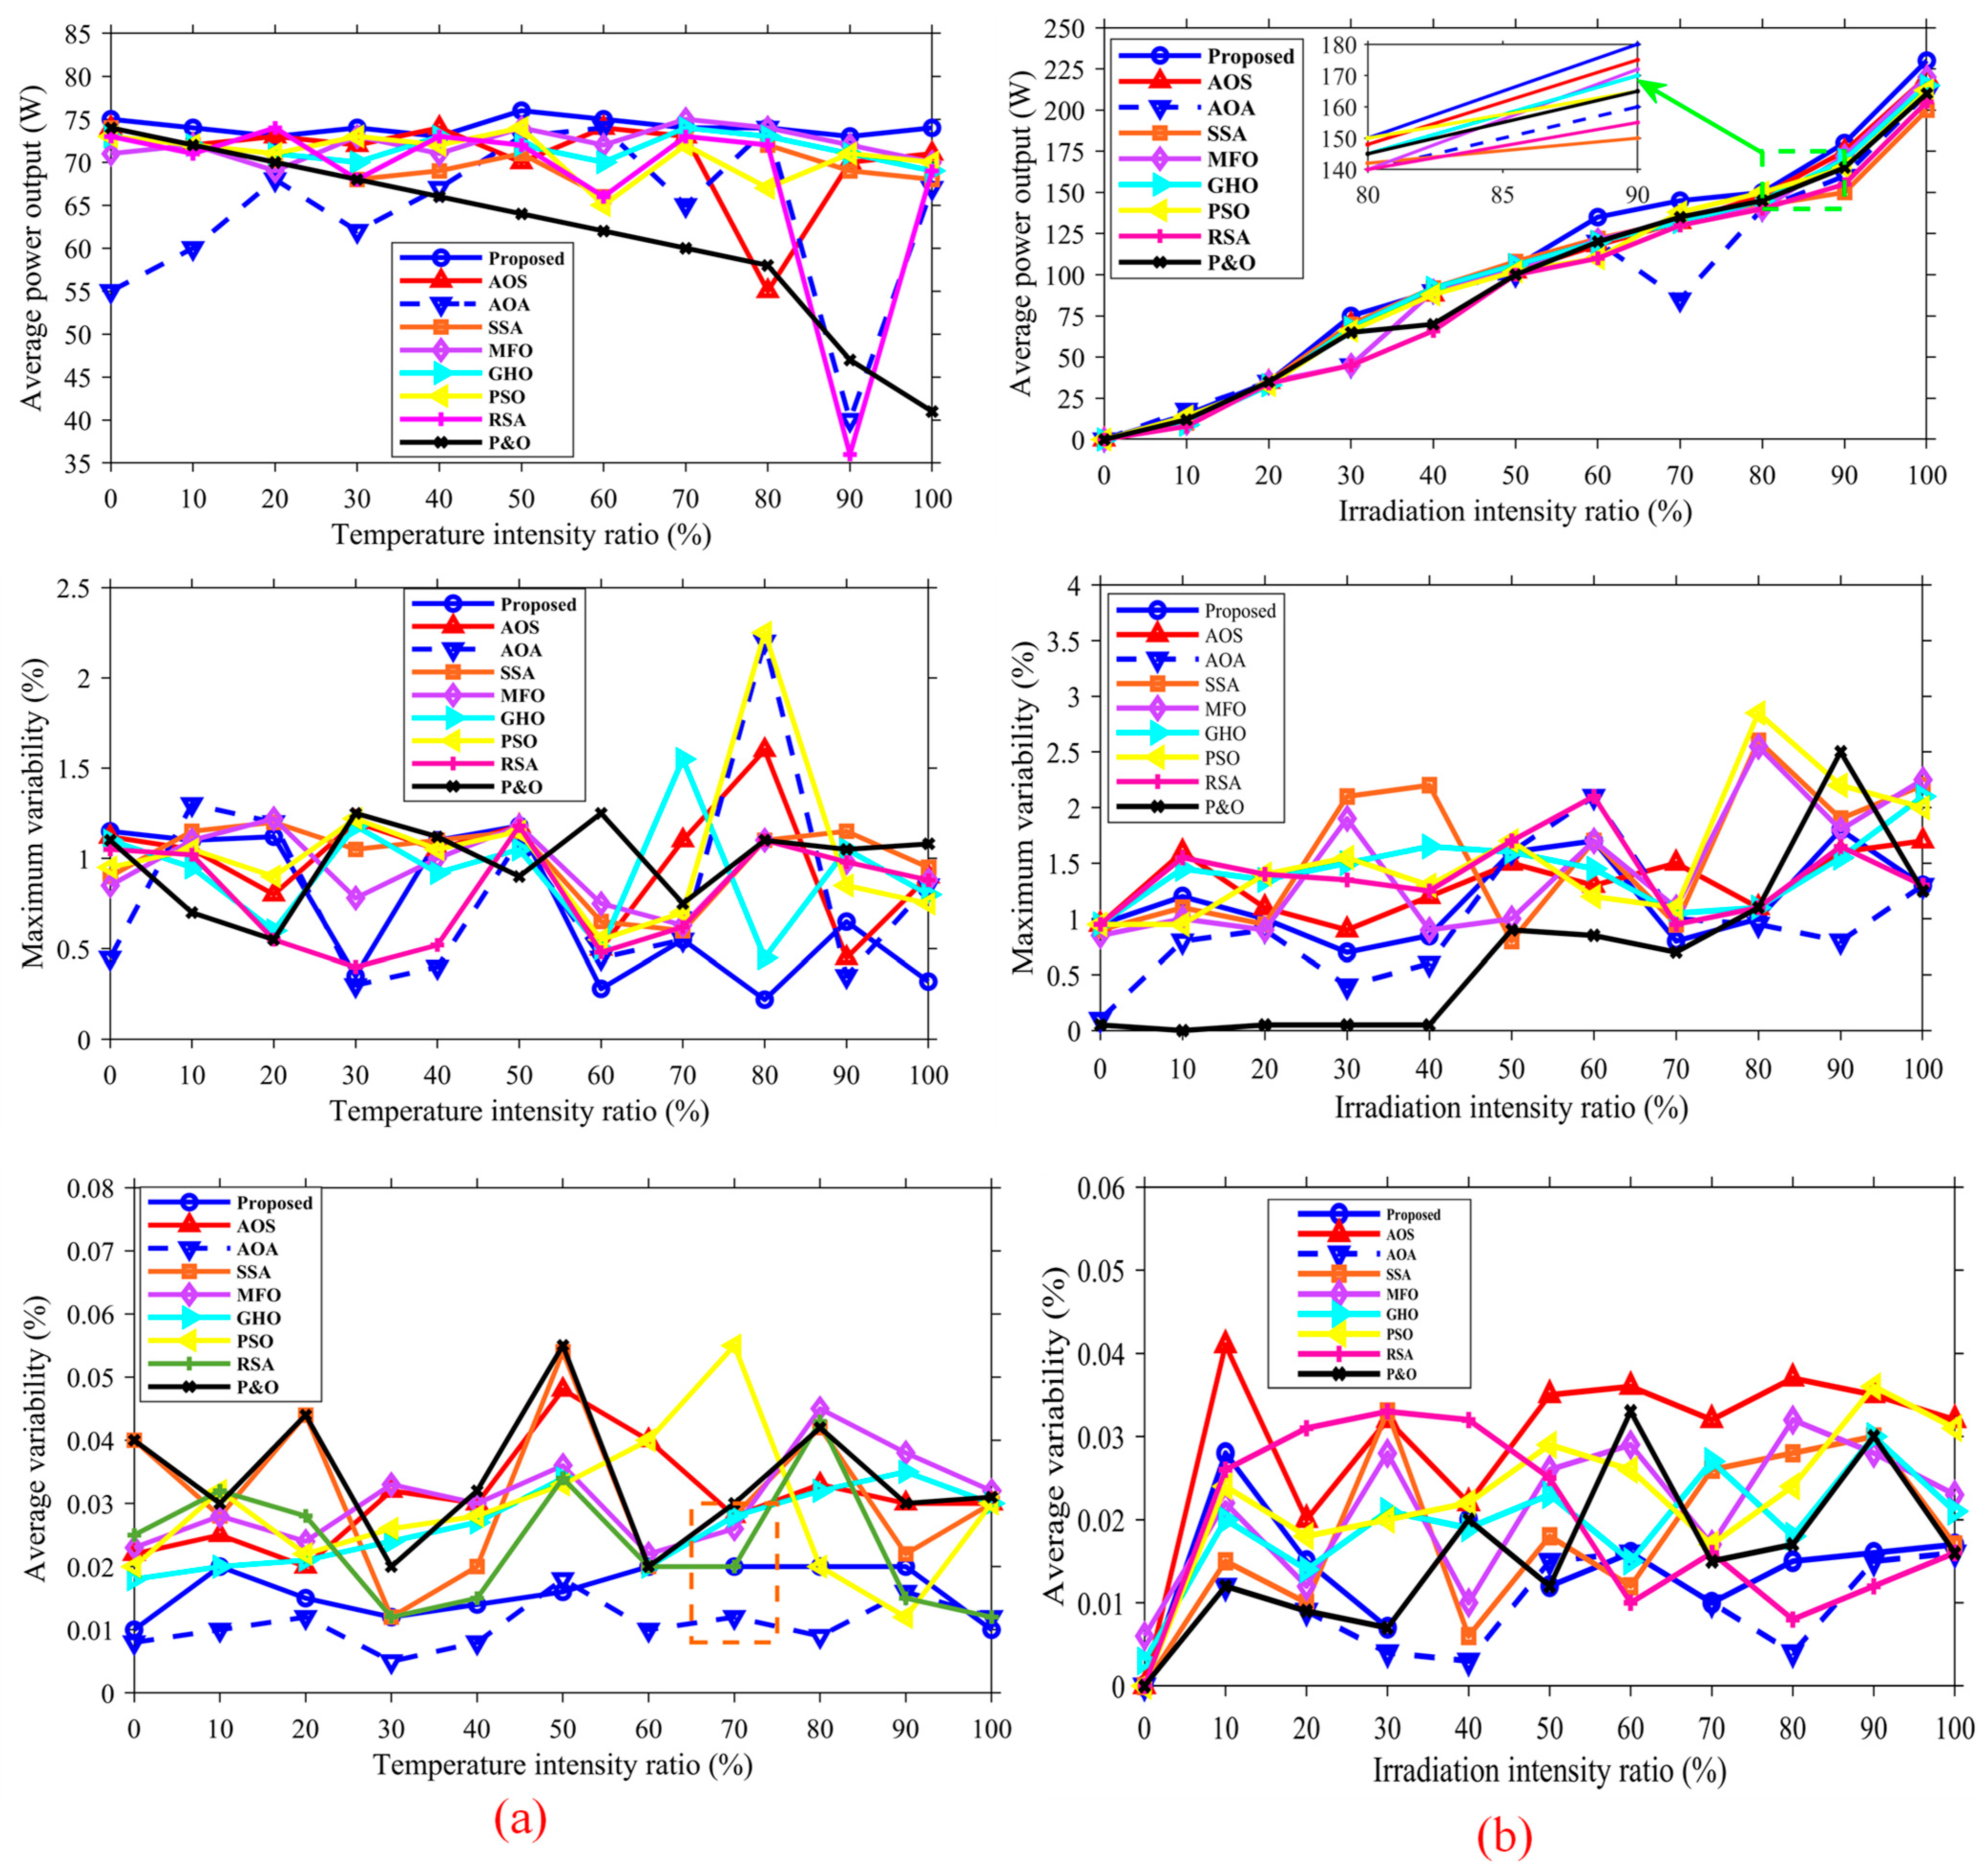
To isolate temperature effects, irradiance is fixed at 600 W/m2 while the ambient temperature sweeps 0–40 °C in 5 °C increments (the abscissa in Figure 24a is expressed as a temperature-intensity ratio, 0–100%).
  • Average power (Figure 24a). All methods show the expected downward trend with rising temperature, but the RBBMO-tuned adaptive FOPID sustains the highest power at every operating point and degrades the least: it drops only 2.74% (from 75.55 W to 73.48 W). In contrast, RSA falls from 74.17 W to 63.55 W (14.32%), and the deterministic P&O suffers the sharpest decline, from 68.89 W to 41.49 W (40%). Several meta-heuristics also exhibit temperature-sensitivity spikes (e.g., abrupt dips near 80–90% intensity), indicating susceptibility to thermally induced local optima.
  • Maximum variability (Figure 24a). The proposed method maintains low and flat Δvmax across the sweep and levels off beyond 50% intensity, evidencing strong convergence stability at higher temperatures. Some competitors (e.g., AOA, GHO) show isolated spikes up to 2% around 70–80%. Notably, P&O appears near-zero in variability, but this reflects early stagnation near a suboptimal LMPP, not robustness, consistent with its low Pavgout.
  • Average variability (Figure 24a). While AOA attains a relatively small Δvavg in mid-range temperatures, it does so with lower power levels than the proposed method. The RBBMO-FOPID achieves a similarly low variability band (0.01–0.03%) and maintains the highest average power, yielding the best overall stability, performance trade-off.
Overall, under temperature uncertainty, the RBBMO-tuned adaptive FOPID is the most temperature-resilient: it combines minimal power derating, low variability, and the absence of instability spikes, whereas classic P&O underperforms due to fixed-step stagnation and several meta-heuristics exhibit temperature-sensitive dips.

4.6.2. Irradiance Variation Test

To evaluate adaptability to changing solar input, the irradiance intensity ratio was swept from 0–100% (0–1000 W/m2) in 5% steps while holding the ambient temperature at 25 °C.
  • Figure 24b shows the expected monotonic rise of the average power output with irradiance for all methods; however, the RBBMO-tuned adaptive FOPID remains highest across the range and becomes the clear leader for irradiance ≥ 80%. At 100% irradiance, the proposed method delivers 230–235 W, exceeding AOS by 2–4%, GHO/MFO by 5–8%, PSO by 8–10%, and P&O by 15%. A pronounced dip around 70% is visible for AOA, suggesting a convergence slip toward a suboptimal operating point.
  • The maximum variability results in Figure 24b indicate that the proposed controller maintains a low and smooth profile (generally ≤ 1–1.5%), whereas most meta-heuristics (e.g., AOA, RSA, AOS, SSA) exhibit spikes, especially in the low-irradiance zone (5–30%) where the MPP signal is weak and search becomes noise-sensitive. For example, RSA shows a sharp rise in variability from 0% to 10% irradiance (95% relative increase). Although P&O appears to have very low variability, this stems from early stagnation near a local optimum, consistent with its lower average power.
  • Figure 24b (average variability) shows a similar story: the proposed method tracks with consistently low values (0.01–0.02%) and no abrupt excursions, while competitors exhibit multiple peaks up to 0.03–0.05%. AOA attains low variability in some intervals, but at the cost of lower power.
Overall, the RBBMO-tuned adaptive FOPID offers the best performance, stability trade-off under irradiance uncertainty: higher harvested power with lower variability across the full irradiance spectrum.

4.7. Techno-Environmental Assessment

We assess MPPT performance primarily by the harvested energy and, secondarily, by power-stability indices that reflect steady-state quality. The fluctuation metrics are shown in Equation (49):
Δ v m a x = m a x t = 2 , , T P o u t ( t ) P o u t ( t 1 ) P o u t a v g , Δ v a v g = 1 T 1 t = 2 T P o u t ( t ) P o u t ( t 1 ) P o u t a v g ,
where T is the total operation time, t is the discrete time index, Pout(t) and Pout(t−1) are PV-TEG power at the current and previous steps, and Poutavg is the mean output power over the window. (Both Δvmax and Δvavg are reported in %.)
Table 7 compiles energy and fluctuation statistics for eight meta-heuristic MPPT methods together with our proposed method (RBBMO-tuned adaptive FOPID). The classical P&O algorithm is omitted from the fluctuation rows because it often stagnates prematurely near a local MPP; this produces deceptively small variability despite low energy harvest.
  • Start-up/search phase (1 s window). The RBBMO-tuned adaptive FOPID (Proposed) obtains the highest energy (1950 W·s), beating AOS (+2.1%), PSO (+3.7%), MFO (+9.6%), SSA (+18.2%), GHO (+21.9%), RSA (+85.7%), AOA (+364%), and P&O (+875%). It also exhibits the lowest fluctuations among meta-heuristics (Δvmax = 13.0%, Δvavg = 0.15%), roughly 50–75% lower than typical baselines (AOS 26%, PSO 32%, … AOA 58%). This indicates fast settling with minimal overshoot.
  • Stepwise variations in irradiance. Energy after 1 s is 965 W·s for the proposed controller—higher than AOS (+7.2%), GHO (+9.7%), RSA (+16.3%), AOA (+22.2%), MFO (+30.4%), P&O (+39.9%), and far above PSO (+135%) and SSA (+69%). Stability is again superior (Δvmax = 20.3%, Δvavg = 0.32%), the smallest among meta-heuristics (others range Δvmax = 23.5–39% and Δvavg = 0.34–0.62%). The controller reacquires each new MPP quickly and limits oscillation losses.
  • Partial shading. The proposed method consistently locks onto the global peak, delivering 1950–2000 W·s, exceeding AOS by ~1–3%, MFO/GHO by ~8–12%, and RSA/PSO by ≥15% (AOA and P&O trail further). Fluctuations remain the lowest class (Δvmax = 18.0%, Δvavg = 0.28%; others typically 25–38% and 0.40–0.60%). This confirms robust global MPP tracking and a stable, steady state.
  • Field-measured irradiance and temperature (Shanxi Province, four representative days). Daily energy is the largest for the proposed in each season: Spring: 0.00088 kWh (3–10% above most baselines). Δvavg = 0.0254% (top-tier; only GHO is slightly lower at 0.0214%). Summer: 0.00295 kWh (3–9% above strong baselines). Δvavg = 0.0342% (within the low group). Autumn: 0.00290 kWh (4–9% advantage). Δvavg = 0.0269% (among the lowest). Winter: 0.00155 kWh (3–8% advantage). Δvavg = 0.0240% (lowest or co-lowest). Across seasons, the proposed controller pairs higher energy yield with small average fluctuations (≈0.024–0.034%), maintaining a favorable energy–stability trade-off under real weather variability.
A shown in Figure 25, the RBBMO-tuned adaptive FOPID is consistently best in energy harvesting across laboratory and field scenarios while keeping fluctuations low. Its advantage comes from fast reacquisition of the MPP after disturbances and a smooth duty profile that avoids ripple-induced losses. Although we report P&O’s numbers, its deceptively small Δv stems from premature convergence and aligns with its lowest energy across scenarios; it is therefore excluded from stability comparisons.

5. Conclusions

This paper presented an RBBMO-tuned adaptive FOPID MPPT for hybrid PV-TEG conversion. The design couples (i) an offline RBBMO stage that learns effective bounds/weights for Kp, Ki, Kd, λ, μ, (ii) an online adaptive update driven by the dP/dV error so that the fractional orders (λ,μ) and gains track operating changes in real time. Five comprehensive case studies and two uncertainty sweeps demonstrate that the method consistently delivers faster convergence, lower ripple, and higher energy than AOS, PSO, MFO, SSA, GHO, RSA, AOA, and P&O:
  • Start-up/search: t95 = 0.06 s and settling = 0.12 s with 1950 W·s energy (closest baseline AOS 1910 W·s).
  • Stepwise irradiance: ≥95% reacquisition in 0.06–0.08 s, settling 0.12–0.15 s, and 0.95–0.98 kJ energy at 1 s; ripple ≈ ±1%, about 30% average stability improvement vs. SSA.
  • Partial shading: reliable escape from local peaks and lock-in to the global peak with 1.95–2.00 kJ at 1 s (AOS 1.90–1.96 kJ; PSO ≈ 1.70 kJ); duty jitter ≈ ±1%.
  • Load steps: fastest reacquisition at every step (0.06–0.08 s to 95%), smallest transient dips (≈5–8%), and tight duty control.
  • Field data (Shanxi Province): daily energies of 0.88 × 10⁻³, 2.95 × 10⁻³, 2.90 × 10⁻³, 1.55 × 10⁻³ kWh in spring/summer/autumn/winter, exceeding the strongest baseline by 3–10% and P&O by 20–30%. Seasonal variability is low (e.g., Δvmax = 8.43–9.43% and Δvavg = 0.024–0.034% for the proposed tracker), whereas P&O’s apparently small variability stems from premature stagnation and low energy.
Robustness analyses confirm resilience to environmental dispersion: with irradiance fixed at 600 W m−2 and 0–40 °C, the proposed method derates by only 2.74% (RSA 14.32%, P&O 40%); across 0–100% irradiance at 25 °C it preserves the highest average power (≈230–235 W at full sun) while keeping Δvmax generally ≤1–1.5%.
Overall, the RBBMO-adaptive FOPID offers a strong performance–stability trade-off—fast (sub-0.1 s) tracking, ≈±1% ripple, and the best energy yield in all tests—making it a practical MPPT for hybrid PV-TEG systems under real-world variability. The added computational cost of the adaptive fractional structure is modest and acceptable for DSP/MCU deployment.
Validation, Limitations, and Future Work
This study evaluates the proposed controller in simulation using MATLAB/Simulink with field-measured climatic inputs (irradiance/ambient temperature). We do not claim hardware validation here. Model coherence was checked by (i) parameterizing the PV single-diode and TEG electro-thermal models from datasheet ranges (Table 2 and Table 3), (ii) enforcing consistent energy accounting and unit conversions, and (iii) repeating runs across random seeds for the meta-tuning stage to verify ranking robustness. All practice-level remarks (e.g., EMI, lifetime) are framed as qualitative implications only. Future work will (i) extend-loop and grid-tied operation, (ii) add EMI/EMC testing and junction/capacitor thermal-stress cycling, and (iii) provide a screening-level techno-economic sensitivity linking tracking efficiency and ripple to annual energy and component lifetime. All controller/optimizer configs (bounds, seeds, sampling, filters) are released in the supplement to facilitate replication.

Author Contributions

Conceptualization, A.-W.I., H.M.H.F. and K.A.; methodology, A.-W.I., H.M.H.F. and A.A.A.-S.; software, A.-W.I. and J.X.; visualization, A.-W.I. and K.A.; validation, A.-W.I., D.L. and A.A.A.-S.; formal analysis, A.-W.I., H.M.H.F. and A.A.A.-S.; investigation, J.X., H.M.H.F. and A.A.A.-S.; data curation, A.-W.I. and H.M.H.F.; writing—original draft preparation, A.-W.I. and J.X.; writing—review and editing, A.-W.I., H.M.H.F. and D.L.; supervision, H.M.H.F. and A.A.A.-S.; project administration, J.X. and A.A.A.-S.; funding acquisition H.M.H.F. All authors have read and agreed to the published version of the manuscript.

Funding

This work was supported and funded by the Deanship of Scientific Research at Imam Mohammad Ibn Saud Islamic University (IMSIU) (grant number: IMSIU-DDRSP2503).

Data Availability Statement

The original contributions presented in this study are included in the article. Further inquiries can be directed to the corresponding author.

Acknowledgments

The authors extend their appreciation to the Deanship of Scientific Research at Imam Mohammad Ibn Saud Islamic University (IMSIU) (grant number: IMSIU-DDRSP2503).

Conflicts of Interest

The authors declare that they have no known competing financial interests or personal relationships that could have appeared to influence the work reported in this paper.

Appendix A

Table A1. Thermal–electrical coupling parameters.
SymbolParameterValueUnitSource/Note
αSeebeck coefficient (module)215µV/KDatasheet, 25 °C
RintInternal resistance4.2ΩMeasured (4-wire), 25 °C
KThermal conductance (hot–cold)1.8W/KDatasheet
ZTFigure of merit (avg)0.9Manufacturer typical
ATEGTEG contact area40 × 40mm2Geometry
tTIMTIM thickness100µmSpecified adhesive
Rth,cContact thermal resistance0.15K/WVendor app note
(kPVPV backsheet conductivity0.2W·m−1·K−1Literature
tPVPV backsheet thickness0.3mmLiterature
Rth,hsHeat-sink thermal resistance3.0K/WHeatsink datasheet
hbackBack-side convection coeff.10W·m−2·K−1No-wind assumption
GIrradiance1000W·m−2Case study
TAmbient temperature25°CCase study
ΔtSimulation time step0.1sTransient run

References

  1. Ibrahim, A.-W.; Farh, H.M.H.; Al-Shamma’a, A.A. A Comprehensive Review of MPPT Strategies for Hybrid PV-TEG Systems: Advances, Challenges, and Future Directions. Mathematics 2025, 13, 2900. [Google Scholar] [CrossRef]
  2. Abbassi, R. Design of a Novel Chaotic Horse Herd Optimizer and Application to MPPT for Optimal Performance of Stand-Alone Solar PV Water Pumping Systems. Mathematics 2024, 12, 594. [Google Scholar] [CrossRef]
  3. Dong, F.; Li, Y.; Gao, Y.; Zhu, J.; Qin, C.; Zhang, X. Energy transition and carbon neutrality: Exploring the non-linear impact of renewable energy development on carbon emission efficiency in developed countries. Resour. Conserv. Recycl. 2022, 177, 106002. [Google Scholar] [CrossRef]
  4. Fan, S.; Wang, Y.; Cao, S.; Sun, T.; Liu, P. A novel method for analyzing the effect of dust accumulation on energy efficiency loss in photovoltaic (PV) system. Energy 2021, 234, 121112. [Google Scholar] [CrossRef]
  5. Zaky, A.A.; Ibrahim, M.N.; Taha, I.B.M.; Yousif, B.; Sergeant, P.; Hristoforou, E.; Falaras, P. Perovskite solar cells and thermoelectric generator hybrid array feeding a synchronous reluctance motor for an efficient water pumping system. Mathematics 2022, 10, 2417. [Google Scholar] [CrossRef]
  6. Amalu, E.H.; Fabunmi, O.A. Thermal control of crystalline silicon photovoltaic (c-Si PV) module using Docosane phase change material (PCM) for improved performance. Sol. Energy 2022, 234, 203–221. [Google Scholar] [CrossRef]
  7. Yin, Z.; Zhang, T.; Cai, J.; Fan, Y.; Shi, Z. Investigation on the operating characteristics of a directly-attached light crystalline silicon PV roof. Sol. Energy 2023, 262, 111849. [Google Scholar] [CrossRef]
  8. Jamali, E.; Nobakhti, M.H.; Ziapour, B.M.; Khayat, M. Performance analysis of a novel model of photovoltaic PV-TEGs system enhanced with flat plate mirror reflectors. Energy Convers. Manag. 2023, 279, 116766. [Google Scholar] [CrossRef]
  9. Eikeland, O.F.; Kelsall, C.C.; Buznitsky, K.; Verma, S.; Bianchi, F.M.; Chiesa, M.; Henry, A. Power availability of PV plus thermal batteries in real-world electric power grids. Appl. Energy 2023, 348, 121572. [Google Scholar] [CrossRef]
  10. Gao, Y.; Wu, D.; Dai, Z.; Wang, C.; Zhu, L.; Zhang, J.; Xu, G.; Zhang, X. A passive evaporative cooling strategy to enhance the electricity production of hybrid PV-STEG system. Appl. Energy 2023, 349, 121689. [Google Scholar] [CrossRef]
  11. De Luca, D.; Strazzullo, P.; Di Gennaro, E.; Caldarelli, A.; Gaudino, E.; Musto, M.; Russo, R. High vacuum flat plate photovoltaic-thermal (HV PV-T) collectors: Efficiency analysis. Appl. Energy 2023, 352, 121895. [Google Scholar] [CrossRef]
  12. Tyagi, K.; Gahtori, B.; Kumar, S.; Dhakate, S.R. Advances in solar thermoelectric and photovoltaic-thermoelectric hybrid systems for power generation. Sol. Energy 2023, 254, 195–212. [Google Scholar] [CrossRef]
  13. Qasim, M.A.; Velkin, V.I.; Shcheklein, S.E. Experimental study on hybridization of a PV-TEG system for electrical performance enhancement using heat exchangers, energy, exergy and economic levelized cost of energy (LCOE) analysis. Clean Energy 2023, 7, 808–823. [Google Scholar] [CrossRef]
  14. Yang, B.; Zeng, C.; Li, D.; Guo, Z.; Chen, Y.; Shu, H.; Cao, P.; Li, Z. Improved immune genetic algorithm based TEG system reconfiguration under non-uniform temperature distribution. Appl. Energy 2022, 325, 119691. [Google Scholar] [CrossRef]
  15. Ibrahim, A.W.; Xu, J.; Hussein Farh, H.M.; Al-Shamma’a, A.A.; Yang, Y.; Shi, Z.; Zafar, M.H. An efficient linear-extrapolation catch-fish algorithm for maximizing the harvested power from thermoelectric generators sources. Appl. Therm. Eng. 2025, 268, 125916. [Google Scholar] [CrossRef]
  16. Skoplaki, E.; Palyvos, J.A. Operating temperature of photovoltaic modules: A survey of pertinent correlations. Renew. Energy 2009, 34, 23–29. [Google Scholar] [CrossRef]
  17. Yang, B.; Xie, R.; Wu, S.; Han, Y. Hybrid PV-TEG system maximum power point tracking based on an exponential distribution optimizer. Power Syst. Prot. Control 2024, 52, 12–25. [Google Scholar]
  18. Manna, S.; Akella, A.K.; Singh, D.K. Novel Lyapunov-based rapid and ripple-free MPPT using a robust model reference adaptive controller for solar PV system. Prot. Control Mod. Power Syst. 2023, 8, 1–25. [Google Scholar] [CrossRef]
  19. Zhang, X.; Tan, T.; Yang, B.; Wang, J.; Li, S.; He, T.; Yang, L.; Yu, T.; Sun, L. Greedy search based data-driven algorithm of centralized thermoelectric generation system under non-uniform temperature distribution. Appl. Energy 2020, 260, 114232. [Google Scholar] [CrossRef]
  20. Yang, B.; Li, Y.; Huang, J.; Li, M.; Zheng, R.; Duan, J.; Fan, T.; Zou, H.; Liu, T.; Wang, J. Modular reconfiguration of hybrid PV-TEG systems via artificial rabbit algorithm: Modelling, design and HIL validation. Appl. Energy 2023, 351, 121868. [Google Scholar] [CrossRef]
  21. Singh, S.; Saini, S.; Gupta, S.K.; Kumar, R. Solar-PV inverter for the overall stability of power systems with intelligent MPPT control of DC-link capacitor voltage. Prot. Control Mod. Power Syst. 2023, 8, 1–20. [Google Scholar] [CrossRef]
  22. Wang, J.; Wen, J.; Wu, S.; Yang, B.; Zeng, P.; Jiang, L. Optimal green energy harvesting for hybrid photovoltaic-thermoelectric generator system via chaotic RIME optimizer: A techno-environmental assessment. Prot. Control Mod. Power Syst. 2025, 10, 63–80. [Google Scholar] [CrossRef]
  23. Motahhir, S.; Chalh, A.; El Ghzizal, A.; Derouich, A. Development of a low-cost PV system using an improved INC algorithm and a PV panel Proteus model. J. Clean. Prod. 2018, 204, 355–365. [Google Scholar] [CrossRef]
  24. Mohanty, S.; Subudhi, B.; Member, S.; Ray, P.K. A Grey Wolf Assisted Perturb & Observe MPPT Algorithm for a PV System. IEEE Trans. Energy Convers. 2016, 32, 340–347. [Google Scholar] [CrossRef]
  25. Zhang, X.; Yang, B.; Yu, T.; Jiang, L. Dynamic Surrogate Model based optimization for MPPT of centralized thermoelectric generation systems under heterogeneous temperature difference. IEEE Trans. Energy Convers. 2020, 35, 966–976. [Google Scholar] [CrossRef]
  26. Refaat, A.; Ali, Q.A.; Elsakka, M.M.; Elhenawy, Y.; Majozi, T.; Korovkin, N.V.; Elfar, M.H. Extraction of maximum power from PV system based on horse herd optimization MPPT technique under various weather conditions. Renew. Energy 2024, 220, 119718. [Google Scholar] [CrossRef]
  27. Salim, J.A.; Albaker, B.M.; Alwan, M.S.; Hasanuzzaman, M. Hybrid MPPT approach using Cuckoo Search and Grey Wolf Optimizer for PV systems under variant operating conditions. Glob. Energy Interconnect. 2022, 5, 627–644. [Google Scholar] [CrossRef]
  28. Sarvi, M.; Azadian, A. A comprehensive review and classified comparison of MPPT algorithms in PV systems. Energy Syst. 2022, 13, 281–320. [Google Scholar] [CrossRef]
  29. Khan, N.M.; Mansoor, M.; Mirza, A.F.; Moosavi, S.K.R.; Qadir, Z.; Zafar, M.H. Energy harvesting and stability analysis of centralized TEG system under non-uniform temperature distribution. Sustain. Energy Technol. Assess. 2022, 52, 102028. [Google Scholar] [CrossRef]
  30. Khan, M.K.; Zafar, M.H.; Mansoor, M.; Mirza, A.F.; Khan, U.A.; Khan, N.M. Green energy extraction for sustainable development: A novel MPPT technique for hybrid PV-TEG system. Sustain. Energy Technol. Assess. 2022, 53, 102388. [Google Scholar]
  31. Mirza, A.F.; Mansoor, M.; Zerbakht, K.; Javed, M.Y.; Zafar, M.H.; Khan, N.M. High-efficiency hybrid PV-TEG system with intelligent control to harvest maximum energy under various non-static operating conditions. J. Clean. Prod. 2021, 320, 128643. [Google Scholar] [CrossRef]
  32. Yang, B.; Wu, S.; Huang, J.; Guo, Z.; Wang, J.; Zhang, Z.; Xie, R.; Shu, H.; Jiang, L. Salp swarm optimization algorithm based MPPT design for PV-TEG hybrid system under partial shading conditions. Energy Convers. Manag. 2023, 292, 117410. [Google Scholar] [CrossRef]
  33. Liu, W.; Lu, M.; Bai, H.; Liu, Z.; Lv, S. All-day autonomous MPPT energy storage PV-TEG hybrid system based on dual axis solar tracker. Renew. Energy 2025, 256, 124094. [Google Scholar]
  34. Abdullah, A.M.; Rezk, H.; Elbloye, A.; Hassan, M.K.; Mohamed, A.F. Grey Wolf Optimizer-Based Fractional MPPT for Thermoelectric Generator. Intell. Autom. Soft Comput. 2021, 29, 730. [Google Scholar] [CrossRef]
  35. Al-Dhaifallah, M.; Saif, A.-W.A.; Elferik, S.; Elkhider, S.M.; Aldean, A.S. Combining Sliding Mode and Fractional-Order Theory for Maximum Power Point Tracking Enhancement of Variable-Speed Wind Energy Conversion. Fractal Fract. 2024, 8, 447. [Google Scholar]
  36. Rangi, S.; Jain, S.; Arya, Y. Utilization and performance comparison of several HESSs with cascade optimal-FOD controller for multi-area multi-source power system under deregulated environment. J. Energy Storage 2024, 94, 112469. [Google Scholar] [CrossRef]
  37. Ruiz, F.; Pichardo, E.; Aly, M.; Vazquez, E.; Avalos, J.G.; Sánchez, G. A high-performance fractional order controller based on chaotic manta-ray foraging and artificial ecosystem-based optimization algorithms applied to dual active bridge converter. Fractal Fract. 2024, 8, 332. [Google Scholar]
  38. Al-Dhaifallah, M.; Nassef, A.M.; Rezk, H.; Nisar, K.S. Optimal parameter design of fractional order control based INC-MPPT for PV system. Sol. Energy 2018, 159, 650–664. [Google Scholar] [CrossRef]
  39. Rezk, H.; Alhato, M.M.; Al-Dhaifallah, M.; Bouallègue, S. A sine cosine algorithm-based fractional mppt for thermoelectric generation system. Sustainability 2021, 13, 11650. [Google Scholar] [CrossRef]
  40. Aly, M.; Rezk, H. Optimum hybrid fractional order maximum power point tracker for thermoelectric generators. Energy Rep. 2025, 13, 5486–5500. [Google Scholar] [CrossRef]
  41. Mohamed, E.A.; Ahmed, E.M.; Elmelegi, A.; Aly, M.; Elbaksawi, O.; Mohamed, A.-A.A. An optimized hybrid fractional order controller for frequency regulation in multi-area power systems. IEEE Access 2020, 8, 213899–213915. [Google Scholar] [CrossRef]
  42. Mseddi, A.; Abid, A.; Naifar, O.; Rhaima, M.; Ben Makhlouf, A.; Mchiri, L. Investigation of the robust fractional order control approach associated with the online analytic unity magnitude shaper: The case of wind energy systems. Fractal Fract. 2024, 8, 187. [Google Scholar] [CrossRef]
  43. Verma, V.; Kane, A.; Singh, B. Complementary performance enhancement of PV energy system through thermoelectric generation. Renew. Sustain. Energy Rev. 2016, 58, 1017–1026. [Google Scholar] [CrossRef]
  44. Obaid, W.; Hamid, A.-K. Grid-connected hybrid solar/thermoelectric power system with hybrid INC/PSO/PO MPPT system in Sharjah, United Arab Emirates. In Proceedings of the 2022 Advances in Science and Engineering Technology International Conferences (ASET), Dubai, United Arab Emirates, 21–24 February 2022; IEEE: New York, NY, USA, 2022; pp. 1–5. [Google Scholar]
  45. Qasim, M.A.; Alwan, N.T.; PraveenKumar, S.; Velkin, V.I.; Agyekum, E.B. A new maximum power point tracking technique for thermoelectric generator modules. Inventions 2021, 6, 88. [Google Scholar] [CrossRef]
  46. Olabi, A.G.; Rezk, H.; Sayed, E.T.; Awotwe, T.; Alshathri, S.I.; Abdelkareem, M.A. Optimal Parameter Identification of Single-Sensor Fractional Maximum Power Point Tracker for Thermoelectric Generator. Sustainability 2023, 15, 5054. [Google Scholar] [CrossRef]
  47. Yang, B.; Xie, R.; Shu, H.; Han, Y.; Zheng, C.; Lu, H.; Luo, E.; Ren, Y.; Jiang, L.; Sang, Y. Techno-economic-environmental optimization of hybrid photovoltaic-thermoelectric generator systems based on data-driven approach. Appl. Therm. Eng. 2024, 257, 124222. [Google Scholar] [CrossRef]
  48. Xie, R.; Wu, S.; Yang, B. MPPT Design for Hybrid PV-TEG System under Partial Shading Condition via Manta Ray Foraging Optimization. In Proceedings of the 2023 5th International Conference on Power and Energy Technology ICPET, Tianjin, China, 27–30 July 2023; pp. 765–770. [Google Scholar] [CrossRef]
  49. Ibrahim, A.; Al-shamma, A.A.; Xu, J.; Aboudrar, I.; Ameur, K.; Al, R.; Hussein, H.M.; Charles, G. An enhanced uncertainty and disturbance estimator based on Bi-LSTM-OTC-LADRC of grid-connected wind energy conversion system. Comput. Electr. Eng. 2025, 127, 110534. [Google Scholar] [CrossRef]
  50. Ibrahim, A.W.; Xu, J.; Al-Shamma’a, A.A.; Farh, H.M.H.; Aboudrar, I.; Oubail, Y.; Alaql, F.; Alfraidi, W. Optimized Energy Management Strategy for an Autonomous DC Microgrid Integrating PV/Wind/Battery/Diesel-Based Hybrid PSO-GA-LADRC Through SAPF. Technologies 2024, 12, 226. [Google Scholar] [CrossRef]
  51. Cotfas, P.A.; Cotfas, D.T. Comprehensive review of methods and instruments for photovoltaic–thermoelectric generator hybrid system characterization. Energies 2020, 13, 6045. [Google Scholar] [CrossRef]
  52. Lamba, R.; Kaushik, S.C. Modeling and performance analysis of a concentrated photovoltaic–thermoelectric hybrid power generation system. Energy Convers. Manag. 2016, 115, 288–298. [Google Scholar] [CrossRef]
  53. Zhu, W.; Deng, Y.; Wang, Y.; Shen, S.; Gulfam, R. High-performance photovoltaic-thermoelectric hybrid power generation system with optimized thermal management. Energy 2016, 100, 91–101. [Google Scholar] [CrossRef]
  54. Babu, C.; Ponnambalam, P. The theoretical performance evaluation of hybrid PV-TEG system. Energy Convers. Manag. 2018, 173, 450–460. [Google Scholar] [CrossRef]
  55. Hatzikraniotis, E.; Zorbas, K.T.; Samaras, I.; Kyratsi, T.; Paraskevopoulos, K.M. Efficiency study of a commercial thermoelectric power generator (TEG) under thermal cycling. J. Electron. Mater. 2010, 39, 2112–2116. [Google Scholar] [CrossRef]
  56. Barako, M.T.; Park, W.; Marconnet, A.M.; Asheghi, M.; Goodson, K.E. A reliability study with infrared imaging of thermoelectric modules under thermal cycling. In Proceedings of the 13th InterSociety Conference on Thermal and Thermomechanical Phenomena in Electronic Systems, San Diego, CA, USA, 30 May–1 June 2012; IEEE: New York, NY, USA, 2012; pp. 86–92. [Google Scholar]
  57. Tenorio, H.C.R.L.; Vieira, D.A.; de Souza, C.P.; de Macêdo, E.C.T.; Freire, R.C.S. A thermoelectric module thermal-cycling testing platform with automated measurement capabilities. In Proceedings of the 2016 IEEE International Instrumentation and Measurement Technology Conference Proceedings, San Diego, CA, USA, 30 May–1 June 2012; IEEE: New York, NY, USA, 2016; pp. 1–5. [Google Scholar]
  58. Williams, N.P.; Power, J.; Trimble, D.; O’Shaughnessy, S.M. An experimental evaluation of thermoelectric generator performance under cyclic heating regimes. Heat Mass Transf. 2024, 60, 1991–2003. [Google Scholar] [CrossRef]
  59. Castillo, E.E.; Hapenciuc, C.L.; Borca-Tasciuc, T. Thermoelectric characterization by transient Harman method under nonideal contact and boundary conditions. Rev. Sci. Instrum. 2010, 81, 044902. [Google Scholar] [CrossRef]
  60. Barako, M.T.; Park, W.; Marconnet, A.M.; Asheghi, M.; Goodson, K.E. Thermal cycling, mechanical degradation, and the effective figure of merit of a thermoelectric module. J. Electron. Mater. 2013, 42, 372–381. [Google Scholar] [CrossRef]
  61. Champier, D. Thermoelectric generators: A review of applications. Energy Convers. Manag. 2017, 140, 167–181. [Google Scholar] [CrossRef]
  62. Kanagaraj, N. Photovoltaic and thermoelectric generator combined hybrid energy system with an enhanced maximum power point tracking technique for higher energy conversion efficiency. Sustainability 2021, 13, 3144. [Google Scholar] [CrossRef]
  63. Khan, M.A.I.; Khan, M.I.; Kazim, A.H.; Shabir, A.; Riaz, F.; Mustafa, N.; Javed, H.; Raza, A.; Hussain, M.; Salman, C.A. An experimental and comparative performance evaluation of a hybrid photovoltaic-thermoelectric system. Front. Energy Res. 2021, 9, 722514. [Google Scholar] [CrossRef]
  64. Fathy, A.; Agwa, A.M. Red-Billed Blue Magpie Optimizer for Modeling and Estimating the State of Charge of Lithium-Ion Battery. Electrochem 2025, 6, 27. [Google Scholar] [CrossRef]
  65. Fu, S.; Li, K.; Huang, H.; Ma, C.; Fan, Q.; Zhu, Y. Red-billed blue magpie optimizer: A novel metaheuristic algorithm for 2D/3D UAV path planning and engineering design problems. Artif. Intell. Rev. 2024, 57, 134. [Google Scholar] [CrossRef]
  66. Kong, W.; Zhou, M.; Hu, F.; Zhu, Z. Manuscript Title: Thermal-Electrical scheduling of Low-Carbon Industrial energy systems with rooftop PV: An improved Red-Billed blue magpie optimization approach. Therm. Sci. Eng. Prog. 2025, 61, 103599. [Google Scholar] [CrossRef]
  67. Sharma, A. Improved Red-Billed Blue Magpie Optimizer for Unmanned Aerial Vehicle Path Planning. In Proceedings of the 2024 International Conference on Computational Intelligence and Network Systems (CINS), Dubai, United Arab Emirates, 28–29 November 2024; IEEE: New York, NY, USA, 2024; pp. 1–6. [Google Scholar]
  68. Luo, Z.Z.; Chongwei, H.; Kai, S.; Qikai, H.; Jiayue, J.; Ziyi, Z. Trajectory Tracking Control for USVs Based on Red-billed Blue Magpie Optimized ADRC. In Journal of Physics: Conference Series; IOP Publishing: Bristol, UK, 2024; Volume 2891, p. 112019. [Google Scholar]
  69. El-Fergany, A.A.; Agwa, A.M. Red-billed blue magpie optimizer for electrical characterization of fuel cells with prioritizing estimated parameters. Technologies 2024, 12, 156. [Google Scholar] [CrossRef]
Figure 1. An illustration of the PV-TEG integrated structure.
Fractalfract 09 00704 g001
Figure 2. (a) PV’s corresponding circuit, (b) unvarying radiation scenario, (c) P-V curve at shading patterns.
Fractalfract 09 00704 g002
Figure 3. Electrical counterparts of the TEG unit in terms of (a) architecture and (b) circuit construction.
Fractalfract 09 00704 g003
Figure 4. TEG system. (a) TEG unit; (b) TEG Thermocouples; (c) TEG equivalent circuit.
Fractalfract 09 00704 g004
Figure 5. Two output properties of the centralized TEG technology are (a) normal temperature conditions and (b) erratic temperature conditions.
Fractalfract 09 00704 g005
Figure 6. Flowchart of lifecycle system of the hybrid PV-TEG system.
Fractalfract 09 00704 g006
Figure 7. PV-TEG hybrid system model.
Fractalfract 09 00704 g007
Figure 8. The analogous circuit for a PV-TEG that is electrically connected in (a) series and (b) parallel.
Fractalfract 09 00704 g008
Figure 9. PV-TEG generating system schematic diagram.
Fractalfract 09 00704 g009
Figure 10. Diagram for dp/dv feedback-based MPPT tracking.
Fractalfract 09 00704 g010
Figure 11. A simple structure of the traditional PID controller.
Fractalfract 09 00704 g011
Figure 12. Fractional-order PID form.
Fractalfract 09 00704 g012
Figure 13. A simple structure of the traditional FOPID controller.
Fractalfract 09 00704 g013
Figure 14. The flowchart of the RBMO.
Fractalfract 09 00704 g014
Figure 15. Pseudo of the RBBMO for Adaptive FOPID MPPT.
Fractalfract 09 00704 g015
Figure 16. The whole architecture of the suggested FOPID MPPT control system is based on RBBMO optimization.
Fractalfract 09 00704 g016
Figure 17. (a) Comparing power throughout the Start-up/search phase. (b) Energy evaluation under the Start-up/search phase. (c) Duty cycle evaluation under the Start-up/search phase.
Fractalfract 09 00704 g017aFractalfract 09 00704 g017b
Figure 18. (a) Gradually varying irradiance. (b) Power comparison under irradiance variation. (c) Energy evaluation during radiation variation. (d) Duty cycle comparison under irradiance variation.
Fractalfract 09 00704 g018aFractalfract 09 00704 g018b
Figure 19. (a) PV-TEG maximum power during partial shading. (b) Power comparison under partial shading. (c) Energy comparison under partial shading. (d) Duty cycle comparison under partial shading.
Fractalfract 09 00704 g019aFractalfract 09 00704 g019b
Figure 20. Power and duty cycle comparison under load variation for (a) AOS power, (b) AOS duty, (c) PSO power, (d) PSO duty, (e) P&O power, (f) P&O duty, (g) Proposed power, (h) Proposed duty.
Fractalfract 09 00704 g020aFractalfract 09 00704 g020b
Figure 21. Variations in temperature and solar irradiation over four representative days in Shanxi Province. (a) Solar irradiation levels. (b) Temperature trends.
Fractalfract 09 00704 g021
Figure 22. Power generation across four typical days in Shanxi Province. (a) Spring, (b) Summer, (c) Autumn, (d) Winter.
Fractalfract 09 00704 g022
Figure 23. Energy output was recorded on four typical days in Shanxi Province. (a) Spring, (b) Summer, (c) Autumn, (d) Winter.
Fractalfract 09 00704 g023
Figure 24. Performance comparison using the criteria including Average power output, Maximum variability, and Average variability under (a) temperature variation, (b) Irradiance Variation.
Fractalfract 09 00704 g024
Figure 25. Hybrid PV-TEG MPPT comparison across seven cases (start-up, stepwise irradiance, partial shading, and four field-measured seasons), in terms of energy, Δvmax and Δvavg.
Fractalfract 09 00704 g025
Table 1. General advantages and disadvantages of MPPT/control families used in PV-TEG systems.
Method FamilyTypical AdvantagesTypical Disadvantages (PV-TEG Context)
P&O [43] Simple, low-cost; fast on single-peak curves; easy to implement on MCU.Prone to local-peak lock-in under partial shading/multi-peak; steady-state oscillation; sensitive to step size and noise.
IncCond [15,44]Better slope awareness than P&O; moderate speed; modest compute.Still local method; accuracy depends on noisy (dI/dV); tuning trade-off between speed and ripple.
FLC [45]Nonlinear rule base can handle uncertainties; no exact model required.Rule design/tuning is expert-heavy; scaling issues; behavior can drift outside trained envelope.
Integer-order PID [40]Familiar design; decent transient shaping; easy to deploy.Fixed structure; performance degrades across wide irradiance/temperature/load changes; requires re-tuning; limited GMPP ability.
FOPID (Fractional-order PID) [46]Extra orders (λ, µ) improve speed–robustness trade-off; can reduce ripple and overshoot.Realization details (band/order, discretization, anti-windup) are nontrivial; still needs global search help for GMPP.
Meta-heuristics (PSO/SSA/MRFO/AOA/HGSO/ASA, etc.) [1] Global search capability; flexible objective design; robust to nonconvex (P)–(V).Often slower convergence; duty oscillation risk without damping; results depend on bounds/seeds; reproducibility varies.
Data-driven (NN/ANFIS/NNCGA, etc.) [47]Can capture complex, time-varying relations; potential for adaptive/global behavior.Data-hungry; generalization and stability concerns; training cost; opaque tuning; reproducibility often limited.
Dual-MPPT (separate PV & TEG) [30]Independent optimization of each source; simple modularity.Coordination/coupling can cause cross-oscillation; higher component count; harder to guarantee bus stability.
Centralized PV-TEG MPPT [22]System-level optimum on a common DC bus; avoids source conflicts.More complex controller; requires accurate sensing and well-defined search/constraints to prevent chatter.
Adaptive FOPID (Our approach)Combines fast local control (FOPID) with global meta-tuning; good GMPP tracking with low ripple; parameters bounded and reproducible.Needs careful specification of fractional realization and meta-tuning settings; modest compute overhead vs. fixed PID.
Table 2. Control, differentiation, and RBBMO settings.
BlockParameterValue/SettingNotes
Sampling and DiscretizationSampling time (Ts)1 ms (1 kHz)Common to control and differentiation
DiscretizationTustin (bilinear)Pre-warp at 2π·10 Hz for FOPID band center
FOPID StructureControl law(Δd[k] = Kp e[k] + Ki(-λI){e}[k] + KdµD{e}[k])(-λI) and µD are fractional ops
Fractional ordersλ, µ ϵ [0.8, 1.2]) See bounds below
Derivative roll-off(Gd(s) = N/(1 + N/s) with N = 20 · 2π rad/sLimits noise amplification
Output limitsd ϵ {dmin,dmax} = [0.05, 0.90]Duty cycle clamp
Anti-windupBack-calculation with (Kaw = 1/Ti); tracking limiter(Ti = 1/Ki (effective)
Oustaloup Approx.Order5 (per frac. operator)Balanced accuracy/complexity
Freq. band0.1–100 Hz (0.628–628 rad/s)Matches MPPT dynamics band
(dP/dV) EstimationRaw power(P[k] = V[k], I[k]) at DC busIncludes converter losses upstream
DifferentiatorSavitzky–Golay, window 15, poly 2On (P(V)) stream sampled at 1 kHz
RegularizationEMA on derivative, (α = 0.2)(xf[k] = αx[k] + (1 − α)xf[k − 1])
Outlier filterHampel, window 11, 3σOptional; default on
Decimation200 Hz for controller after filteringReduces chatter
RBBMO (Meta-Tuning)Population size25Agents
Iterations60Early stop if no best update in 10 iters
Coefficients(w = 0.7) (inertia), (c1 = 1.4), (c2 = 1.2), (ps = 0.2)Standardized RBBMO params
Seeds{2024, 2025, 2026}Report median over seeds
FitnessMaximize (E1s) (1-s energy)—β.ripple—γ.satCount(β = 0.5,Wh), (γ = 0.01)
Bounds(Kp ϵ [0.00, 1.50], Ki ϵ [0, 400], Kd ϵ [0.00, 0.20], λ, µ ϵ [0.80, 1.20])Box constraints
Constraint handlingClamp to bounds; penalty if at bound >10% of timePrevents edge-seeking
DeploymentFinal gainsBest-seed gains (median)Logged in Supplement YAML
Runtime adapts.Small-gain online adaptation (±10%/s cap)From (Δe) sign and magnitude
Table 3. Matlab/Simulink model specifications.
PV Parameters ValueTEG Parameters Value
ParametersValueParametersValue
PV output voltage 240 VMeasurement conditions Tc, Th (°C) 30 and 200
PV converter inductance 116.4 mHComponent dimensions (mm × mm × mm) 40 × 40 × 4.4
PV converter capacitance (Cin) and (Co)48.25 μF Typical peak power (W) 7.5
Battery capacity 48 AhIsc 2.65 A
Initial SoC of BESS 50%Voc 11 V
Battery inductance 116.4 mHNumber of thermoelectric units 200
Table 4. Search-phase comparison of MPPT algorithms on a hybrid PV-TEG system (1-s interval); metrics include time to 95% MPP, settling time (±1%), overshoot, steady ripple, and cumulative energy.
AlgorithmTime to 95% MPP, t95 (s)Settling Time (±1%) (s)Overshoot (%)Steady Ripple (±%)Energy @ 1 s (J)Notes/Rank
Proposed0.060.12<0.511950Best energy and fastest; smooth duty
AOS0.140.301–22–319102nd; close to proposed
PSO0.180.352–32–318803rd
MFO0.220.404–63–517804th
SSA0.240.456–84–616505th; pronounced transients
GHO0.200.353–53–416006th
RSA0.28>0.505–85–710507th; slow and noisy
AOA—(low plateau)large4208th; fails to reach high plateau
P&O0.22–0.250.40–0.4552–3200Slow ramp; lowest energy among baselines
Table 5. Gradually Stepwise Irradiance with constant temperature comparison of MPPT algorithms on a hybrid PV-TEG system; metrics include time to 95% MPP, settling time (±1%), ripple, and cumulative energy.
AlgorithmStep t95 (s)Step Settle (s)Ripple (±%)Energy @1 s (kJ)Notes/Rank
Proposed0.06–0.080.12–0.15≈10.95–0.98Fastest reacquisition; smallest ripple
AOS0.18–0.250.30–0.352–30.902nd
GHO0.18–0.300.30–0.353–40.883rd
RSA0.25–0.350.35–0.454–50.834th
AOA0.25–0.350.40–0.505–70.78–0.805th
MFO0.30–0.400.45–0.553–5~0.74moderate oscillations
SSA0.30–0.450.50–0.604–60.57large dips
P&Oslowslow2–30.68–0.70sluggish recovery
PSO0.25–0.350.35–0.452–30.40–0.42weakest energy
Table 6. Partial shading comparison of MPPT algorithms on a hybrid PV-TEG system; metrics include time to 95% GP, settling time (±1%), ripple, and cumulative energy.
AlgorithmTime to 95% of GP (s)Settle (±1%) (s)Ripple (±%)Energy @1 s (kJ)Notes/Rank
Proposed0.06–0.080.12–0.15≈11.95–2.00Locks GP on first attempt
AOS0.15–0.220.25–0.352–31.90–1.962nd
GHO0.18–0.250.30–0.403–41.78–1.863rd–4th
MFO0.18–0.250.30–0.403–51.80–1.863rd–4th
RSA—(LP trap)4–61.60–1.70converges near LP
PSO0.20–0.300.35–0.452–3~1.70slower, undershoot
AOAlarge<1.6unstable
P&Oslowslow2–3~1.45pronounced dips
Table 7. Statistical outcomes for several approaches across four case studies.
Testing ScenariosIndicatorsProposedAOSPSOMFOSSAGHORSAAOAP&O
Start-up test (search phase)Energy (J)1950191018801780165016001050420200
Δvmax (%)13.026.032.036.039.033.045.058.08.0
Δvavg (%)0.150.300.410.450.490.420.580.600.08
Stepwise variations in irradiance Energy (J)965900410740570880830790690
Δvmax (%)20.333.133.526.726.428.923.530.012.0
Δvavg (%)0.320.590.620.480.490.460.340.560.15
Partial shading Energy (J)1950–20001900–1960~17001800–18601600–17001780–18601600–1700<16001450
Δvmax (%)18.025.030.028.032.027.034.038.015.0
Δvavg (%)0.280.400.500.460.550.440.580.600.12
Field—Spring Energy (kWh)0.000880.000850.000820.000840.000810.000840.000800.000830.00072
Δvmax (%)8.4326.6546.12095.675410.7688.11276.270910.562710.877
Δvavg (%)0.02540.02650.06760.06780.04270.03970.02140.07350.0635
Field—SummerEnergy (kWh)0.002950.002850.002760.002800.002780.002780.002700.002750.00210
Δvmax (%)9.436.67424.46755.67086.70836.4354.84259.307110.709
Δvavg (%)0.03420.04350.03450.04510.0540.04210.03700.0780.0236
Field—AutumnEnergy (kWh)0.002900.002800.002680.002740.002720.002720.002650.002700.002235
Δvmax (%)7.99829.80926.43217.1238.65409.1095.09817.61909.5098
Δvavg (%)0.02690.03670.07170.06730.05420.03240.04430.04590.0397
Field—WinterEnergy (kWh)0.001550.00149–0.001500.001470.001470.001460.001470.00148–0.001500.001470.00120
Δvmax (%)8.149611.5466.76508.210910.2998.23096.450912.70912.345
Δvavg (%)0.02400.04120.08090.06700.05700.03890.03450.09720.0908
Disclaimer/Publisher’s Note: The statements, opinions and data contained in all publications are solely those of the individual author(s) and contributor(s) and not of MDPI and/or the editor(s). MDPI and/or the editor(s) disclaim responsibility for any injury to people or property resulting from any ideas, methods, instructions or products referred to in the content.