Article

Automatic Picking Method for the First Arrival Time of Microseismic Signals Based on Fractal Theory and Feature Fusion

1
Key Laboratory of Western Mines and Hazard Prevention of Ministry of Education, Xi’an University of Science and Technology, Xi’an 710054, China
2
College of Energy and Mining Engineering, Xi’an University of Science and Technology, Xi’an 710054, China
3
Department of Civil and Environmental Engineering, University of Strathclyde, Glasgow G1 1XJ, UK
4
China Coal Technology & Engineering Group Xi’an Research Institute Co., Ltd., Xi’an 710054, China
5
Shaanxi Binchang Mining Group Co., Ltd., Xianyang 712000, China
*
Authors to whom correspondence should be addressed.
Fractal Fract. 2025, 9(11), 679; https://doi.org/10.3390/fractalfract9110679
Submission received: 18 September 2025 / Revised: 9 October 2025 / Accepted: 15 October 2025 / Published: 23 October 2025

Abstract

Microseismic signals induced by mining activities often have low signal-to-noise ratios, and traditional picking methods are easily affected by noise, making accurate identification of P-wave arrivals difficult. To address this problem, this study proposes an adaptive denoising algorithm based on wavelet-threshold-enhanced Complete Ensemble Empirical Mode Decomposition with Adaptive Noise (CEEMDAN) and develops an automatic P-wave arrival picking method incorporating fractal box dimension features, along with a corresponding accuracy evaluation framework. The raw microseismic signals are decomposed using the improved CEEMDAN method, with high-frequency intrinsic mode functions (IMFs) processed by wavelet-threshold denoising and low- and mid-frequency IMFs retained for reconstruction, effectively suppressing background noise and enhancing signal clarity. Fractal box dimension is applied to characterize waveform complexity over short and long-time windows, and by introducing fractal derivatives and short-long window differences, abrupt changes in local-to-global complexity at P-wave arrivals are revealed. Energy mutation features are extracted using the short-term/long-term average (STA/LTA) energy ratio, and noise segments are standardized via Z-score processing. A multi-feature weighted fusion scoring function is constructed to achieve robust identification of P-wave arrivals. Evaluation metrics, including picking error, mean absolute error, and success rate, are used to comprehensively assess the method’s performance in terms of temporal deviation, statistical consistency, and robustness. Case studies using microseismic data from a mining site show that the proposed method can accurately identify P-wave arrivals under different signal-to-noise conditions, with automatic picking results highly consistent with manual labels, mean errors within the sampling interval (2–4 ms), and a picking success rate exceeding 95%. The method provides a reliable tool for seismic source localization and dynamic hazard prediction in mining microseismic monitoring.

1. Introduction

Microseismic monitoring systems, as a common method for underground engineering surveillance, are widely applied in source identification, investigation of coal-rock dynamic disaster mechanisms, and rockburst early warning [1,2]. Compared with traditional monitoring approaches, microseismic monitoring offers several advantages, including broad monitoring coverage, digitalized data acquisition and processing, and continuous real-time observation, all without interfering with normal mining operations [3]. Consequently, in deep mines prone to rockbursts, microseismic monitoring has become an indispensable technology for disaster prevention and ensuring safe production. In the context of intelligent mine construction and research on rockburst early warning, microseismic monitoring serves as a diversified data source extensively used for disaster prediction and analysis of disaster evolution processes [4,5]. However, due to the complex underground environment, microseismic signals are often contaminated by strong noise from mechanical drilling, shearer coal cutting, belt transportation, and mine vehicle operations [6]. These interferences result in low signal-to-noise ratios, blurred waveform features, and difficulty in phase identification, thereby limiting the reliability of source localization, energy inversion, and rockburst early warning [7,8]. Therefore, effectively enhancing signal features and accurately extracting P-wave arrivals under complex noise conditions remains a critical scientific challenge in monitoring and predicting dynamic disasters in mines.
A large body of research has been conducted by domestic and international scholars on denoising microseismic signals with low signal-to-noise ratios, gradually forming an evolution from traditional filtering methods to modern intelligent algorithms. Early approaches primarily relied on classical signal processing techniques such as band-pass filtering, wavelet-threshold denoising, and singular value decomposition, which could suppress random noise to some extent but showed limited effectiveness when dealing with complex noise and non-stationary signals. In recent years, the emergence of time–frequency analysis and empirical mode decomposition (EMD) has enabled researchers to decompose signal features at different temporal scales. Zhang et al. [9] proposed an adaptive correction factor aj reflecting noise intensity, using the square root of the ratio between the median absolute value and the amplitude of monitoring data to represent the noise level in wavelet detail signals, and adjusted the denoising scale accordingly. Yao et al. [10] exploited the different phase characteristics of microseismic signals and noise in the NTFT phase spectrum, reconstructing the microseismic signal within useful real-time frequency bands to filter out noise. Li et al. [11] designed a 16-layer convolutional neural network (CNN) for denoising, employing residual learning to optimize the model, which effectively and rapidly removed noise from microseismic signals. Overall, microseismic denoising methods are trending toward intelligent, multi-task, and adaptive approaches; however, under complex underground multi-source interference, it remains challenging to balance signal clarity with the preservation of original signal features.
In the field of P-wave arrival picking for microseismic signals, methods have similarly evolved from classical algorithms to intelligent approaches. The short-term/long-term average (STA/LTA) ratio method has become the most commonly used automatic picking technique due to its computational simplicity and strong real-time performance [12,13]. With the rapid development of machine learning and deep learning, data-driven methods have gradually become a research focus. Yin et al. [14] combined STA/LTA with the Akaike Information Criterion (AIC) method and introduced constraints at trigger points, enabling effective identification of both spike and drift signals. Edigbue, P. [15] proposed an innovative strategy that integrates continuous wavelet transform with machine learning techniques, improving the accuracy and efficiency of seismic event detection and P-wave arrival identification. Jin et al. [16] constructed a novel network architecture by combining an improved Visual Geometry Group (VGG) model with a convolutional block attention module. Zhao Hongbao et al. [17] developed a picking model (DMSP model) specifically for microseismic P-wave signals based on time-domain characteristics and deep learning algorithms from the computer vision field and designed a corresponding loss function tailored to the task. Overall, although existing methods have achieved notable improvements in picking accuracy and automation, challenges remain in complex mining environments, including blurred signal features, high mis-picking rates, and insufficient robustness.
Compared with natural earthquake records, mining-induced microseismic signals are typically characterized by short duration, unstable low-frequency energy, and strong random noise interference, which limits the direct applicability of conventional seismological methods in mining environments. For instance, under continuous excavation and mechanical interference, the abrupt features of microseismic P-wave arrivals can be masked by noise, leading to delayed or erroneous picks when using traditional STA/LTA or AIC methods. Although deep learning approaches offer powerful feature extraction capabilities, they generally require large amounts of labeled data, which are difficult to obtain in actual mining settings, thereby restricting their practical application. Consequently, there is an urgent need for a novel method that can adaptively decompose and denoise signals, quantitatively characterize waveform complexity, and robustly identify P-wave arrivals under challenging underground conditions.
Based on this, the present study proposes a P-wave arrival picking method for microseismic signals that combines adaptive denoising via empirical mode decomposition (EMD) with complexity characterization using the fractal box dimension (FBD). The method first employs the adaptive decomposition capability of CEEMDAN to decompose microseismic signals into intrinsic mode functions (IMFs) at different temporal scales. High-frequency IMF components are denoised using a wavelet-threshold approach while mid- and low-frequency components are retained, effectively suppressing random noise and enhancing signal clarity. Subsequently, the fractal box dimension is introduced to quantitatively analyze the complexity of the denoised signals, addressing the limitation of traditional energy-based indicators in capturing nonlinear characteristics. Finally, the STA/LTA energy ratio is integrated to jointly analyze signal mutation features, enabling the identification of P-wave arrival points from both complexity and energy perspectives, thereby achieving more robust and accurate automatic picking.

2. Wavelet-Threshold-Based Empirical Mode Decomposition for Adaptive Noise Suppression

2.1. Empirical Mode Decomposition

Empirical Mode Decomposition (EMD) is a typical adaptive signal processing method capable of decomposing nonlinear and non-stationary signals into a series of physically meaningful Intrinsic Mode Functions (IMFs) and a residual component [14,15]. Each IMF represents the characteristic oscillatory mode of the signal at a specific time scale, while the residual component describes the overall trend of the signal. The basic principle is as follows: the local extrema of the original signal are first identified, and upper and lower envelopes are constructed by interpolation; the mean of these envelopes is then subtracted from the original signal. If the resulting signal satisfies the conditions of having zero mean and a difference of no more than one between the number of extrema and the number of zero-crossings, it is considered an IMF; otherwise, the sifting process continues iteratively until the conditions are met. By repeating this process, the signal can be progressively decomposed into a set of IMFs and a residual trend term, thereby enabling the extraction of oscillatory components at different scales. A major advantage of EMD is that it is entirely data-driven and does not require predefined basis functions, making it particularly suitable for processing vibration signals with strong non-stationary characteristics.
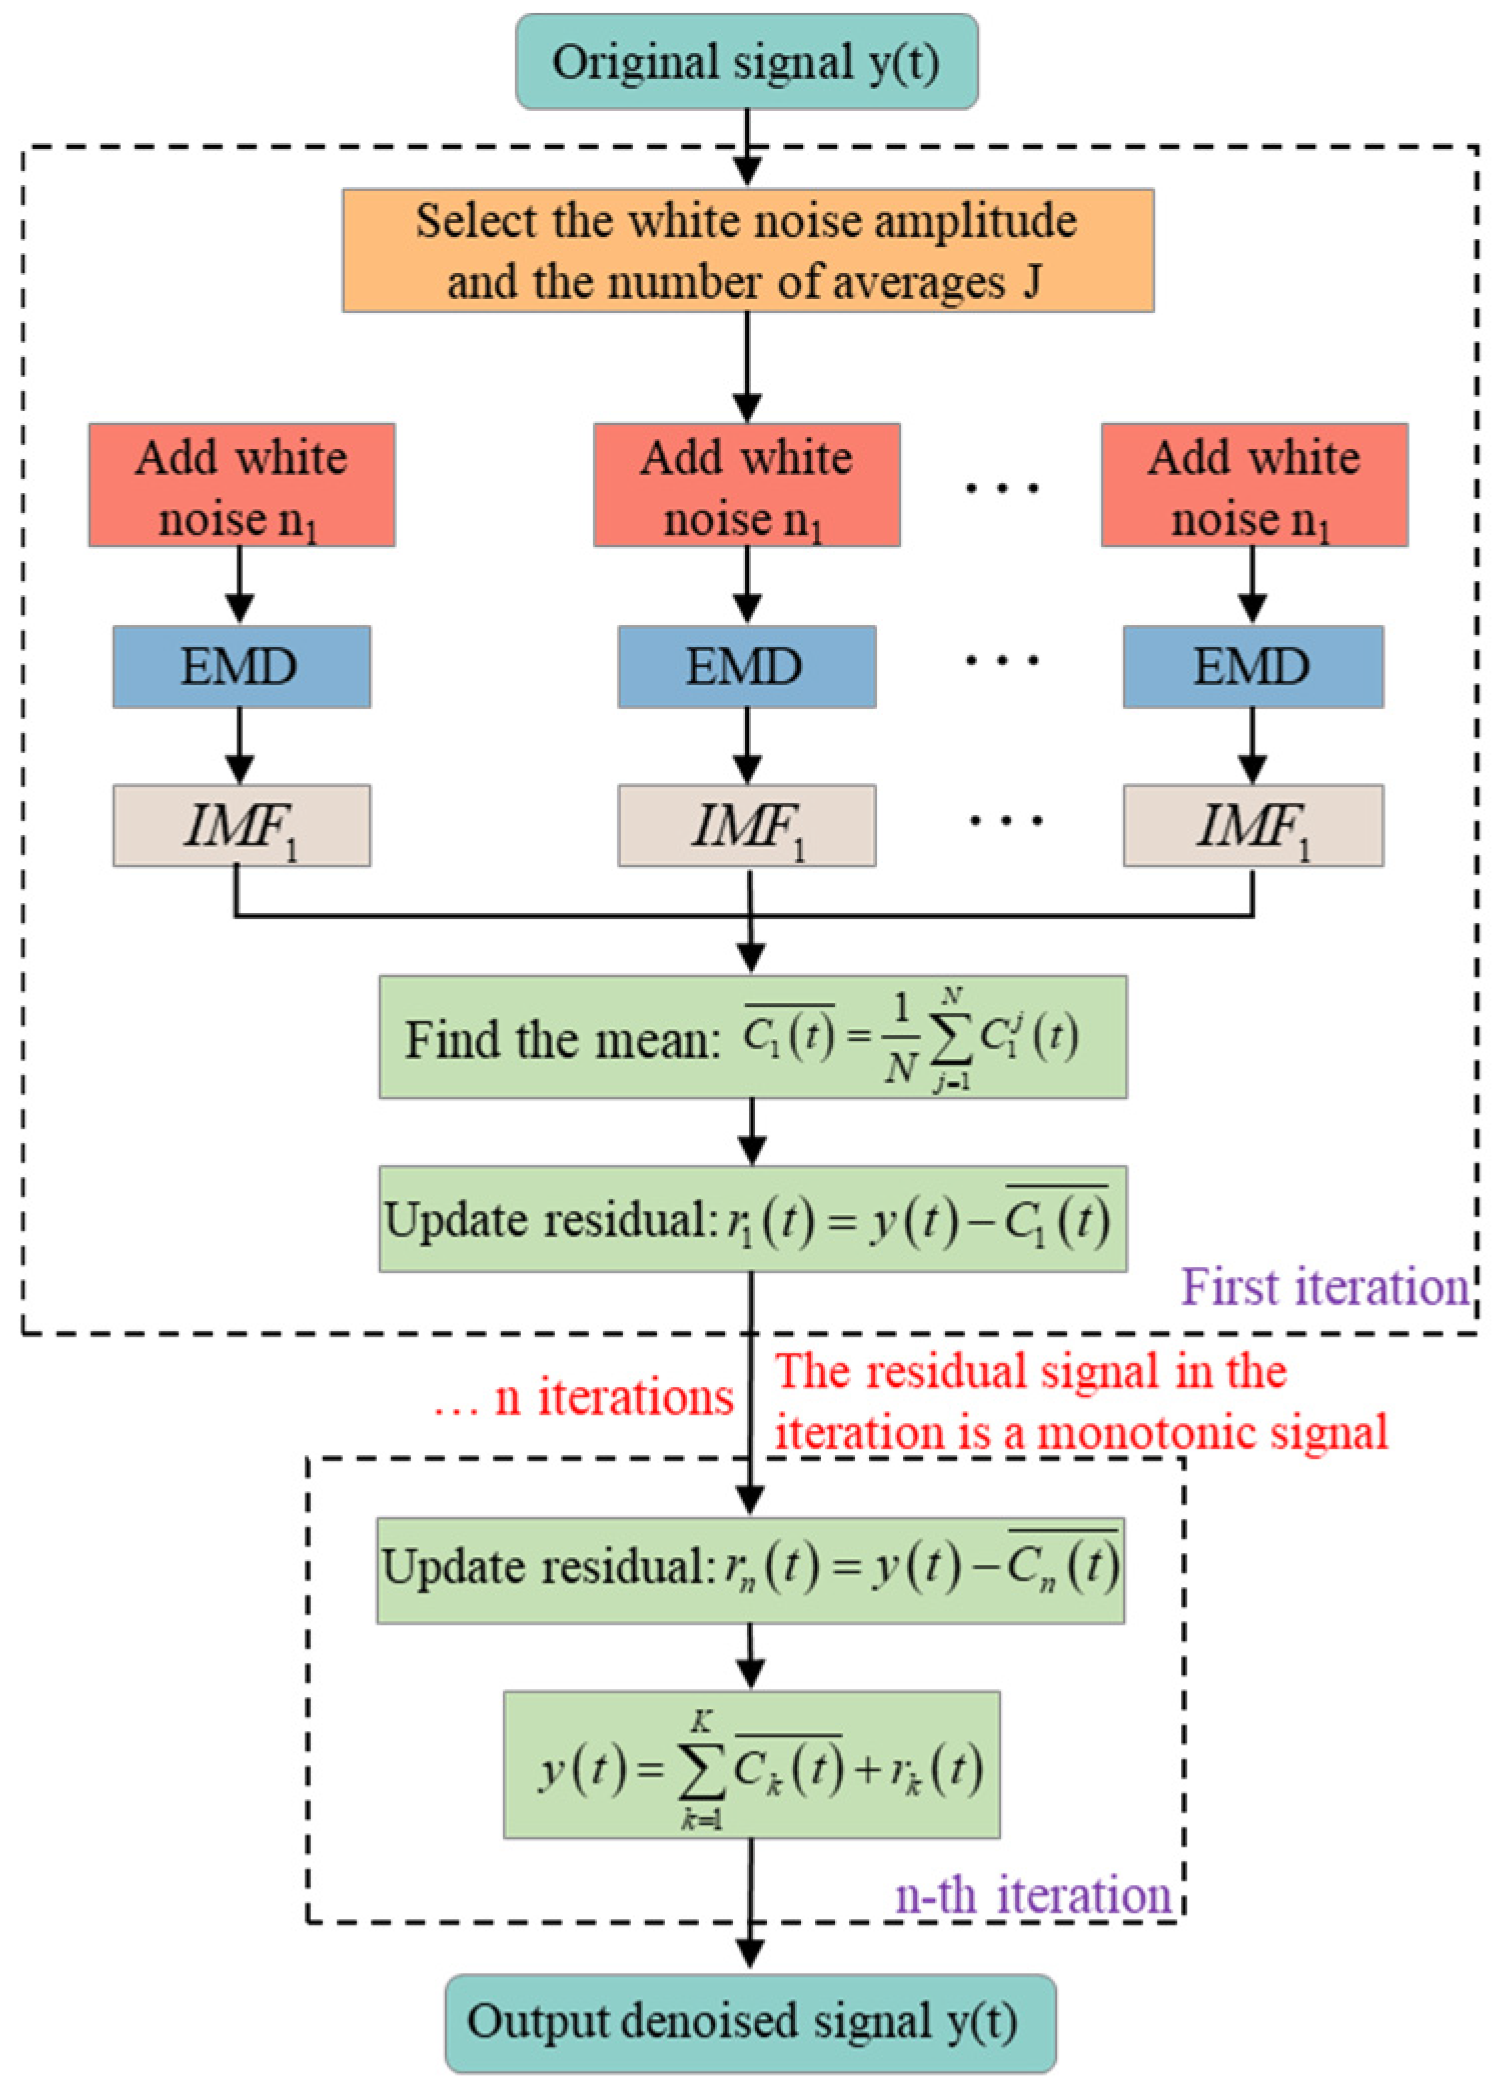
However, traditional EMD suffers from the problem of mode mixing, where signal components from different time scales are intermixed within the same IMF, leading to decomposition results that lack clear physical interpretability. Moreover, under strong noise conditions, EMD exhibits poor stability and reproducibility in its decomposition outcomes. To address these issues, various improved methods have been proposed, among which the Complete Ensemble Empirical Mode Decomposition with Adaptive Noise (CEEMDAN) is the most representative. CEEMDAN mitigates mode mixing by repeatedly adding Gaussian white noise to the signal and performing multiple decompositions, followed by ensemble averaging of the results. In addition, CEEMDAN incorporates an adaptive noise adjustment mechanism to prevent the noise amplification effect during individual decompositions, thereby enhancing the stability of the results. Compared with EMD, CEEMDAN not only provides more accurate modal components but also significantly improves computational efficiency while maintaining decomposition precision.
The workflow of the CEEMDAN algorithm is shown in Figure 1. Let E i denote the i-th intrinsic mode function (IMF) obtained through standard EMD, and C i t ¯ denote the i-th IMF obtained through CEEMDAN. Let v j represent Gaussian white noise following a standard normal distribution, j be the number of added noise realizations, ε be the standard deviation of the added noise, and y t be the signal to be decomposed. After decomposition, a total of K IMFs is obtained, and the original signal y t can be expressed as:
y ( t ) = k = 1 K C k ( t ) ¯ + r k ( t )
In microseismic signal processing, the advantages of CEEMDAN are particularly prominent. On one hand, it can separate high-frequency random noise into independent IMF components, which facilitates subsequent denoising; on the other hand, it effectively preserves the true structure of mid- and low-frequency signals, making the first-arrival features of seismic events clearer. In this study, a noise suppression module is constructed based on CEEMDAN, and the IMF components are further optimized using wavelet threshold denoising so as to obtain input signals with a high signal-to-noise ratio under complex noise conditions, laying a foundation for the subsequent fusion picking method based on fractal box dimension and STA/LTA.

2.2. Wavelet Threshold Denoising Parameter Optimization

Wavelet threshold denoising is a commonly used signal processing technique primarily employed to remove noise from images or waveform signals. It is based on wavelet transform, which converts the signal from the time domain to the wavelet domain and utilizes the statistical characteristics of wavelet coefficients to determine which coefficients represent noise. These noise-related coefficients are then either set to zero or adjusted to achieve the effect of denoising. The basic principle is to apply wavelet transform—typically using the Mallat algorithm—to decompose the signal, followed by selective processing of the resulting wavelet coefficients [18]. After decomposition, the wavelet coefficients of valid signals tend to be relatively large, while those corresponding to noise are comparatively small, and the noise coefficients are generally smaller than those of the valid signal. By selecting an appropriate threshold, wavelet coefficients greater than the threshold are preserved, whereas those below the threshold are considered to originate from noise and are set to zero, thereby obtaining a denoised version of the valid signal. Therefore, the key to wavelet threshold denoising lies in the selection of an appropriate threshold.
Wavelet bases serve as the fundamental functions of wavelet transform, enabling the representation of different scales and frequency components of a signal in both the time and frequency domains. They are characterized by compactness and locality, meaning they are of finite length in the time domain and allow localized analysis in both time and frequency domains. This property enables wavelet transform to capture the instantaneous features and local details of signals more effectively [19]. The selection of an appropriate wavelet basis function depends on the characteristics of the signal and the intended analytical objectives. Different wavelet bases exhibit distinct properties in the time and frequency domains and can be used to extract various signal components, such as frequency bands [20], edge information, or local oscillations. Since different wavelets vary in terms of orthogonality, compact support, smoothness, and symmetry [21]—and it is often difficult to construct a single wavelet function that simultaneously possesses all four properties—in practical applications, a trade-off must be made among these characteristics. The choice of wavelet should therefore be guided by the specific objectives and decomposition requirements of the signal being processed [22]. Commonly used wavelet basis functions are shown in Table 1.
To determine the wavelet basis function most suitable for microseismic signal denoising, six different wavelet bases were selected in this study. These six wavelet functions were applied to denoise the same segment of a representative microseismic signal, with a duration of 3.584 s. After denoising, the root mean square error (RMSE) and signal-to-noise ratio (SNR) of the processed signals were calculated and compared.
The root mean square error (RMSE) is calculated as follows:
R M S E = 1 N i = 1 N ( I ^ i I i ) 2
The signal-to-noise ratio (SNR) is calculated as follows:
S N R = 10 l g i = 1 N ( I i ) 2 i = 1 N ( I ^ i I i ) 2
Here, I i represents the original signal, and I ^ i represents the signal after denoising.
In general, microseismic waveforms have short durations and relatively low energy and amplitude, making the Daubechies wavelet family particularly suitable for wavelet threshold denoising [23]. Comparative analysis of denoising performance shows that the db9 wavelet achieves the lowest root mean square error (RMSE) and the highest signal-to-noise ratio (SNR). Specifically, the RMSE is reduced by 14.02% compared with the db6 wavelet, and the peak SNR is increased by 36.11% compared with the biorN5.N5 wavelet. Therefore, the wavelet threshold denoising algorithm based on the db9 wavelet exhibits optimal performance. Accordingly, this study selects the Daubechies wavelet family with an order of 9, i.e., db9. The computational results are presented in Table 2.
Microseismic signals have typical characteristics such as transient abrupt changes, short duration, and concentrated spectra. The P-wave has a steep rise, with energy distributed in the mid-to-high frequency range, and is often masked by strong background noise. To preserve the abrupt change information in the time domain and achieve noise separation in the frequency domain, it is required that the wavelet basis possess good time-frequency locality and smoothness.
The Daubechies wavelet family is known for its compact support and high-order vanishing moments, effectively balancing time and frequency resolution. The db9 wavelet, with nine vanishing moments, can accurately represent abrupt changes and edge information while maintaining smooth reconstruction of the signal. Its orthogonality ensures the independence of components at different scales, preventing energy leakage; its nearly symmetric waveform helps reduce phase distortion, making the P-wave arrival time detection more stable [24]. Additionally, the frequency bandwidth of db9 closely matches the main frequency range (20–80 Hz) of typical mining microseismic signals, allowing accurate separation of low-frequency background and useful wave components at different decomposition levels, thereby maximizing suppression of high-frequency random noise while preserving the characteristics of the P-wave rise.
Therefore, theoretically, the db9 wavelet possesses sufficient smoothness, time resolution, and spectral matching, making it an optimal choice for denoising and feature extraction of mining microseismic signals, capable of accurately capturing transient changes in these signals.
In microseismic monitoring signals, the coefficients corresponding to the valid signal are relatively large, while those corresponding to noise are smaller but still follow a Gaussian distribution. By setting a threshold to zero the coefficients of noise signals, the noise can be maximally suppressed, while causing minimal damage to the valid signals. Considering that some acquisition equipment can sample up to 2500 Hz, to avoid the high sampling rate introducing high-frequency noise into the wavelet coefficients, a 200 Hz anti-aliasing low-pass filter is applied to the data before processing, and the data is resampled to 500 Hz. High-frequency signals occupy a certain proportion in the collected data. To prevent excessive attenuation of wavelet coefficients—which could result in the loss of high-frequency information—this study adopts the SUREShrink threshold based on the Stein’s Unbiased Risk Estimation (SURE) criterion. This threshold orders the squared wavelet coefficients in ascending order, sets a threshold t to estimate its likelihood, and then minimizes the non-likelihood to obtain the final threshold. The formula for this threshold is as follows:
λ S U R E = arg min σ 2 N + j N 1 max ( w j , t 2 ) 2 σ 2 w j t
In Equation (4), the threshold t is the variable adjusted to minimize the objective function; where σ represents the standard deviation of the noise, which is estimated using the median absolute deviation method from the noise segment before the event or from the finest scale wavelet detail subband.
The SUREShrink threshold is applicable to the soft threshold function. To avoid signal discontinuities and maximize the reconstruction of a smooth signal, the soft threshold function is selected as the thresholding function for wavelet threshold denoising. The soft threshold function is defined as follows:
w s ( j , k ) = s i g n w j , k w j , k λ S U R E                                   w ( j , k ) > λ S U R E 0                                                                                                                                               w ( j , k ) λ S U R E
ω j , k represents the wavelet detail coefficient of the signal at scale j and time k after performing the discrete wavelet transform.
In summary, this study ultimately selects the db9 wavelet basis combined with the SUREShrink threshold and the soft threshold function as the parameter set for microseismic signal denoising, providing high-quality input signals for the subsequent fractal dimension and STA/LTA integrated arrival picking. This choice not only ensures the stability and reliability of the processed results but also lays a solid foundation for improving the accuracy of P-wave arrival identification.
2.3. Denoising Algorithm Based on CEEMDAN Improved with Wavelet Thresholding

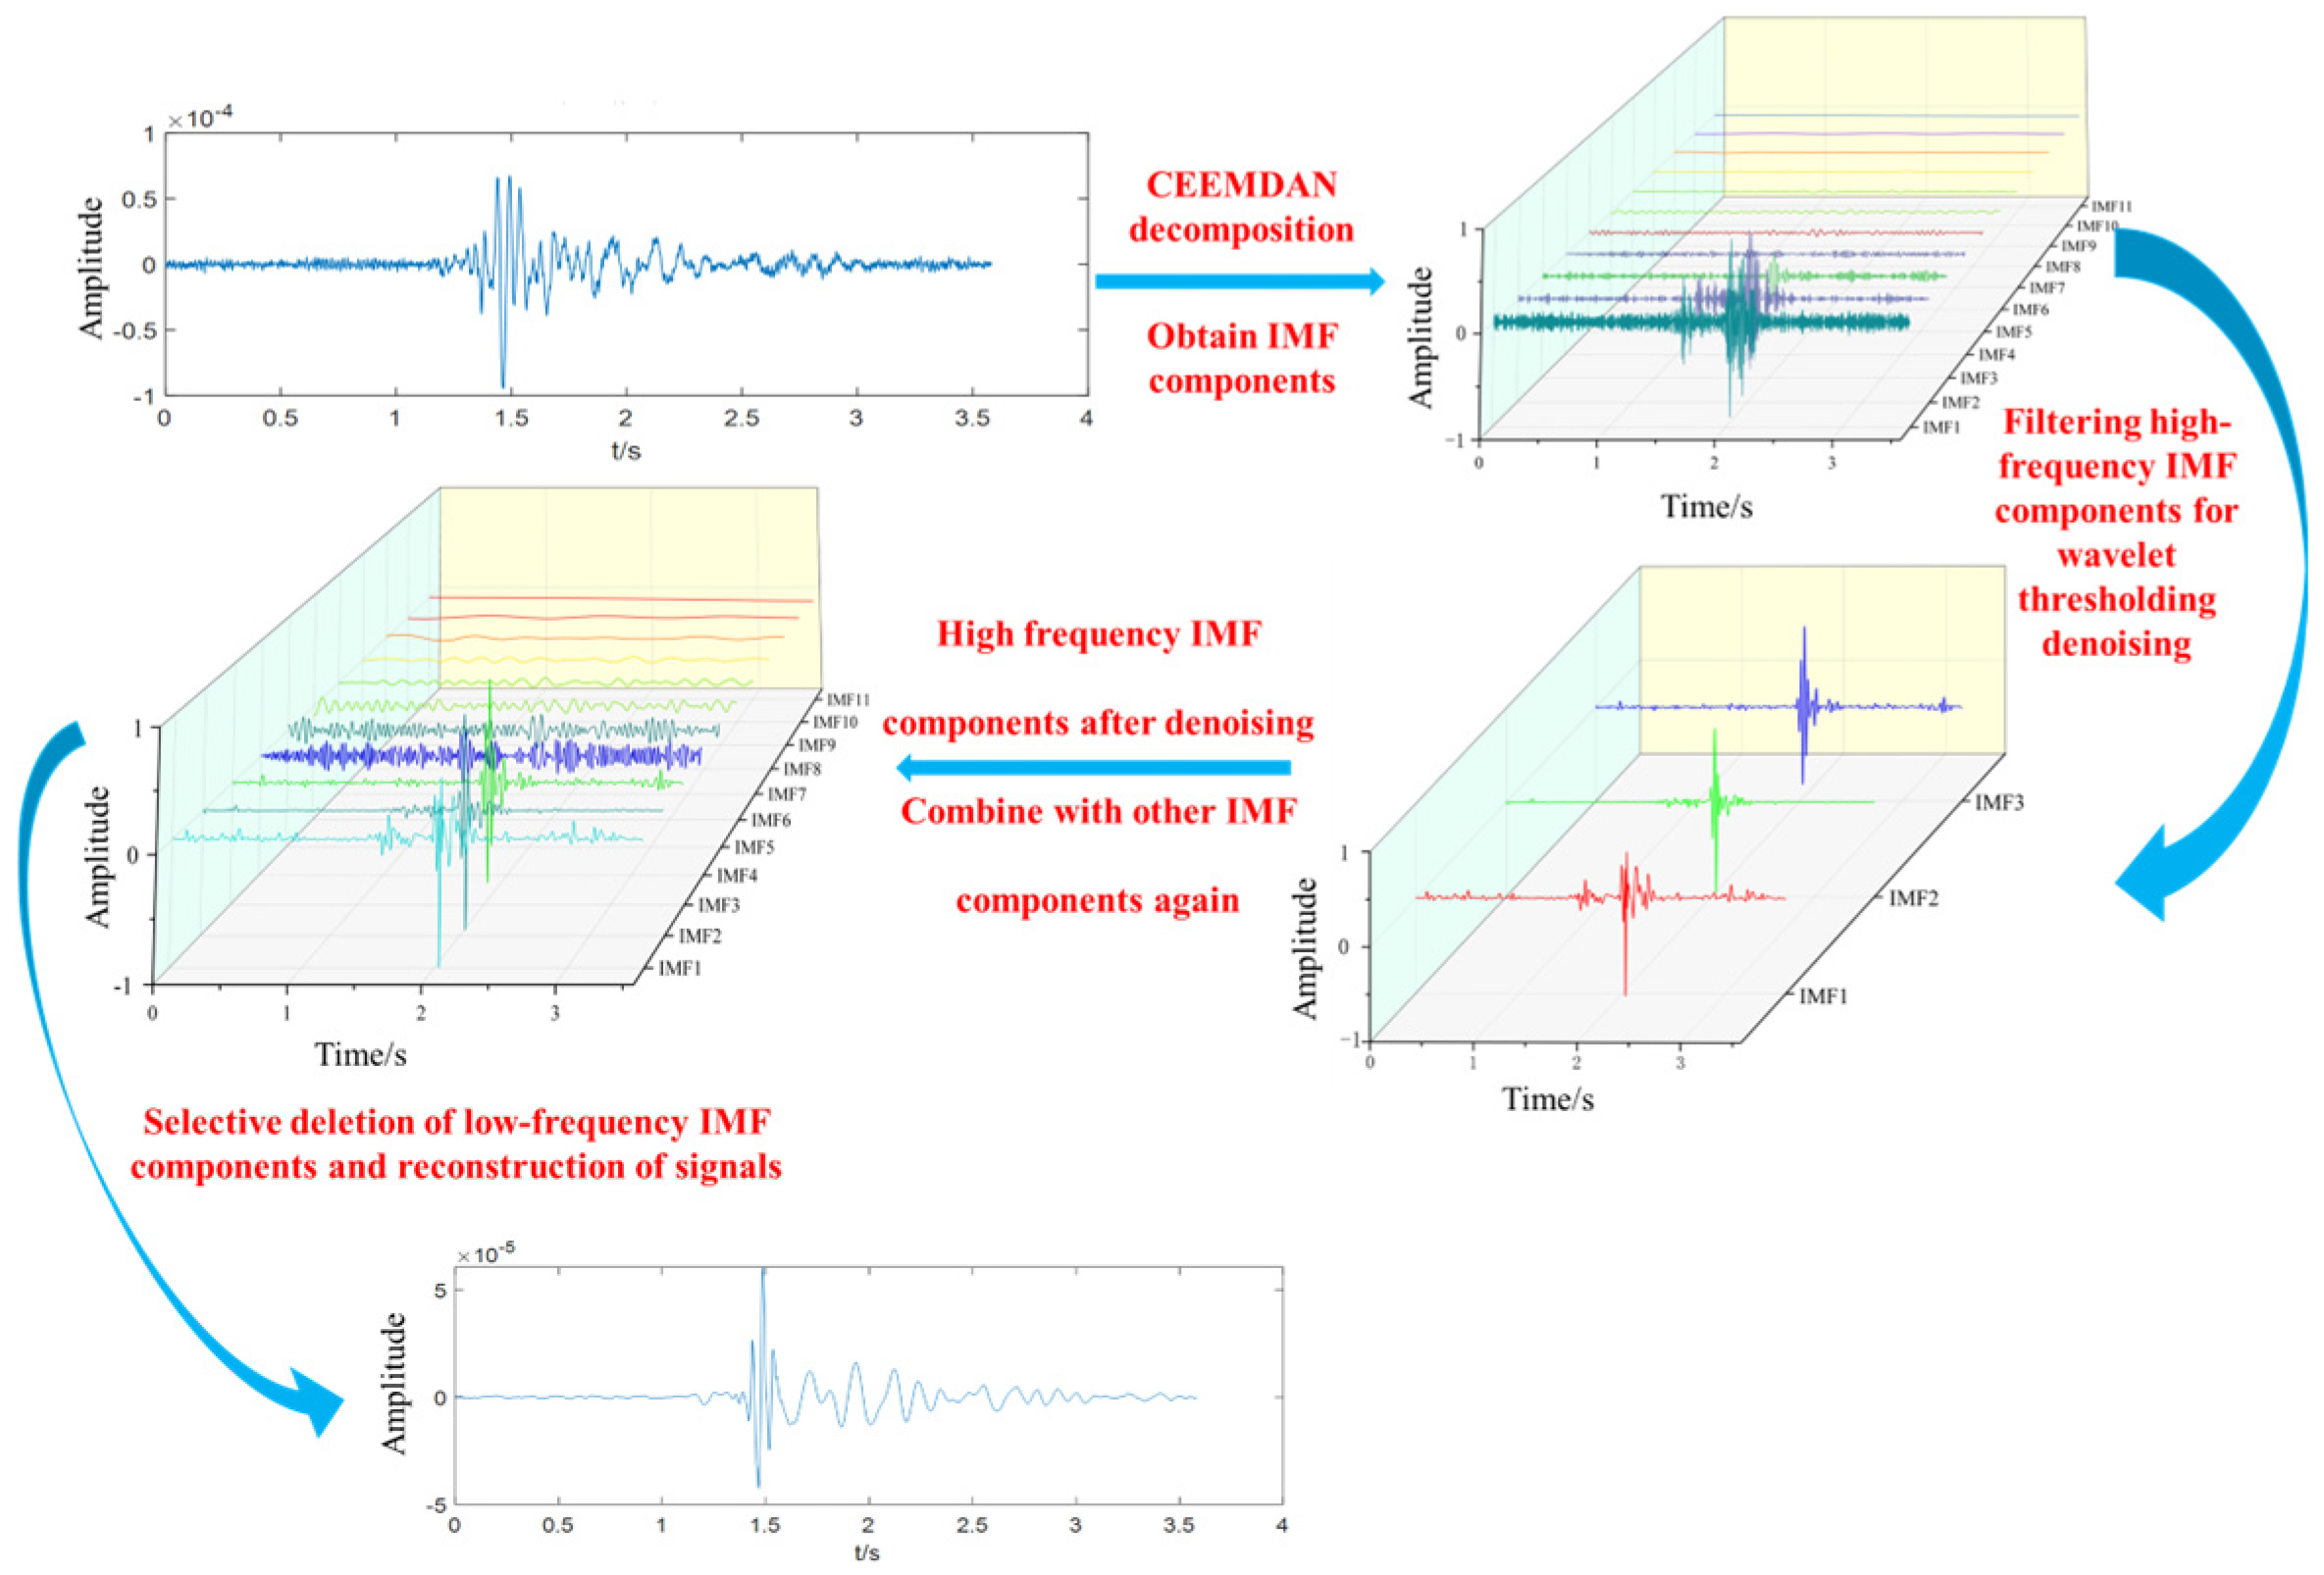
To achieve optimal denoising performance, this study improves the standard CEEMDAN algorithm and develops a CEEMDAN-based microseismic signal denoising method enhanced with wavelet thresholding.
The original microseismic monitoring signals were obtained from an on-site microseismic monitoring system. First, a single channel of the raw signals was selected, with a signal duration and sampling interval of 2 ms. The noisy raw signal was initially decomposed using the CEEMDAN algorithm to obtain the IMF components, with the number of IMFs automatically determined by CEEMDAN according to the signal scales. Based on the main frequency of the signal, IMF components containing significant noise were selected for denoising using the wavelet thresholding algorithm.
In the intrinsic mode functions (IMFs) obtained from the CEEMDAN decomposition, the index of the component is inversely proportional to its corresponding frequency. That is, the higher the IMF index, the lower the frequency component. The higher-order components of the microseismic signal usually reflect background trend terms or low-frequency drift, contributing less to arrival time identification. Therefore, in the denoising stage, the last three high-order IMF components (i.e., the low-frequency components) are discarded, and only the middle-low-frequency and high-frequency valid components are retained for signal reconstruction to achieve a balance between low-frequency trend suppression and preservation of the main waveform. After verification, high-frequency IMFs showed effective denoising results; these were replaced with their denoised versions, while low-frequency IMFs lacking significant signal features were selectively removed. The microseismic waveform was then reconstructed using the CEEMDAN algorithm. The detailed procedure is illustrated in Figure 2.

3. P-Wave Arrival Picking Based on Fractal Dimension with Long- and Short-Time Windows

In the analysis of microseismic signals, the picking of the first arrival of seismic events is a critical step for source localization and disaster early warning, with its accuracy directly influencing subsequent results. Among traditional methods, the STA/LTA (Short-Term Average over Long-Term Average) technique is the most widely used due to its simplicity and high computational efficiency. By comparing the energy within short and long time windows, STA/LTA captures abrupt changes in the signal, enabling rapid detection of seismic events [25]. However, this method relies heavily on energy variation features and is prone to false alarms or missed detections when the noise spectrum overlaps with the signal, the waveform is complex, or the signal-to-noise ratio is low. In contrast, the fractal dimension can characterize the complexity and nonlinearity of a signal; its value typically increases markedly during a seismic event, effectively distinguishing seismic signals from noise. Nevertheless, the response of the fractal dimension often exhibits a certain delay and is sensitive to scale division and parameter selection [26].

3.1. STA/LTA Method

The STA/LTA method is one of the most classical algorithms for picking the first arrival in microseismic signals. This method employs two sliding windows of different lengths on the time series: the short-term window (STA) captures rapid local changes in energy, while the long-term window (LTA) estimates the background noise or overall energy level. By computing the ratio of short-term to long-term energy, the method produces a pronounced response when the signal undergoes a sudden change.
Assuming the discrete signal is x t , with a short-term window length of N s and a long-term window length of N L , as illustrated in Figure 3, the short-term energy and long-term energy are expressed as follows:
S T A ( t ) = 1 N s i = 0 N s 1 x 2 ( t i )
L T A t = 1 N L i = 0 N L 1 x 2 t i
The ratio of short-term energy to long-term energy is given by:
R t = S T A t L T A t
When the ratio R t exceeds a predefined threshold, a seismic event is detected, thereby determining the first-arrival time. The advantages of this method are: (i) it is highly sensitive to abrupt changes in signal energy, enabling rapid response at the onset of an event; (ii) the computation is straightforward, with clearly defined parameters, making it easy to implement in real-time monitoring systems; and (iii) under high signal-to-noise ratio conditions, it can provide accurate and stable arrival time results.
This method also has certain limitations. First, its judgment relies entirely on changes in signal energy; when the background noise is strong or the noise spectrum overlaps with the signal, the STA/LTA ratio may exhibit abnormal fluctuations, leading to false detections. Second, the selection of the threshold significantly affects the results: a threshold that is too low may trigger frequent false alarms, while a threshold that is too high may result in missed events [27]. Moreover, this method cannot reflect the complexity characteristics of the signal, and under low signal-to-noise ratio or non-stationary conditions, the picking accuracy for microseismic signals decreases significantly.

3.2. Fractal Box Dimension Model

Fractal dimension is a nonlinear metric that characterizes the complexity and irregularity of a signal, reflecting its self-similarity and structural complexity [28] across different scales. In microseismic signals, seismic events are often accompanied by pronounced nonlinear disturbances, resulting in complexity levels that differ significantly from the background noise. Therefore, fractal dimension has been introduced as a criterion for first-arrival picking. Unlike the STA/LTA method, which relies on abrupt energy changes, fractal dimension emphasizes the characterization of signal structural complexity, providing complementary information in low signal-to-noise ratio environments.
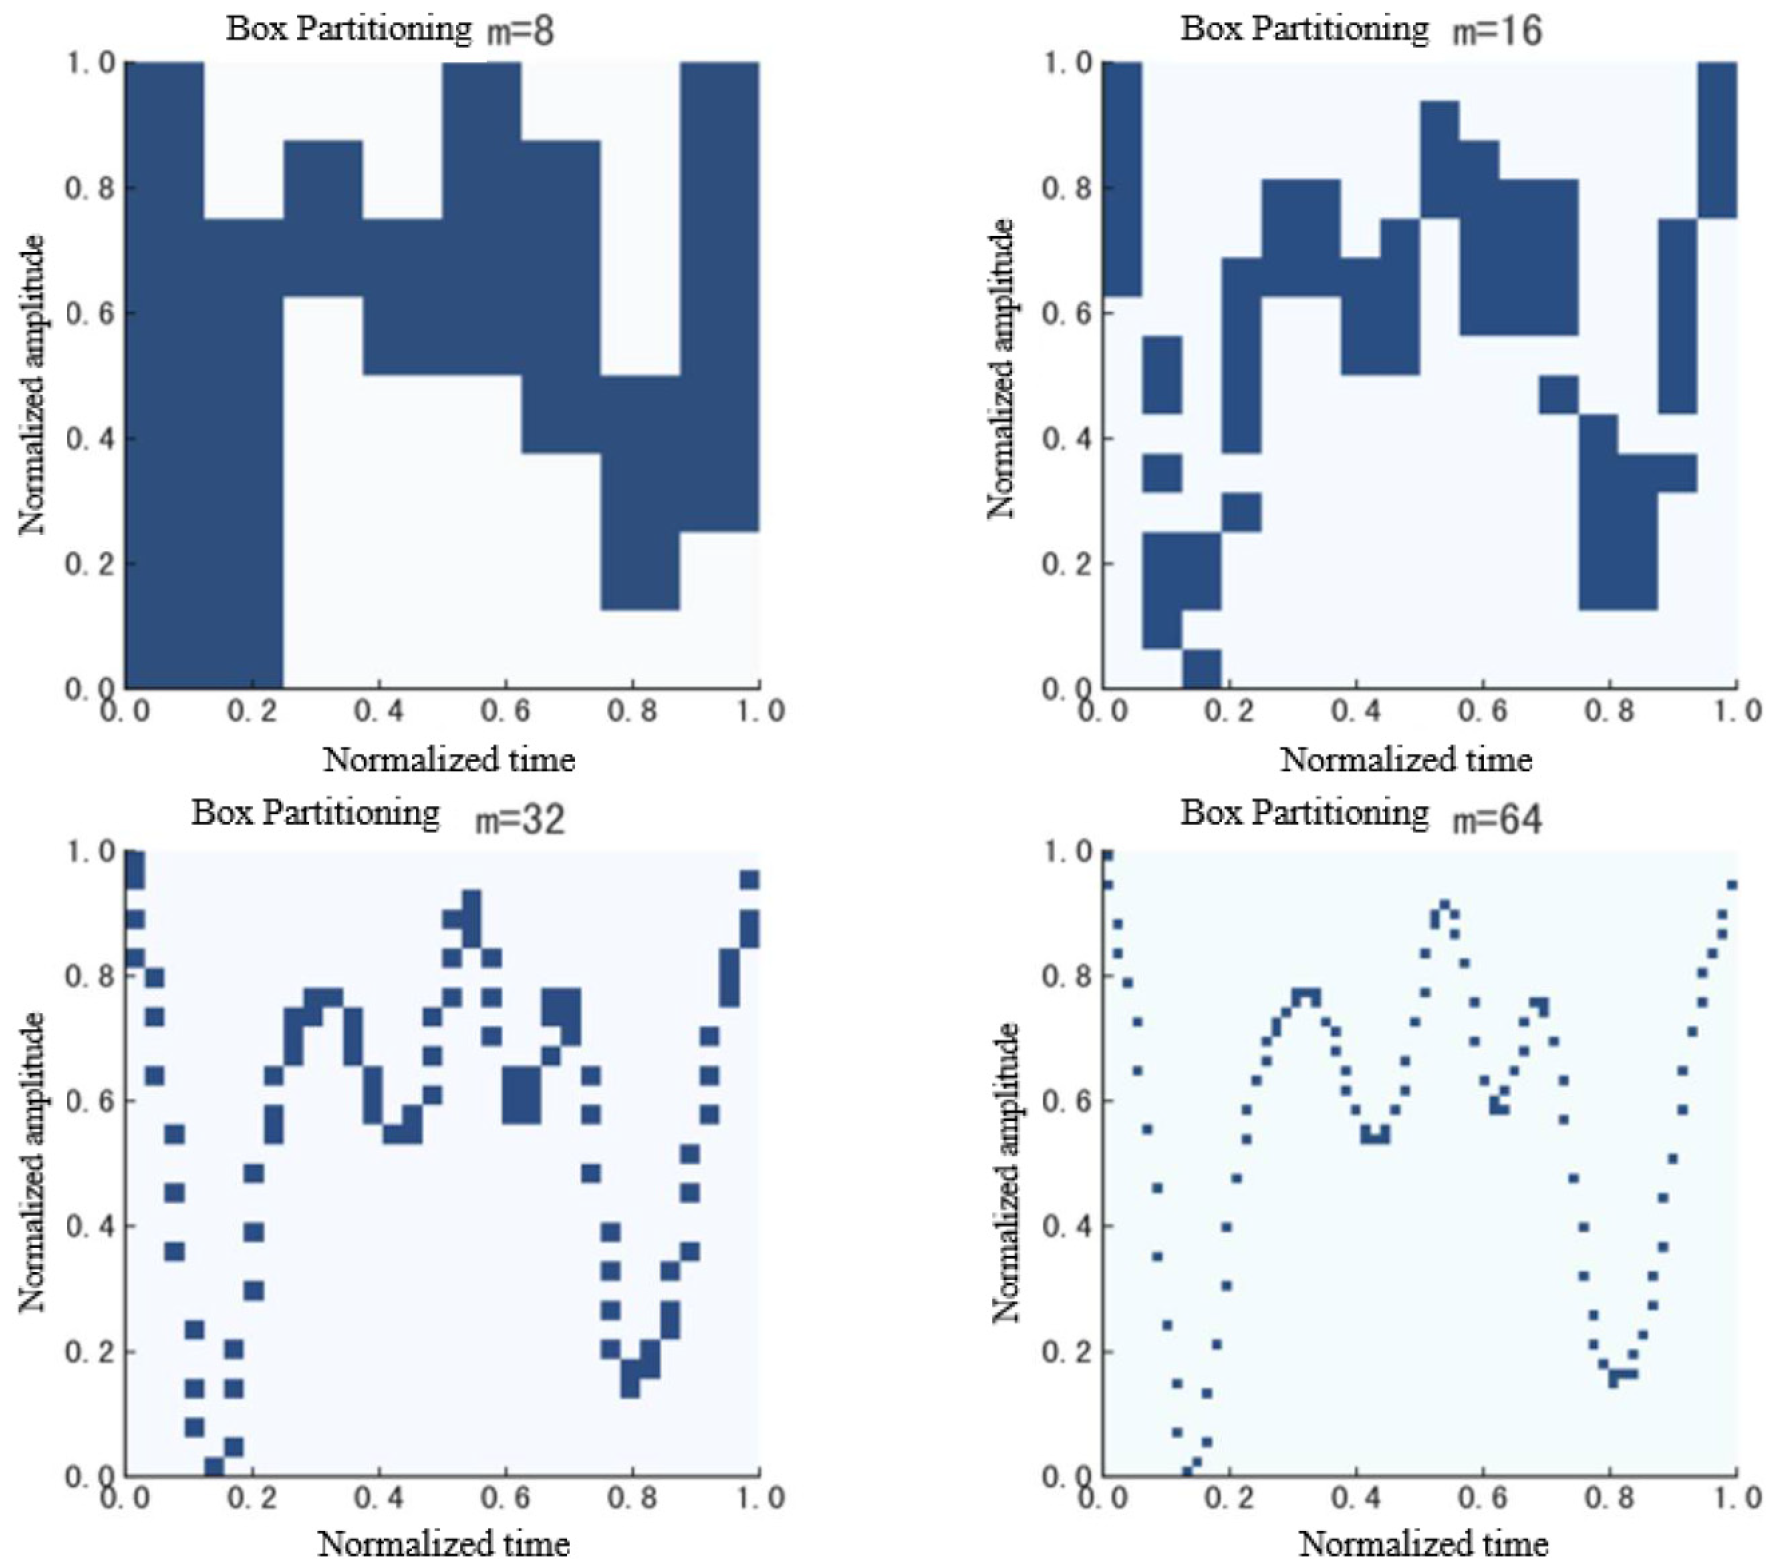
A commonly used method for calculating fractal dimension is the Box-Counting Method. The basic idea of this approach is to divide the signal into a number of intervals at a given scale, count the minimum number of boxes required to cover the signal, and repeat this process across different scales, as illustrated in Figure 4. Let the box size be ε and the number of boxes needed to cover the signal be N ε ; then, the fractal dimension is defined as:
D F = lim ε 0 log N ε log ε
By performing a linear fit of log N ε versus log ε in a double-logarithmic coordinate system, the fractal dimension of the signal can be obtained. Generally, the fractal dimension ranges between 1 and 2, with larger values indicating greater signal complexity. For noise signals, due to their relatively random fluctuations, the fractal dimension is typically lower, whereas during the first-arrival of a seismic event, the signal complexity increases sharply, causing a significant rise in fractal dimension [29]. The calculation of the fractal dimension uses a maximum box partition number of 64, ensuring the stability and accuracy of the fractal dimension, as illustrated in Figure 5.
In practical applications, fractal dimension can effectively distinguish seismic events from background noise, demonstrating greater robustness than the energy-based STA/LTA method, especially under low signal-to-noise ratio (SNR) conditions. For instance, at the P-wave arrival of a microseismic signal, the short-window fractal dimension typically exhibits a rapid increase, with its first derivative showing a sharp peak. In contrast, the long-window fractal dimension changes more smoothly due to the inclusion of more background information. The difference between the two, as well as the difference in their derivatives, can be used to characterize the instantaneous abrupt changes at the P-wave arrival.
The fractal dimension method also has certain limitations. First, the box-counting approach is highly sensitive to scale partitioning and interval length selection; improper parameter settings may lead to biased results. Second, fractal dimension primarily reflects the overall complexity characteristics of a signal, and its response to instantaneous changes is somewhat delayed, making it unsuitable for directly achieving high-precision picking. Additionally, its computational process is relatively complex, which makes it challenging to implement efficiently in real-time monitoring systems to meet the dual requirements of accuracy and timeliness in practical coal mine microseismic monitoring [30].
In summary, the STA/LTA method emphasizes energy surges, while the fractal dimension method focuses on changes in complexity—showing complementary mechanisms. The P-wave onset of microseismic signals typically exhibits both a rapid accumulation of energy and a significant jump in complexity. Therefore, it is necessary to develop a combined picking method that integrates both types of features. Such an approach can achieve more stable and accurate automatic picking under low SNR and complex conditions, laying the theoretical foundation for the innovative method proposed in this study.

3.3. Fractal–STA/LTA Weighted Fusion Method

Analysis of traditional methods reveals that the STA/LTA approach relies on energy ratio to detect seismic events, offering high sensitivity to abrupt changes but exhibiting poor stability in low-SNR environments. In contrast, the fractal dimension method captures variations in signal complexity and performs well under strong noise conditions, yet its response to instantaneous changes is relatively sluggish. The P-wave first arrival in microseismic signals inherently represents a synchronous coupling of rapid energy accumulation and a sudden complexity transition, making it difficult for a single method to fully characterize its features [31]. Therefore, this study proposes a weighted picking method that integrates energy and complexity features, achieving a complementary combination of the strengths of STA/LTA and fractal dimension characteristics from a theoretical perspective.
This method extracts four types of features: (i) the derivative of the short-window fractal dimension, which reflects abrupt local increases in complexity; (ii) the difference between short- and long-window fractal dimensions, which characterizes the disparity between local and global complexity; (iii) the difference between the derivatives of short- and long-window fractal dimensions, which captures the contrast between the rapid response of the short window and the slower response of the long window; and (iv) the STA/LTA energy ratio, which represents sudden changes in signal energy. Since these features have different units and value ranges, Z-score normalization is applied to all features by estimating their means and standard deviations within the pre-event interval:
Ζ j t = F j t μ j σ j
where F j k denotes the j -th feature, and μ j and σ j represent its mean and standard deviation, respectively. Through standardization, all features are normalized as anomaly measures relative to the noise background. Subsequently, a weighted scoring function is constructed as follows:
S c o r e t = ω 1 Ζ F D t + ω 2 Δ F D t + ω 3 Δ F D t + ω 4 R t
Z F D t represents the derivative of the short-window fractal dimension, Δ F D t denotes the difference between short- and long-window fractal dimensions, and Δ F D t refers to the difference between the derivatives of the short- and long-window fractal dimensions. In this study, a short window of NS = 0.02 s and a long window of NL = 0.16 s are uniformly used to calculate the above data.
The weighting coefficients ω 1 , ω 2 , ω 3 , ω 4 emphasize, respectively, the instantaneous complexity surge, the local–global complexity disparity, the dynamic response contrast, and the abrupt energy increase.
To achieve effective fusion of multiple feature information, the four weight coefficients ω 1 , ω 2 , ω 3 , ω 4 in Equation (11) are determined using grid search on the validation set, with the constraints ω i 0 and i = 1 4 ω i = 1 . The search step size is set to 0.05, with the main objective being to minimize the mean absolute error, and the secondary criterion being to maximize the picking success rate. The optimal solution is chosen as the final weight. The final values obtained are ω 1 = 0.30 , ω 2 = 0.25 , ω 3 = 0.25 , ω 4 = 0.20 . This combination achieves a balance between transient sensitivity and the local-global contrast.
To evaluate the robustness, each weight is perturbed by ±10%, and the remaining weights are re-normalized proportionally so that their sum equals 1. The indicators are then recalculated on the entire test set. The results show that under the condition of S N R 0   d B , the MAE variation does not exceed 3%, and the SR variation does not exceed 1.5%; under the condition of S N R = 5 d B , the MAE variation does not exceed 4%, and the SR variation does not exceed 2%. This indicates that the weighted scoring function is insensitive to moderate weight changes and exhibits good stability and robustness.
To avoid false detections caused by noise spikes, a two-stage criterion is adopted: the threshold pre-check triggers the candidate interval, and the final arrival time is determined by local extrema. Specifically, the mean μ s and standard deviation σ s of the Score(t) within the interval t 0 , t 1 are used to set an adaptive threshold:
θ = μ s + 2 σ s
When Score(t) first crosses the threshold and satisfies the condition of 5 consecutive sampling points, the moment is recorded as the candidate starting point t t h . Then, peaks are only searched within the bounded window t t t h , t t h + W , and the final arrival time is defined as:
t P = arg max t S c o r e t
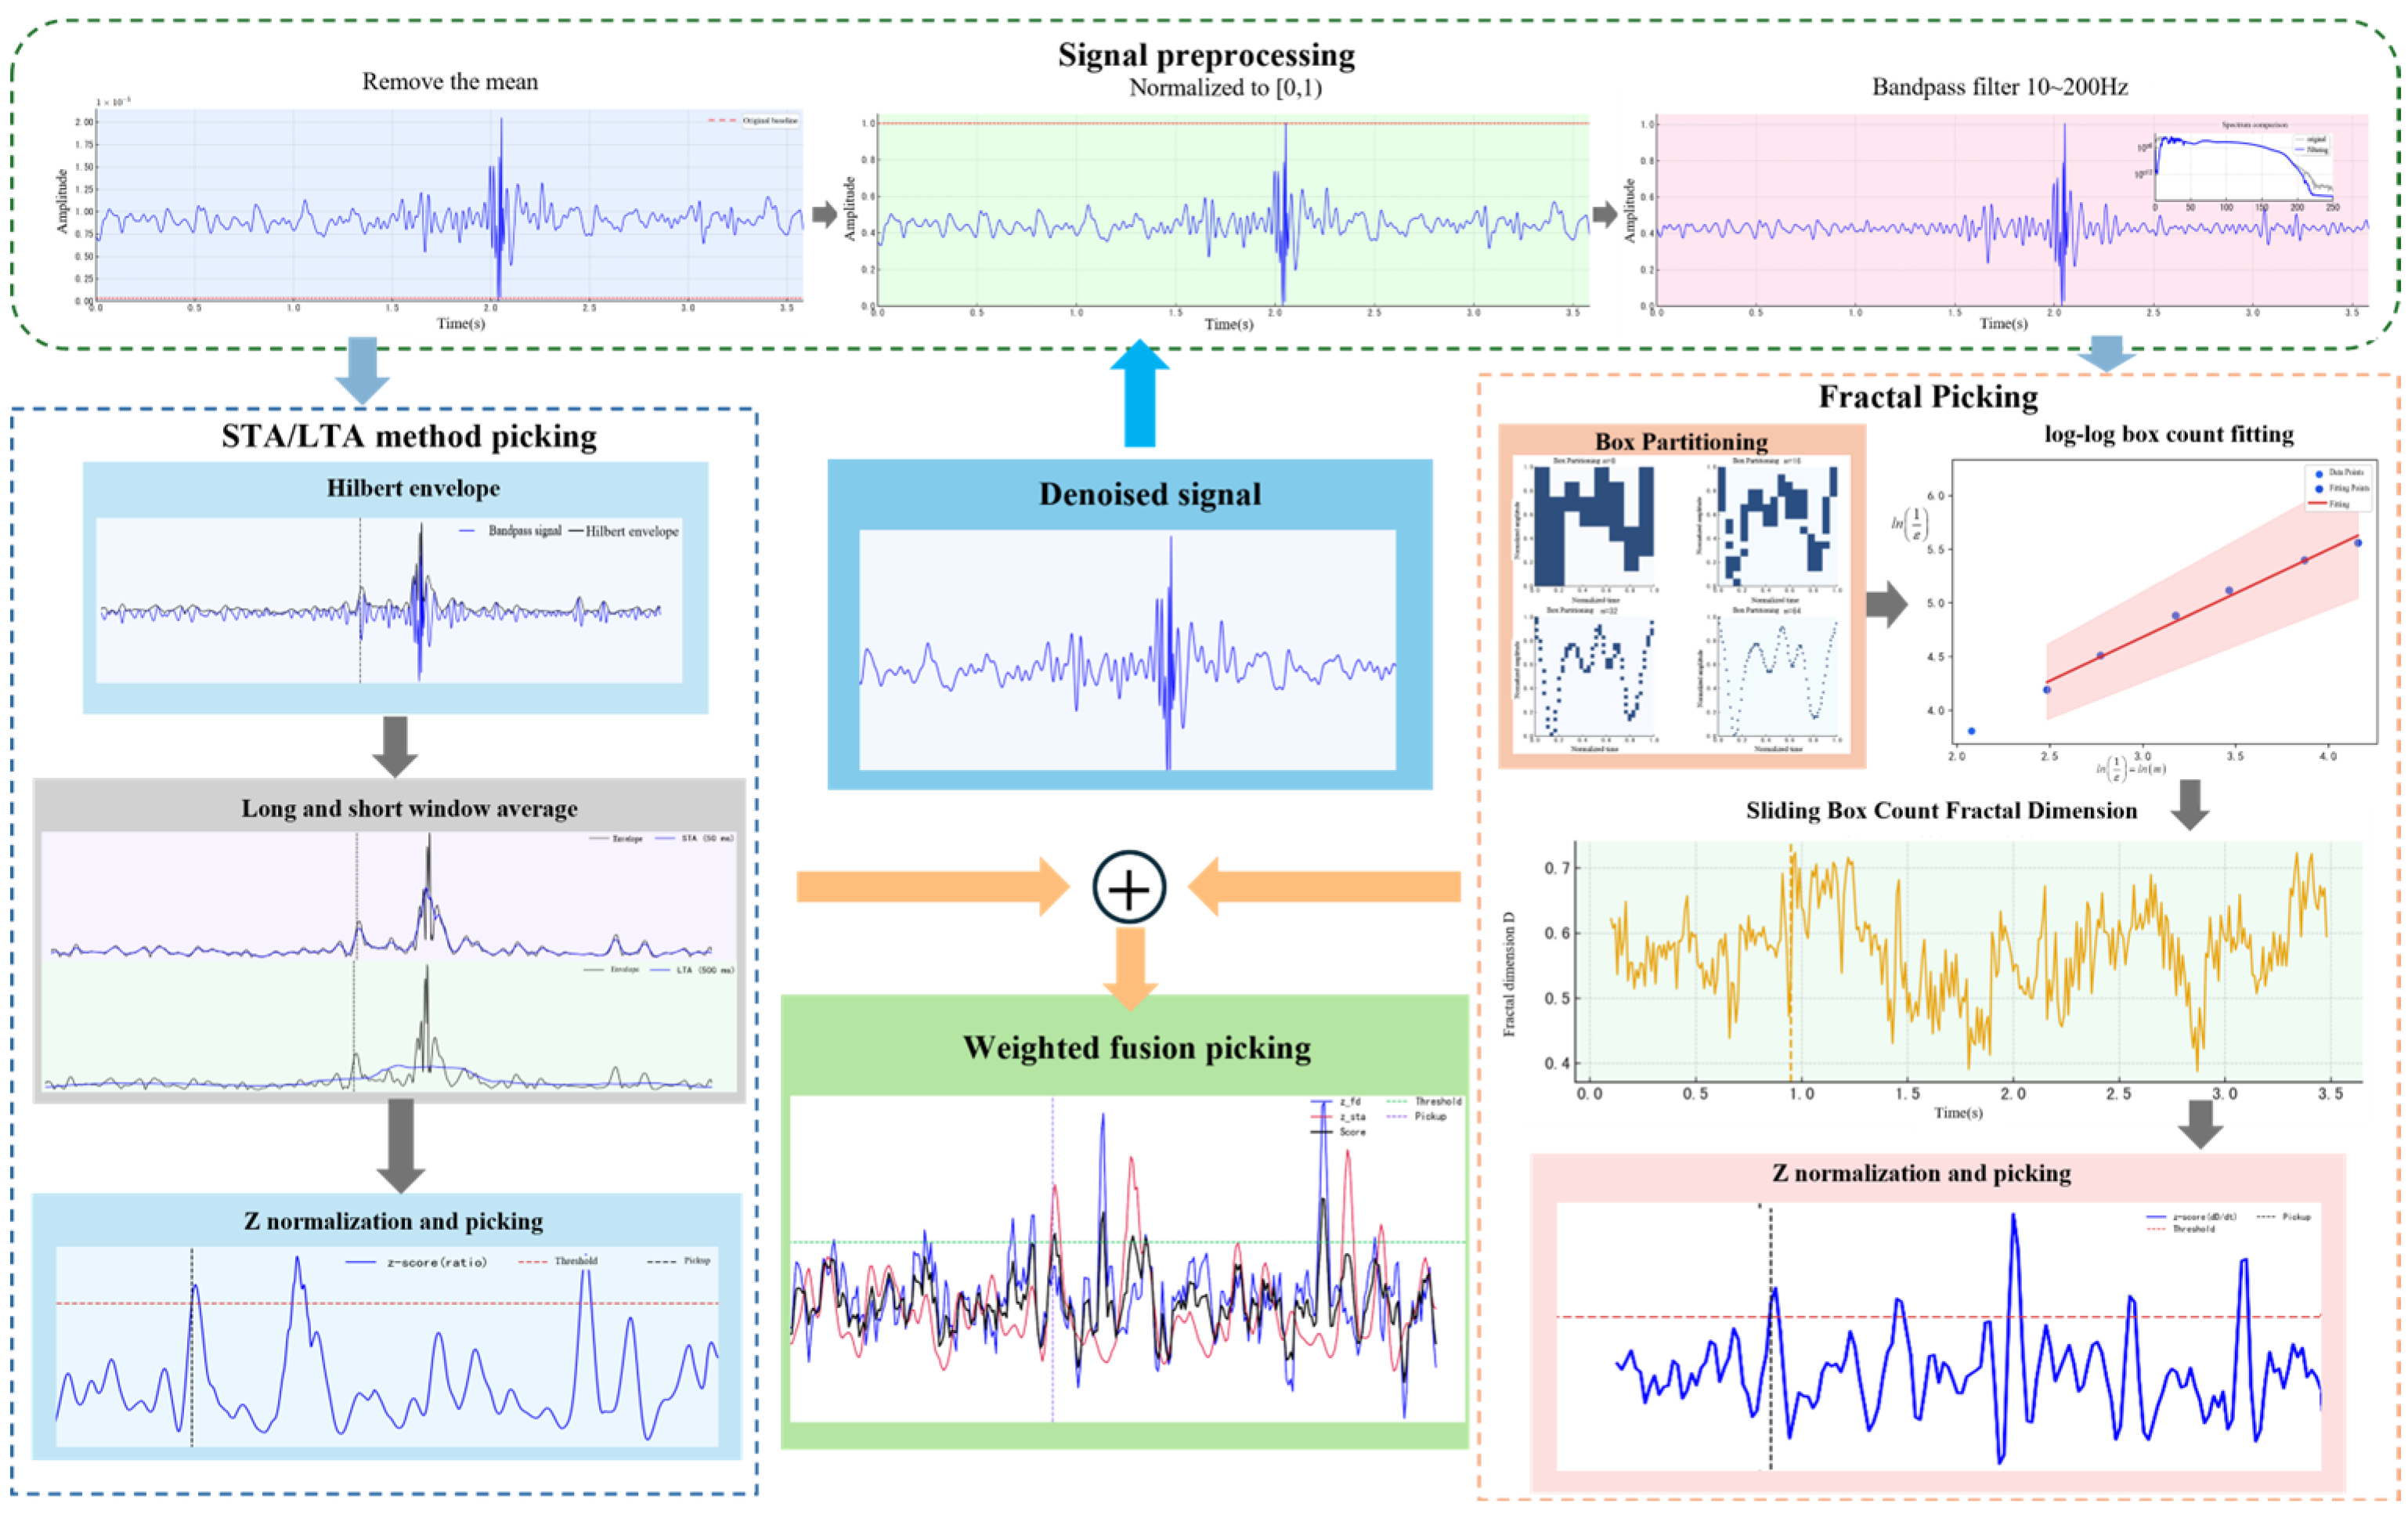
This method outputs the continuous scoring function Score(t) and the final arrival time t p after inputting the waveform y(t), which has been denoised using CEEMDAN + wavelet thresholding. By complementing the fusion of energy and complexity features, it effectively overcomes the instability of single methods under low signal-to-noise ratios and complex environments. Compared with traditional approaches, the proposed fusion method not only preserves the high sensitivity of the STA/LTA algorithm but also incorporates the robustness of fractal dimension analysis, thereby significantly improving the accuracy and reliability of arrival-time picking. The overall workflow of this method is illustrated in Figure 6.
To ensure the reproducibility of the method, the entire process is implemented in a unified software environment. The key programming languages and library versions are shown in Table 3.

4. Recognition Performance of Vibrations Under Different Signal-to-Noise Ratios (Artificially Synthesized Seismic Waveforms)

In the processing and analysis of vibration signals, the signal-to-noise ratio (SNR) serves as a critical metric for evaluating signal quality. A high SNR typically indicates that the signal amplitude is significantly greater than the noise level, whereas a low SNR increases noise interference and hinders the accurate detection of events. This subsection aims to assess the noise suppression capability and event recognition accuracy of the CEEMDAN combined with wavelet-threshold denoising approach and the STA/LTA method augmented by fractal dimension analysis, under varying SNR conditions.
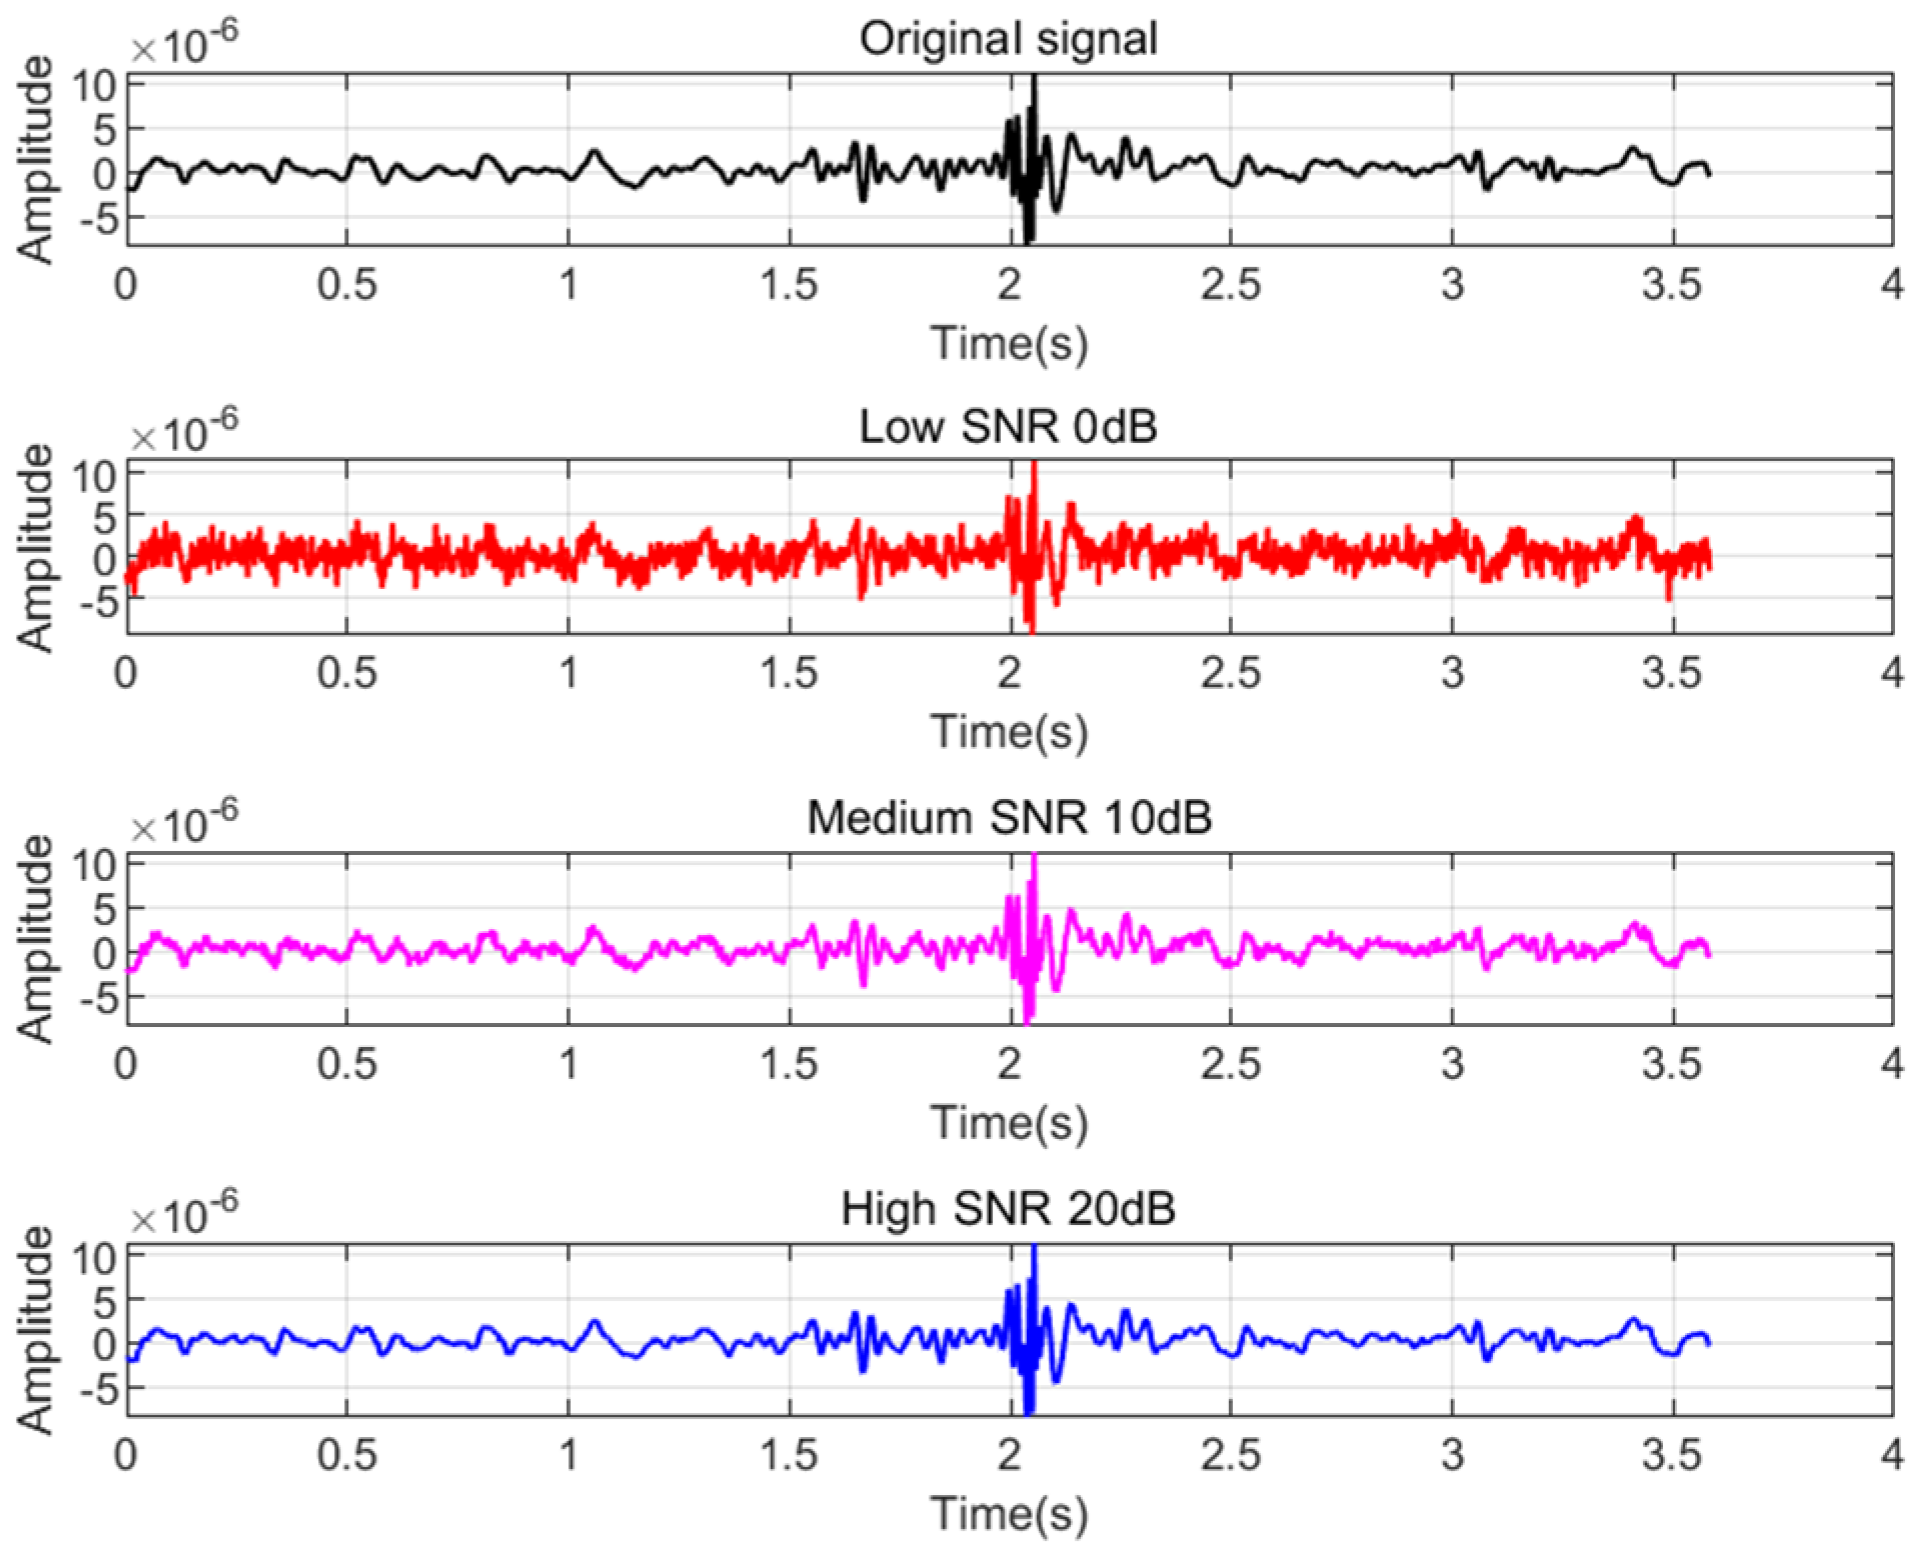
To improve reproducibility and ensure consistency with actual measured conditions, a clean microseismic signal without noise is constructed at a sampling rate of 500 Hz, and band-limited noise is added according to the SNR definition in Equation (3) to simulate different conditions. The clean signal uses the Ricker wavelet as the source wavelet, with a central frequency of 35 Hz and a main frequency band of approximately 20–80 Hz. The total recording duration is 4.0 s. To reflect propagation effects, a tail wave with slowly decaying amplitude is added after the wavelet, along with slight high-frequency attenuation. The noise is band-limited Gaussian noise: zero-mean white noise is first generated and then band-passed between 5 and 200 Hz to match the sensor bandwidth. It is then scaled and added according to the target SNR (20, 10, 0 dB, corresponding to Figure 7). The fractal/energy feature analysis windows are consistent with those used earlier: short window of 0.02 s and long window of 0.16 s (with a sliding step of 1–2 points), ensuring that the normalized time used for fractal estimation is shorter than the typical oscillation period and contains enough sampling points. The constructed signals are illustrated in Figure 7.

4.1. Noise Suppression Effectiveness at Different SNRs

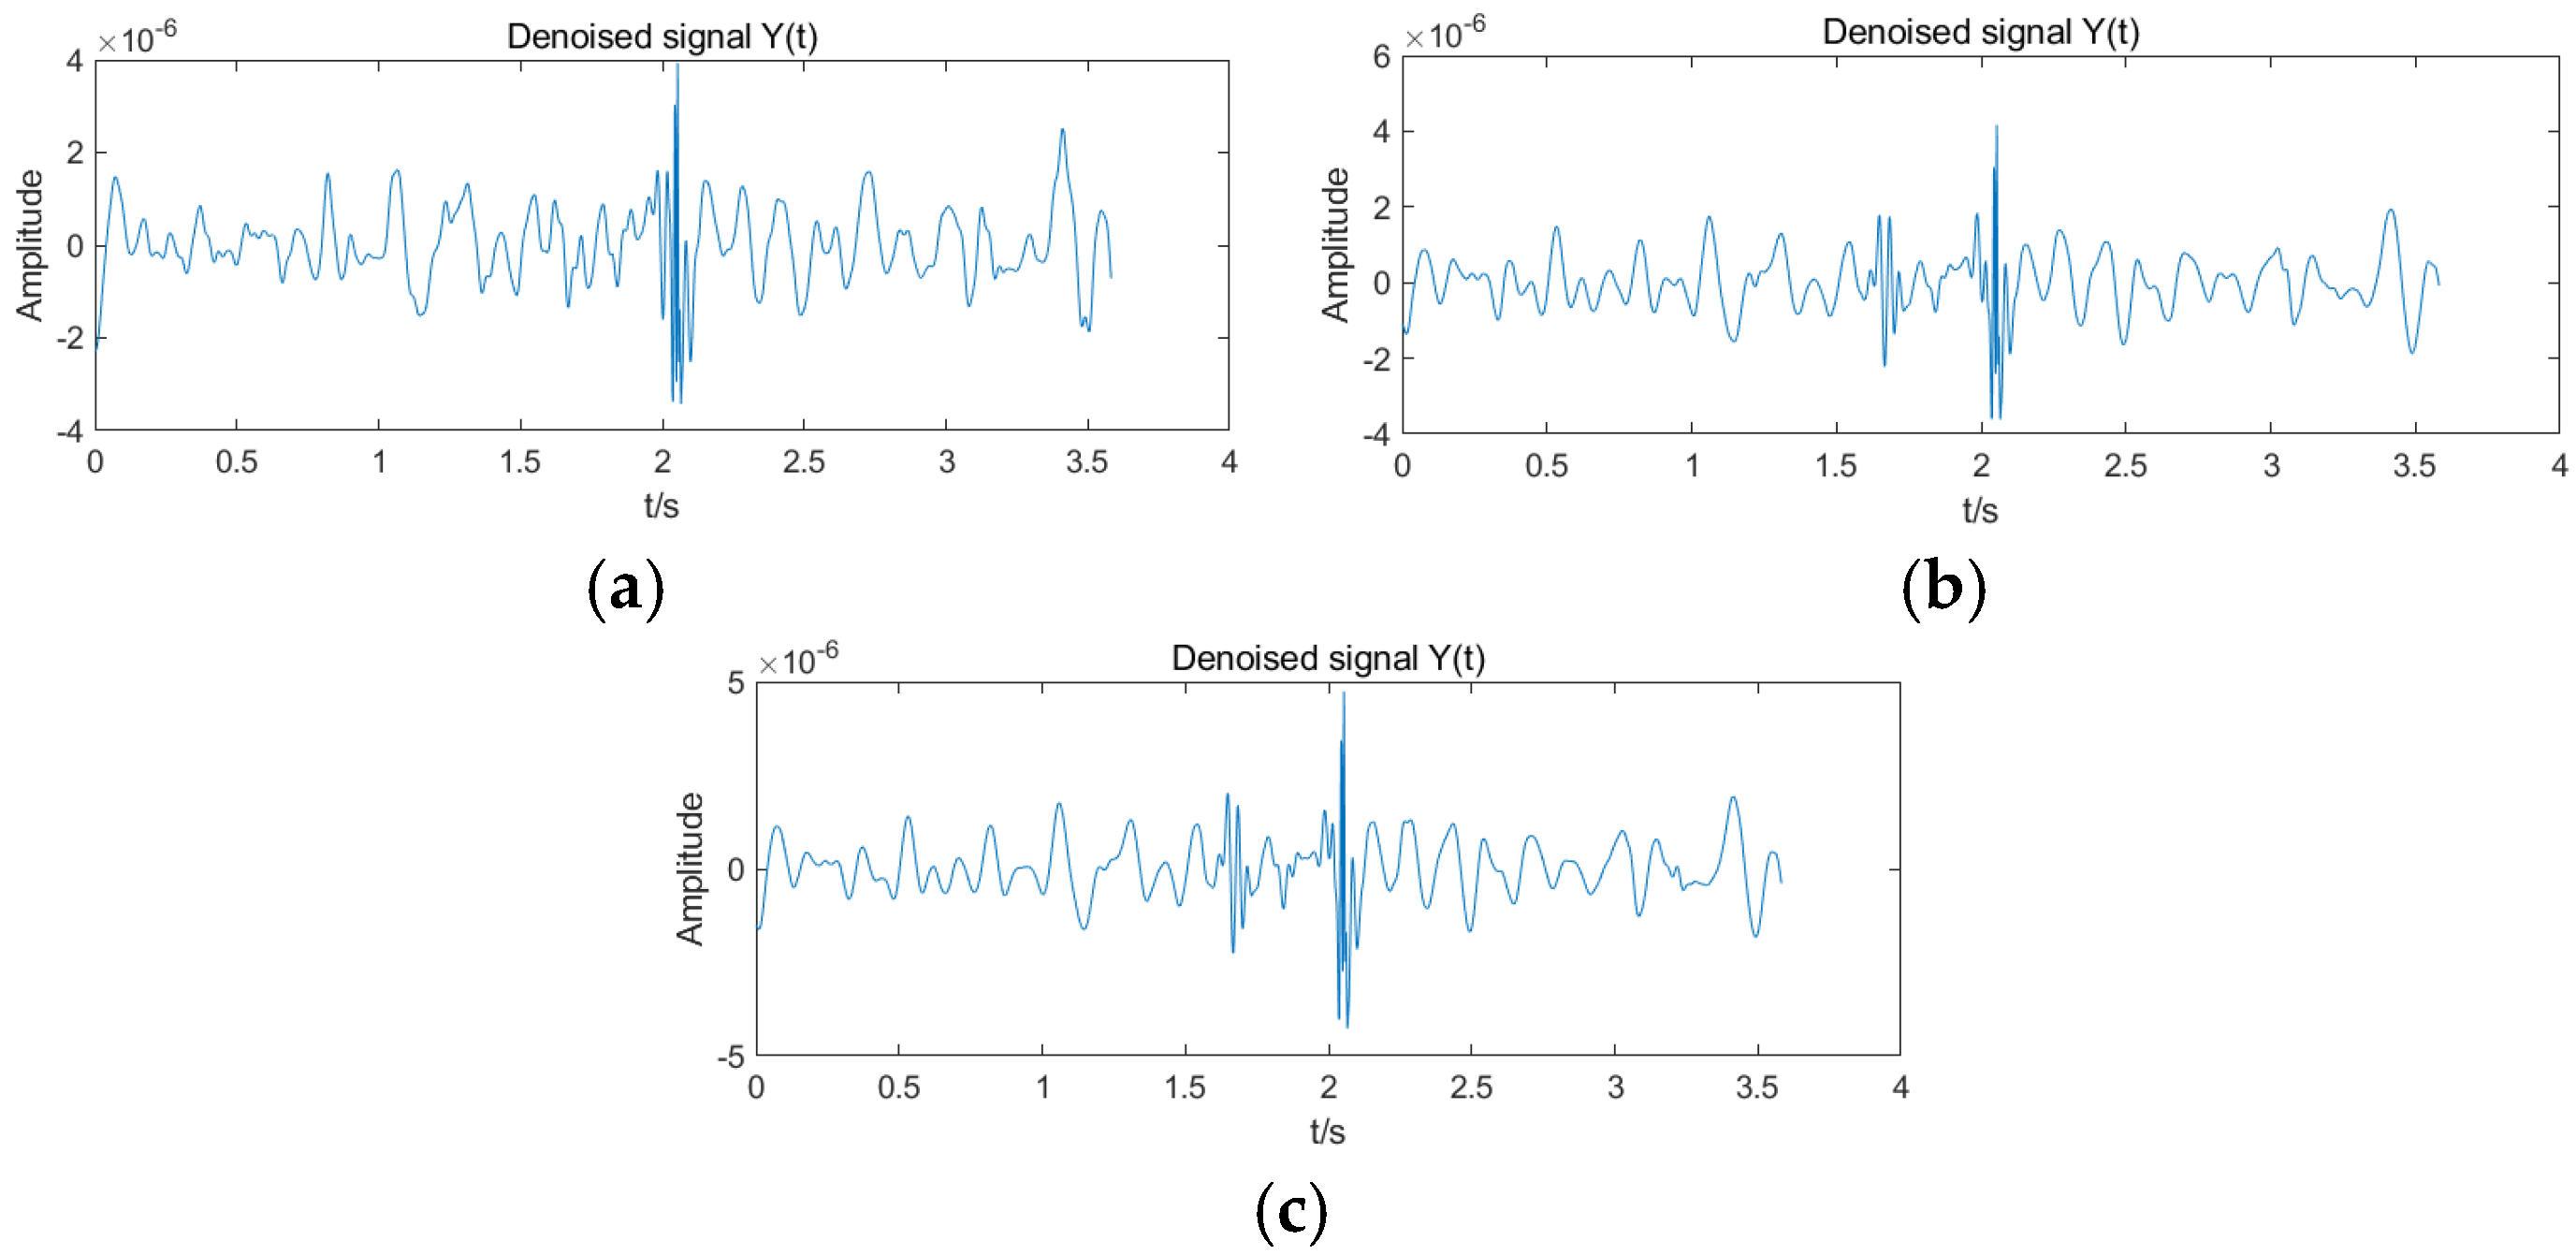
The signals obtained by adding white noise were processed using the CEEMDAN–wavelet threshold algorithm for noise suppression, and the denoised results are shown in Figure 8.
Under low SNR conditions, the original signal is almost completely submerged in noise, making the waveform characteristics difficult to discern. After denoising, as shown in Figure 8a, although residual noise remains, the primary pulse signal is successfully recovered, indicating that the method retains a certain degree of robustness even in extremely noisy environments. Under medium SNR conditions, noise interference in the signal is pronounced, but regions of abrupt energy change become initially visible. Following denoising, as illustrated in Figure 8b, the main signal components are well restored, noise energy is significantly reduced, and the Δ S N R exhibits a notable improvement. Under high SNR conditions, although the original signal is still affected by noise, the overall waveform remains relatively clear. After denoising, as presented in Figure 8c, the fine structural details of the signal are fully preserved while residual noise is effectively suppressed, demonstrating strong waveform retention. As summarized in Table 4, the method consistently achieves significant SNR enhancement and effective recovery of signal characteristics across all three noise scenarios, thereby verifying its noise suppression capability and robustness.

4.2. Arrival-Picking Accuracy Under Different SNRs

Before performing arrival time picking at different signal-to-noise ratios, to obtain reliable arrival times, this study employs three analysts with ≥5 years of experience to independently and blindly mark the signals. Both the original and denoised waveforms are displayed, with the first distinguishable P-wave arrival used as the criterion, and the cursor resolution is set to 1 sample point. The manual arrival time for each record is taken as the median of the three analysts’ results. If the maximum difference between them exceeds 4 ms, a recheck is performed, and a consensus arrival time is determined. The final picked arrival time is 1.08 s. The results are shown in Figure 9.
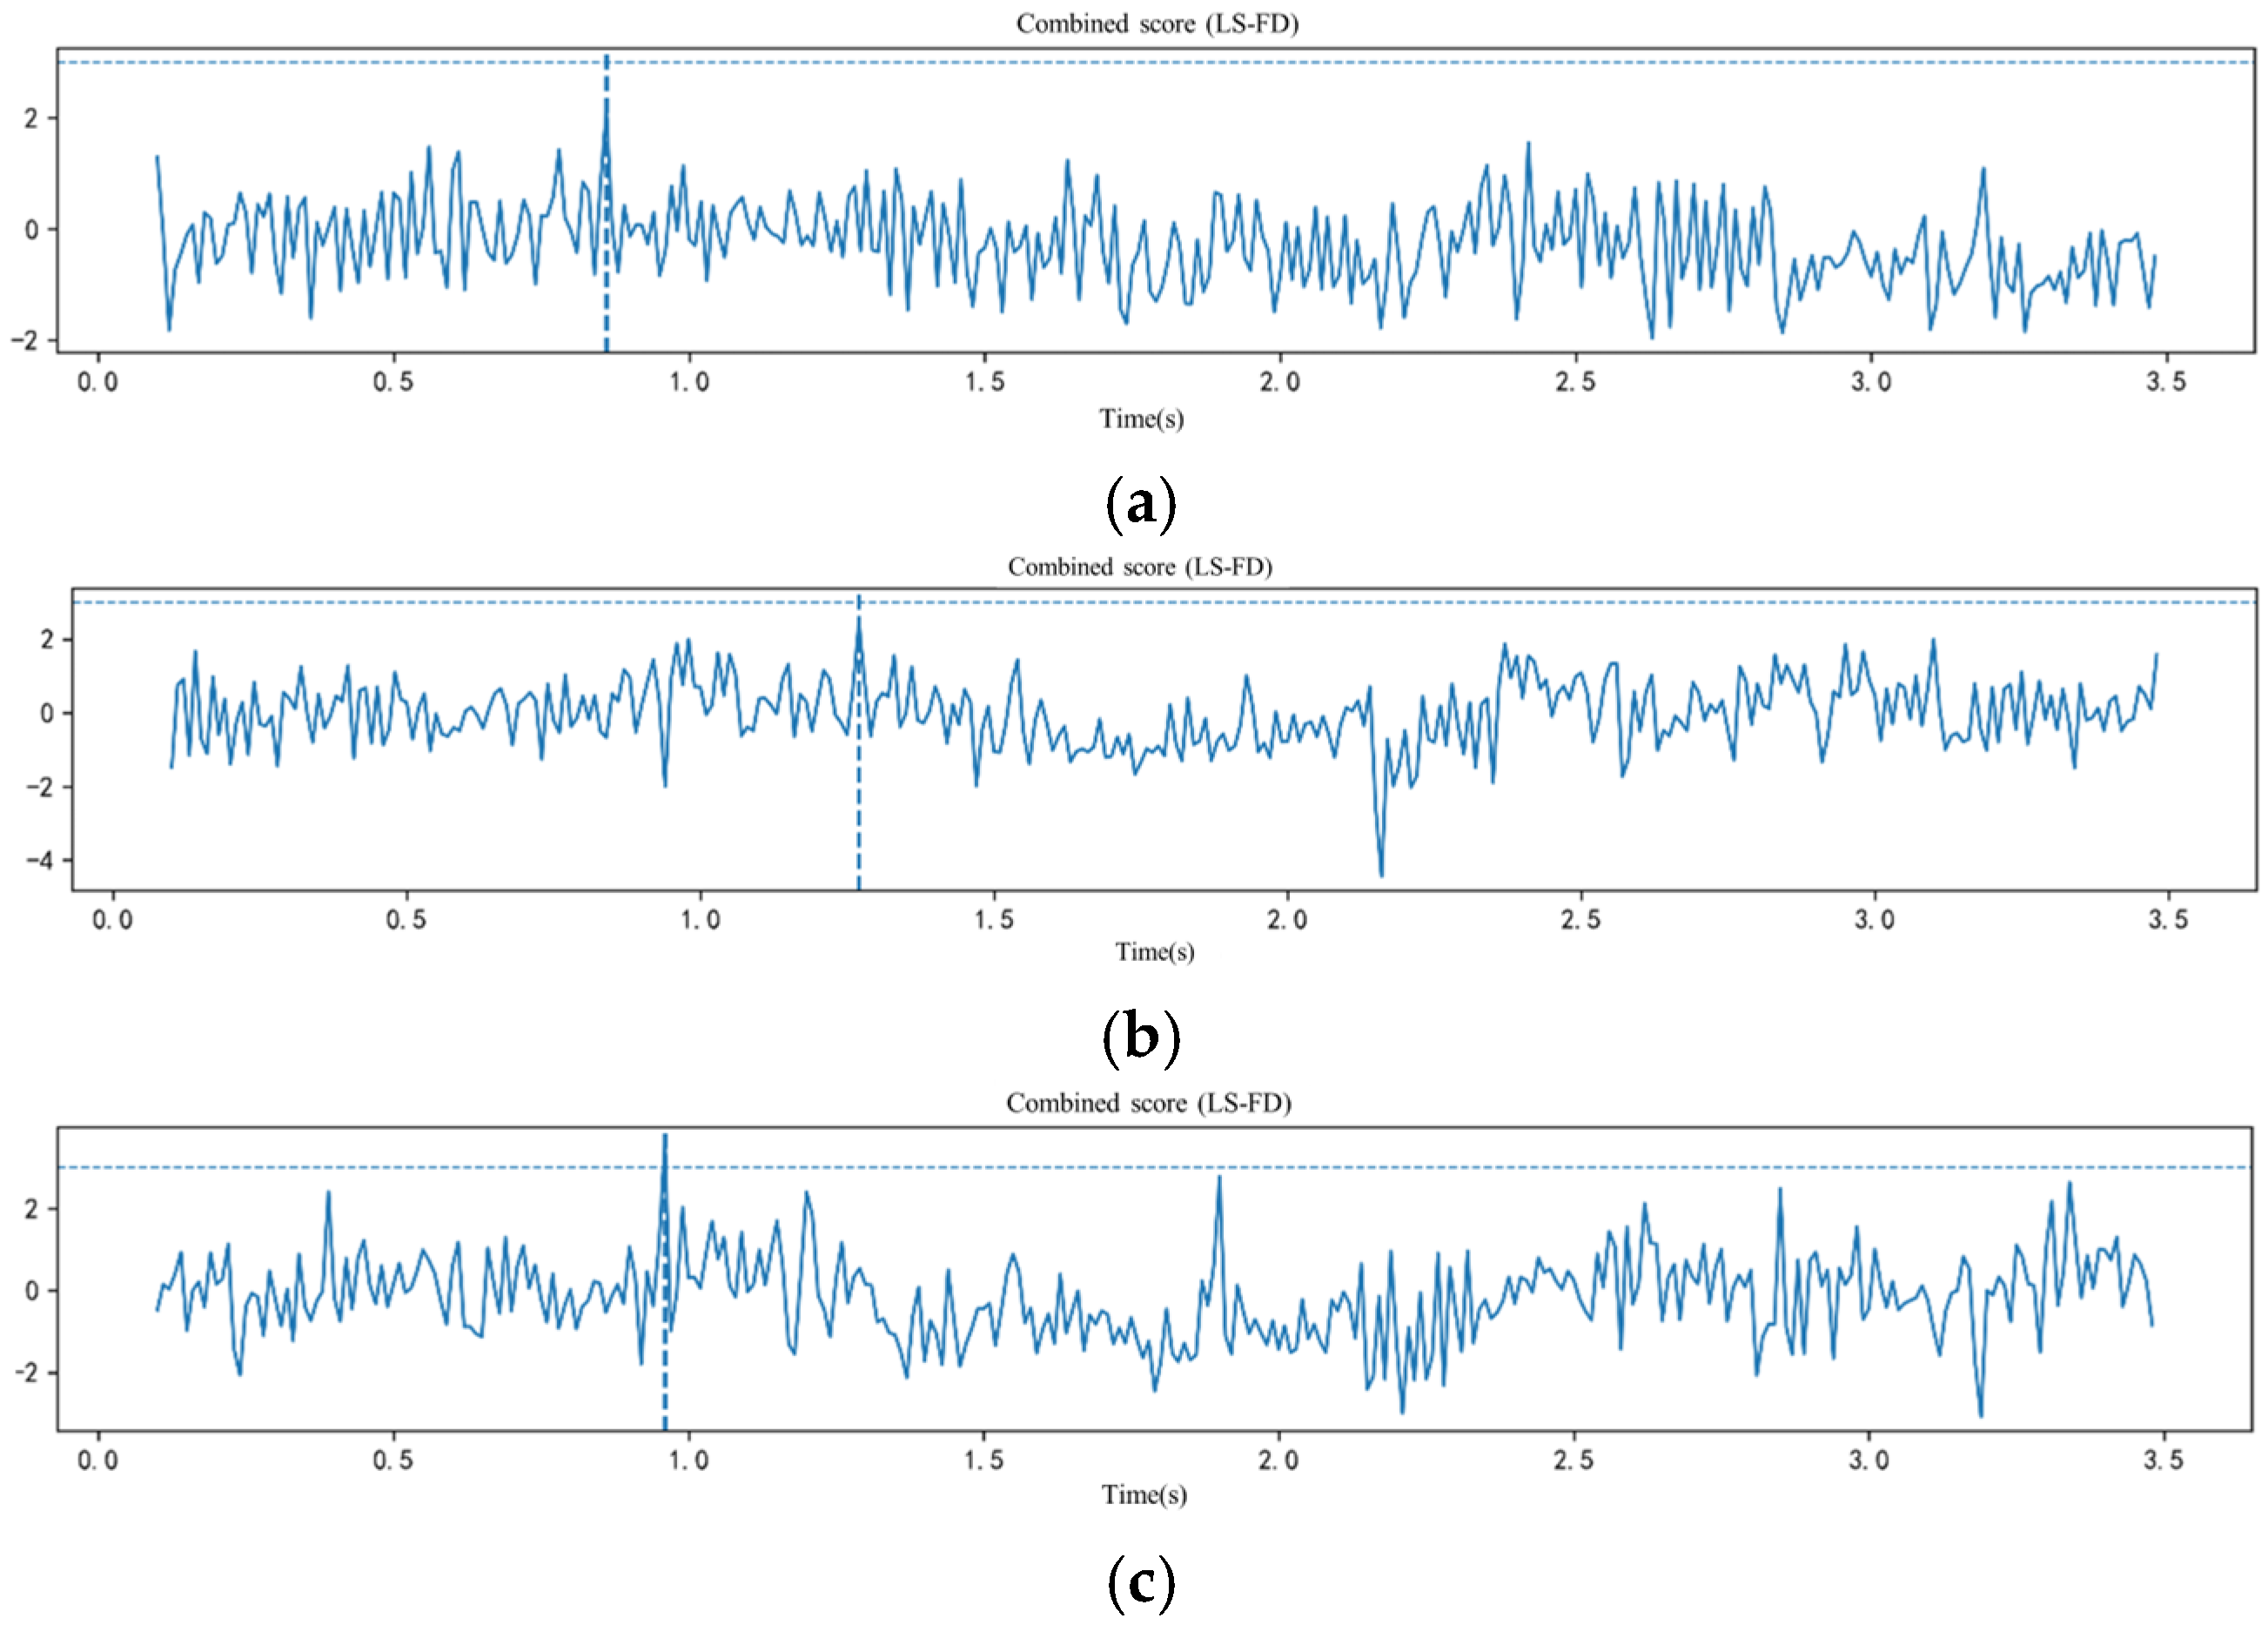
The denoised signals with three different SNR levels, as obtained in Section 3.1, were processed for arrival picking using the fractal–STA/LTA weighted fusion approach. The corresponding results are presented in Figure 10.
Under low SNR conditions, the signal is largely submerged in noise, and the waveform characteristics are obscured. Nevertheless, the LS-FD indicator exhibits a distinct abrupt change near the P-wave arrival, yielding a picking result of approximately 0.86 s, which allows for a reasonably accurate identification of the event onset. This demonstrates that the method maintains a certain degree of robustness even in extremely noisy environments. Under medium SNR conditions, noise interference in the original waveform is alleviated, and the region of energy variation becomes increasingly apparent. The fractal dimension derivative and the joint evaluation function provide clear extrema around 1.27 s, resulting in stable picks that outperform those under low SNR, indicating good adaptability of the method to moderate noise levels. Under high SNR conditions, the waveform contour of the signal is relatively clear, and the P-wave arrival feature is pronounced. The LS-FD curve exhibits a significant peak around 0.96 s, further improving the picking accuracy and yielding the smallest error.
As shown in Table 5, the LS-FD method yields stable picking results close to the true P-wave arrival across all three noise scenarios, with only minor deviations from the manual picking results. Under the 0 dB signal-to-noise ratio condition, the picking error reaches −0.22 s, primarily caused by the blurred waveform leading edge and energy response delay at extremely low signal-to-noise ratios. At this point, the initial energy of the microseismic event is masked by strong noise, resulting in a reduced synchronization between the fractal features and the STA/LTA energy change, causing the picking point to be slightly later than the manually labeled result. However, this error magnitude is approximately 5% of the sampling duration, and in joint inversion and positioning using multiple stations, it will be averaged out. The impact on source location error is less than 1–2 m, which remains within the acceptable range for mining seismic monitoring. As the noise level decreases, the picking points become more accurate and distinct, demonstrating the robustness and reliability of the method under various SNR conditions.

5. Recognition Performance of Mine Vibration Signals

5.1. Data Source

This study is based on microseismic monitoring data from the southern mining area of the Wudong Coal Mine. The ARAMIS M/E microseismic monitoring system employed in the mine is capable of automatically collecting and filtering microseismic wave signals, thereby determining the occurrence time, released energy, and three-dimensional coordinates of microseismic events and rockbursts, as well as assessing the likelihood of rockburst occurrence and identifying hazardous zones. The system’s sensors operate at a sampling frequency of 500 Hz with a sensitivity of 110 Vs/m ± 10%. It is capable of monitoring low-frequency, high-energy microseismic events with energies greater than 100 J and frequency ranges between 0 and 150 Hz. The location accuracy is ±20 m in the X and Y directions and ±50 m in the Z direction.

5.2. Denoising Performance Analysis

The time–frequency amplitude map is a representation used to visualize the energy distribution of a signal in the time–frequency domain, illustrating the variations in amplitude or energy across different times and frequencies. In this study, the signal was segmented into several time windows, and a short-time Fourier transform (STFT) was applied to each window to obtain its frequency information. The spectrum of each window was then mapped to its corresponding position on the time–frequency plane, thereby constructing the time–frequency amplitude map. This representation was employed to compare the effectiveness of the denoising methods, to verify the preservation of signal characteristics, and to observe the extent to which noise influences the time–frequency structure of the original signal after denoising.
To scientifically evaluate the denoising performance of the CEEMDAN method and compare it with other approaches such as EMD, EEMD, and wavelet thresholding, a segment of microseismic monitoring signal with distinct characteristics was selected for analysis. The duration of the selected signal is 4.746 s. Prior to the event onset, the signal contains low-amplitude periodic white noise; after the onset, a section of relatively low-amplitude signal appears, followed by a segment of higher-amplitude signal. The original signal and its time–frequency amplitude distributions after denoising are presented in Figure 11, where (a) shows the original signal and its corresponding time–frequency amplitude map, (b) illustrates the denoising result of the EMD algorithm, (c) presents the denoising result of the CEEMDAN algorithm, (d) displays the result of the wavelet thresholding algorithm, and (e) demonstrates the denoising effect of the proposed method on the microseismic signal.
From the comparison of the time–frequency amplitude maps before and after denoising, it can be observed that the EMD algorithm retains relatively few original signal features after denoising, while the wavelet thresholding method excessively attenuates high-amplitude and high-frequency components without completely eliminating high-frequency noise. In contrast, the CEEMDAN-based denoising method achieves superior noise reduction while preserving signal characteristics to the greatest extent. To quantitatively verify the effectiveness of the CEEMDAN microseismic signal denoising method developed in this study, the signal-to-noise ratio (SNR), peak signal-to-noise ratio (PSNR), and root mean square error (RMSE) of three signal segments are used as evaluation metrics for comparing denoising effects:
R M S E   D e c l i n e = R M S E b e f o r e R M S E a f t e r R M S E b e f o r e × 100 %
Convert the SNR to the linear domain:
S N R l = 10 S N R i 10
S N R   A m p l i t u d e = S N R l 1 S N R l 2 S N R l 1 × 100 %
According to the above calculation method, compared with other denoising approaches, the proposed method achieved an RMSE reduction of up to 39.7% and an SNR improvement of 35.1%. The results are presented in Table 6.

5.3. Arrival Picking Accuracy Analysis

To evaluate the arrival picking performance of the proposed method, a set of representative microseismic signals was selected. For each signal segment, the reference P-wave arrival time was first determined by manual labeling, after which automatic picking was performed using the proposed fractal-dimension and STA/LTA fusion approach. The automatic results were then compared with the manual references to quantitatively compute the picking error. In this way, the accuracy and robustness of the method under different noise conditions can be objectively assessed.
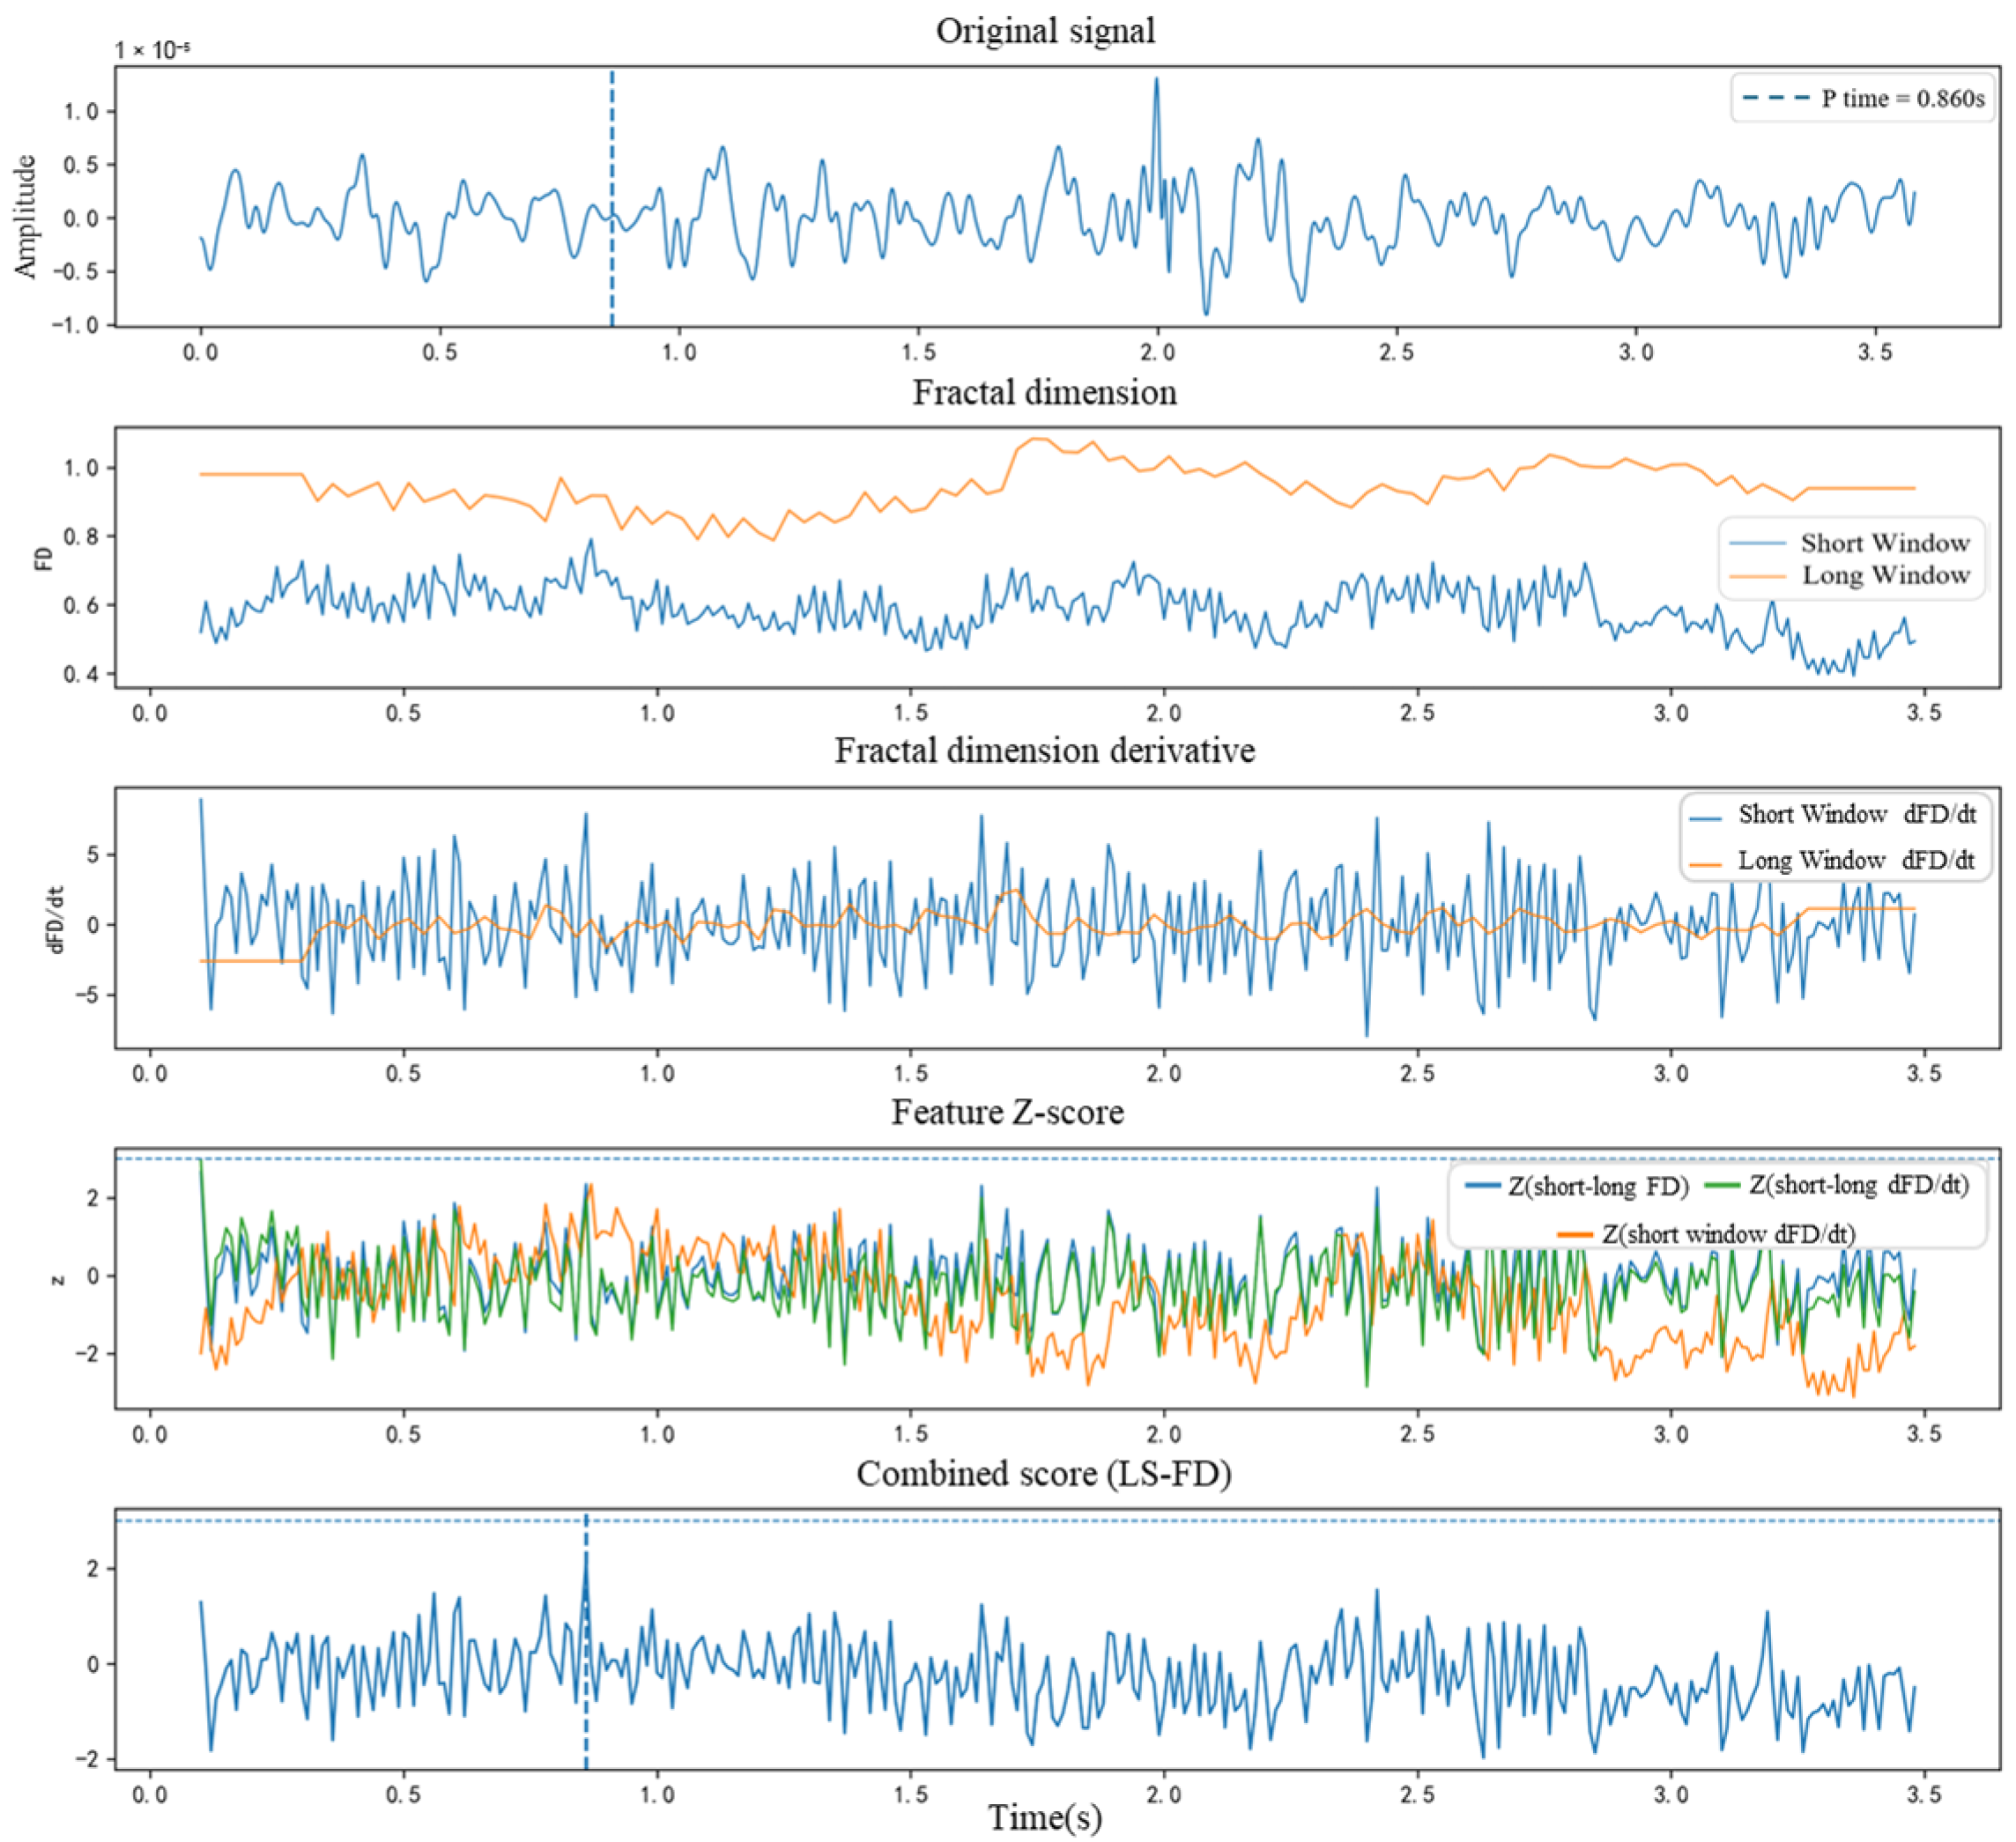
Figure 12 illustrates the picking process of a representative signal using the weighted fusion method. As shown in the figure, the original waveform exhibits a pronounced change near the P-wave onset, where the short-window fractal dimension rises sharply while the long-window fractal dimension varies more gradually. The difference between the two is markedly amplified around the onset point. Meanwhile, the derivative of the short-window fractal dimension generates a sharp peak at the arrival, whereas the long-window derivative shows a certain lag, causing their differential feature to reach a maximum at this moment. Furthermore, the Z-score–normalized feature remains near zero during the noise segment but simultaneously exceeds the significance threshold at the arrival, indicating that the signal at this time is highly anomalous relative to the noise. Ultimately, the weighted scoring function forms a unique sharp peak in the vicinity of the onset and successfully surpasses the predefined threshold, thereby enabling accurate determination of the P-wave arrival.
In this study, picking error was adopted as the primary evaluation metric to assess the performance of the proposed method.
Δ t = t a t h
t a denotes the arrival picking result obtained by the algorithm, and t h represents the manually determined arrival time. Table 7 presents a comparison of the picking results under different signal conditions. As shown in the table, the proposed method maintains an average error within ±2 sampling points (sampling rate: 500 Hz), with an average absolute error of approximately 0.002 s. These findings indicate that the method consistently achieves high picking accuracy and stability across varying noise levels.
To further quantitatively assess the performance of the proposed picking algorithm, more than 50 microseismic events were selected for each SNR level as test samples, and three evaluation metrics were calculated: mean absolute error (MAE), standard deviation (STD), and picking success rate (SR). Their definitions are as follows:
S R = N s N t × 100 %
where Ns is the number of samples where the error between the automatic picking result and the manually labeled result is less than one sampling interval ( Δ t = 2 ms), and Nt is the total number of samples. When the error | t p t h | Δ t , the picking is considered successful.
From Table 8, it can be seen that when the signal-to-noise ratio (SNR) is ≥0 dB, the mean absolute error of the proposed method remains below 2.5 ms, and the picking success rate exceeds 95%. Even in a highly noisy environment, the success rate remains above 93%, indicating that the algorithm has strong robustness to noise.
In summary, the weighted fusion method based on fractal dimension and STA/LTA can effectively identify the P-wave onset of microseismic signals under complex noise conditions. Compared with manually determined reference results, the picking outcomes of the proposed method show a high level of consistency, demonstrating strong robustness and practicality. This provides a reliable temporal benchmark for subsequent source localization and dynamic disaster analysis.

6. Conclusions

(1)
By incorporating wavelet thresholding into the CEEMDAN algorithm, an improved denoising method for microseismic signals was developed. Compared with other denoising approaches, this method achieved up to a 39.7% reduction in root mean square error (RMSE) and a 35.1% increase in signal-to-noise ratio (SNR). Application to real microseismic monitoring data and comparative analyses with EMD and other algorithms confirmed its effectiveness and superiority, and its practical use significantly enhanced the accuracy of microseismic event localization.
(2)
An automatic arrival-time picking method for microseismic signals was proposed, based on energy–complexity coupling. Motivated by the mechanism of “energy surge + complexity transition” at the P-wave onset, the method fuses STA/LTA energy criteria with fractal-dimension (FD) features in a unified anomaly-measurement space. The constructed scoring function, based on FD derivatives, FD differences, and STA/LTA ratios with Z-score normalization, achieved a mean absolute error (MAE) of 2.5 ms and an average sampling point error of 1.25 points. The scoring curve exhibited a unique sharp peak at the arrival, ensuring stable and precise localization, thereby demonstrating the superiority of the proposed automatic picking approach.
(3)
The method demonstrates superior robustness under conditions of low SNR, spectral overlap, and non-stationary noise. Under low, medium, and high noise levels, the SNRs were improved to 6.77 dB, 8.05 dB, and 11.9 dB, respectively. Compared with STA/LTA, which relies solely on energy ratios, or FD-based approaches, which depend only on complexity, the proposed method maintains stable triggering even when noise energy is comparable to or greater than event energy, or when background signals exhibit slow drifts. This substantially reduces the risk of false triggers and missed detections.
(4)
The proposed energy–complexity coupling–based automatic arrival-time picking method for mine microseismic signals represents an exploratory practice tailored to microseismic data processing in mining applications. Its effectiveness and feasibility have been verified under specific scenarios. However, its generalization performance and adaptive parameter configuration for microseismic data from different mining areas with varying geological conditions and station layouts—particularly in complex environments involving non-stationary strong noise, spectral overlap, and multi-channel array collaboration—still require further in-depth evaluation and refinement in future research.

Author Contributions

Conceptualization, H.X. and K.L.; methodology, X.W. and S.Z.; software, K.L. and Z.W.; validation, P.S. and C.L.; formal analysis, K.L. and X.W.; investigation, H.X. and Z.Y.; resources, L.W.; data curation, H.W. and K.L.; writing—original draft preparation, H.X., K.L. and X.W.; writing—review and editing, P.S. and S.Z.; supervision, P.S.; project administration, H.X.; funding acquisition, P.S. and H.X. All authors have read and agreed to the published version of the manuscript.

Funding

This research was funded by the Deep Earth Probe and Mineral Resources Exploration-National Science and Technology Major Project (No. 2024ZD1004503)—Ministry of Natural Resources, the National Natural Science Foundation of China (No. 52404142, 52574162)—National Natural Science Foundation of China, Yulin Science and Technology Plan Project (No. 2024-CXY-163)—Yulin Municipal Science and Technology Bureau and the China Postdoctoral Science Foundation (No. 2025T180506)—China Postdoctoral Science Foundation.

Data Availability Statement

Data will be made available on request.

Conflicts of Interest

Authors Xuefei Wu, Zeyang Wang and Chenguang Liu were employed by the company China Coal Technology & Engineering Group Xi’an Research Institute Co., Ltd. Authors Zhongming Yan and Liang Wu were employed by the company Shaanxi Binchang Mining Group Co., Ltd. The remaining authors declare that the research was conducted in the absence of any commercial or financial relationships that could be construed as a potential conflict of interest.

References

  1. Song, X.; Geng, D.; Gao, W.; Rao, T.; He, J. Damage Effects of Acidic Chemical Solution on the Mechanical Properties and Parameters of Granite. China Saf. Sci. Technol. 2025, 21, 159–167. [Google Scholar]
  2. Sun, W.; Wang, Z.; Li, Q.; Wang, W.; Cao, P.; Xu, H. Multiple synergistic control technology of rock burst disasters in deep hard roof working faces. Chin. J. Rock Mech. Eng. 2024, 43, 1736–1750. [Google Scholar]
  3. Wu, K.; Zou, J.; Jiao, Y.; Hu, X. Study on the internal relationship of source parameters and focal mechanism of strong mine tremors in deep coal mines. Chin. J. Rock Mech. Eng. 2023, 42, 2540–2551. [Google Scholar]
  4. Cui, F.; Zhang, S.; Lai, X.; Chen, J.; Jia, C.; Feng, G.; Sun, J. Coal and rock mass linkage induced impact mechanism and prevention andcontrol rock burst in steeply-inclined and extremely-thick coal seam group. Chin. J. Rock Mech. Eng. 2023, 42, 3226–3241. [Google Scholar]
  5. Li, H.; Li, X.; Tan, X.; Zhang, Y.; Liu, T. An Accurate Seismic Detection Method Based on Improved STA/LTA. Sci. Technol. Eng. 2024, 24, 10165–10173. [Google Scholar]
  6. Li, T.; Chen, B.; Zhu, X.; Wang, X.; Xie, M. Research on the objective function of microseismic source location andits adaptive recognition algorithm. Chin. J. Rock Mech. Eng. 2021, 40, 3137–3146. [Google Scholar]
  7. Ma, C.; Yan, W.; Xu, W.; Li, T.; Ran, X.; Wan, J.; Tong, K.; Lin, Y. Parallel Processing Method for Microseismic Signal Based on Deep Neural Network. Remote Sens. 2023, 15, 1215. [Google Scholar] [CrossRef]
  8. Zhang, X.; Li, H.; Rong, W. Reliable Denoising Strategy to Enhance the Accuracy of Arrival Time Picking of Noisy Microseismic Recordings. Sensors 2023, 23, 9421. [Google Scholar] [CrossRef]
  9. Zhang, Z.; Ye, Y.; Luo, B.; Chen, G.; Wu, M. Investigation of microseismic signal denoising using an improved wavelet adaptive thresholding method. Sci. Rep. 2022, 12, 22186. [Google Scholar] [CrossRef]
  10. Yao, Y.; Wang, G.; Liu, L. Microseismic signal denoising using simple bandpass filtering based on normal time–frequency transform. Acta Geophys. 2023, 71, 2217–2232. [Google Scholar] [CrossRef]
  11. Li, X.; Feng, S.; Guo, Y.; Li, H.; Zhou, Y. Denoising Method for Microseismic Signals with Convolutional Neural Network Based on Transfer Learning. Int. J. Comput. Intell. Syst. 2023, 16, 91. [Google Scholar] [CrossRef]
  12. Fernando, L.; Rubén, L.; Román, L.; Alexis, F.; Mario, R. Detection of volcanic microearthquakes based on homomorphic deconvolution and STA/LTA. J. Volcanol. Geotherm. Res. 2022, 421, 107458. [Google Scholar]
  13. Gao, L.; Wang, E.; Mou, X.; Zhu, Y.; Li, Q. A Vibration Monitoring Technology for Construction Based on the STA/LTA Algorithm. China Sci. Technol. Inf. 2024, 73–75. Available online: https://xxjk.cbpt.cnki.net/portal/journal/portal/client/paper/3c227ff375d72f7e52ed6896bdfc27bc (accessed on 17 September 2025).
  14. Yin, D.; Chen, Y.; Yang, Y.; Cheng, Y.; Zhang, C. Research on Interference Signal Recognition in P Wave Pickup and Magnitude Estimation. Geotech. Geol. Eng. 2024, 42, 1835–1848. [Google Scholar] [CrossRef]
  15. Edigbue, P.; Al-Shuhail, A.; Muhammad, A.; Hanafy, S. Seismic Event Detection and First Arrival Picking Using Continuous Wavelet Transform and Machine Learning Techniques. Arab. J. Sci. Eng. 2025. [Google Scholar] [CrossRef]
  16. Jin, S.; Zhang, S.; Gao, Y.; Yu, B.; Zhen, S. Microseismic Event Recognition and Transfer Learning Based on Convolutional Neural Network and Attention Mechanisms. Appl. Geophys. 2024. [Google Scholar] [CrossRef]
  17. Zhao, H.; Liu, R.; Gu, T.; Liu, Y.; Jiang, D. Study on Automatic P-Wave Picking of Microseismic Signals Based on Deep Learning Patterns. Chin. J. Rock Mech. Eng. 2021, 40, 3084–3097. [Google Scholar]
  18. Zhang, L.; Wang, M.; Zhang, B.; Xi, X.; Zhang, Y.; Cai, M.; Pan, J. Damage Mechanism of Coal Samples under the Coupling Effect of Sulfate Erosion and Wet-Dry Cycles: Experiments, Constitutive Models, and Numerical Simulations. Phys. Fluids 2025, 37, 073103. [Google Scholar] [CrossRef]
  19. Zhang, L.; Ning, Z.; Miao, S.; Feng, Z.; Sun, J.; Cai, M.; Xi, X. Experimental and Numerical Investigations on the Mixed-Mode Fracture of Granite under Offset Three-Point Bending Loads. Rock Mech. Rock Eng. 2025, in press. [Google Scholar] [CrossRef]
  20. Dai, L.; Zhao, X.; Pan, Y.; Luo, H.; Gao, Y.; Wang, A.; Ding, L.; Li, P. Microseismic Criterion for Dynamic Risk Assessment and Warning of Roadway Rockburst Induced by Coal Mine Seismicity. Eng. Geol. 2025, 357, 108324. [Google Scholar] [CrossRef]
  21. Xu, H.; Lai, X.; Shan, P.; Yang, Y.; Zhang, S.; Yan, B.; Zhang, Y.; Zhang, N. Energy Dissipation Characteristics and Shock Mechanism of Coal–Rock Mass Induced in Steeply-Inclined Mining: Comparison Based on Physical Simulation and Numerical Calculation. Acta Geotech. 2022, 18, 843–864. [Google Scholar] [CrossRef]
  22. Lin, T.; Cheng, J.; Chen, Q. Arrival Time Picking Based on Wavelet Transform and Fuzzy Clustering. In Proceedings of the 2023 China Geoscience Union Annual Meeting—Session XIII UAV Geophysical Technology & Session XIV Advances in AI and Geophysical Information Technology, Zhuhai, China, 14–17 October 2023; Taiyuan University of Technology: Taiyuan, China, 2023; pp. 57–60. [Google Scholar]
  23. Li, H.; Li, X.; Zhang, Y.; Liu, J.; Liu, T.; Tan, X. Review of the Application of STA/LTA Algorithm in Seismic Signal Detection and First-Arrival Picking. In National Security Geophysics Series (19)—Artificial Intelligence and Geophysics; Rocket Force University of Engineering: Xi’an, China, 2023; pp. 179–187. [Google Scholar]
  24. Li, Q.; Han, L.; Shang, X.; Zhao, B. Microseismic Location under Low SNR Conditions Based on Deep Learning. In Proceedings of the 2024 China Geoscience Union Annual Meeting—Session XIII AI in Geophysics & Session XIV Intelligent Exploration and Smart Oilfield Technologies, Taiwan, China, 8 June 2024; Jilin University: Changchun, China, 2024; pp. 31–32. [Google Scholar]
  25. Rao, D.; Huang, M.; Shi, X.; Yu, Z.; He, Z. A Microseismic Signal Denoising Algorithm Combining VMD and Wavelet Threshold Denoising Optimized by BWOA. CMES Comput. Model. Eng. Sci. 2024, 141, 187–217. [Google Scholar] [CrossRef]
  26. Shang, X.; Chen, Y.; Chen, J.; Chen, L.; Pu, Y. Mine Microseismic Signal Denoising Method and Application Based on Adaboost-LSTM Prediction. J. China Coal Soc. 2024, 49, 4406–4416. [Google Scholar]
  27. Choi, S.; Lee, B.; Kim, J.; Jung, H. Deep-Learning-Based Seismic-Signal P-Wave First-Arrival Picking Detection Using Spectrogram Images. Electronics 2024, 13, 229. [Google Scholar] [CrossRef]
  28. Cao, A.; Li, M.; Yang, X.; Yang, Y.; Li, S.; Liu, Y.; Wang, C. Construction and Application of a Fundamental Model for Intelligent Microseismic Processing in Mines. J. China Coal Soc. 2025, 50, 2823–2836. [Google Scholar]
  29. Cao, A.; Yang, X.; Wang, C.; Li, S.; Liu, Y.; Dou, L.; Niu, Q. Accurate Picking and Automatic Location Strategy of Mine Microseismic P-Waves Based on Deep Transfer Learning. J. China Coal Soc. 2023, 48, 4393–4405. [Google Scholar]
  30. Gu, X.; Zhang, C.; Guo, W.; Zhang, Y.; Gong, X.; Wang, C.; Zhao, X.; Zhang, L. Study on Typical Microseismic Signal Characteristics and Identification in Rockburst Mines. J. China Coal Soc. 2024, 49, 694–713. [Google Scholar]
  31. Zhang, S.; Lai, X.; Cao, J.; Xu, H.; Zhang, Y.; Yan, B.; Ji, S. Theoretical analyses of surrounding rock stress of a non-circular tunnel considering the horizontal inclination of initial principal stress field. Tunn. Undergr. Space Technol. 2026, 167, 106994. [Google Scholar] [CrossRef]
Figure 1. Workflow of the CEEMDAN algorithm.
Fractalfract 09 00679 g001
Figure 2. Flowchart of the CEEMDAN Denoising Method Improved with Wavelet Thresholding.
Fractalfract 09 00679 g002
Figure 3. Short-Term and Long-Term Average Energy Curves.
Fractalfract 09 00679 g003
Figure 4. Signal Representation at Different Box Scales.
Fractalfract 09 00679 g004
Figure 5. Variation curves of fractal dimension in short and long windows.
Fractalfract 09 00679 g005
Figure 6. Workflow of the Fractal–STA/LTA Weighted Fusion P-Wave Arrival Picking Algorithm.
Fractalfract 09 00679 g006
Figure 7. Signals under different signal-to-noise ratios.
Fractalfract 09 00679 g007
Figure 8. Noise suppression results under different SNR conditions. (a) Denoised signal at 0 dB; (b) Denoised signal at 10 dB; (c) Denoised signal at 20 dB.
Fractalfract 09 00679 g008
Figure 9. Manual arrival picking of the original signal.
Fractalfract 09 00679 g009
Figure 10. Arrival picking results under different SNRs. (a) Arrival picking result at low SNR; (b) Arrival picking result at medium SNR; (c) Arrival picking result at high SNR.
Fractalfract 09 00679 g010
Figure 11. Comparison of signal denoising effects. (a1) Original signal; (a2) Time-frequency amplitude diagram of the original signal; (b1) Signal after denoising by EMD algorithm; (b2) Time-frequency amplitude diagram after EMD algorithm denoising; (c1) Signal after denoising by CEEMDAN algorithm; (c2) Time-frequency amplitude diagram after denoising by CEEMDAN algorithm; (d1) Signal after denoising using wavelet threshold algorithm; (d2) Time-frequency amplitude after denoising using wavelet threshold algorithm; (e1) The signal after denoising by this algorithm; (e2) The time-frequency amplitude after denoising by this algorithm.
Fractalfract 09 00679 g011
Figure 12. P-wave arrival picking process.
Fractalfract 09 00679 g012
Table 1. Commonly Used Wavelet Basis Functions.
Wavelet BasisRepresentationOrthogonalityBiorthogonalityCompactnessSymmetrySupport Length
HaarhaarYesYesYesSymmetric1
DaubechiesdbNYesYesYesAsymmetry2N − 1
BiorthogonalbiorNr.NdNoYesYesAsymmetry2Nr + 12Nd + 1
CoifletscoifNYesYesYesNear-Sym
Symmetric
6N − 1
MeyermeyrYesYesNoSymmetricFinite Length
MorletmorlNoNoNoSymmetricFinite Length
Mexican HatmexhNoNoNoSymmetricFinite Length
Table 2. Evaluation Metrics for Denoising Performance.
Wavelet BasisRMSESNR
haar4.477814.4535
db34.931411.8814
db63.394517.7334
db92.918519.8651
biorN3.N73.692914.7628
biorN5.N54.296312.6911
Table 3. Software Environment and Dependencies.
Component/LibraryVersionFunction
Python3.8.1Runtime Environment
NumPy1.26Runtime Environment
SciPy1.11Numerical Computation
PyEMD0.5Signal Processing
PyWavelets1.4CEEMDAN Decomposition
ObsPy1.4Wavelet Thresholding Denoising
Matplotlib3.8STA/LTA Energy Ratio
OSWindows 11Plotting
PythonIntel i7Operating System
Hardware3.8.1Computing Platform
Table 4. Noise suppression performance under different SNRs.
Noise LevelOriginal SNR (dB)Processed SNR (dB) Δ S N R (dB)
Low06.776.77
Medium108.0518.05
High2011.9031.90
Table 5. Comparison of picking results.
Manual Picking Time (s)SNR (dB)Picking Time (s)Picking Error (s)
1.0800.86−0.22
101.270.19
200.96−0.12
Table 6. Calculation results of denoising evaluation metrics.
AlgorithmRMSESNR
EMD4.78159.8163
EEMD3.695411.4881
CEEMDAN3.286112.2356
Wavelet thresholding3.36598.7612
Proposed method2.749313.6238
Table 7. Comparison of P-wave arrival picking results using different methods.
Signal ID t h t a Δ t Sampling Point Error
10.9600.9620.0021
21.2701.268−0.002−1
30.8600.8640.0042
43.4703.468−0.0021
Table 8. Success Rate at Different SNRs.
SNR(db)MAE(ms)STD(ms)SR
101.820.9398.1
52.061.0896.9
02.341.3695.4
−53.271.8193.2
−104.122.2590.7
Disclaimer/Publisher’s Note: The statements, opinions and data contained in all publications are solely those of the individual author(s) and contributor(s) and not of MDPI and/or the editor(s). MDPI and/or the editor(s) disclaim responsibility for any injury to people or property resulting from any ideas, methods, instructions or products referred to in the content.