Article

Quantitative Characterization of Fractals and Curvatures in Complex Geological Structures of Wugou Coal Mine, Huaibei Coalfield

1
Key Laboratory of Coalbed Methane Resources and Reservoir Formation Process, Ministry of Education, China University of Mining and Technology, Xuzhou 221008, China
2
School of Resources and Earth Science, China University of Mining and Technology, Xuzhou 221116, China
*
Author to whom correspondence should be addressed.
Fractal Fract. 2025, 9(10), 669; https://doi.org/10.3390/fractalfract9100669
Submission received: 21 September 2025 / Revised: 14 October 2025 / Accepted: 15 October 2025 / Published: 17 October 2025
(This article belongs to the Special Issue Multiscale Fractal Analysis in Unconventional Reservoirs)

Abstract

The complexity of geological structures significantly impacts both mining production efficiency and operational safety, making its quantitative assessment a core issue in ensuring coal’s safe production and coalbed methane development. Focusing on the Wugou Coal Mine in Anhui Province, which exhibits multi-phase tectonic superposition, modification, and relatively complex structural characteristics, this study integrates stereographic projection analysis, fractal theory, and multiple structural curvature methods to quantitatively characterize structural types and evaluate complexity. The results show that the Wugou Coal Mine has undergone four main stages of tectonic deformation since the formation of the coal seam. The superposition and modification of tectonic events of different periods and properties have led to a complex structural pattern. The fractal dimension effectively characterizes the development degree and distribution density of faults. Structural curvature not only intuitively reflects the deformation extent of fold bending and fault separation, but also provides valuable insights into the structural types, structural positions, and the characteristics of superimposed folds. By combining the strengths of fractal analysis and curvature characterization, a fractal-curvature integrated evaluation model was developed to assess structural complexity. This model facilitates a high-resolution quantitative evaluation, delineating the geological structures of the Wugou Coal Mine into zones of extremely complex, complex, moderately complex, and simple structures. The findings not only provide accurate geological guidance for mine design and hazard prevention but also offer a quantitative evaluation methodology for the optimal selection of favorable areas for coalbed methane development.

1. Introduction

Coal is the most economical and reliable energy source among various energy types. Among the many geological conditions affecting safe coal mining, mining geological structures are extremely important controlling factors. These structures control the shape, spatial distribution, and continuity of coal seams. Coal seams contain abundant coalbed methane (CBM), a vital source of unconventional clean energy [1,2]. Over the past two decades, a growing number of studies have highlighted the strong influence of local geological structures on the distribution and accumulation of CBM [3,4]. Generally, gas content in coal seams varies significantly across different structural settings: it is highest in the cores of anticlines, followed by the anticlinal flanks, synclinal flanks, and synclinal cores, with intermediate values in areas between fault zones and the lowest concentrations near fault zones themselves [5,6]. Geological structures from different periods and of different types, as well as their combinations, have varying effects on mine gas and hydrogeological conditions [7,8,9,10,11]. Research on the characteristics and evolution of mine structures is directly related to coal and CBM exploration, development, and safe production [12,13,14,15,16,17].
Evaluating geological structure complexity is a complex and comprehensive task. In recent years, domestic and international scholars have conducted extensive research on this scientific issue and proposed various evaluation methods [18,19]. Mathematical statistics methods have been one of the most commonly used approaches in structural research in recent decades. Based on traditional studies of structural patterns, these methods use quantitative indicators, modern mathematical techniques, and computer tools to quantitatively evaluate the structural complexity of different sections within a mine [20,21,22,23]. Determining appropriate quantitative indicators is a major challenge currently faced. Fault structures can be evaluated using many indicators, such as fault density, fault length, fault throw, fault nature, fault intensity, and fault fractal dimension [8].
Self-similarity phenomena are common in geological structures, where micro-fractures, joints, and faults exhibit statistical self-similarity in their geometric, kinematic, and dynamic characteristics. This reflects the application of fractal theory in structural studies and establishes it as a key method for quantitatively evaluating mining-induced structural complexity. Many researchers have employed fractal theory to analyze faults, including their geometric characteristics, strength, frictional forces, fracture energy, and paleostress fields [24,25,26,27,28,29]. Additionally, some scholars have utilized fractals to assess fault complexity and water productivity [23]. Integrating pores and fractures, fractal theory has also been applied in reservoir evaluation. Zhang et al. established a coalbed methane seepage model based on the fractal characteristics of fracture-pore structures [30]. Liu et al. investigated the pore structure and fractal characteristics of the Nenjiang shale in the Songliao Basin, northeastern China [31].
Structural curvature refers to the degree of bending of strata or rocks under tectonic stress, reflecting the geometric characteristics of crustal deformation. Curvature analysis of structural surfaces can not only intuitively reflect the bending deformation of folds but also effectively indicate fold morphology, superimposed modification characteristics, and the degree of fault-related deformation [32,33]. As an important method for characterizing structural complexity, structural curvature is widely used in evaluating tectonic deformation in fossil energy basins and predicting fractured high-permeability zones [34]. Guo et al. used structural curvature to classify the degree of coal deformation in the Hancheng mining area, identifying zones with the strongest deformation and using this to classify coalbed methane accumulation conditions [35]. Zhou et al. combined fault fractal dimension and structural curvature to quantitatively evaluate the structural complexity of the Yangmeishu syncline, providing recommendations for coalbed methane development [36]. Liu et al. utilized the curvature of reservoir microstructures to investigate the distribution and prediction of structural fractures in igneous reservoirs [37].
Fractal theory is widely used in evaluating structural complexity; however, in areas with complex geological structures, fault complexity assessments based on fractal theory are often influenced and constrained by the stage of exploration and the extent of mine exposure. In blocks with detailed exploration and high levels of exposure, fault development tends to be relatively dense, whereas in areas with lower exploration precision, fault distribution appears sparser. Conducting fractal dimension evaluation under such conditions may introduce significant human-induced errors. The combination of fractal theory and curvature analysis can not only intuitively reflect the deformation intensity associated with fold bending and fault displacement but also provide valuable insights into fold morphology, superposition, modification characteristics, and fault structural locations. Therefore, this study investigates the Wugou Coal Mine in Anhui Province, which is characterized by intense structural deformation, complex geometry, and strong heterogeneity in distribution. The complex geological structure of Wugou Coal Mine hinders the development of its abundant coal and coalbed methane resources. Based on research into the characteristics and formation processes of geological structures, we comprehensively applied fractal theory and multiple structural curvature methods to quantitatively characterize different types of mine structures and further evaluate the complexity of the mine structure. This approach not only provides theoretical and technical support for safe and efficient production at the Wugou Coal Mine but also plays a critical role in the evaluation of CBM favorable areas. It offers an effective and feasible methodology and technical workflow for studying mine structures in complex tectonic regions.

2. Research and Computational Methods

The Wugou Coal Mine is located in northern Anhui Province, China, in the central-western part of the Huaibei Coalfield (Figure 1). The geological data are obtained from the surface borehole drilling, 3D seismic exploration, and exposures of 34 underground working faces, including data on coal seam floor elevation, folds, and faults. The fold structures were identified and their axial traces were determined using the contour map of the main coal seam floor. The attitudes of different parts of the folds were calculated and analyzed through stereographic projection. Further studies were conducted on the deformation characteristics, combination patterns, and superposition relationships of folds from different directions and periods. Analysis of fault structures included their deformation features, distribution patterns, combination laws, and quantitative statistics, aiming to clarify the development characteristics, combination patterns, superposition and modification modes, as well as vertical differentiation and planar zoning of deformation in the Wugou Coal Mine. Given the structural characteristics of the Wugou Coal Mine, an integrated evaluation method combining fault fractal dimension and fold curvature was applied to quantitatively characterize the structural types. The computational methods for fractal dimension and structural curvature are described as follows:

2.1. Fractal Dimension and Calculation

The measure of a fractal is termed the fractal dimension, which encompasses various types such as information dimension, capacity dimension, similarity dimension, and correlation dimension. Among these, the capacity dimension is particularly practical for applications in fault-related fractal studies [8]. For fracture networks, the grid coverage method (box-counting method) is well-suited for calculating fractal dimension values. The procedure involves covering the fault trace map with a grid of side length ε, counting the number of grid cells N(ε) that contain fault traces, and iteratively reducing the grid size to εi to obtain the corresponding N(εi). In the lnε-lnN(ε) coordinate system, a curve is generated, and the negative slope of its linear segment represents the capacity dimension Dk of the fracture system. The grid coverage method is one of the most direct and commonly used approaches.
The specific steps are as follows:
(1)
Define the study object: Based on the contour map of the No. 10 coal seam floor, update the fault-coal intersection lines and fault trace maps using the latest exploration research results to clarify the fault development range for calculating the fractal capacity dimension.
(2)
Set the initial scale: Select an appropriate initial grid size ε (i.e., the side length of each grid cell) as the starting point. This scale should be chosen according to the size and complexity of the study object to ensure full coverage and capture of detailed features. The analysis target in this study exhibits a highly complex fractal structure, requiring finer grid sizes to ensure sufficient resolution and evaluation accuracy. However, finer grids significantly increase computational workload exponentially.
(3)
Overlay the grid: Cover the fault–coal intersection lines and fault traces with a square grid of side length ε. Ensure the grid fully covers the study object and that its boundaries align appropriately with the extent of the structures.
(4)
Count the number of boxes: Count the number of grid cells (boxes) N(ε) that contain any part of the fractal pattern.
(5)
Change the scale and repeat: Gradually reduce the grid size (i.e., increase the grid density) and repeat the steps above (re-cover the object and count the number of boxes). By varying the scale multiple times and collecting data, a series of N(ε) values corresponding to different scales can be obtained.
(6)
Calculate the fractal dimension: Finally, use Formula (1) to calculate the fractal dimension Dk, which is the target capacity dimension. Since it is practically impossible to take ε to zero, Dk is typically estimated by observing four gradually reduced values of ε and their corresponding N(ε) values, plotting lnN(ε) against lnε, and estimating the slope of the linear fit. The negative of this slope provides an approximate value of Dk.
D k ( F ) = lim ε 0 ln N ( ε ) ln ( 1 / ε ) = lim ε 0 ln N ( ε ) ln ε
(7)
Validate the results: The calculated results must be verified and evaluated. Reliability can be assessed by examining whether data points at different scales closely align with the fitted straight line. Comparison with results from other methods can also help confirm the accuracy of the fractal dimension.
For the practical calculation of the fractal capacity dimension, the scale effect must be considered: larger grid sizes provide broader spatial coverage but reduced representativeness, while excessively small grid sizes result in fewer faults per unit and a consequently lower fractal dimension. The calculation in this study was based on fault-coal intersection lines and fault traces from the contour map of the No. 10 coal seam floor in the Wugou Coal Mine. Given that the general minimum fault spacing in the mining area is 100 m, a 100 m × 100 m grid was selected as the smallest analytical unit. Structural assessment was conducted using 400 m × 400 m grid cells, totaling 128 evaluation units (Figure 2). The study area was progressively divided into a four-level grid system with cell sizes of 400 m × 400 m, 200 m × 200 m, 133.33 m × 133.33 m, and 100 m × 100 m. This hierarchical division allowed the representation of fractal characteristics down to the smallest analytical unit. Finally, the number of grids containing fault traces within each unit was counted.
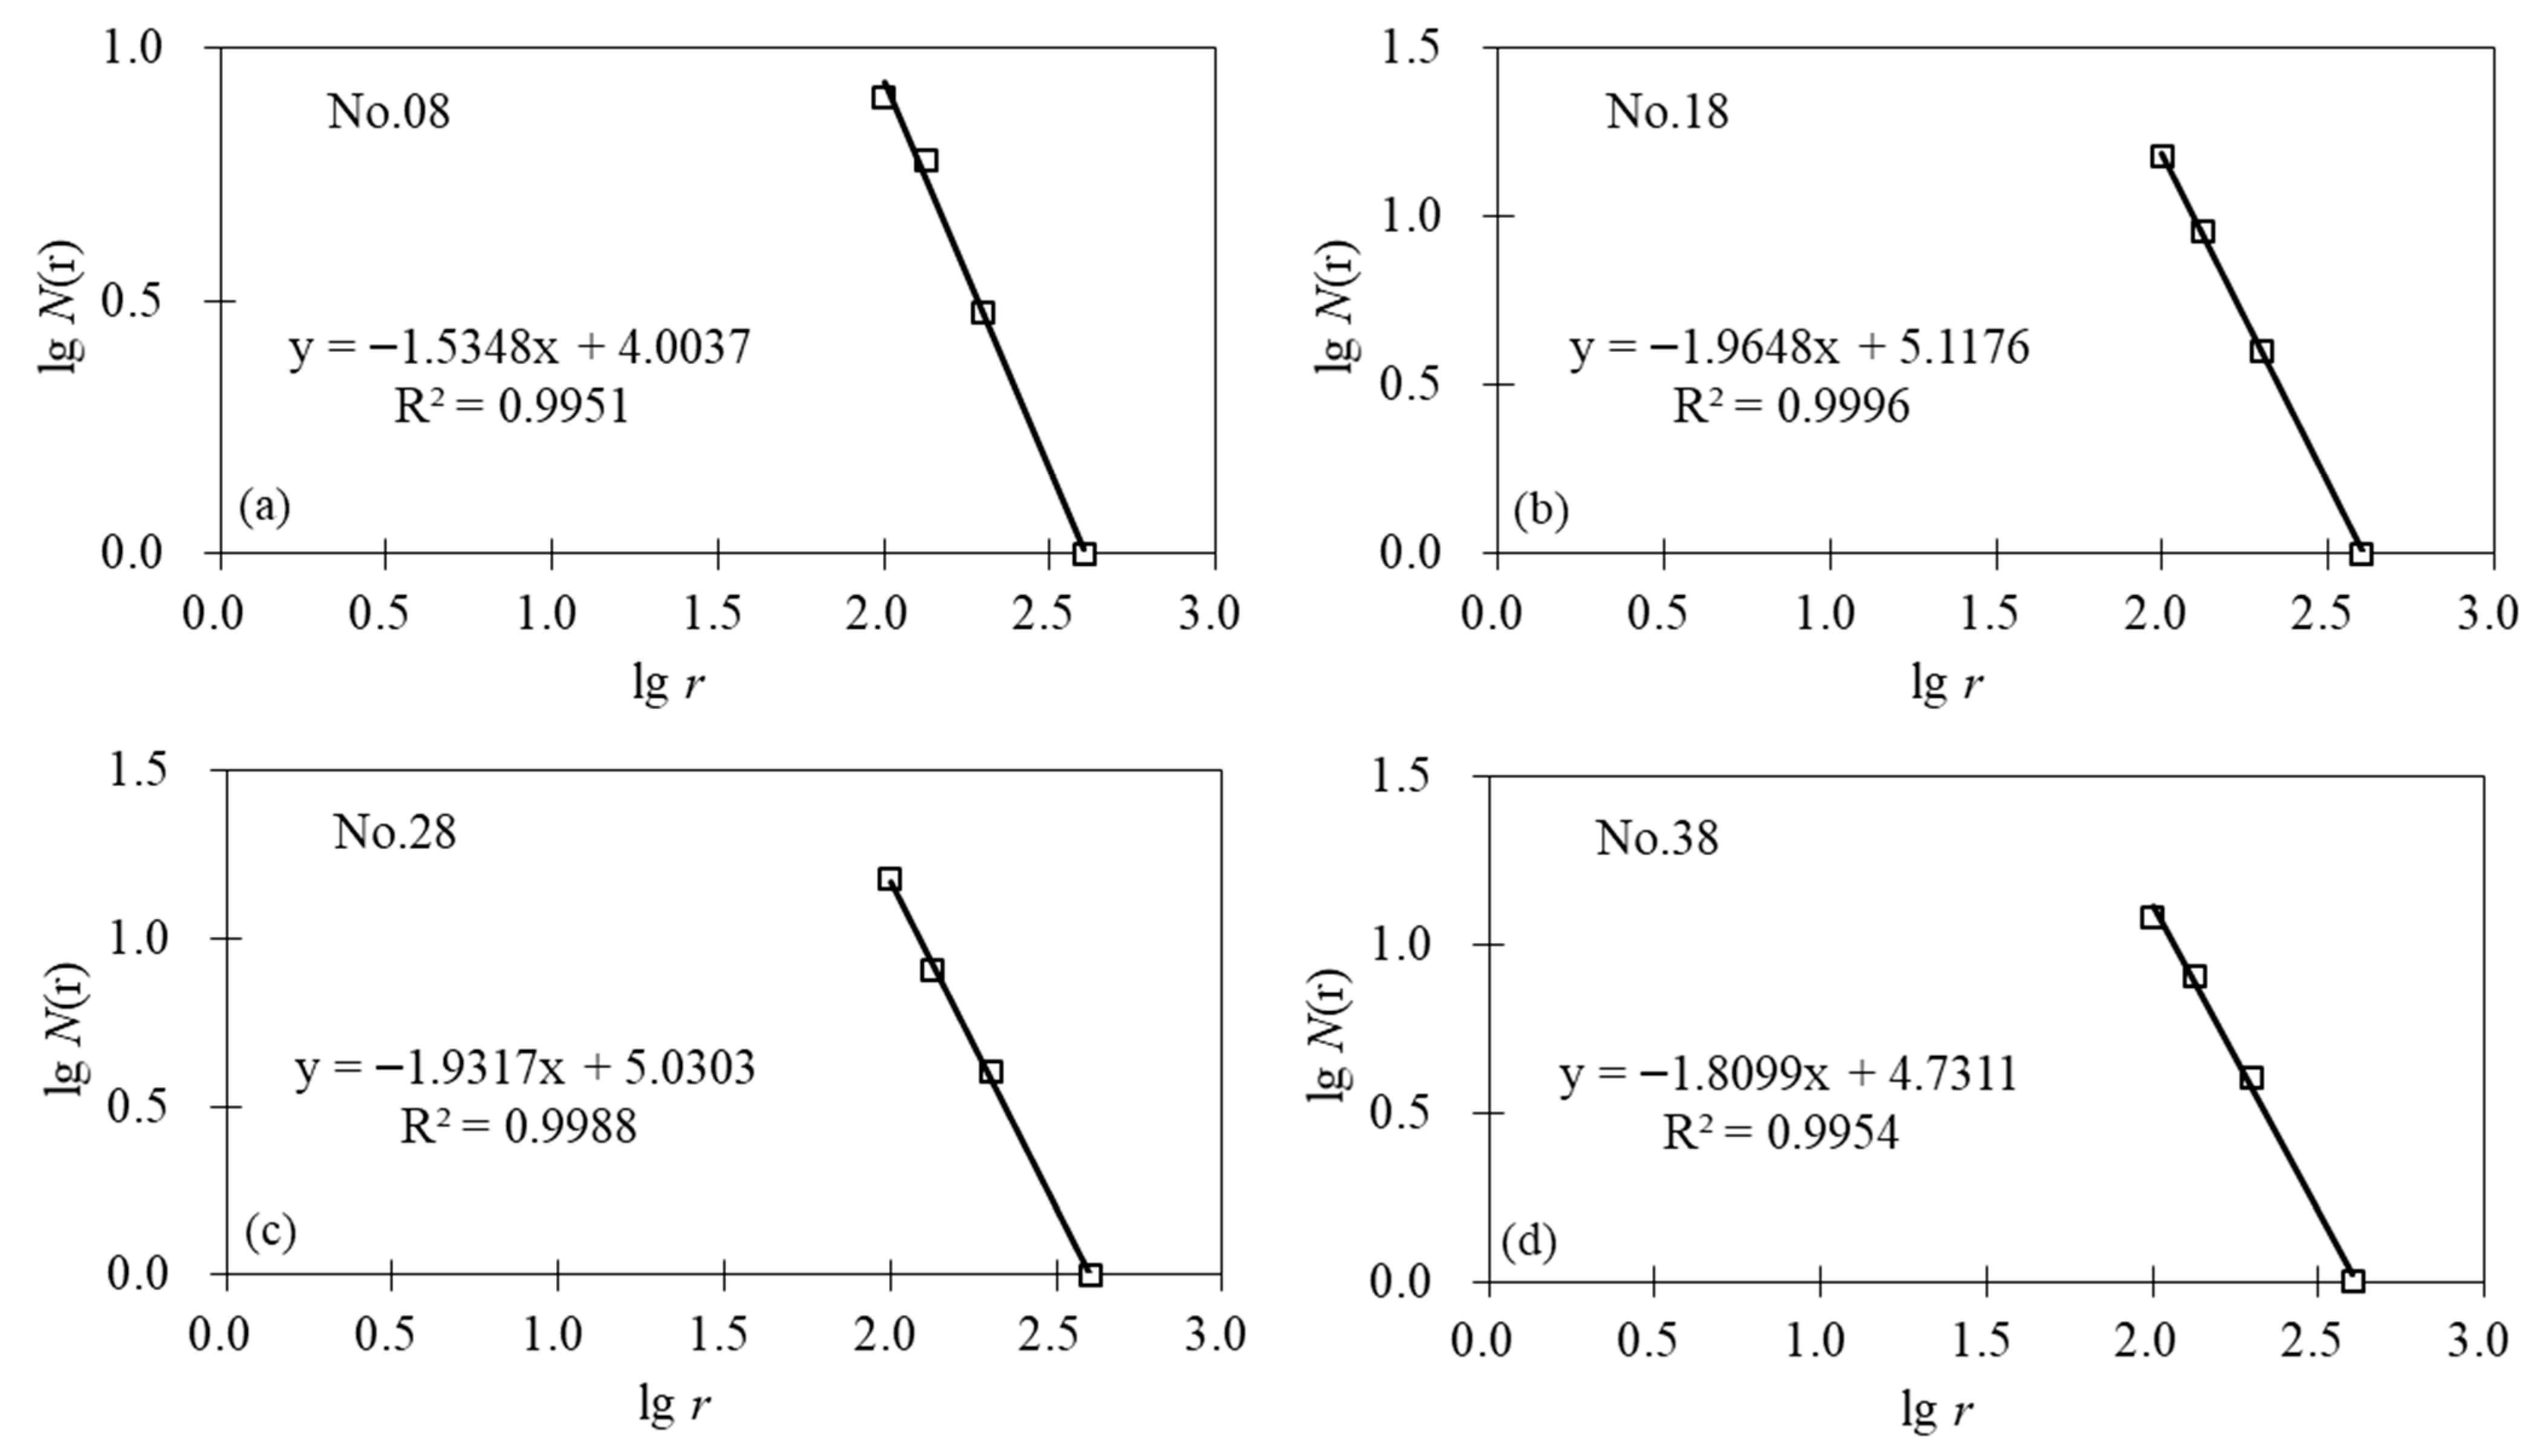
Analysis of the double logarithmic linear regression results indicates a strong linear correlation in the unit data of the fault network distribution. The negative slope of the fitted straight line corresponds to the capacity dimension value of the fault system within the unit (Figure 3). Using this method, the capacity dimension values of all 128 evaluation units were calculated sequentially (Table 1). These values represent the dimension at the center of each unit, quantitatively reflecting the complexity of the fracture network. Based on the capacity dimension values and coordinates of each unit’s center point, Surfer 8 software was employed to generate a planar map of the fault capacity dimension. Kriging interpolation was applied to enhance data density, resulting in the final planar distribution map of fault capacity dimension.

2.2. Calculation Method of Structural Curvature

Curvature is a quantitative parameter that measures the degree of bending of a curve or surface at a given point. It provides a mathematical description of the geometry of geological structures and serves as a tool for integrating coal seam morphology with mechanical analysis. By quantifying variations in the undulation of different parts of a coal seam, curvature intuitively reflects both local and overall deformation and relief of the seam. The development of fold and fault structures controls the undulation and continuity of coal seams; therefore, curvature can be used to quantitatively evaluate the complexity of mine structures. Curvature is closely related to the second derivative of the curve y = f(x), and its differential expression is given by:
K = d 2 y d x 2 [ 1 + ( d y d x ) 2 ] 3 2
Based on the fundamental concept of curvature, it can be categorized into principal curvature, mean curvature, and Gaussian curvature [39]. Previous researchers employed the maximum principal curvature method, Mohr circle method, Gaussian curvature method, and mesh subdivision method to calculate curvature [32,34,35]. This study adopts Roberts’ curvature calculation method, which involves gridding the coal seam floor contour lines and partitioning them at small intervals [39]. For each calculation point, the eight surrounding grid points within the smallest square centered on the point are selected, and the coal seam floor elevations of these points are fitted using the least squares method.
z = a x 2 + b y 2 + c x y + d x + e y + f
a = 1 2 2 z x 2 = z 1 + z 3 + z 4 + z 6 + z 7 + z 9 12 Δ x 2 z 2 + z 5 + z 8 6 Δ x 2
b = 1 2 2 z y 2 = z 1 + z 2 + z 3 + z 7 + z 8 + z 9 12 Δ x 2 z 4 + z 5 + z 6 6 Δ x 2
c = 2 z x y = z 3 + z 7 z 1 z 9 4 Δ x 2
d = z x = z 3 + z 6 + z 9 z 1 z 4 z 7 6 Δ x
e = z y = z 1 + z 2 + z 3 z 7 z 8 z 9 6 Δ x
f = 2 z 2 + z 4 + z 6 + z 8 z 1 + z 3 + z 7 + z 9 + 5 z 5 9
z1, …, z9: represent the elevations of the coal seam floor at each point; Δx is the distance between adjacent points. From these parameters, the mean curvature Kmean and Gaussian curvature Kg can be calculated.
Mean Curvature:
K m = a ( 1 + e 2 ) + b ( 1 + d 2 ) c d e ( 1 + d 2 + e 2 ) 3 / 2
Gaussian curvature:
K g = 4 a b c 2 ( 1 + d 2 + e 2 ) 2
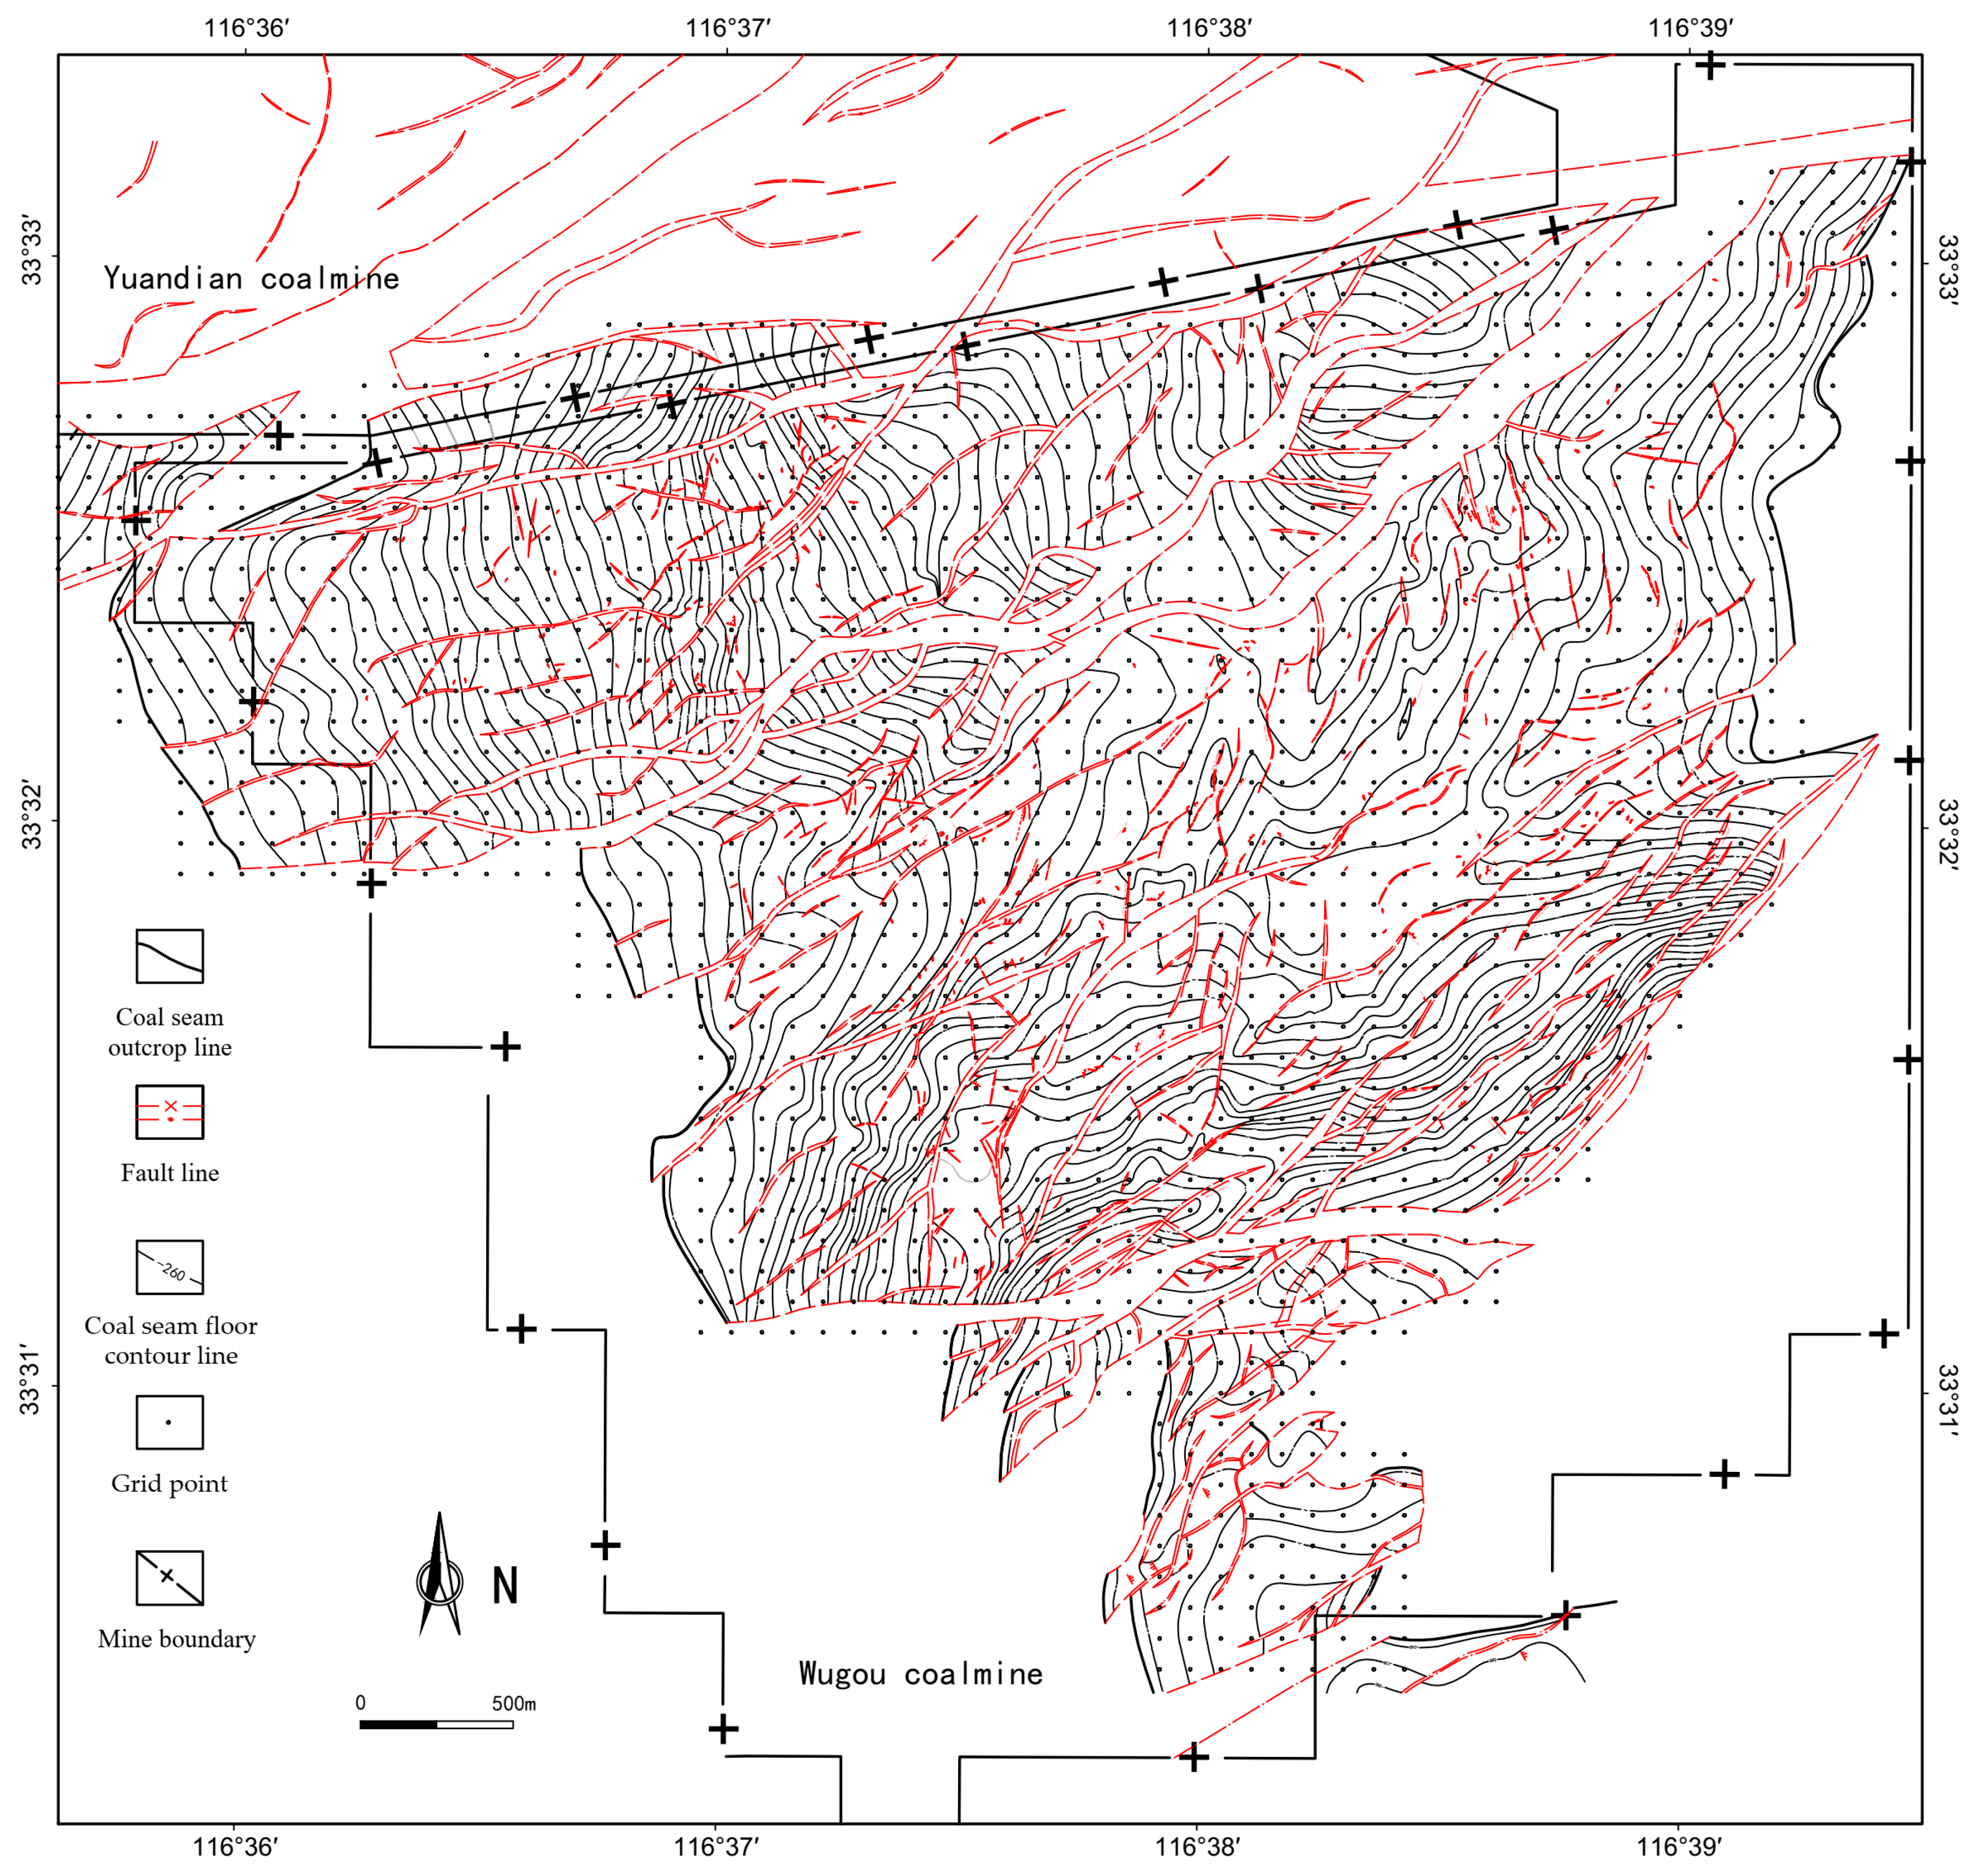
Based on the contour map of the No. 10 coal seam floor in the Wugou Coal Mine, a grid with a cell size of 100 m × 100 m was constructed (Figure 4). Using the (x, y, z) coordinates of 1660 grid nodes, the values were substituted into Formulas (3)–(10) to calculate the mean curvature, Gaussian curvature, minimum curvature, and maximum curvature of the No. 10 coal seam. Corresponding curvature contour maps were generated.

3. Results and Discussion

3.1. Characteristics of Structural Development

The Carboniferous to Permian Shanxi Formation, Lower Shihezi Formation, and Upper Shihezi Formation constitute the main coal-bearing strata in the mine. These strata contain 18 to 27 coal seams, among which 8 are minable. The mine lies within the Xuzhou-Suzhou Arcuate Thrust Nappe Zone. The distribution and structural morphology of coal seams are largely controlled by the Wugou Syncline, which exhibits an irregular arcuate shape and has undergone intense late-stage modification. The structural complexity is further increased by the dense development of NE-trending medium to large tensile faults that cut through the area. The Wugou Coal Mine is characterized by widespread development of folds and faults of varying scales and orientations.

3.1.1. Fold Morphology and Combination

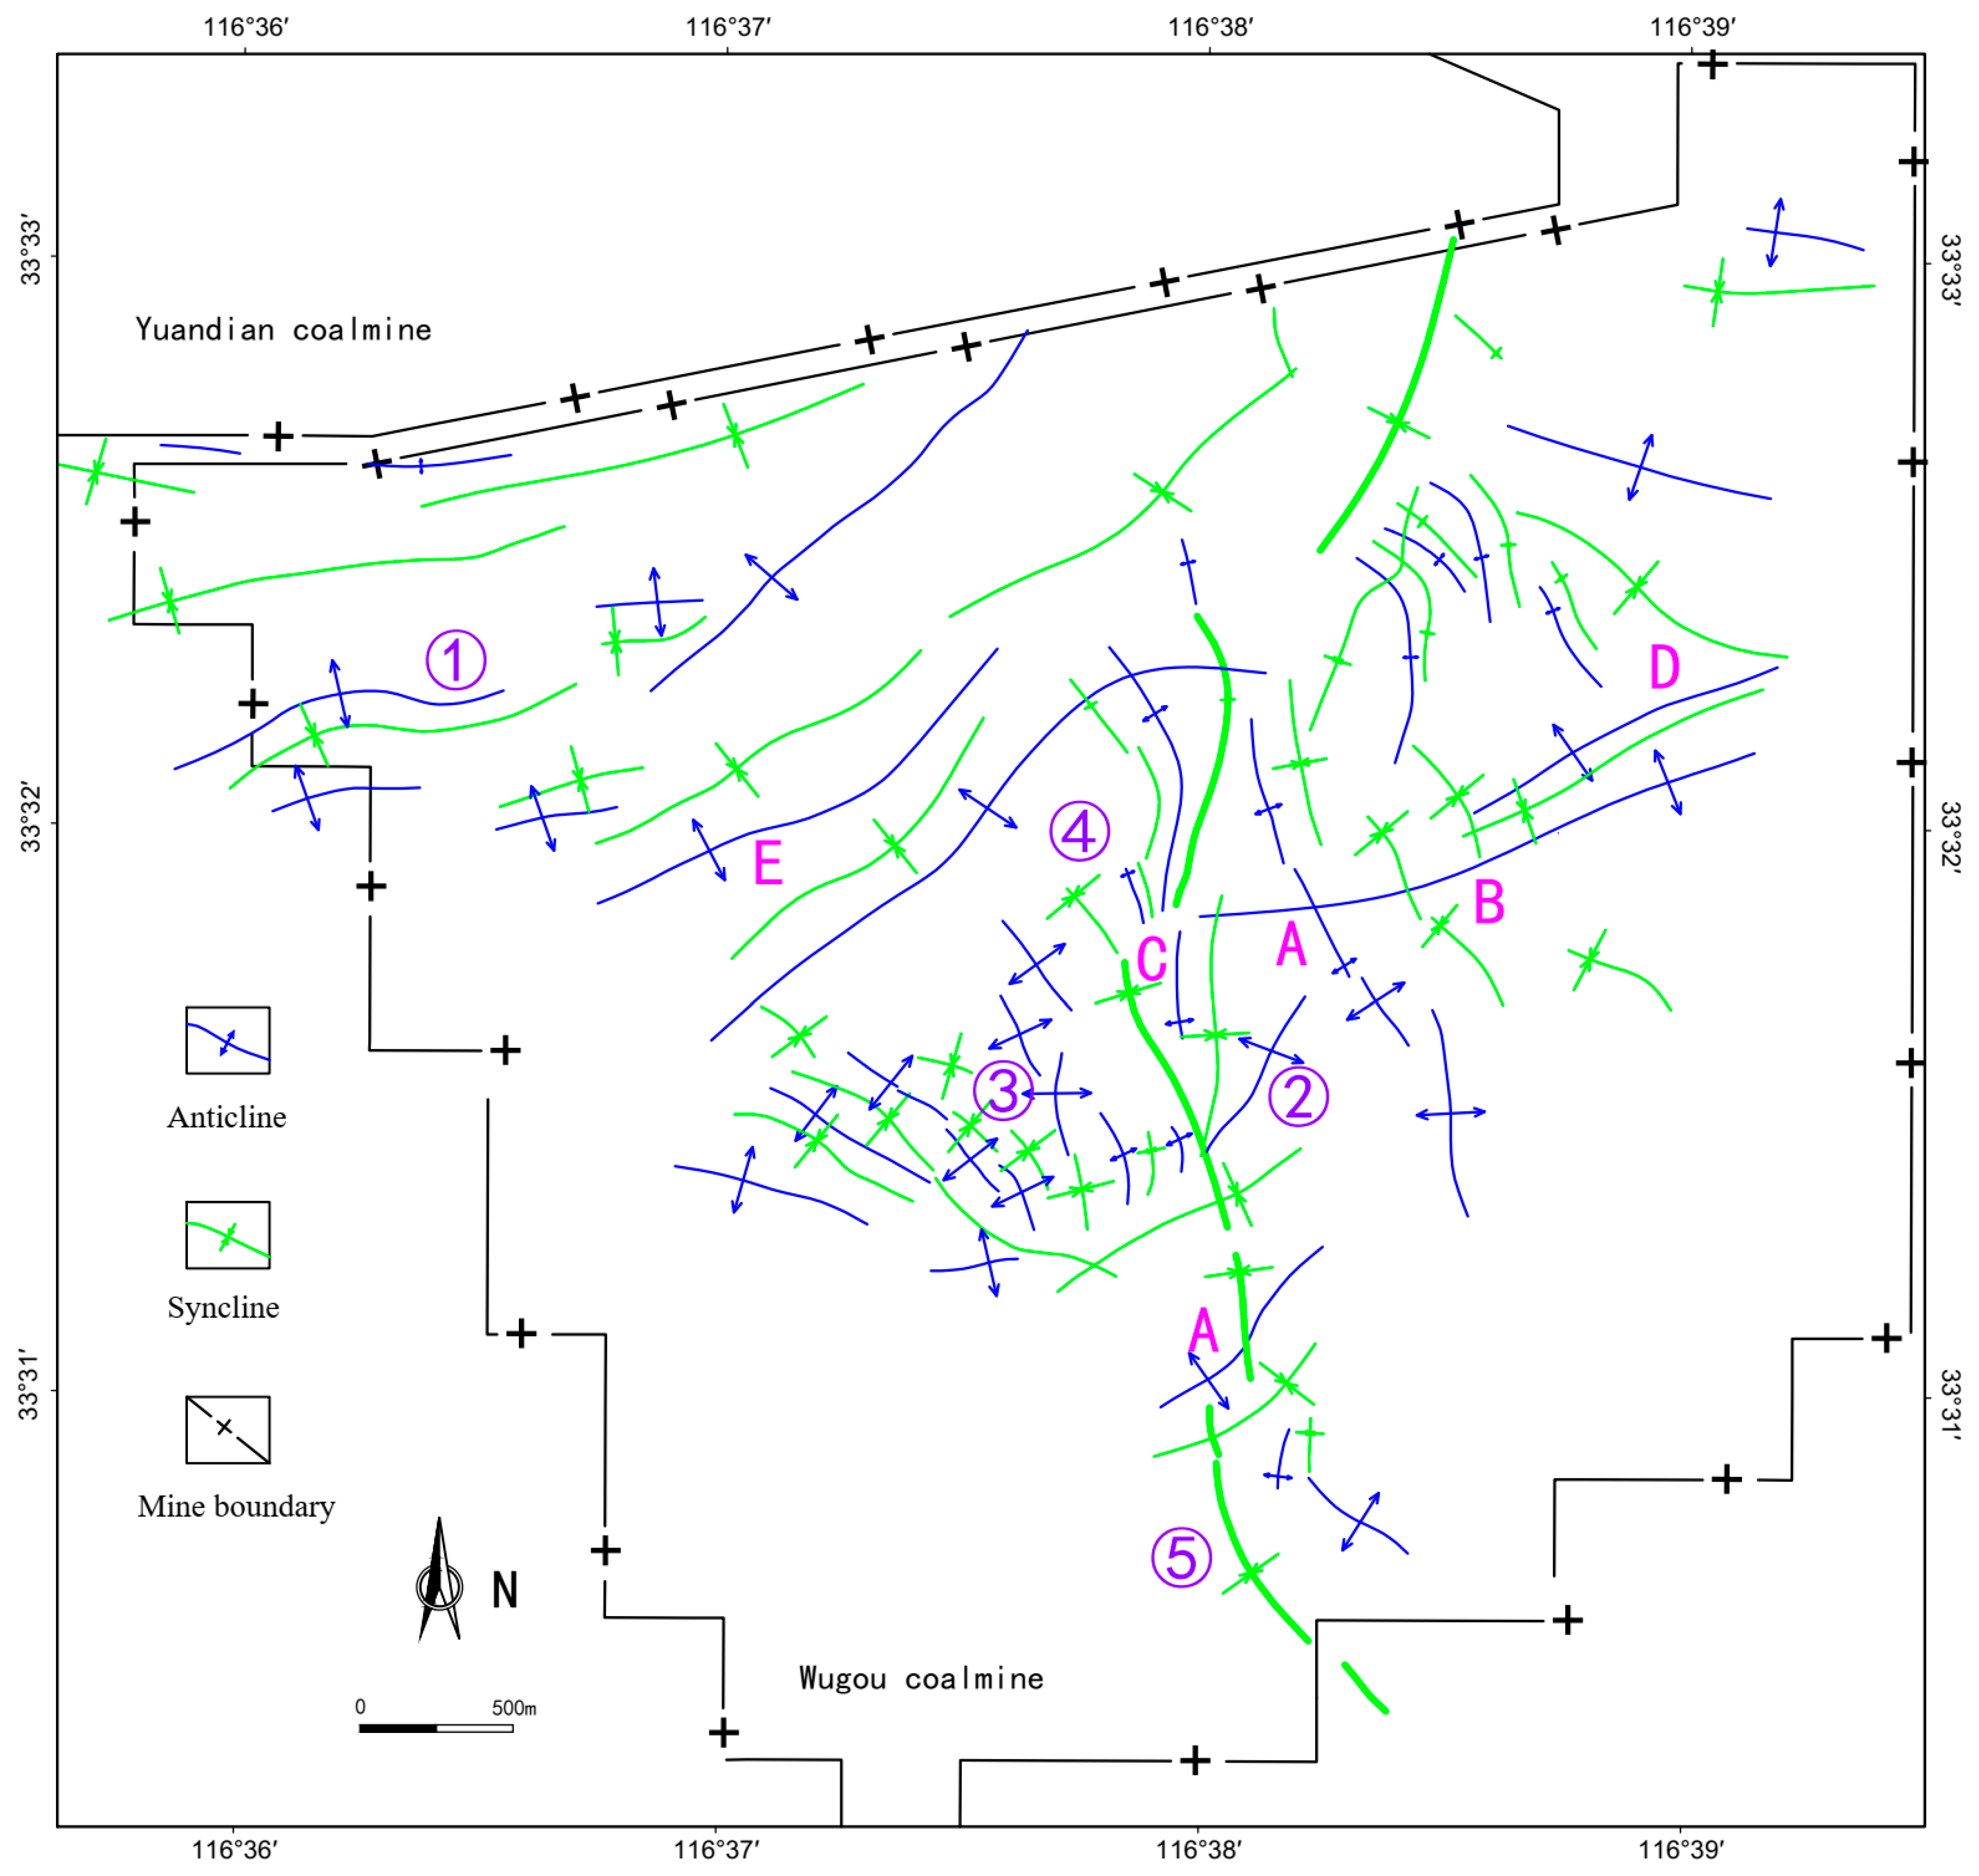
The fold structures in the Wugou Coal Mine exhibit significant multi-directionality, multi-scale hierarchy, multi-phase development, and multi-causal origins. The dominant fold orientations are NEE and NNW, followed by NW and NE, while NS and EW-trending folds are less developed. Overall, synclines and anticlines of the same orientation are continuously distributed adjacent to one another, whereas folds of different directions display superimposed development. Additionally, the formation of some fold structures is clearly influenced by fault systems. The planar fold combination types include parallel folds, branching folds, en echelon folds, brush-like folds, and arc-shaped folds (Figure 5).
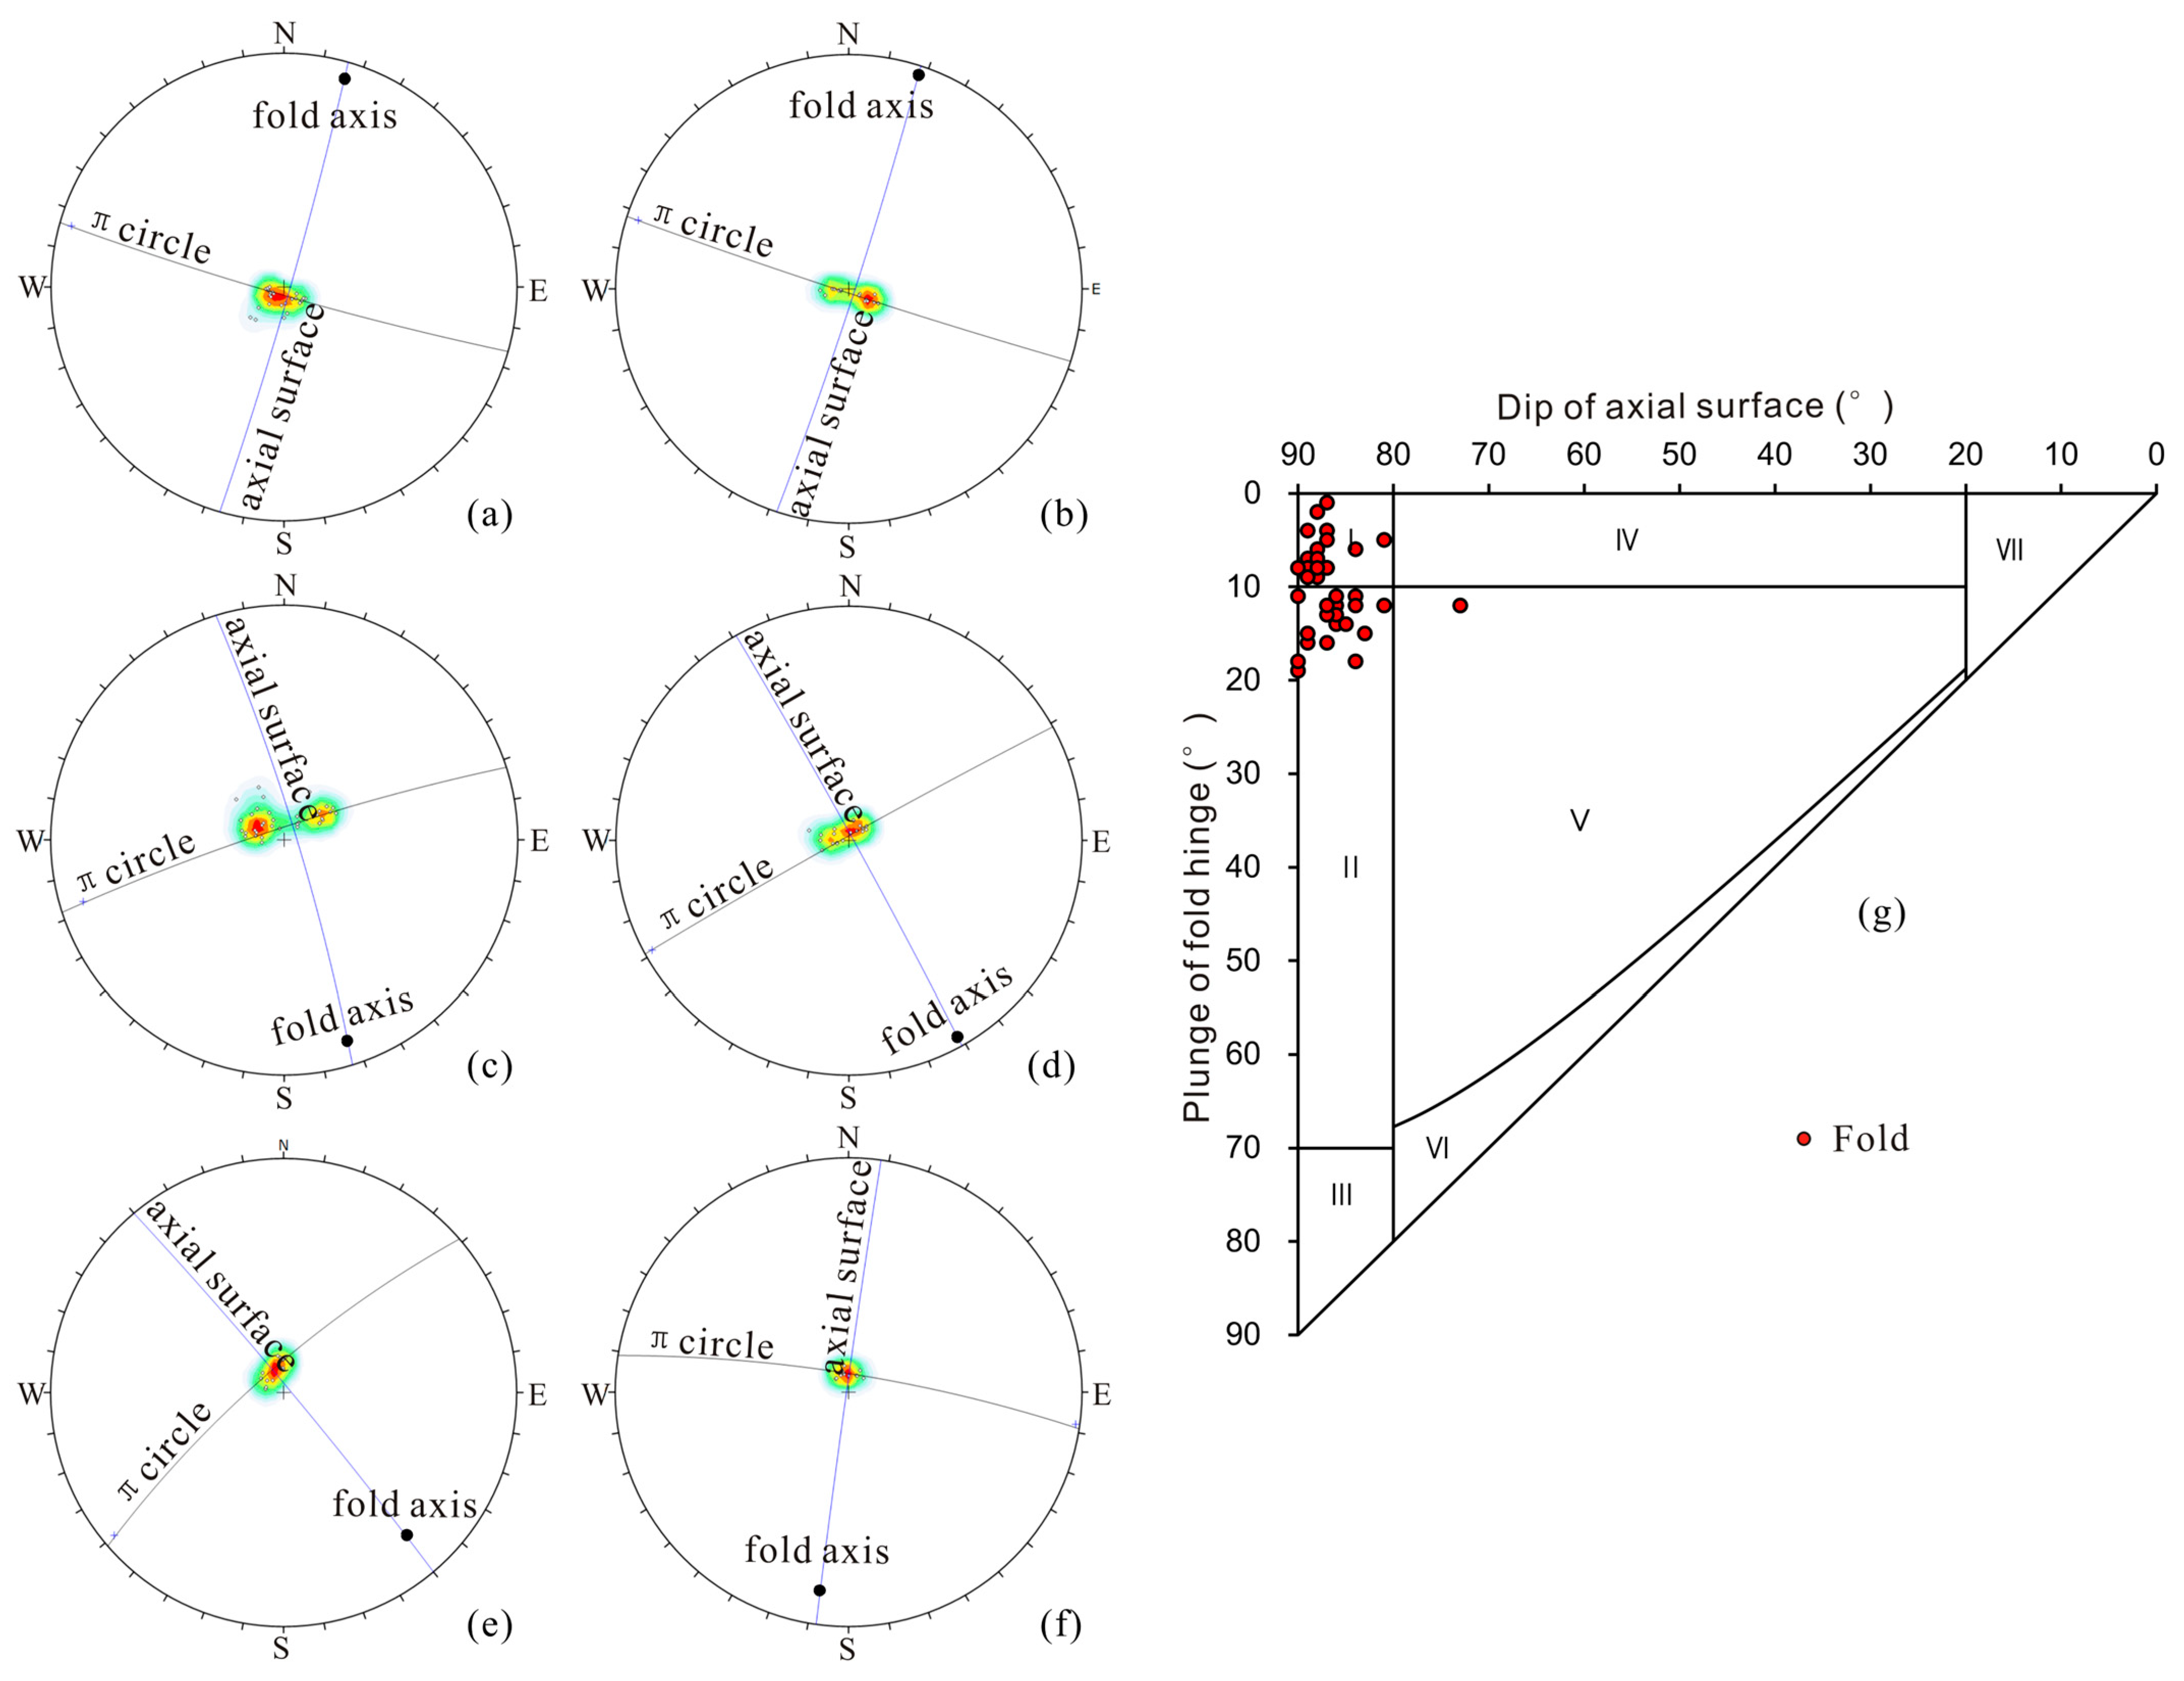
Based on the systematic calculation and analysis of stratum occurrence data at different parts of the folds, combined with stereographic projection analysis of fold structures, a quantitative analysis of fold deformation characteristics was conducted (Figure 6). The attitude classification of fold structures can reflect their three-dimensional spatial morphology and occurrence characteristics, thereby avoiding potential one-sided errors that may arise from observing and describing folds solely in planar or cross-sectional views. According to the stereographic projection analysis of folds, which reveals the attitudes of fold axial planes and hinges, it is evident that the fold structures developed in the Wugou Coal Mine are predominantly upright horizontal folds and upright plunging folds (Figure 6). The axial planes of both types are nearly vertical.
Fold superposition refers to the complex geometric structures formed when rocks undergo multiple tectonic events, where stress from different periods and directions causes earlier folds to be modified or overprinted by later ones, resulting in intersecting, distorted, or composite patterns. This phenomenon is highly significant for revealing the tectonic deformation processes and kinematic characteristics in complex structural deformation zones [40]. Ramsay pioneered the introduction of quantitative structural geometry mechanisms into the study of fold structures [41]. Since then, research and discussions on fold superposition have remained highly active [42,43,44].
Based on the aforementioned fold superposition classification scheme and a systematic analysis of the fold deformation characteristics in the Wugou mining area, the types of superposition in different folds within the study area were systematically categorized and studied. The fold structures of different orientations formed in various periods exhibit superposition and modification phenomena, with diverse types of superimposed folds, primarily including oblique superposition, cross-cutting superposition, deflection superposition, oblique limitation, and enhancement types (Figure 5). These patterns indicate the chronological sequence of fold formation in different directions: NEE-trending folds formed earlier than NW-trending folds, NW-trending folds formed earlier than NE-trending folds, and NE-trending folds formed earlier than NW-trending folds. The apparent contradiction in the formation sequence of NW-trending folds, combined with differences in their deformation characteristics, confirms that the NW-trending folds are not products of the same tectonic event. Instead, the fold structures in the Wugou Coal Mine are the result of four distinct tectonic deformation events.

3.1.2. Characteristics of Fault Development

The fault structures in the Wugou Coal Mine are exceptionally well-developed, dominated by normal faults which account for approximately 90% of the total, with a small number of reverse and strike-slip faults. A total of 569 faults are developed in the No. 10 coal seam, among which 336 are small faults with a throw of 0–5 m, accounting for 59%, and 11 are large faults with a throw greater than 50 m. The fault strikes are primarily NE-oriented, followed by NEE and NNE directions, while the fault dips are mainly toward the NW, with a secondary preference for NNW, collectively exhibiting a step-like pattern (Figure 7).
Reverse faults are predominantly oriented NNE and NE, with a lesser number trending NNW. Their dips are mainly toward the SE, and secondarily toward the NW. Translational normal faults are primarily oriented NE, followed by NEE, with relatively stable azimuths and a general dip direction toward the NW, consistent with the grouping of NE-trending normal faults. The attitude characteristics of the faults are largely influenced by the stress field of the initial tectonic deformation. Subsequent reversal or transformation of fault properties generally does not alter their attitudes. The correlation between the attitudes of different types of faults in the Wugou Coal Mine reflects their genetic relationships and differential tectonic evolution (Figure 7).
The main types of fault combinations in the study area include parallel faults, en echelon faults, intersecting faults, braided faults, and brush-shaped faults. Parallel fault combinations are the most common type of planar fault arrangement in the Wugou Coal Mine (Figure 8). Numerous small NNE-trending normal faults on the SE side of the NE-striking F14 fault form an echelon pattern, while convex-upward arc-shaped faults such as F6, F7, and DF431 in the southwestern area exhibit a brush-shaped combination. Large strike-slip normal faults including F5, F6, F7, F9, F14, and DF74 develop intersecting fault combinations with smaller faults on their sides. In the southwestern segment of the exceptionally large F13 fault, branch faults exhibit unstable extensions, frequent arc-shaped bends, oblique intersections, and the formation of lens-shaped fault blocks, representing a braided fault combination.

3.2. Fractal Quantitative Evaluation

Fractal dimension of faults effectively characterizes the complexity of fault development. In the Wugou Coal Mine, the capacity dimension (Dk) of faults within the 400 m × 400 m evaluation units ranges from 1.0 to 2.0, with an average value of 1.80, significantly higher than the average fractal dimension of 1.52 for the entire Huaibei Coalfield. This discrepancy aligns with the extensively developed fault systems observed in the mine. The planar distribution of Dk values exhibits notable variability and distinct zoning, generally falling between 1.8 and 2.0, reflecting highly complex fault structures throughout the mining area. Based on Dk values, the region can be categorized into four distinct zones: An Extremely Complex Fault Zone (Dk = 1.9–2.0), a Complex Fault Zone (Dk = 1.8–1.9), a Moderately Developed Fault Zone (Dk = 1.4–1.8), and a Simply Developed Fault Zone (Dk = 0–1.4) (Figure 9).
Extremely Complex Fault Zone (1.9 ≤ Dk < 2.0): A total of 47 evaluation units fall into this category, accounting for 35.72% of the study area, primarily distributed in the central, southern, eastern, and northeastern parts of the mine. The extreme structural complexity in these zones results from the development of associated and derived faults related to major fault systems, intersections of faults with different orientations, and densely clustered fault networks. Specifically, the eastern extreme complexity zone is dominated by intensive development of NE-trending faults such as F9; the southern zone is characterized by an arc-shaped fault belt in the southwestern part of the mine combined with densely distributed NNE-trending derivative faults; while the western extreme complexity zone is influenced by the braided fault system in the southwestern segment of the major fault F13 and derived faults related to the major fault F14.
Complex Fault Zone (1.8 ≤ Dk < 1.9): A total of 28 evaluation units fall into this category, accounting for 21.88% of the study area. These units are distributed adjacent to the Extremely Complex Fault Zones, primarily along the sides of major faults and at the intersection points of large-scale fault systems. Interconnected and extensively developed with the Extremely Complex Fault Zones, they form NW- and NE-trending complex fault belts.
Moderately Developed Fault Zone (1.4 ≤ Dk < 1.8): This zone comprises 47 evaluation units, accounting for 35.72% of the total. The distribution is relatively scattered, primarily located in the peripheral areas of the mining field. Two NE- and NW-trending moderately developed fault belts are identified within the mining area, characterized by sparsely distributed medium-sized faults.
Simply Developed Fault Zone (0 ≤ Dk < 1.4): This zone comprises 6 evaluation units, accounting for 4.69% of the total. It is localized near the coal outcrop in the northeastern part of the mining field, where fault structures are poorly developed and only a few small-scale faults are observed.

3.3. Quantitative Evaluation of Structural Curvature

3.3.1. Evaluation of Maximum and Minimum Curvature

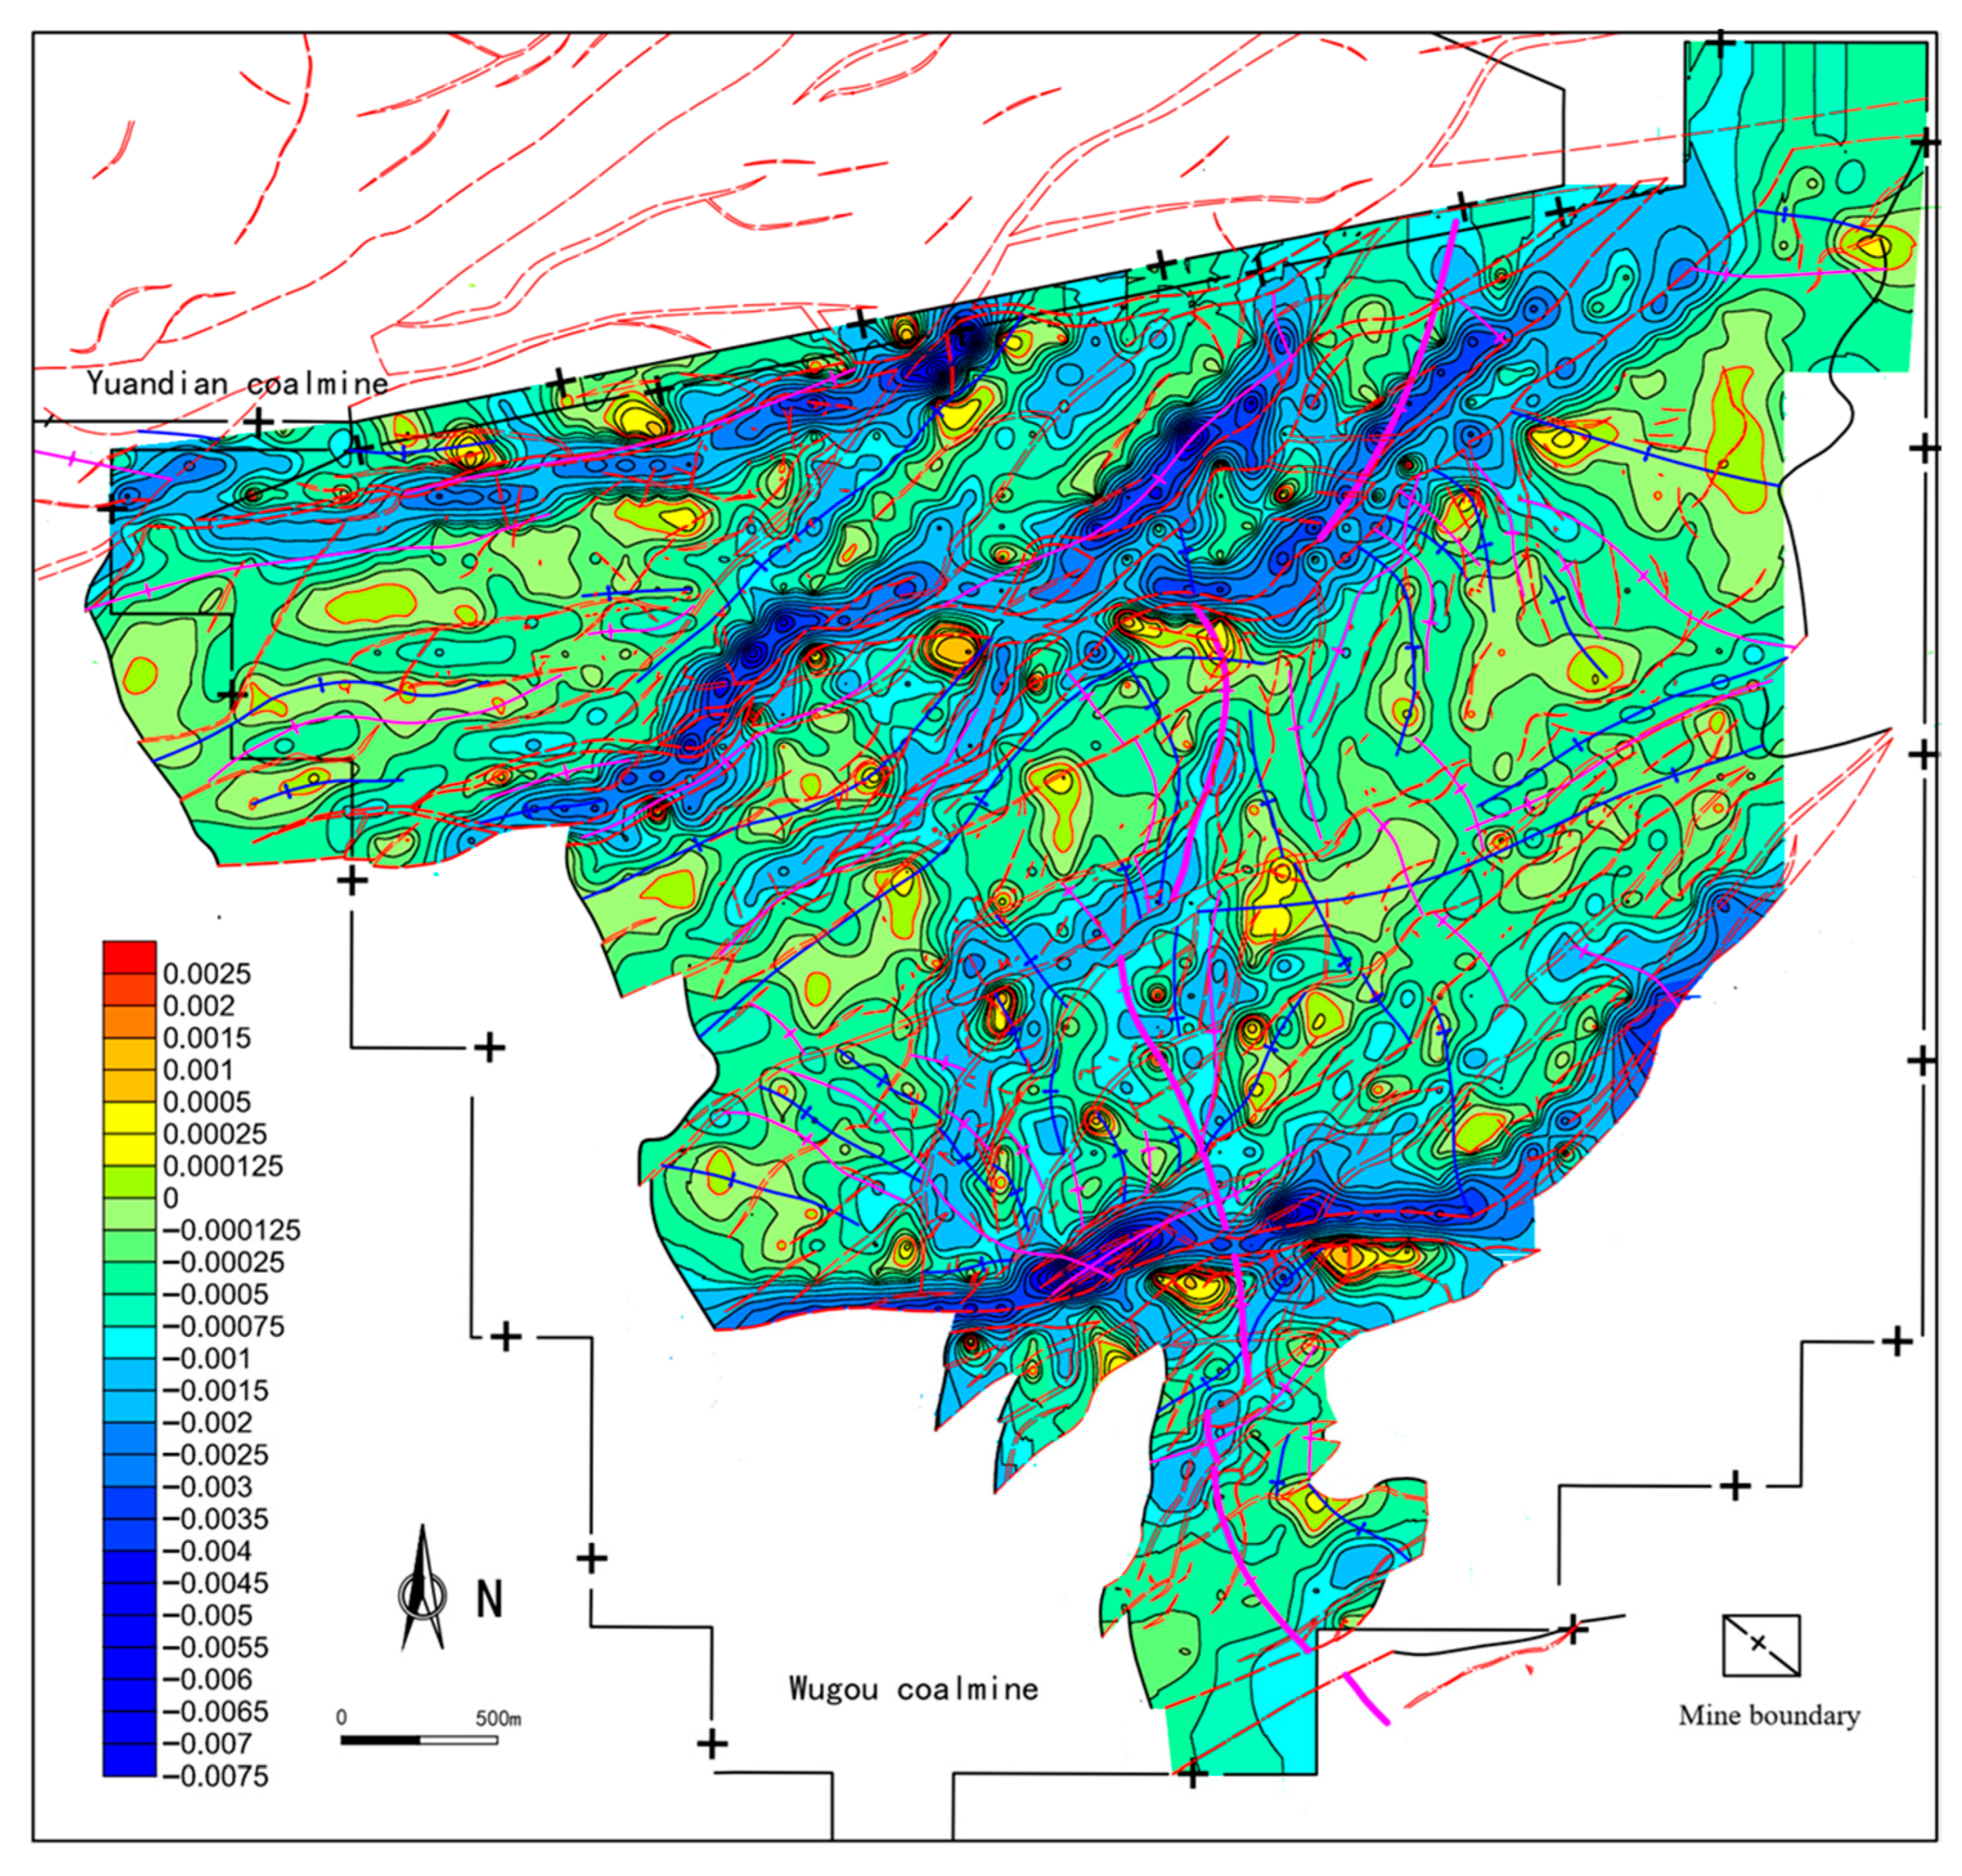
In curvature calculation, the maximum curvature is defined as the larger of two mutually orthogonal curvature values at a given point, while the minimum curvature corresponds to the smaller value (Figure 10 and Figure 11). This study defines upward bending as positive curvature and downward bending as negative. Consequently, if both maximum and minimum curvature values are zero, it indicates the development of a flat or dipping planar structure. For fold structures, identical signs of both curvature values suggest a doubly plunging fold; opposite signs characterize a saddle-shaped structure; a value of zero in one curvature combined with a positive value in the other indicates a synclinal structure, while a negative value signifies an anticlinal structure, both forming cylindrical folds. Additionally, approximately equal curvature values are representative of a domal or basin structure.
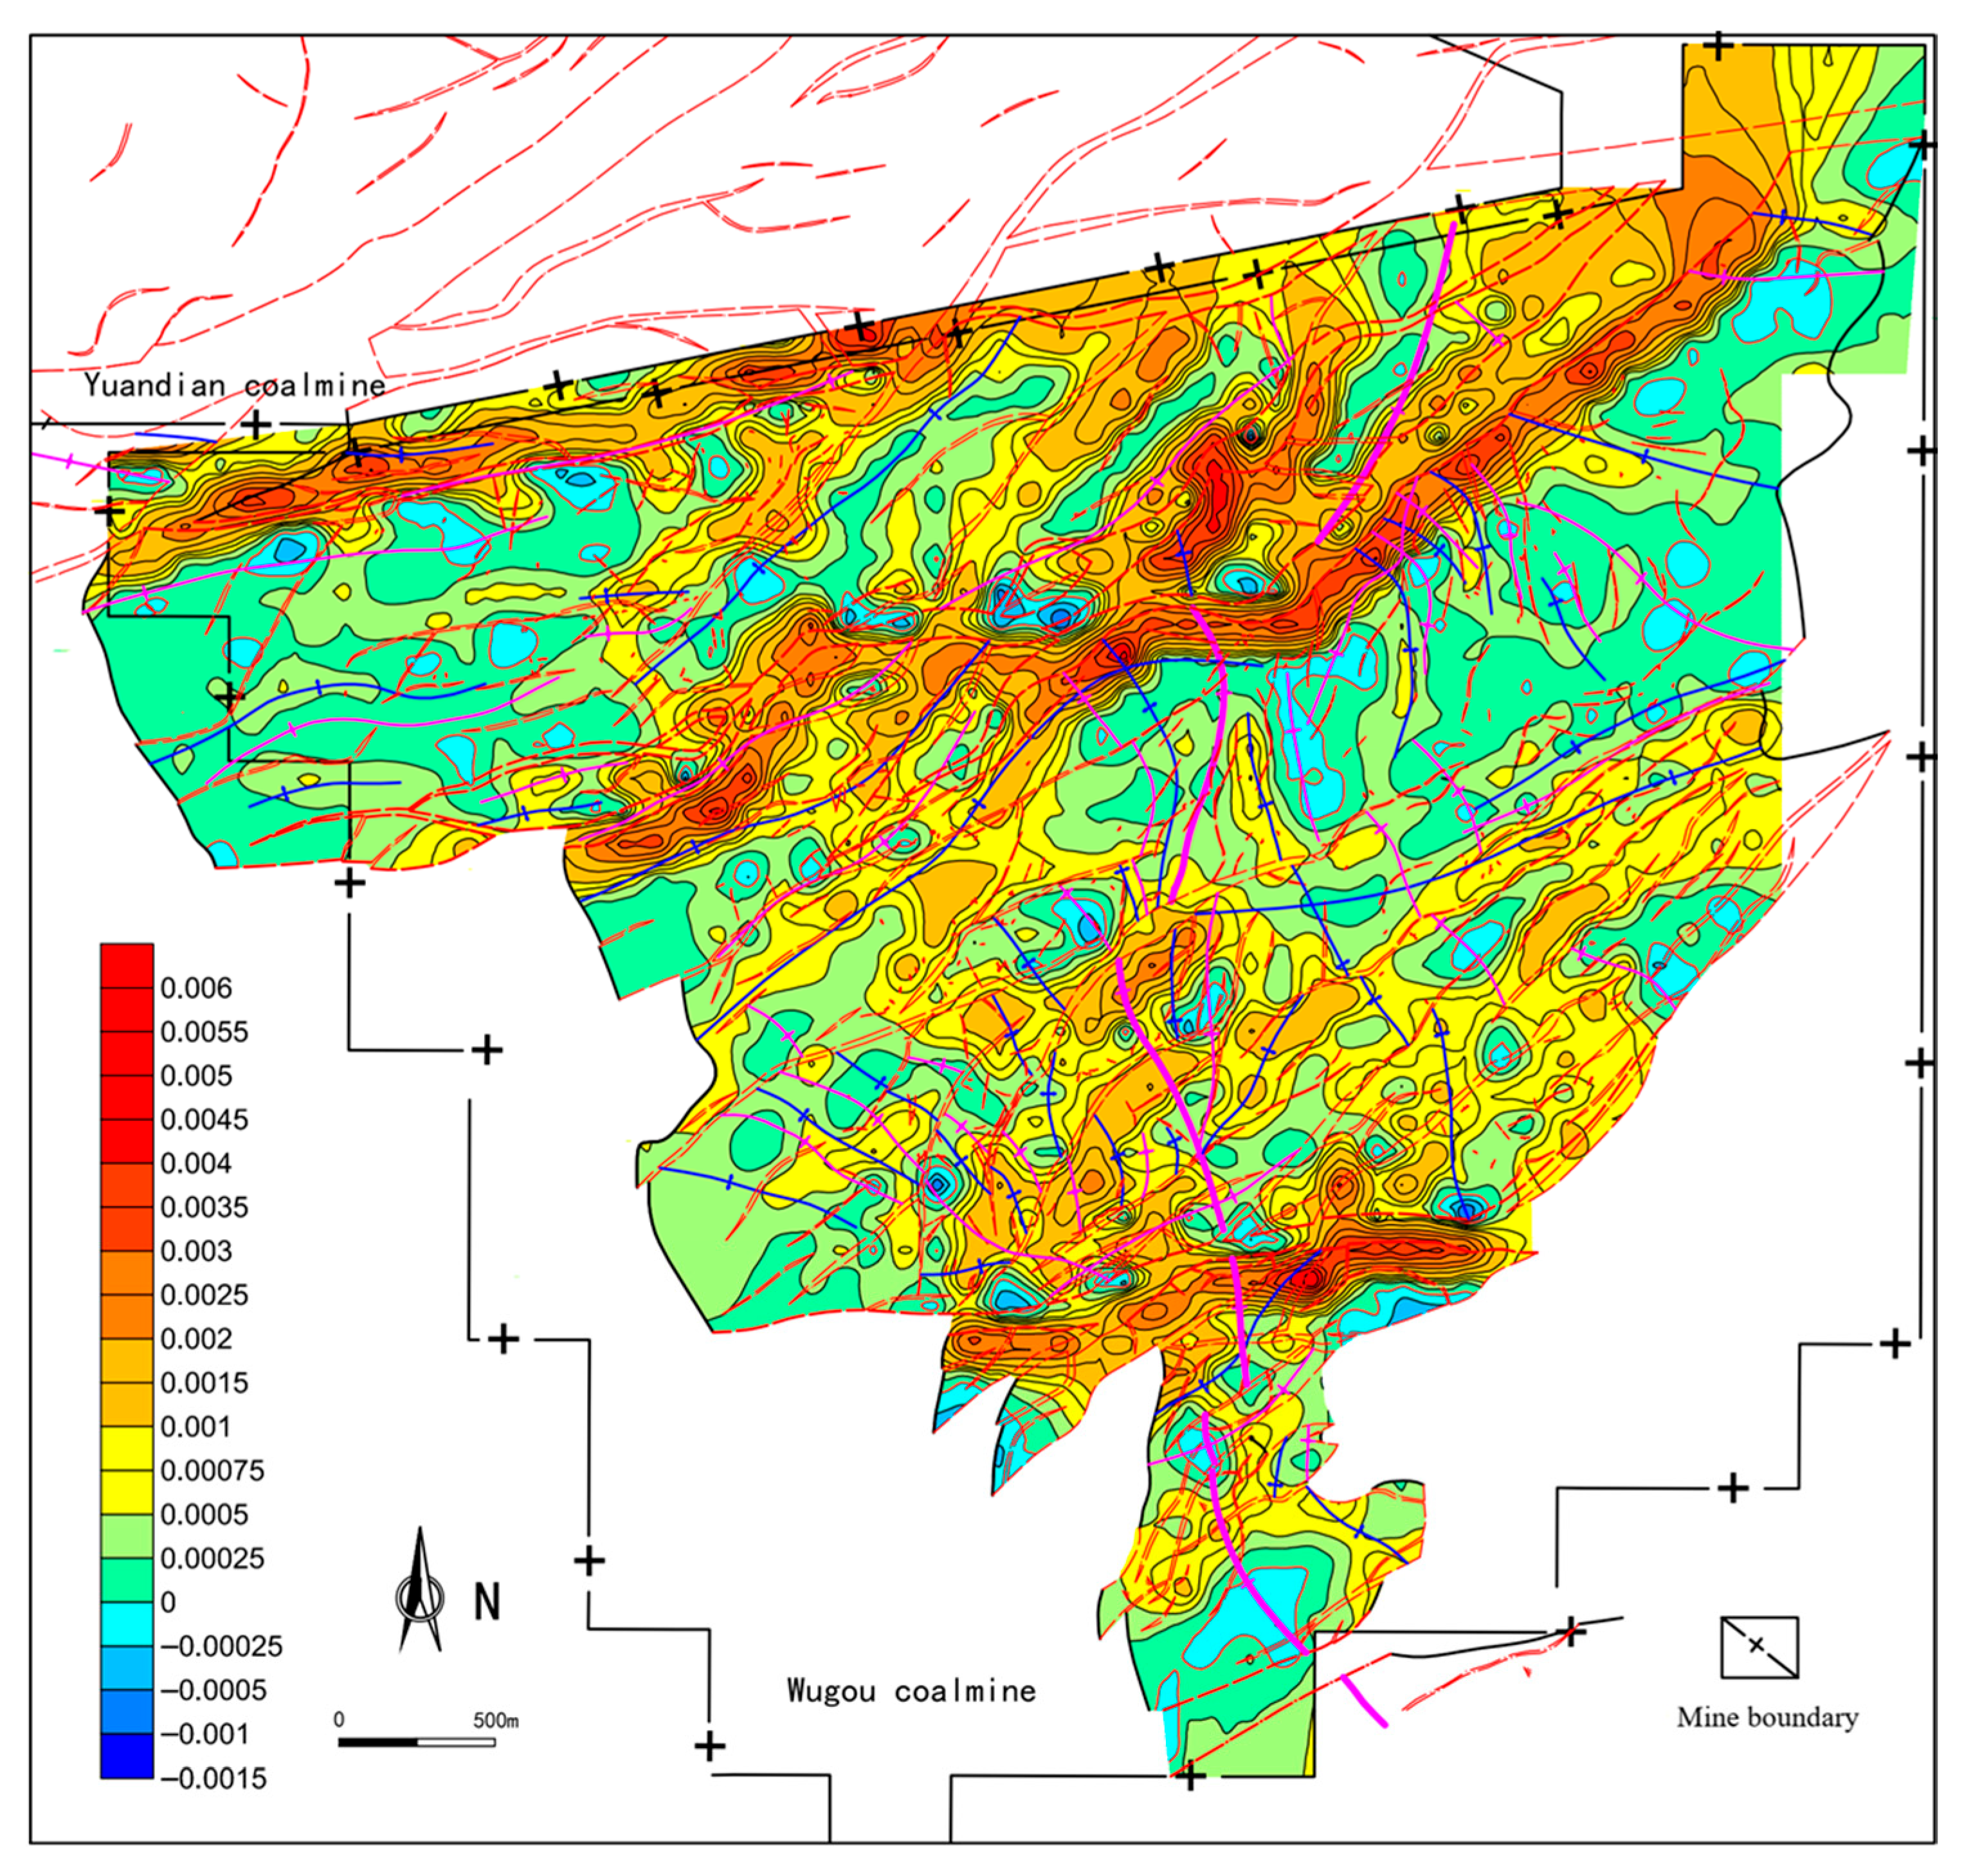
The maximum curvature (Kmax) of the No. 10 coal seam in the Wugou Coal Mine ranges from −1.15 × 10⁻³ to 5.70 × 10⁻³ (average: 7.40 × 10⁻⁴), while the minimum curvature (Kmin) ranges from −7.19 × 10⁻³ to 1.09 × 10⁻³ (average: −7.66 × 10⁻⁴). Their spatial distribution exhibits significant heterogeneity, manifesting as irregular patchy and banded patterns resulting from structural differentiation. These curvature values effectively delineate four major controlling faults: three distinct anomaly bands align with the northern F16 fault, central F13 and F14 faults, and southern F9 fault. Extremely high Kmax values (0.002–0.006) form NEE-, NE-, and EW-trending bands in the footwalls of these large normal faults, while extremely low Kmin values (−0.006 to −0.002) occur in their hanging walls. Additionally, areas near the hanging and footwalls of NE-trending large faults (F2, F3, F10, F11) and southwestern convex-upward arc-shaped faults (F6, DF60) exhibit moderate Kmin low-value zones (−0.002 to −0.001) and Kmax high-value zones (0.001–0.002). In contrast, medium and small faults show no pronounced curvature response.
Maximum and minimum curvature values effectively indicate the development of anticlines and synclines, respectively. In the southern part of the mining area, large strongly deformed synclines such as the Wugou Syncline, Wugou East Syncline, and Sunjia Syncline in the west form NE- and NEE-trending low-value zones of minimum curvature (−0.002 ≤ Kmin < −0.001). Their peripheral regions, including moderately deformed synclines like the Daqiao East Syncline and Sunweizi Syncline, exhibit subordinate low-value zones of minimum curvature (−0.001 ≤ Kmin < −0.0005). Weakly deformed synclines correspond to slightly low-value zones of minimum curvature (−0.0005 ≤ Kmin < 0), with contour extensions aligning with the axial traces of the synclines. For anticlines, only strongly deformed sections of the Sunjia Anticline, Sunwafang Anticline, and 1026 Anticline form NE- and NEE-trending high-value zones of maximum curvature (0.001 ≤ Kmax < 0.002). Their peripheral regions, including moderately deformed anticlines such as the Wugou East Anticline, 1015 Anticline, and 1022 East Anticline, exhibit subordinate high-value zones of maximum curvature (0.0005 ≤ Kmax < 0.001). Weakly deformed anticlines correspond to slightly high-value zones of maximum curvature (0 ≤ Kmax < 0.0005), with contour extensions also aligning with the axial traces of the anticlines.

3.3.2. Evaluation of Mean Curvature

Mean curvature is defined as the average of the mutually orthogonal maximum and minimum curvatures at a point on a surface. The sign of the mean curvature holds distinct geological significance. A positive mean curvature indicates that the sum of the orthogonal curvatures is greater than zero, meaning the maximum curvature must be positive while the absolute value of the minimum curvature is smaller. This pattern suggests the development of an anticline or dome structure; A negative mean curvature reflects a sum less than zero, implying the presence of a syncline or basin structure; A zero mean curvature occurs when both curvatures are either zero or opposites. Opposite curvatures characterize a saddle-shaped region of a fold, while zero curvatures indicate a flat or dipping planar structure.
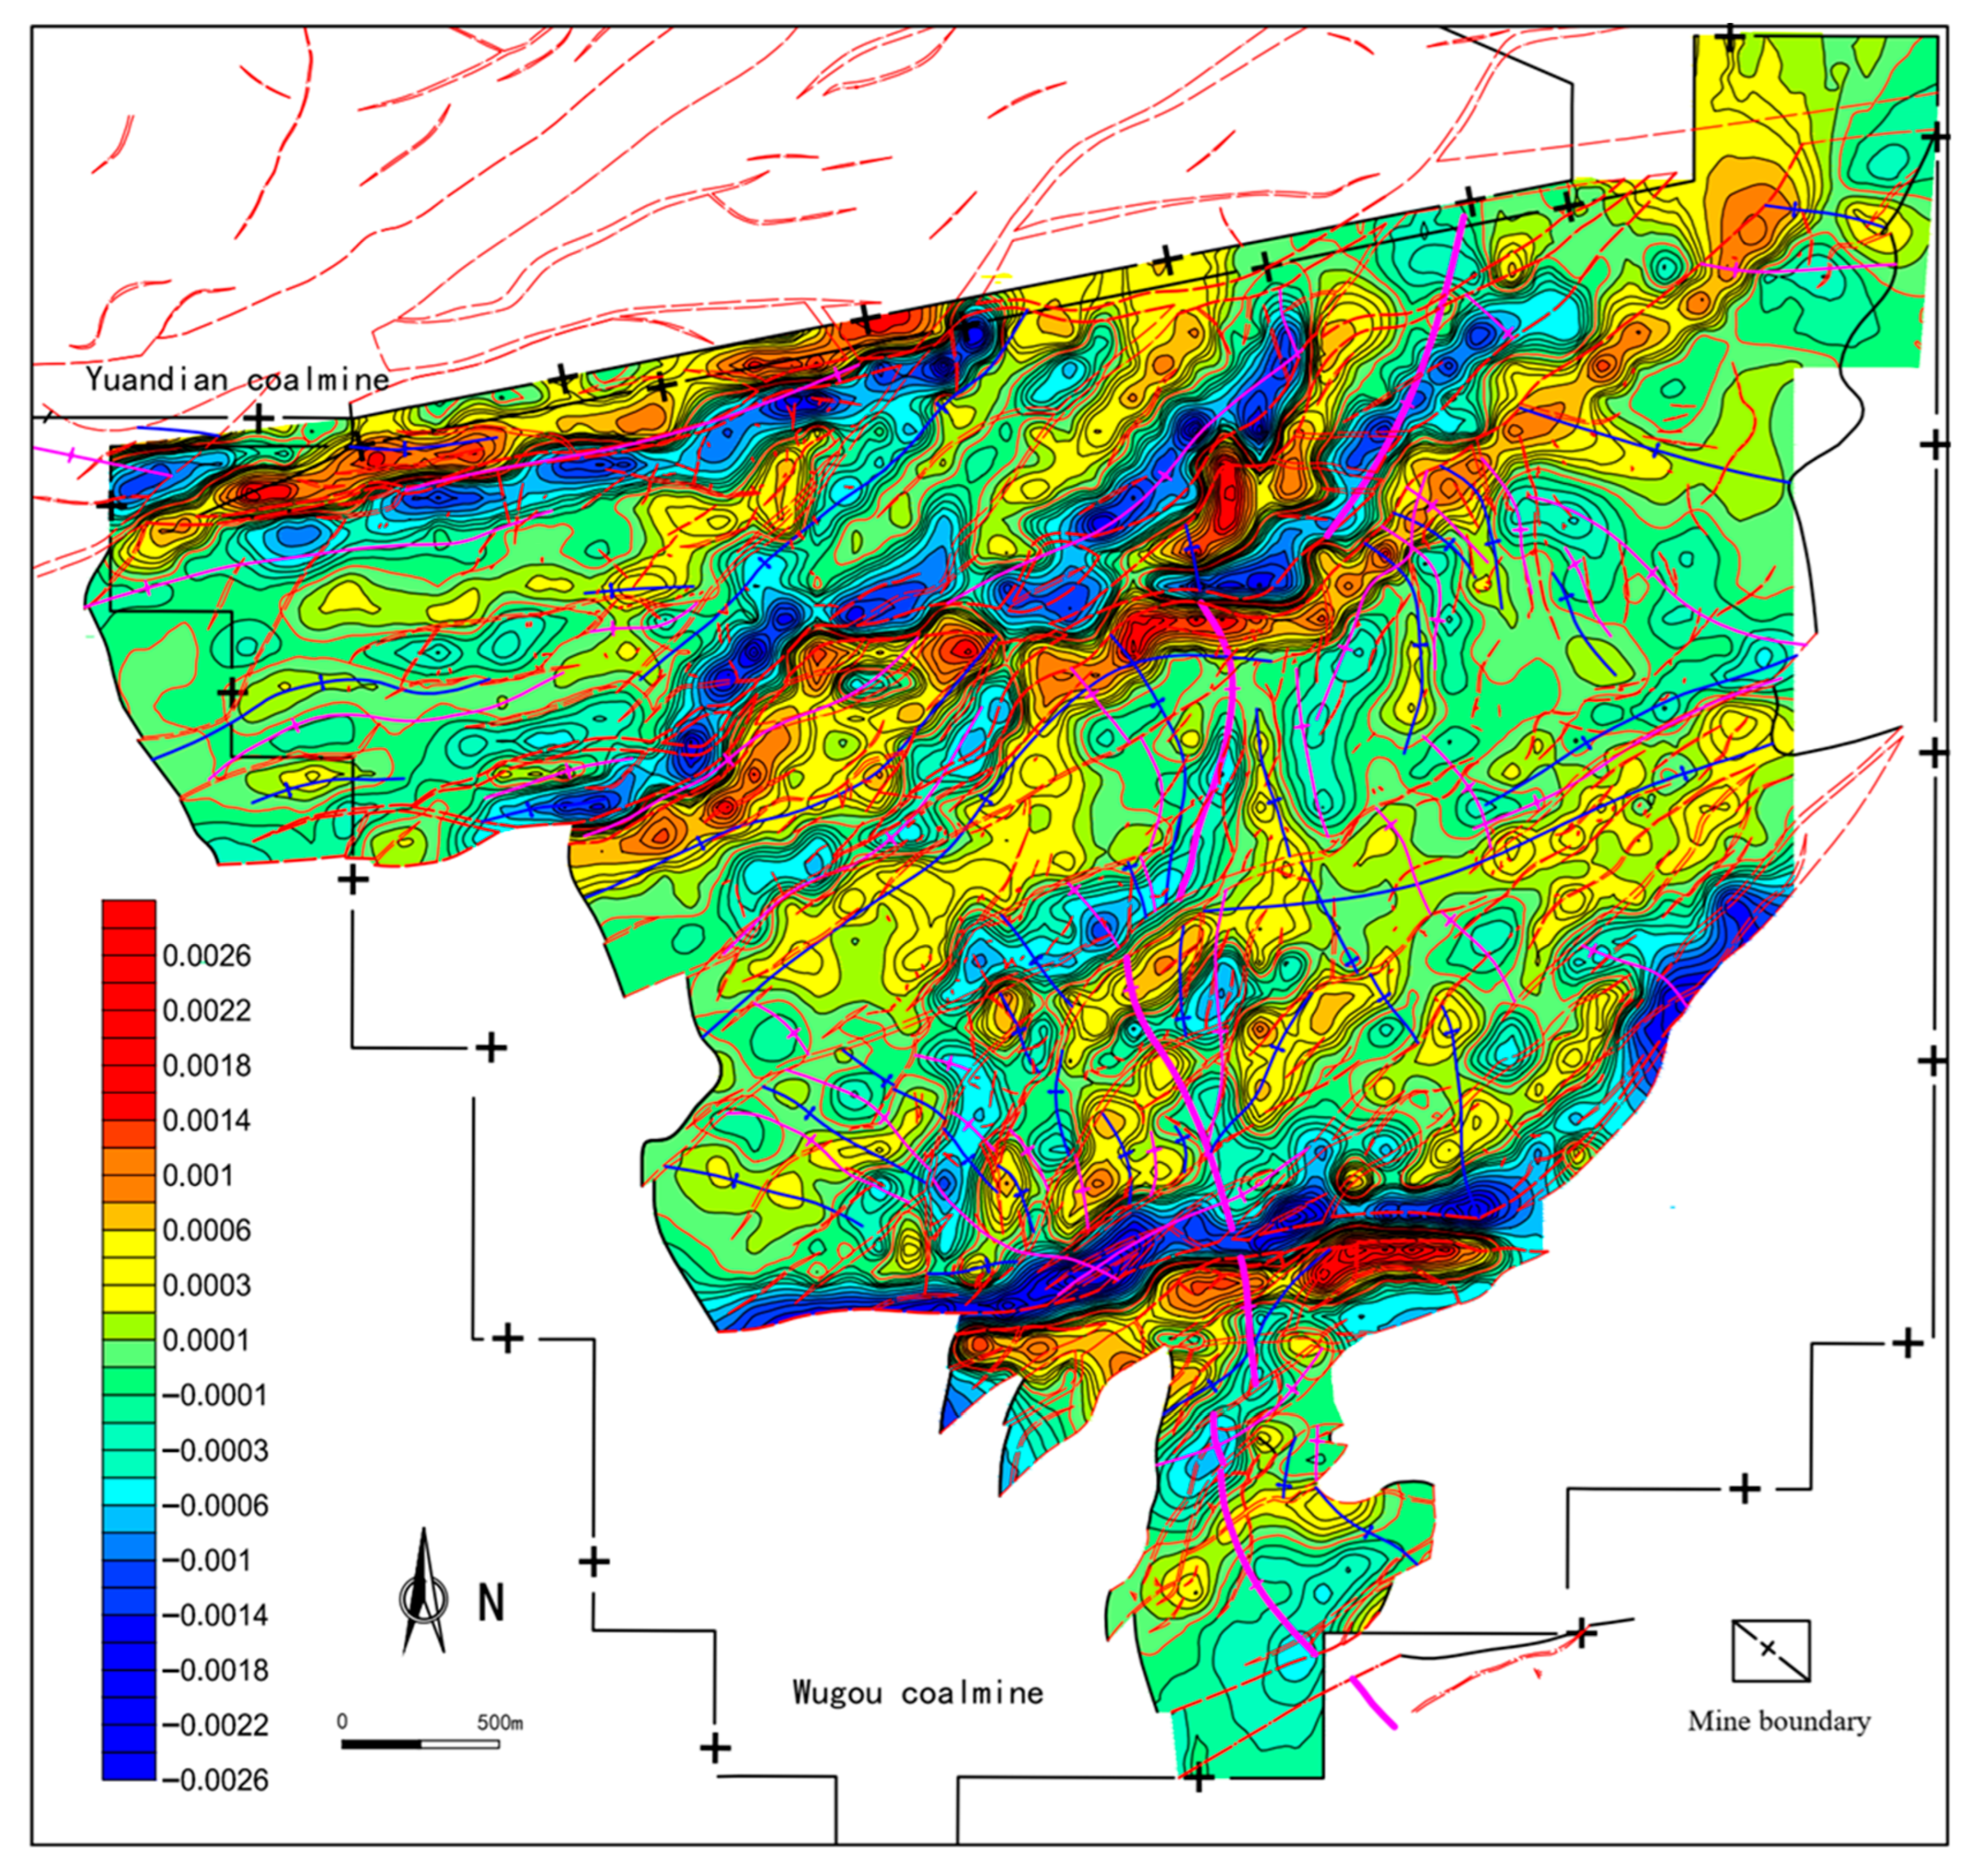
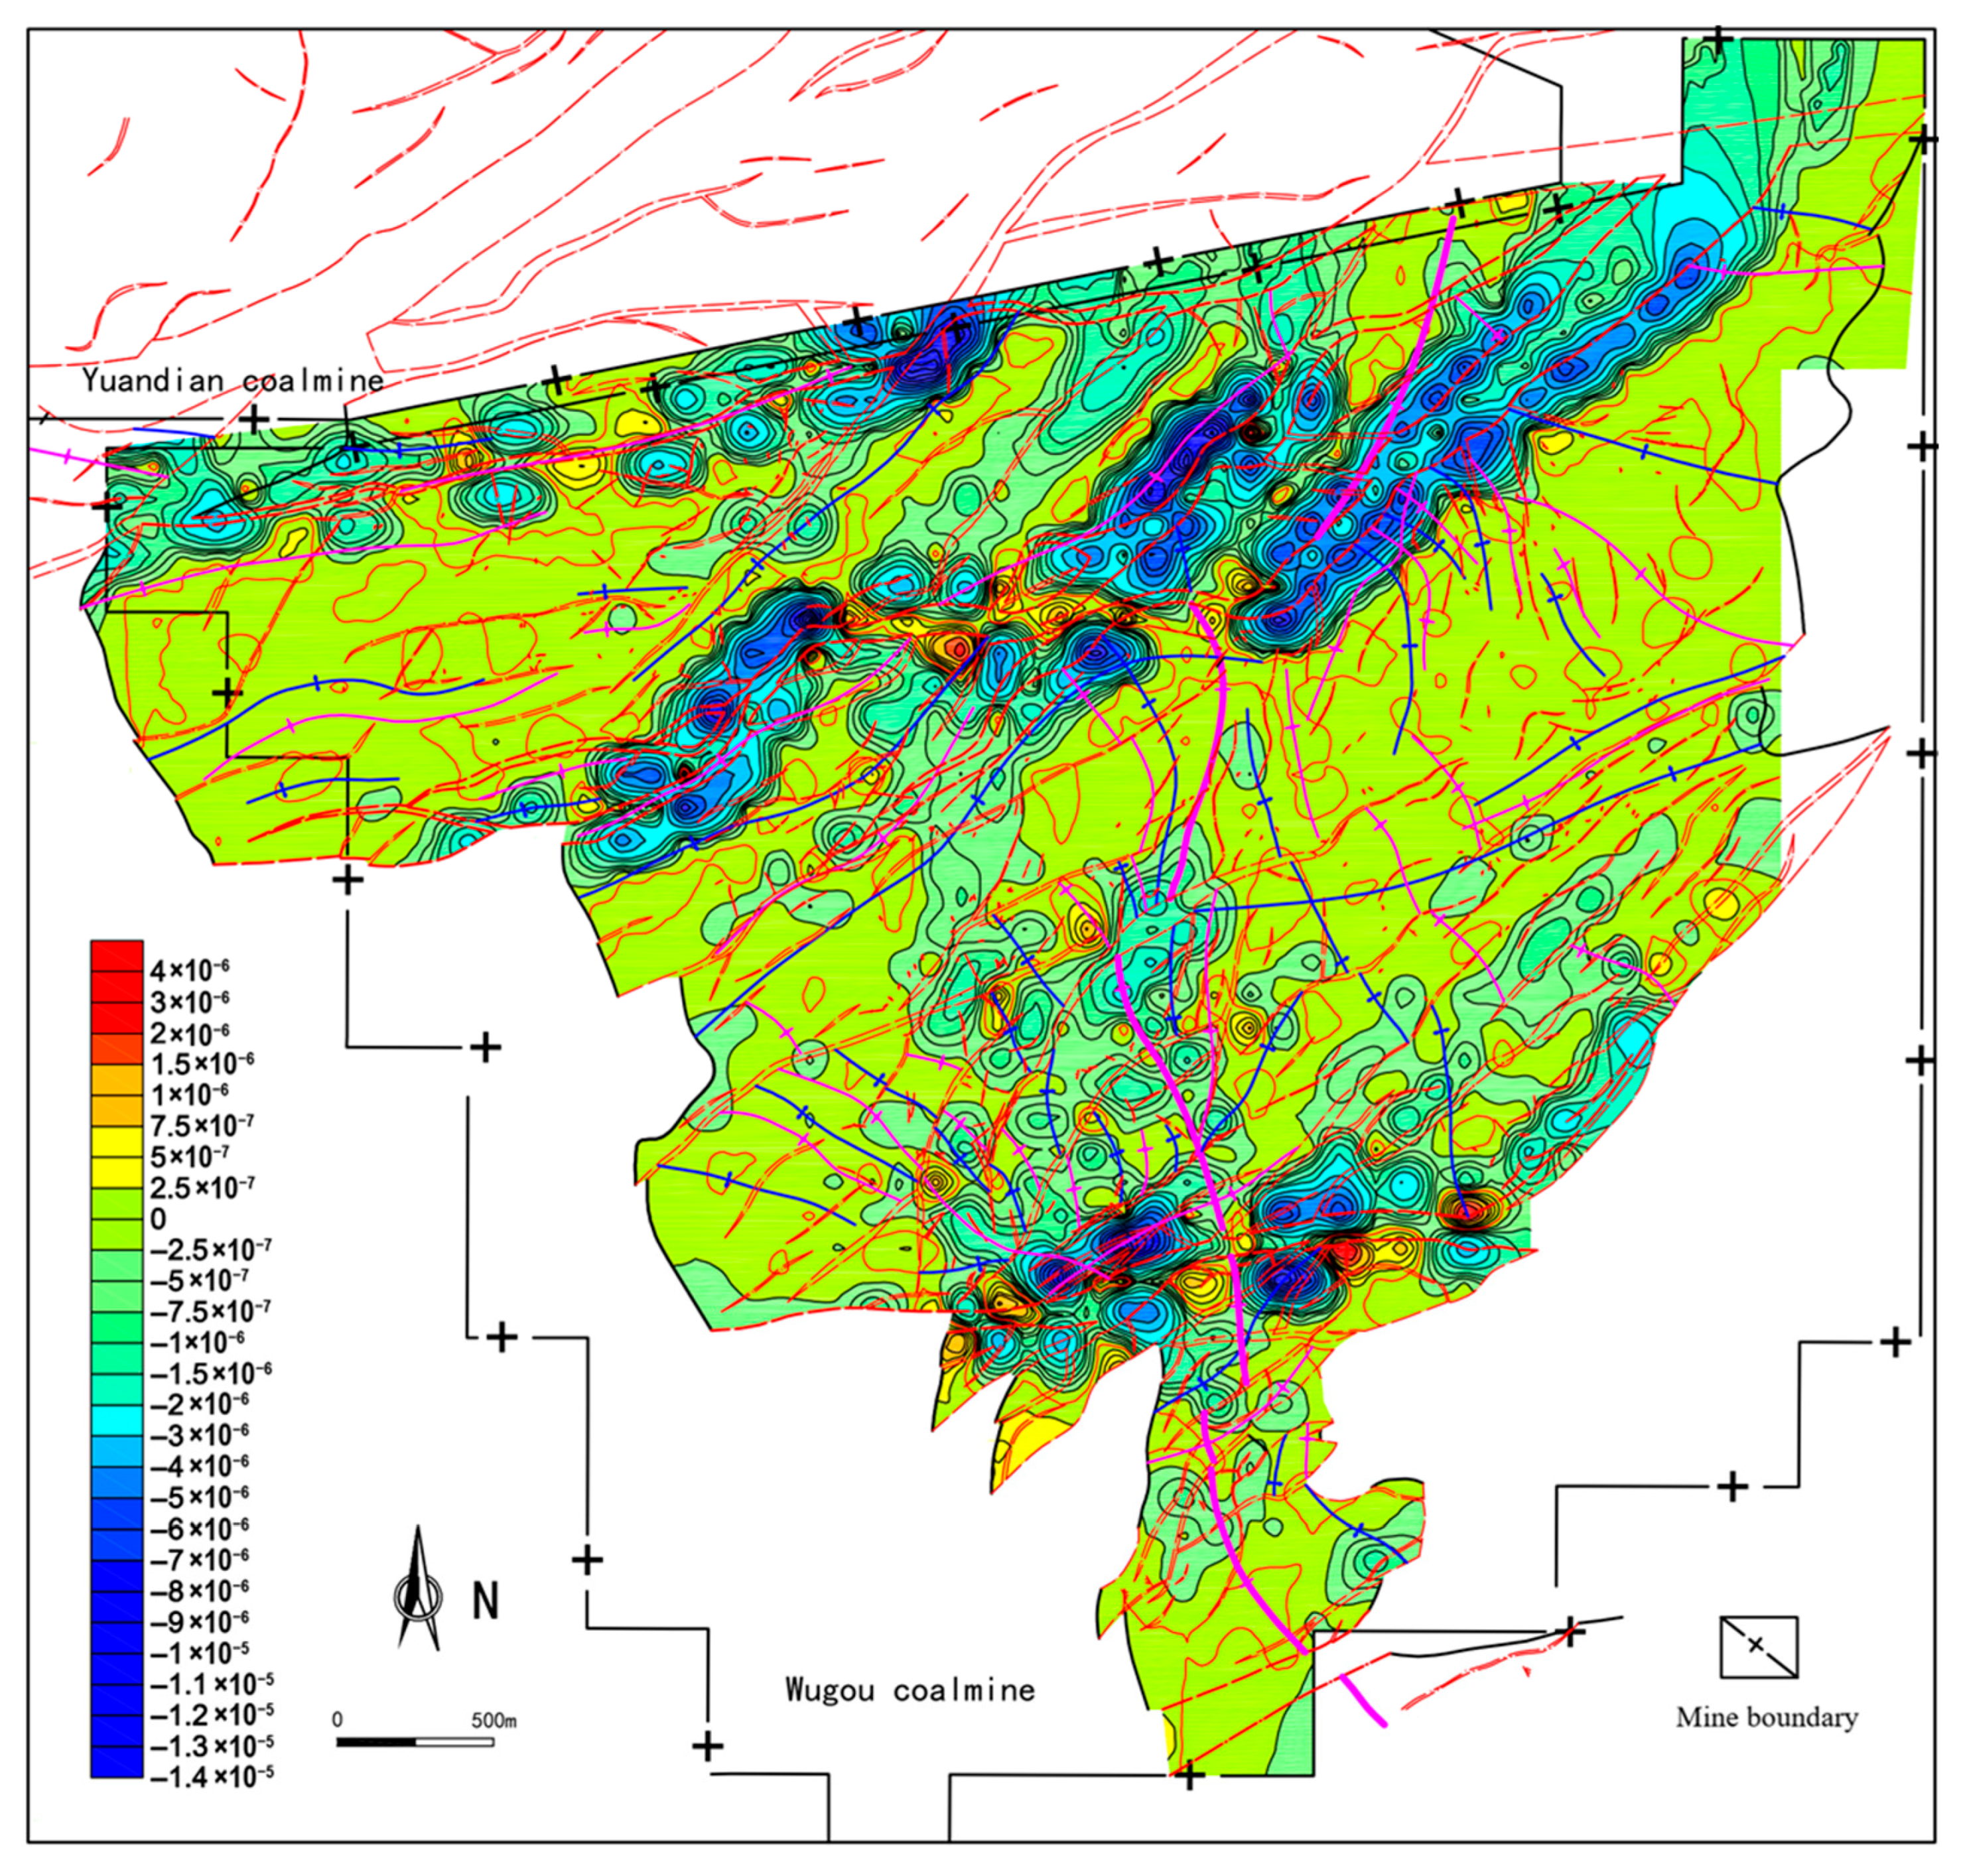
The mean curvature (Kmean) of the No. 10 coal seam in the Wugou Coal Mine ranges from −2.78 × 10⁻³ to 2.44 × 10⁻³, with an average of −1.30 × 10⁻⁵. The distribution of mean curvature exhibits a more complex pattern, characterized by alternating positive and negative value zones (Figure 12). It shows a particularly significant response to the development of very large and large normal faults: the zero-value line of mean curvature aligns with the distribution of fault lines, while the hanging walls and footwalls of faults correspond to negative low-value zones and positive high-value zones of mean curvature, respectively. Six anomaly bands are formed along the northern F16 fault, central F13 and F14 faults, and southern F9 fault, where extremely high and extremely low mean curvature zones develop adjacent to each other and extend in parallel.
Areas with positive mean curvature generally correspond to the development of anticline structures. For example, the NE-trending Sunjia Anticline and NEE-trending Sunwafang Anticline exhibit slightly high-value zones (0.0001 ≤ Kmean < 0.0005). Negative value zones are associated with syncline structures, while the zero-value line of mean curvature effectively reflects the spatial extent of fold development. The absolute value of mean curvature indicates the degree of fold deformation. The mean curvature in the mining area typically ranges from −0.0003 to 0.0003, reflecting overall weak fold deformation in the region (Figure 12). Additionally, relatively high mean curvature zones often indicate the development of dome structures. For instance, the isolated relatively high-value zone of mean curvature (Kmean > 0.0012) in the central Wugou East Dome structure, and the isolated relatively low-value zone (Kmean < −0.0006) in the Dalijia Basin structure formed by the superposition of the southern Dalijia Syncline and Wugou Syncline.

3.3.3. Evaluation of Gaussian Curvature

Gaussian curvature is defined as the product of the mutually orthogonal maximum and minimum curvature values at a point on a surface. The sign and magnitude of the Gaussian curvature fully reflect the degree of structural bending in the mining area. A high Gaussian curvature value indicates a significant degree of structural bending (Figure 13). Combining Gaussian curvature with maximum and minimum curvature analyses provides comprehensive insights into special structures resulting from fold superposition. When Gaussian curvature is positive, the principal curvatures at the point share the same sign. If the normal curvature in all directions is greater than zero, it manifests as a dome structure in geological terms; conversely, if the normal curvature is less than zero, it indicates a basin structure. When Gaussian curvature is negative, the principal curvatures have opposite signs, reflecting a saddle-shaped structure. When Gaussian curvature is zero, one of the principal curvatures must be zero, resulting in a cylindrical syncline or anticline; if both are zero, it represents a flat or dipping planar structure.
The Gaussian curvature (Kg) of the No. 10 coal seam in the Wugou Coal Mine ranges from −1.46 × 10⁻⁵ to 4.10 × 10⁻⁶, with an average of −7.20 × 10⁻⁷. The distribution of Gaussian curvature exhibits high complexity and heterogeneity, characterized by generally small values (mostly between −2.50 × 10⁻⁷ and 2.50 × 10⁻⁷), while low-value and high-value anomaly zones appear as isolated patchy and bead-like patterns. Gaussian curvature effectively indicates the extension and distribution of superimposed structures, though the small scale and weak deformation of superimposed folds in the Wugou Coal Mine result in no significant Gaussian curvature anomalies. Extremely low Gaussian curvature zones (Kg < 5.00 × 10⁻⁶) develop as isolated patchy and bead-like patterns along the hanging walls and footwalls of the four major large-scale normal faults. Relatively few extremely high Gaussian curvature zones (Kg > 7.50 × 10⁻⁷) are observed, mostly located at fault bends or intersections with fold structures. In the southwestern part of the mining area, convex-upward arc-shaped faults and derived fold zones form low-value Gaussian curvature zones (−2.00 × 10⁻⁶Kg < −2.50 × 10⁻⁷). Overall, Gaussian curvature serves as a robust indicator for characterizing the degree of coal seam deformation, the development of superimposed fold structures, and the distribution and combination of large-scale faults.

3.4. Comprehensive Evaluation of Structural Complexity

The above research reveals that fractal dimension and structural curvature exhibit distinct characterization effectiveness and sensitivity toward fault development density, fault displacement, fold deformation intensity, structural type, and superposed fold patterns. Specifically, fractal dimension effectively reflects the planar development density of faults, but demonstrates limited capability in quantitatively characterizing fault scale, throw, and fold structures. Different types of curvature parameters exhibit varying sensitivities to different structural types or structural positions. Maximum curvature and minimum curvature serve as effective indicators for characterizing anticlines, the footwalls of normal faults, synclines, and the hanging walls of normal faults, respectively. Their magnitudes are determined by fault throw and the degree of fold bending deformation, reflecting the influence scope and intensity of fold and fault structures. Since the positive and negative values of mean curvature depend on the magnitudes of maximum and minimum curvature, mean curvature provides a comprehensive characterization of various structural types and positions. This is evidenced by the alignment of the mean curvature zero-value line with fault traces, while the cores of synclines and the hanging walls of normal faults correspond to negative low-value zones of mean curvature, and the cores of anticlines and the footwalls of normal faults correspond to positive high-value zones. Gaussian curvature proves to be an effective indicator for quantifying coal seam deformation intensity and identifying superposed fold structures.
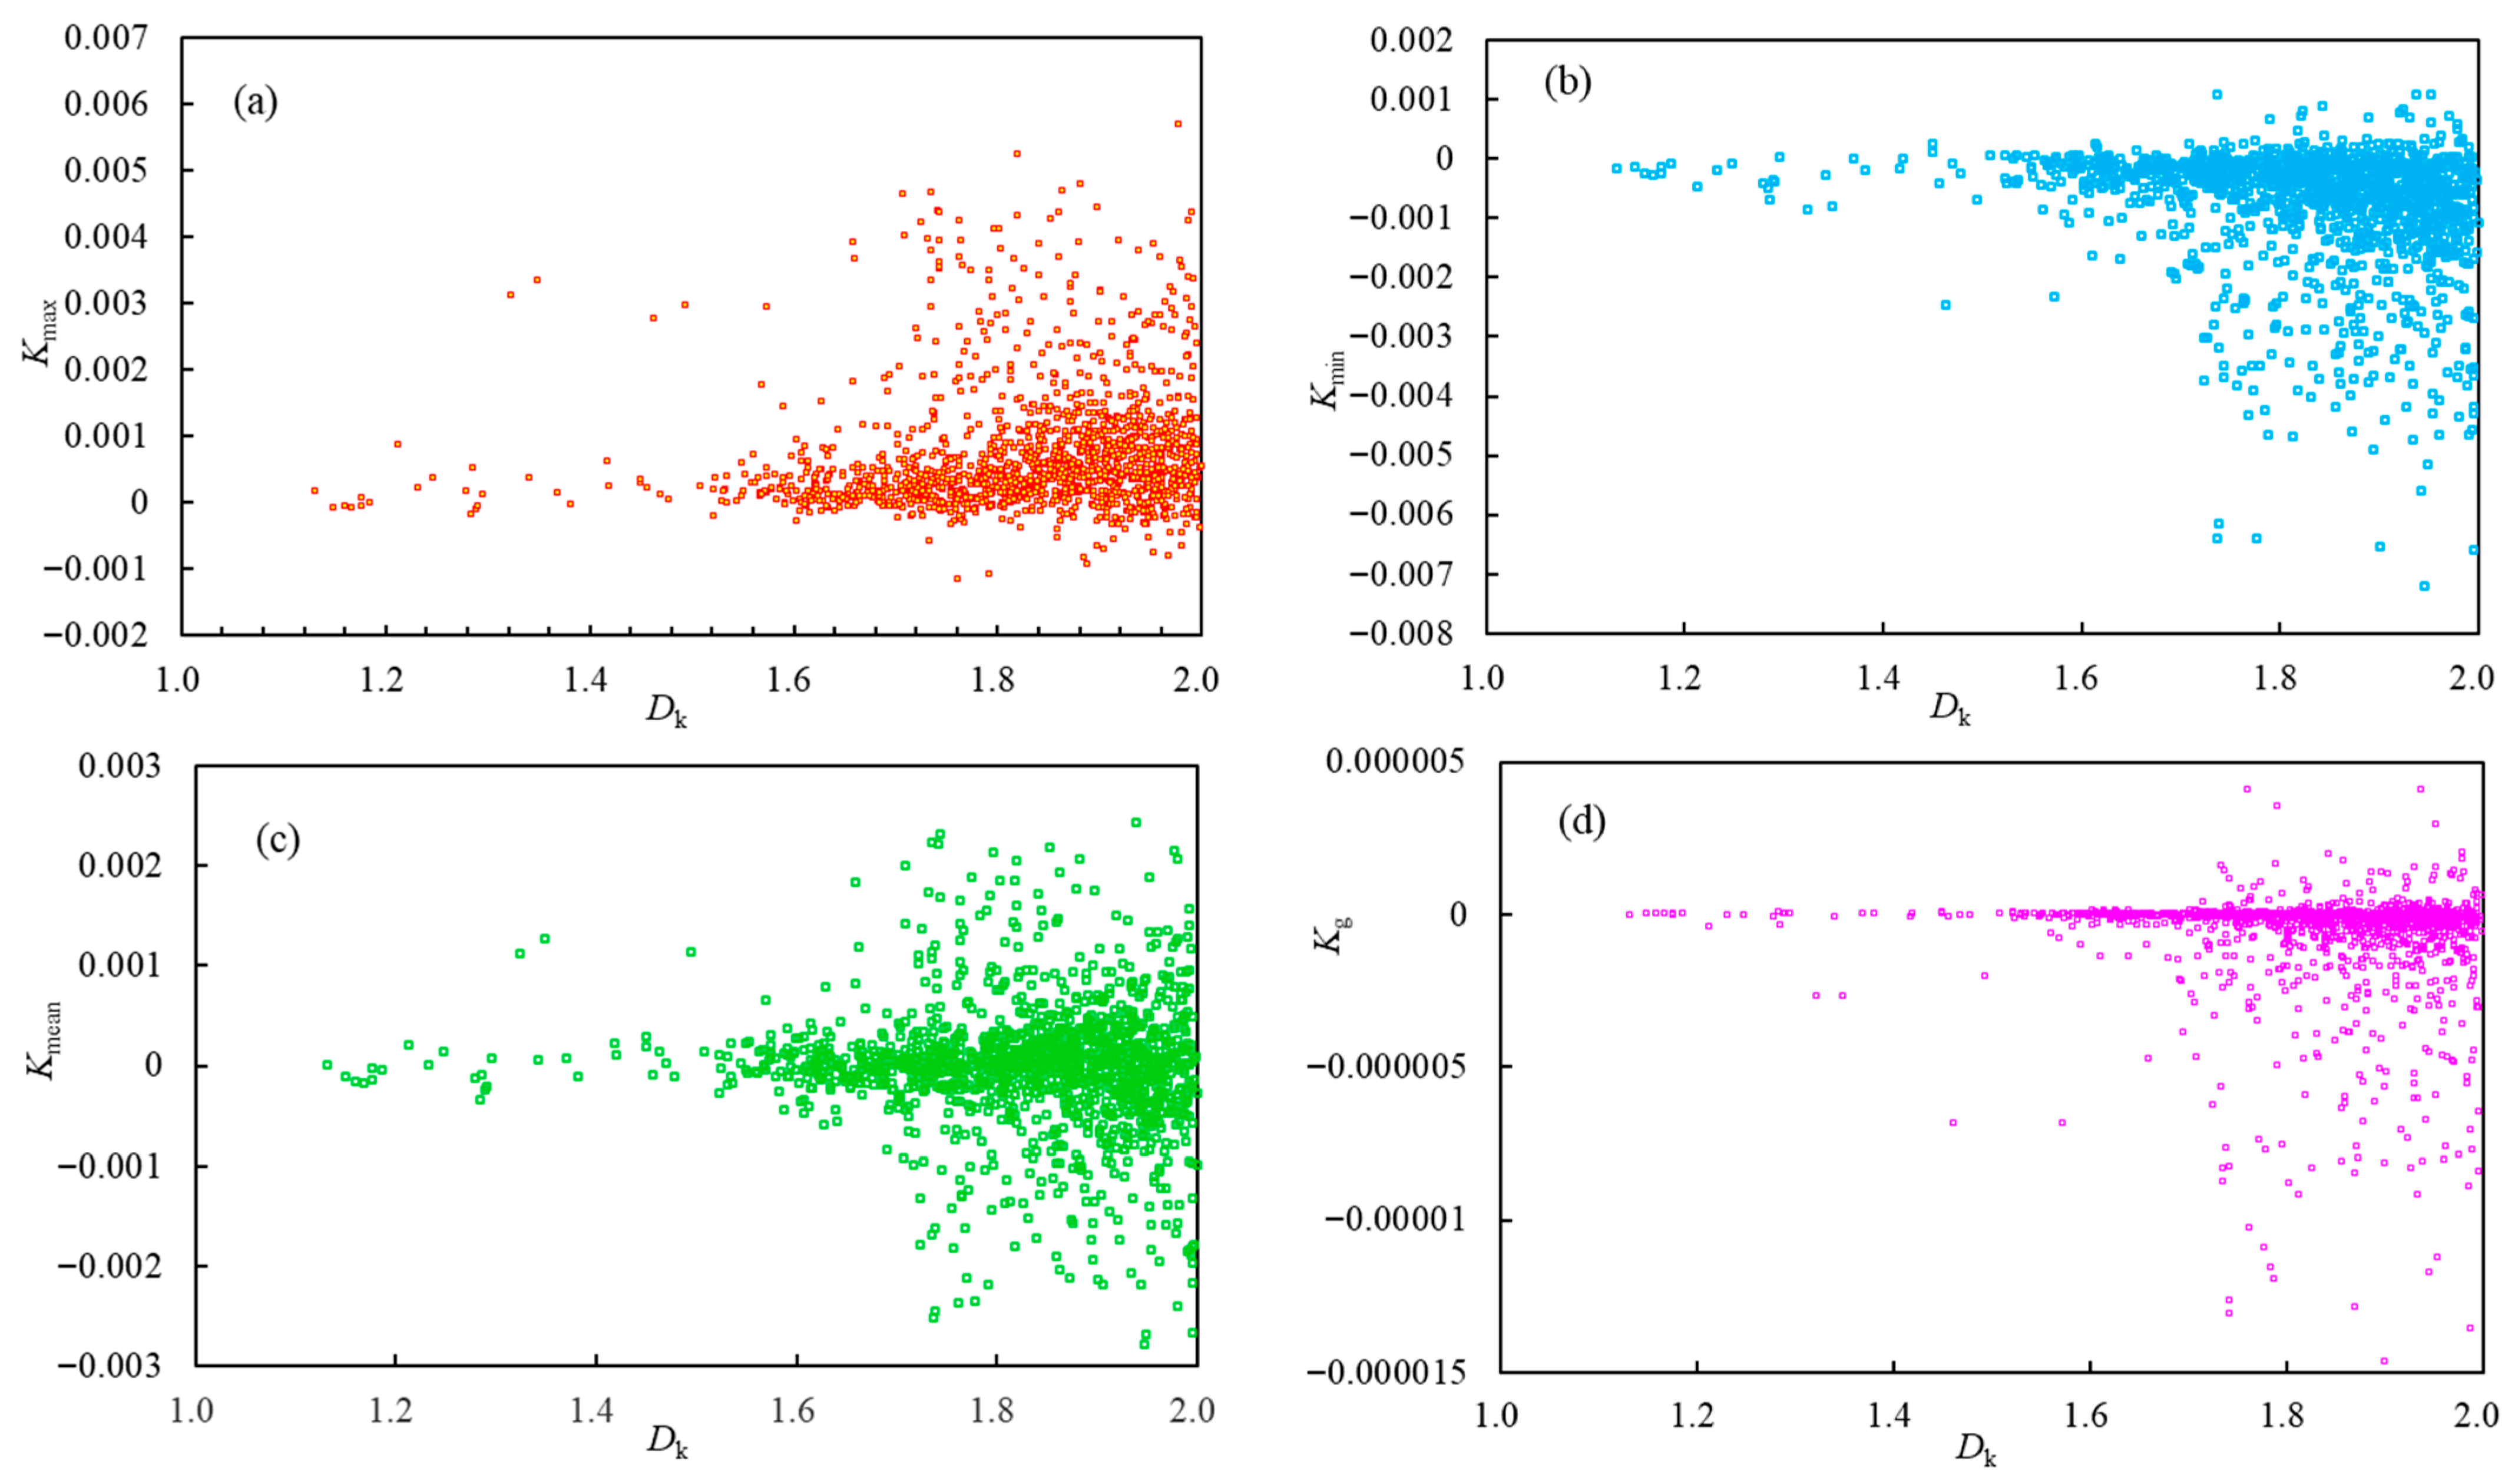
A comparative analysis of curvature and fractal dimension across different evaluation units (Figure 14) reveals a notably scattered distribution between the two parameters. Overall, as the fractal dimension of faults increases, the absolute values of various curvature types generally exhibit an increasing trend, reflecting the correlation between densely distributed fault zones and large fault displacement/coal seam disruption. However, most data points in the study area display relatively low curvature values, consistent with the regional geological characteristics of weak fold deformation and the predominance of small-scale faults with displacements of 0–5 m. Particularly, data points characterized by high fractal dimension but low curvature values correspond to areas with dense development of small-scale faults, where the structural complexity remains relatively low.
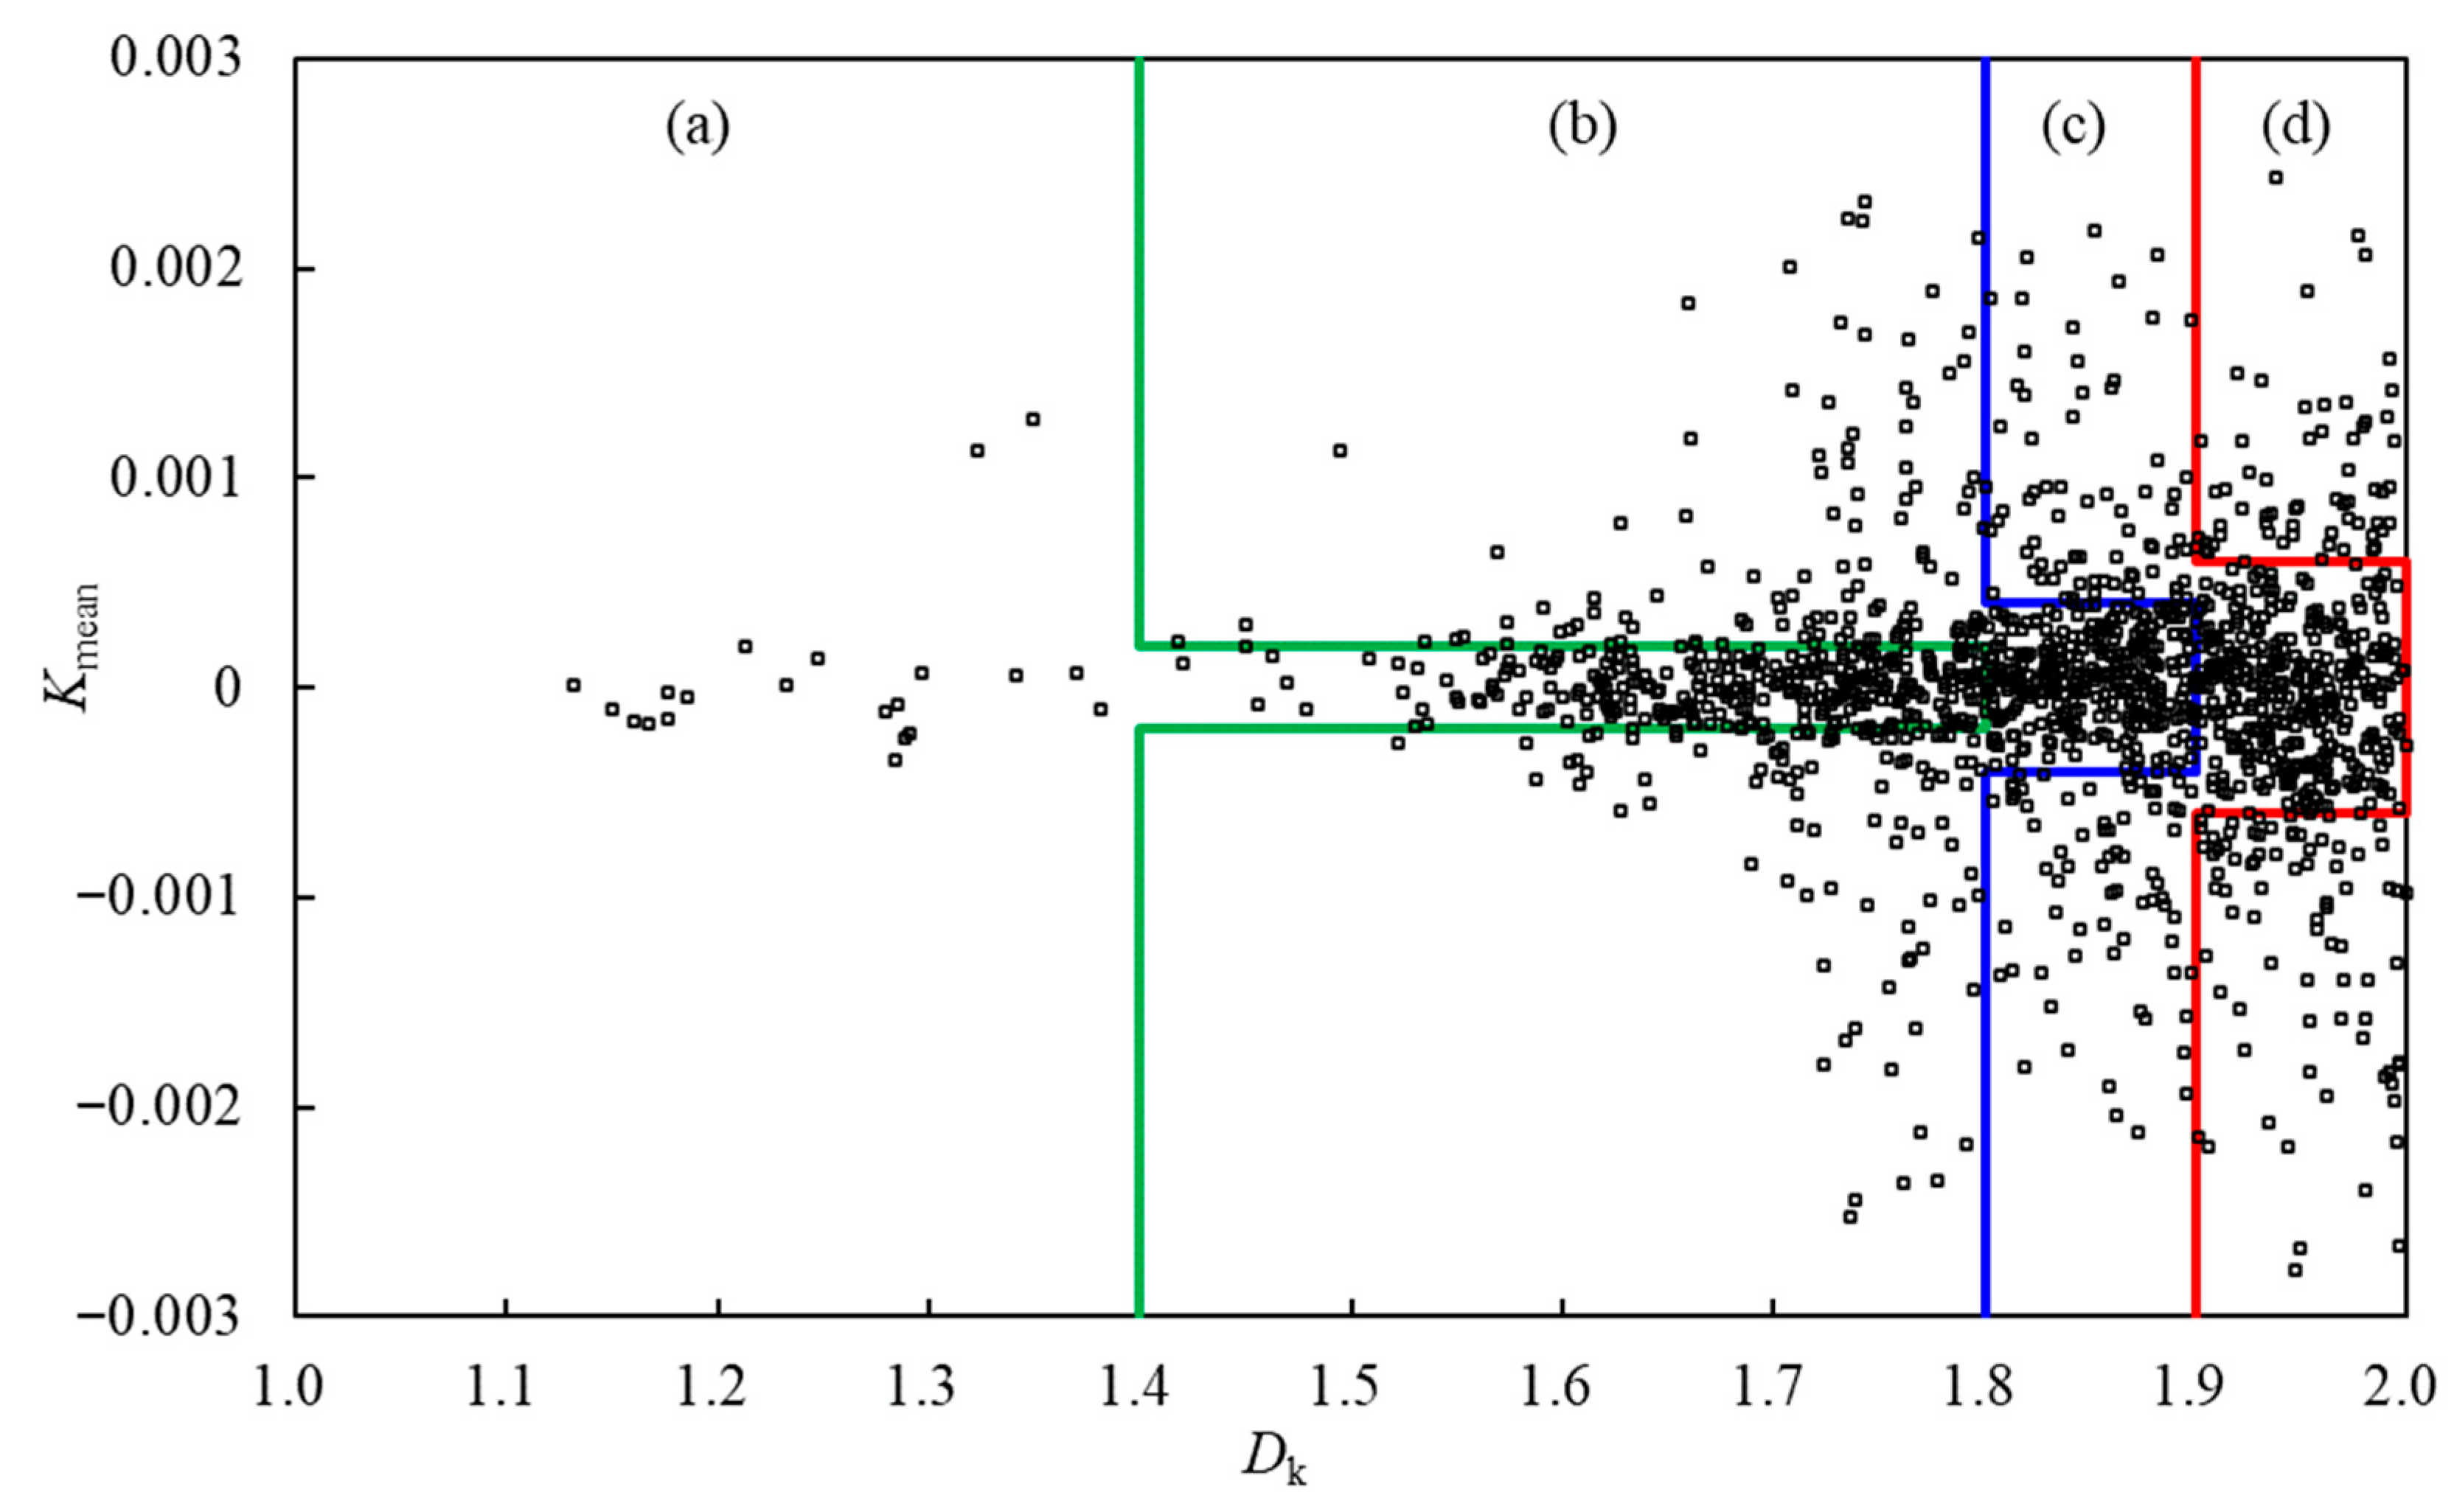
Based on the planar distribution and structural responses of curvature and fractal dimension, along with mine deformation characteristics, two indicators were selected: mean curvature and fault fractal dimension. Using these, a comprehensive quantitative evaluation model for structural complexity was developed (Figure 15). This model divides the area into four distinct zones: extremely complex, complex, moderately complex, and simple structures.
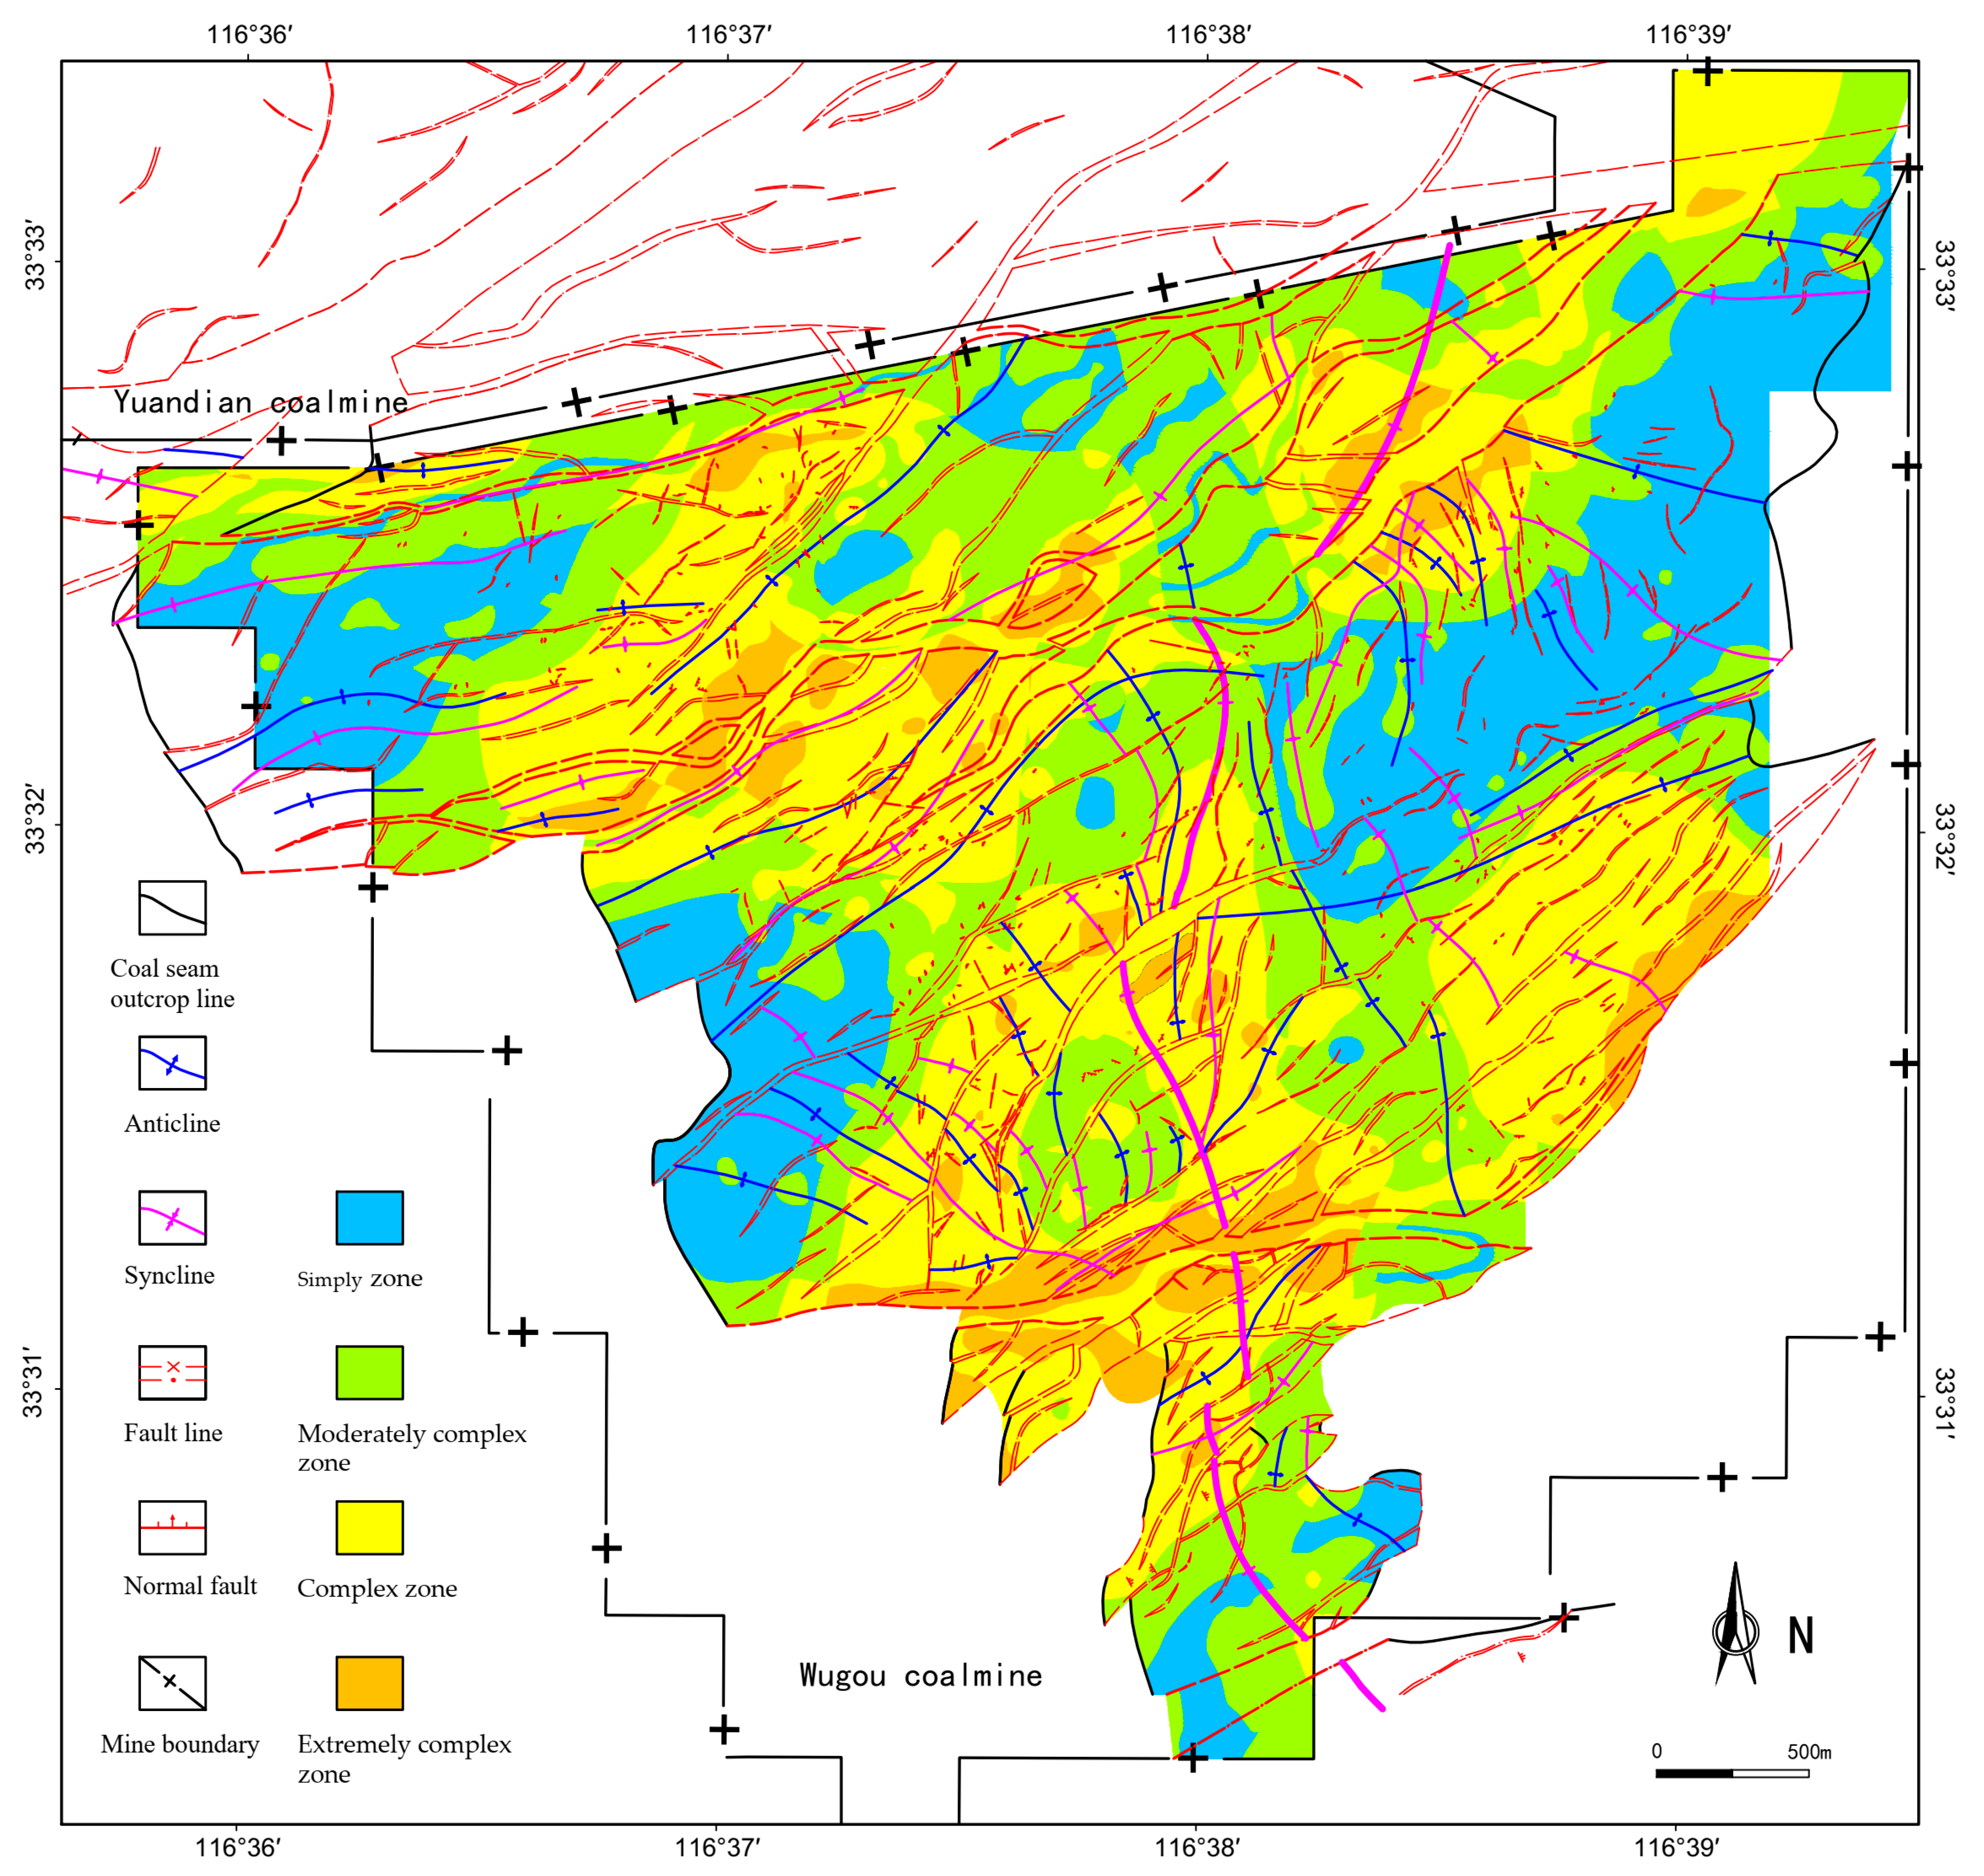
The classification criteria and structural characteristics for each zone are detailed in Table 2. The application of this fractal-curvature model to the Wugou Coal Mine demonstrates its enhanced capability in distinguishing structural types and deformation intensities compared to evaluations based solely on fractal analysis (Figure 16).
Notably, the areal extent of both extremely complex and complex structural zones is significantly reduced. The extremely complex zones are predominantly located along the peripheries of major faults F9, F13, F14, and F16, where secondary faults and folds intensively develop. Complex structural zones occur in areas with dense distributions of large-scale faults and their associated secondary structures, as well as in regions adjacent to major faults showing sparse secondary development. Approximately half of the study area falls under the complex structural category. Moderately complex zones correlate with sparsely distributed large faults and folds, accompanied by minor fault development. Three structurally simple zones are identified in the eastern, western, and northwestern parts of the study area, characterized by sparse small-scale faulting and minimal fold deformation.
The comprehensive quantitative evaluation of structural complexity using the fractal-curvature method has also been applied to the Xinjing Coal Mine and Yushupo Coal Mine in Shanxi Province, as well as the Suntan Coal Mine in Huaibei. These mines feature distinct geological settings, structural development characteristics, and deformation intensities, and the evaluation results have achieved excellent outcomes in all cases.

4. Conclusions

This study investigated the structural development characteristics of the Wugou Coal Mine through stereographic projection analysis, fold superposition patterns, and fault combination laws. Furthermore, it comprehensively applied fractal theory and structural curvature methods to quantitatively characterize the structural types. The conclusions are as follows:
(1)
The geological structure of Wugou Coal Mine is complex and highly deformed. It is a composite superimposed fold structure combination with dense faults. The fold structure has a complex morphology and weak deformation. The parallel, branching, en echelon, brush-like, and arc-shaped folds combination types are observed. Superimposed folds are mainly classified into oblique-crossing, crossing, deflection, oblique-limiting, and enhancement types. The fold structures are products of four phases of tectonic deformation. Fault structures are exceptionally well-developed, dominated by normal faults that generally exhibit a step-like assemblage pattern. Parallel fault combinations are the most common planar fault type in the mine.
(2)
The fractal dimension effectively characterizes the development degree and distribution density of faults, but demonstrates limited capability in quantitatively characterizing fault scale, throw, and fold structures. The planar distribution of the capacity dimension (Dk) exhibits significant variation and distinct zonation. According to the fault capacity dimension values, the structural complexity of the study area is classified into four zones: an Extremely Complex Fault Zone (1.9 ≤ Dk < 2.0), a Complex Fault Zone (1.8 ≤ Dk < 1.9), a Moderately Developed Fault Zone (1.4 ≤ Dk < 1.8), and a Simply Developed Fault Zone (0 ≤ Dk < 1.4).
(3)
Different types of curvature parameters exhibit varying sensitivities to different structural types or structural positions. Maximum curvature and minimum curvature serve as effective indicators for characterizing anticlines, the footwalls of normal faults, synclines, and the hanging walls of normal faults, respectively. Their magnitudes are determined by fault throw and the degree of fold bending deformation, reflecting the influence scope and intensity of fold and fault structures. Mean curvature provides a comprehensive characterization of various structural types and positions. Gaussian curvature proves to be an effective indicator for quantifying coal seam deformation intensity and identifying superposed fold structures.
(4)
Based on the planar distribution and structural responses of curvature and fractal dimension, by combining the strengths of fractal analysis and curvature characterization, a fractal-curvature integrated evaluation model was developed to assess structural complexity. This model facilitates a high-resolution quantitative evaluation, delineating the geological structures of the Wugou Coal Mine into zones of extremely complex, complex, moderately complex, and simple structures.

Author Contributions

M.L.: Investigation, Methodology, Writing the original draft, Funding acquisition. B.J.: Conceptualization, review and editing. F.L.: Validation, review and editing. All authors have read and agreed to the published version of the manuscript.

Funding

The research was supported by the National Natural Science Foundation of China (41402136, 41702172).

Data Availability Statement

All of the data and models generated or used in this study are available from the corresponding author upon request.

Conflicts of Interest

The authors declare no conflicts of interest.

References

  1. Bates, B.; McIntosh, J.; Lohse, K.; Brooks, P. Influence of groundwater flow paths, residence times and nutrients on the extent of microbial methanogenesis in coal beds: Powder River Basin, USA. Chem. Geol. 2011, 284, 45–61. [Google Scholar] [CrossRef]
  2. Ma, T.; Liu, J.; Fu, J.; Wu, B. Drilling and completion technologies of coalbed methane exploitation: An overview. Int. J. Coal Sci. Technol. 2022, 9, 1–31. [Google Scholar] [CrossRef]
  3. Bachu, S.; Michael, K. Possible controls of hydrogeological and stress regimes on the producibility of coalbed methane in Upper Cretaceous-Tertiary strata of the Alberta Basin, Canada. AAPG Bull. 2003, 87, 1729–1754. [Google Scholar] [CrossRef]
  4. Karacan, C.; Goodman, G. Analyses of geological and hydrodynamic controls on methane emissions experienced in a Lower Kittanning coal mine. Int. J. Coal Geol. 2012, 98, 110–127. [Google Scholar] [CrossRef] [PubMed]
  5. Cai, Y.; Liu, D.; Yao, Y.; Li, J.; Qiu, Y. Geological controls on prediction of coalbed methane of No.3 coal seam in Southern Basin, North China. Int. J. Geol. 2011, 88, 101–112. [Google Scholar] [CrossRef]
  6. Liu, Z.; Zhao, S.; Hu, Z.; Shen, B.; Feng, D.; Zhang, J.; Ye, J.; Ma, C.; Dong, Z. Characteristics and controlling factors of coal-measure unconventional reservoirs—A case study of the Carboniferous-Permian in the Ordos Basin. Unconvent. Resour. 2025, 6, 100153. [Google Scholar]
  7. Jiang, B.; Qin, Y.; Ju, Y.; Wang, J. Research on tectonic stress field of generate and reservoir of coalbed methane. J. China Univ. Min. Technol. 2005, 34, 565–569, (In Chinese with English abstract). [Google Scholar]
  8. Wang, J.; Jiang, B. Using Fuzzy Artificial Neural Network to Evaluate the Mine Structure. J. China Univ. Min. Technol. 2005, 34, 609–612, (In Chinese with English abstract). [Google Scholar]
  9. Ju, Y.; Wang, G.; Jiang, B.; Hou, Q. Microcosmic analysis of ductile shearing zones of coal seams of brittle deformation domain in superficial lithosphere. Sci. China Earth Sci. 2004, 47, 393–404. [Google Scholar] [CrossRef]
  10. Ju, Y.; Wei, M.; Xue, C. Control of basin-mountain evolution on the occurrence of deep coal and coalbed methane in North China. J. China Univ. Min. Technol. 2011, 40, 390–398, (In Chinese with English abstract). [Google Scholar]
  11. Fan, C.; Li, S.; Luo, M.; Du, W.; Yang, Z. Coal and gas outburst dynamic system. Int. J. Min. Sci. Technol. 2017, 27, 49–55. [Google Scholar] [CrossRef]
  12. Li, H.; Ogawa, Y. Pore structure of sheared coals and related coalbed methane. Environ. Geol. 2001, 40, 1455–1461. [Google Scholar] [CrossRef]
  13. Li, M.; Jiang, B.; Lin, S.; Wang, J.; Ji, M.; Qu, Z. Tectonically deformed coal types and pore structures in Puhe and Shanchahe coal mines in western Guizhou. Int. J. Min. Sci. Technol. 2011, 21, 353–357. [Google Scholar] [CrossRef]
  14. Li, M.; Jiang, B.; Lin, S.; Lan, F.; Wang, J. Structural controls on coalbed methane reservoirs in Faer coal mine, Southwest China. J. Earth Sci. 2013, 24, 437–448. [Google Scholar] [CrossRef]
  15. Liu, J.; Jiang, B.; Li, M.; Qu, Z.; Wang, L.; Li, L. Structural control on pore-fracture characteristics of coals from Xinjing coal mine, northeastern Qinshui basin, China. Arab. J. Geosci. 2015, 8, 4421–4431. [Google Scholar] [CrossRef]
  16. Li, J.; Min, Z.; Chen, X.; Li, D.; Wang, S.; Song, T. Connotation analyses, source-reservoir assemblage types and development potential of unconventional hydrocarbon in China. Acta. Pet. Sin. 2016, 2, 135–148. [Google Scholar]
  17. Keshavarz, A.; Sakurovs, R.; Grigore, M.; Sayyafzadeh, M. Effect of maceral composition and coal rank on gas diffusion in Australian coals. Int. J. Coal Geol. 2017, 173, 65–75. [Google Scholar] [CrossRef]
  18. Li, R.; Wang, Q.; Wang, X.; Liu, X.; Li, J.; Zhang, Y. Relationship analysis of the degree of fault complexity and the water irruption rate, based on fractal theory. Mine Water Environ. 2017, 36, 18–23. [Google Scholar] [CrossRef]
  19. Zhang, G.; Guo, J.; Xu, B.; Xu, L.; Dai, Z.; Yin, S.; Mohamad, R.S. Quantitative analysis and evaluation of coal mine geological structures based on fractal theory. Energies 2021, 14, 1925. [Google Scholar] [CrossRef]
  20. Guarnieri, P. Regional strain derived from fractal analysis applied to strike slip fault systems in NW Sicily. Chaos Solitons Fractals 2002, 14, 71–76. [Google Scholar] [CrossRef]
  21. Carpinteri, A.; Paggi, M. Size scale effects on strength, friction and fracture energy of faults: A unified interpretation according to fractal geometry. Rock Mech. Rock Eng. 2008, 41, 735–746. [Google Scholar] [CrossRef]
  22. Sengupta, P.; Nath, S.K.; Thingbaijam, K.K.S.; Mistri, S. Fractal analysis of major faults in India on a regional scale. J. Geol. Soc. India 2011, 78, 226. [Google Scholar] [CrossRef]
  23. Yang, B.; Yuan, J.; Duan, L.; Liu, Q. Using GIS and fractal theory to evaluate degree of fault complexity and water yield. Mine Water Environ. 2018, 38, 261–267. [Google Scholar] [CrossRef]
  24. Aviles, C.A.; Scholz, C.H.; Boatwright, J. Fractal analysis applied to characteristic segments of the San Andreas fault. J. Geophys. Res. Solid Earth 1987, 92, 331–344. [Google Scholar] [CrossRef]
  25. Hirata, T. Fractal dimension of fault systems in Japan: Fractal structure in rock fracture geometry at various scales. Pure Appl. Geophys. 1989, 131, 157–170. [Google Scholar] [CrossRef]
  26. Sukmono, S.; Zen, M.T.; Kadir, W.G.A.; Hendrajaya, L.; Santoso, D.; Dubois, J. Fractal geometry of the Sumatra active fault system and its geodynamical implications. J. Geodyn. 1996, 22, 1–9. [Google Scholar] [CrossRef]
  27. Pérez, L.R.; Paredes, C.; Muñoz, M.A. Relationship between the fractal dimension anisotropy of the spatial faults distribution and the paleostress fields on a Variscan granitic massif (Central Spain): The F parameter. J. Struct. Geol. 2005, 27, 663–677. [Google Scholar] [CrossRef]
  28. Carpinteri, A.; Paggi, M. A fractal interpretation of size scale effects on strength, friction and fracture energy of faults. Chaos Soliton Fractals 2009, 39, 540–546. [Google Scholar] [CrossRef]
  29. Babanouri, N.; Nasab, S.K.; Sarafrazi, S. A hybrid particle swarm optimization and multi-layer perceptron algorithm for bivariate fractal analysis of rock fractures roughness. Int. J. Rock Mech. Min. Sci. 2013, 60, 66–74. [Google Scholar] [CrossRef]
  30. Zhang, J.; Xiao, X.; Wang, J.; Lin, W.; Han, D.; Wang, C.; Li, Y.; Xiong, Y.; Zhang, X. Pore structure and fractal characteristics of coal-bearing Cretaceous Nenjiang shales from Songliao Basin, Northeast China. J. Nat. Gas Geosci. 2024, 9, 197–208. [Google Scholar] [CrossRef]
  31. Liu, Z.; Han, J.; Yang, H.; Lv, J.; Dong, S. A new model for coal gas seepage based on fracture-pore fractal structure characteristics. Int. J. Rock Mech. Min. Sci. 2024, 173, 105626. [Google Scholar] [CrossRef]
  32. Lisle, R.J. Detection of zones of abnormal strains in structures using Gaussian curvature analysis. AAPG Bull. 1994, 78, 1811–1819. [Google Scholar] [CrossRef]
  33. Ozkaya, S.I. QUADRO—A program to estimate principal curvatures of folds. Comput. Geosci. 2002, 28, 467–472. [Google Scholar] [CrossRef]
  34. Shen, J.; Fu, X.; Qin, Y.; Liu, Z. Control actions of structural curvature of coal-seam floor on coalbed gas in the NO.8 coal mine of Pingdingshan. J. China Coal Soc. 2010, 35, 586–589, (In Chinese with English abstract). [Google Scholar]
  35. Guo, C.; Xia, Y.; Wei, Z.; Sun, X.; Dai, G.; Wang, S.; Shen, J.; Ren, Y. Coalbed methane accumulation characteristics and type classification in Hancheng mining area. J. China Coal Soc. 2018, 43 (Suppl. S1), 192–202, (In Chinese with English abstract). [Google Scholar]
  36. Zhou, P.; Liang, L.; Bai, L.; Zeng, J. Study on the structural complexity of the yangmeishu syncline based on fractal theory. Nat. Gas Technol. Econ. 2019, 13, 25–27+80, (In Chinese with English abstract). [Google Scholar]
  37. Liu, J.; Yang, S.; Chen, N.; Zhao, X. Forecasting method of tectoclase in the igneous reservoirs using a curvature of the microtectonics. J. China Univ. Min. Technol. 2009, 38, 815–819, (In Chinese with English abstract). [Google Scholar]
  38. Jiang, B.; Qu, Z.; Wang, G.G.X.; Li, M. Effects of structural deformation on formation of coalbed methane reservoirs in Huaibei Coalfield, China. Int. J. Coal Geol. 2010, 82, 175–183. [Google Scholar] [CrossRef]
  39. Roberts, A. Curvature attributes and their application to 3D interpreted horizons. First Break 2001, 19, 85–100. [Google Scholar] [CrossRef]
  40. Anderson, J.G.C. Superposition of Caledonoid Folds on an older fold-system in the Dalradians of Malin Head. Geol. Mag. 1955, 92, 83–84. [Google Scholar] [CrossRef]
  41. Ramsay, G.J. Geology of Folds. Nature 1968, 217, 293. [Google Scholar] [CrossRef]
  42. Bühn, B.; Stanistreet, L.G.; Charlesworth, E.G. Fold shape variation controlling interference mechanisms and patterns during oblique fold superpositions in the Damara Orogen, eastern Namibia. Ann. Tectonol. 1993, 7, 113–128. [Google Scholar]
  43. Mazzoli, S.; Carnemolla, S. Effects of the superposition of compaction and tectonic strain during folding of a multilayer sequence-model and observations. J. Struct. Geol. 1993, 15, 277–291. [Google Scholar] [CrossRef]
  44. Zhou, P.; Chen, X.; Zhang, Y.; Shao, Z.; Li, B.; Jiang, T.; Xu, D. Obstacle leads to local stress reorientation: Insights from the formation mechanism of the Maiduoshan superimposed fold in the Weiningbeishan fold-thrust belt, NW China. J. Asian Earth Sci. 2024, 276, 103361. [Google Scholar] [CrossRef]
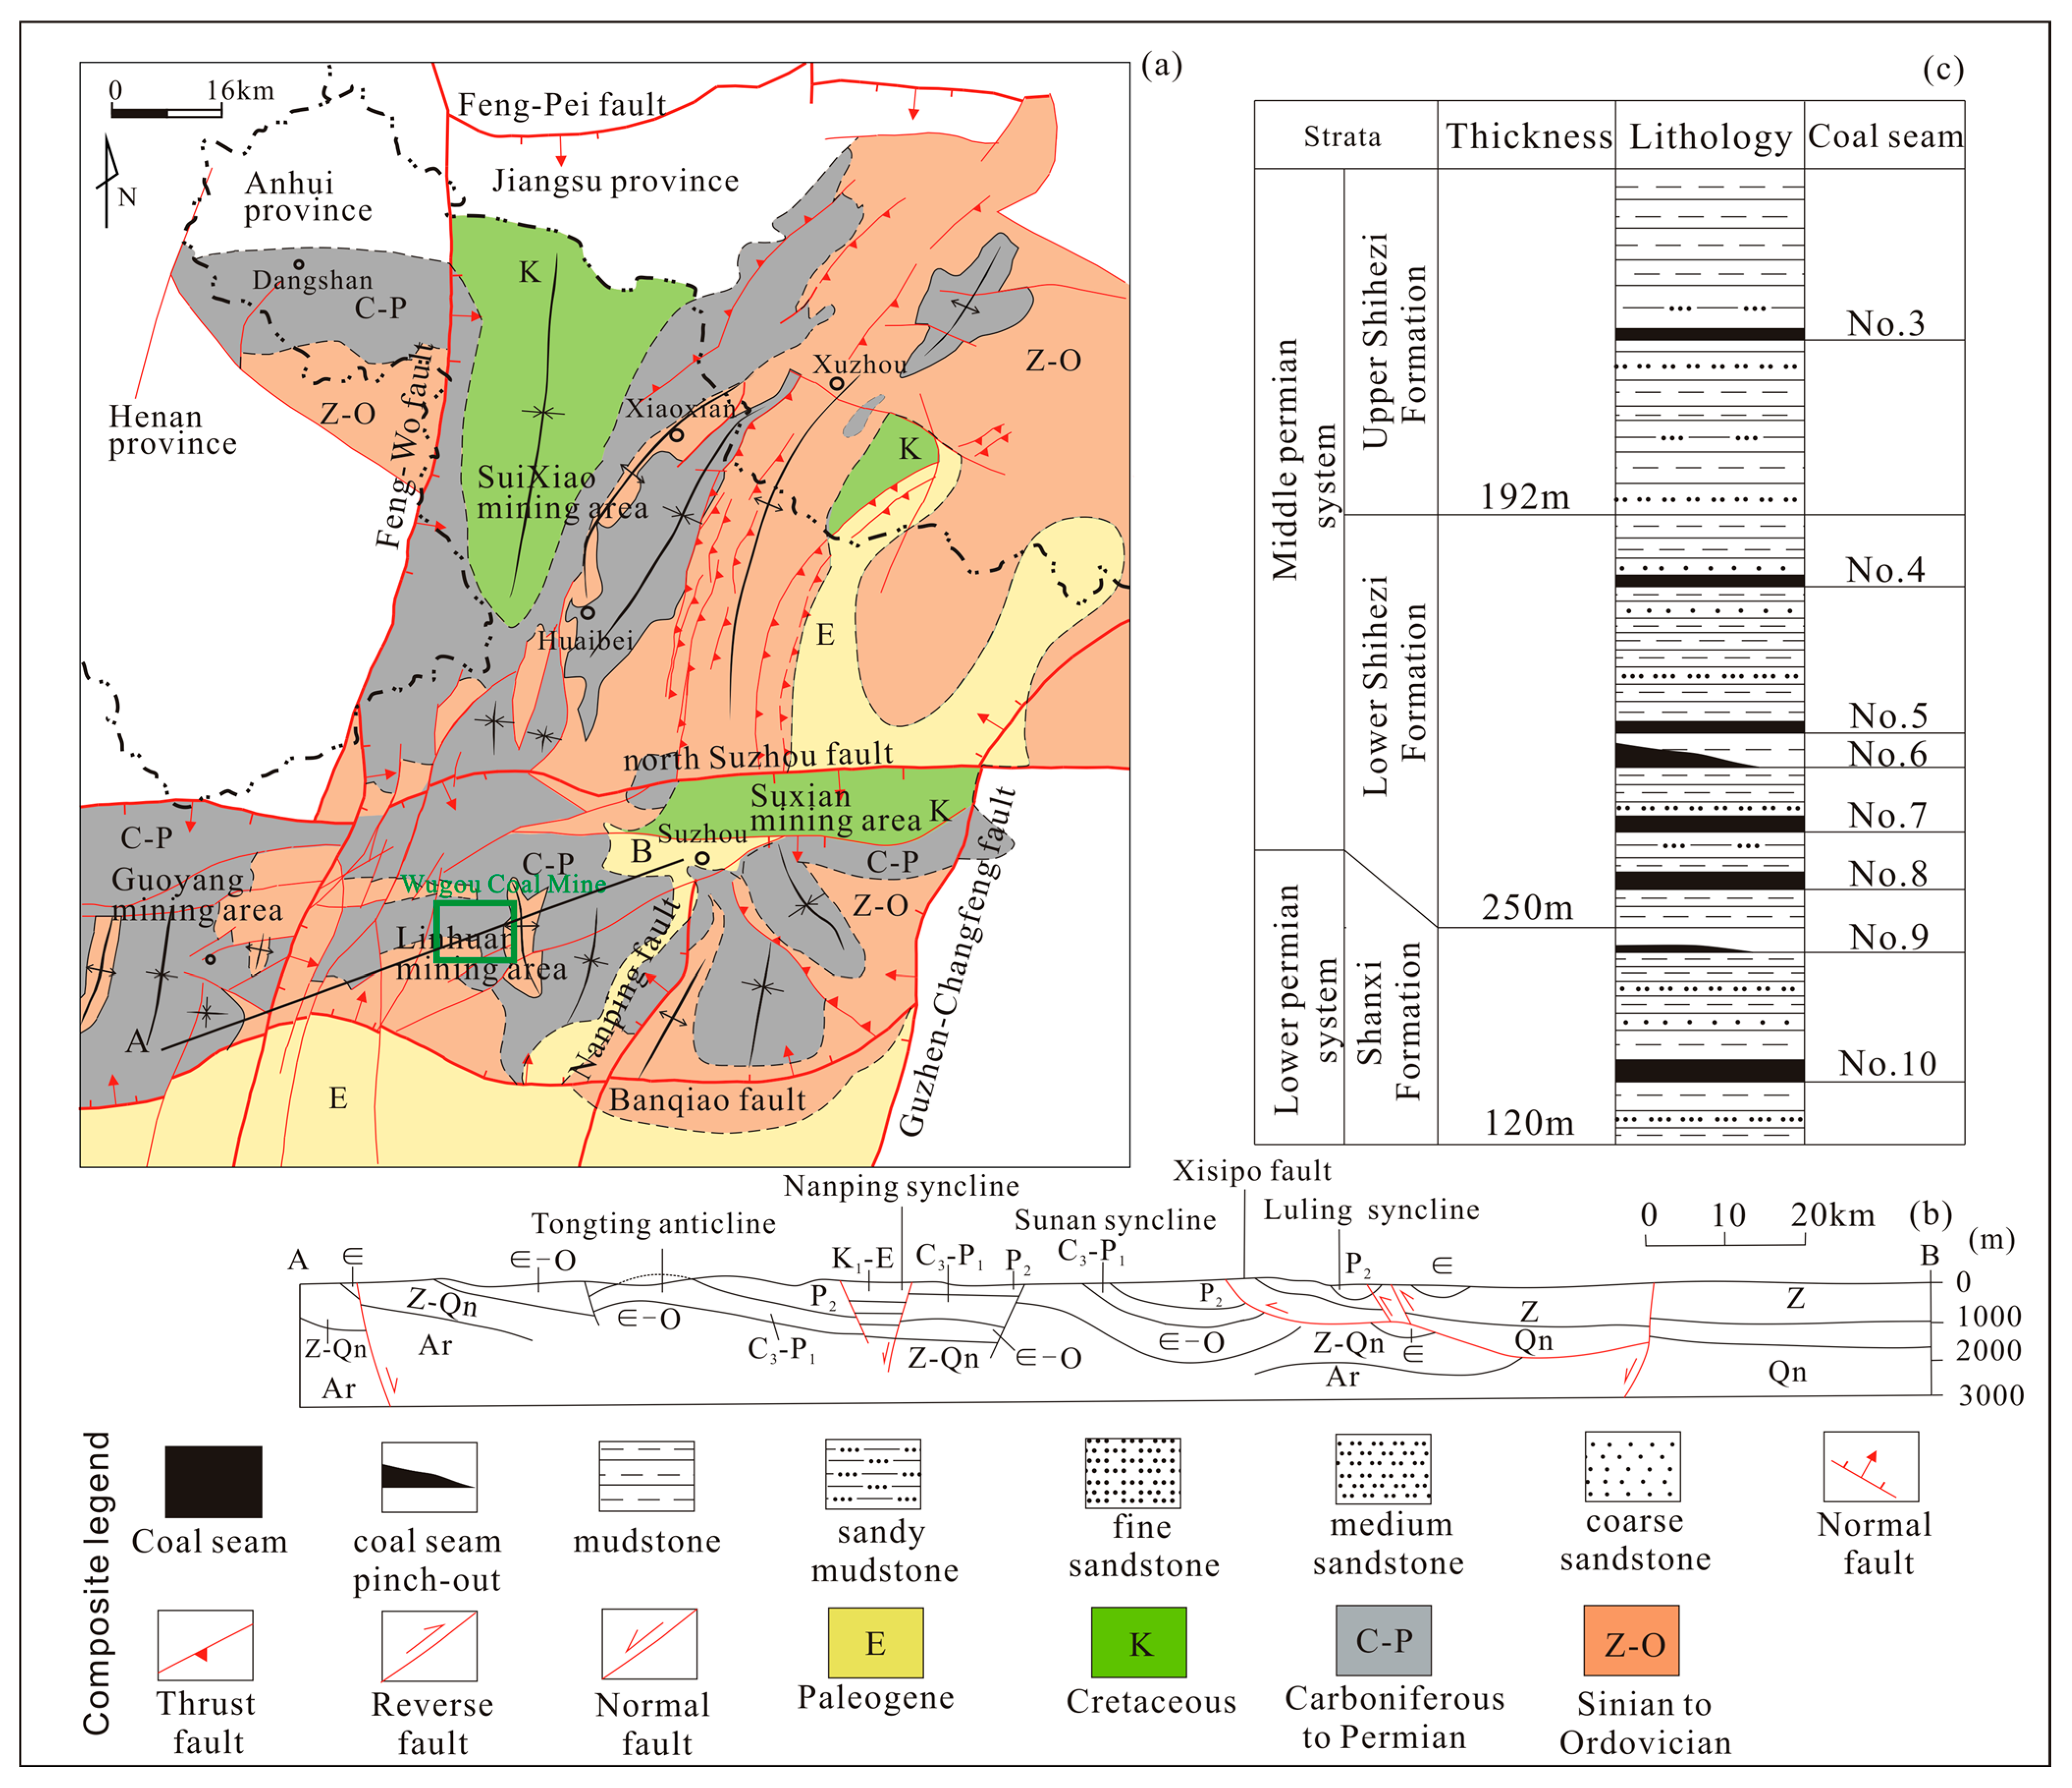
Figure 1. Structural outline (a), stratigraphic section (b) and stratigraphic column (c) of the Wugou Coal Mine (Revised from Jiang et al., 2010) [38]. Reproduced with permission from Bo Jiang, Zhenghui Qu, Geoff G.X. Wang, Ming Li, International Journal of Coal Geology; published by Elsevier, 2010.
Fractalfract 09 00669 g001
Figure 2. Grid layout for fractal dimension evaluation of faults in the Wugou Coal Mine.
Fractalfract 09 00669 g002
Figure 3. Calculation and fitting of capacity dimension for partial fault networks. (a) Unit No.08, (b) Unit No.18, (c) Unit No.28, (d) Unit No.38.
Fractalfract 09 00669 g003
Figure 4. Grid layout for structural curvature calculation in the Wugou Coal Mine.
Fractalfract 09 00669 g004
Figure 5. Planar distribution, assemblage, and combination patterns of folds in the Wugou Coal Mine. ① Parallel folds, ② Branch-like folds, ③ En echelon folds, ④ Brush-like folds, ⑤ Arc-shaped folds; (A) Oblique-crossing type, (B) Crossing type, (C) Deflection type, (D) Oblique-limiting type, (E) Enhancement type.
Fractalfract 09 00669 g005
Figure 6. Stereographic projection analysis of folds (af) and statistical classification of fold attitudes (g). I, Upright horizontal folds; II, Upright plunging folds; III, Inclined vertical folds; IV, Inclined horizontal folds; V, Inclined plunging folds; VI, Reclining folds; VII, Recumbent folds.
Fractalfract 09 00669 g006
Figure 7. Fault distribution of the Wugou Coal Mine. (a) F14 fault; (b) F13 fault; (c) F9 fault; (d) Wugou fault; (e) F16 fault; (f) F2 fault; (g) F3 fault; (h) F4 fault; (i) F5 fault; (j) F6 fault; (k) F7 fault; (l) F8 fault; (m) F10 fault; (n) DF68 fault; (o) DF65 fault; (p) Lijia fault; (q) Yangliu fault.
Fractalfract 09 00669 g007
Figure 8. Distribution of parallel fault combinations in the Wugou Coal Mine.
Fractalfract 09 00669 g008
Figure 9. Planar distribution of fault capacity dimension values in the Wugou Coal Mine.
Fractalfract 09 00669 g009
Figure 10. Maximum curvature contour of the No. 10 coal seam in the Wugou Coal Mine.
Fractalfract 09 00669 g010
Figure 11. Minimum curvature contour of the No. 10 coal seam in the Wugou Coal Mine.
Fractalfract 09 00669 g011
Figure 12. Mean curvature contour of the No. 10 coal seam in the Wugou Coal Mine.
Fractalfract 09 00669 g012
Figure 13. Gaussian curvature contour of the No. 10 coal seam in the Wugou Coal Mine.
Fractalfract 09 00669 g013
Figure 14. Relationship between different types of curvatures and fractal dimensions in the Wugou Coal Mine. (a) Maximum curvature; (b) Minimum curvature; (c) Mean curvature; (d) Gaussian curvature.
Fractalfract 09 00669 g014
Figure 15. Comprehensive evaluation model of Fractal-Curvature for structural complexity in the Wugou Coal Mine. (a) Simply zone; (b) Moderately complex zone (c) Complex zone (d) Extremely complex zone. The different colored lines mark the boundaries of different evaluation zones.
Fractalfract 09 00669 g015
Figure 16. Comprehensive evaluation map of Fractal-Curvature for structural complexity in the Wugou Coal Mine.
Fractalfract 09 00669 g016
Table 1. Statistics of fractal dimension of fault structures in Wugou Coal Mine.
No.DkR2No.DkR2No.DkR2No.DkR2
11.001.00332.001.00652.001.00971.851.00
21.200.99341.851.00661.771.00981.961.00
31.380.96351.710.98671.891.00991.771.00
41.891.00362.001.00681.650.971001.891.00
51.961.00371.961.00691.570.981012.001.00
61.650.97381.811.00701.730.991021.510.96
71.570.98391.811.00711.730.991031.931.00
81.531.00401.730.99721.730.991041.961.00
91.771.00412.001.00731.851.001051.730.99
101.670.99422.001.00741.891.001061.961.00
111.661.00431.811.00751.931.001072.001.00
121.840.99441.650.97761.851.001081.860.99
132.001.00451.891.00772.001.001091.711.00
141.961.00461.570.98781.961.001101.961.00
151.811.00471.640.99791.760.991112.001.00
161.460.98481.570.98802.001.001122.001.00
171.771.00491.891.00811.601.001132.001.00
181.961.00501.931.00821.760.991141.961.00
192.001.00511.680.99832.001.001152.001.00
201.620.98521.851.00841.961.001161.851.00
211.460.96531.961.00851.751.001171.730.99
221.630.98541.650.97861.760.991181.160.96
231.730.99551.891.00871.851.001191.891.00
241.520.97561.961.00882.001.001201.891.00
251.851.00571.730.99891.961.001211.520.97
261.891.00581.701.00901.811.001221.931.00
271.760.99591.510.97911.961.001231.891.00
281.931.00601.570.96921.961.001241.650.97
291.080.96611.931.00932.001.001251.851.00
301.120.98621.961.00941.630.981261.931.00
311.851.00631.961.00951.730.991271.640.99
321.961.00642.001.00962.001.001282.001.00
Table 2. Parameter ranges and structural characteristics by evaluation zone.
Evaluation AreaDkKmeanStructural Characteristics
Simplyzone1.0 ~ 1.4−0.003 ~ 0.003Fault structures are poorly developed
1.4 ~ 1.8−0.0002 ~ 0.0002Sparsely distributed small-scale faults
Moderately complex zone1.4 ~ 1.80.0002 ~ 0.003
−0.003 ~ −0.0002
Poorly developed secondary structures along major faults
1.8 ~ 1.9−0.0004 ~ 0.0004Sparsely distributed large faults and folds, accompanied by the development of small-scale faults
Complex zone1.8 ~ 1.90.0004 ~ 0.003
−0.003 ~ −0.0004
Sparsely developed secondary structures adjacent to major faults
1.9 ~ 2.0−0.0006 ~ 0.0006Densely developed large faults, secondary faults, and folds
Extremely complex zone1.9 ~ 2.00.0006 ~ 0.003Hanging walls of major faults with extensively developed secondary faults and folds
1.9 ~ 2.0−0.003 ~ −0.0006Footwalls of major faults with extensively developed secondary faults and folds
Disclaimer/Publisher’s Note: The statements, opinions and data contained in all publications are solely those of the individual author(s) and contributor(s) and not of MDPI and/or the editor(s). MDPI and/or the editor(s) disclaim responsibility for any injury to people or property resulting from any ideas, methods, instructions or products referred to in the content.