4.2. Data Pre-Processing and Evaluation Indicators
To evaluate the prediction accuracy of the proposed approximate models, we partitioned the dataset into 70% training, 15% validation, and 15% test sets. Because each feature represents a specific physical quantity, we applied min-max normalization. The mathematical formulation of min-max normalization is as follows:
where
is the original data.
is the minimum value in the dataset.
is the maximum value in the dataset.
We evaluate the multi-strategy-integrated multi-objective Mantis Search Algorithm using three metrics: Generational Distance (GD) quantifies convergence by measuring the average distance from obtained solutions to the true Pareto front; Inverted Generational Distance (IGD) assesses both convergence and diversity by computing the average distance from the true Pareto front to the solution set; and Spacing Metric (SM) evaluates the uniformity of the solution distribution. The mathematical formulations are as follows:
where
is Number of obtained PO solutions.
is Euclidean distance between the I th PO solution obtained and the closest true PO solution in the reference set.
is Number of true Pareto-optimal solutions.
is Euclidean distance between the I th true PO solution and the closest PO solution obtained in the reference set.
is Euclidean distance between the I th true PO solution and the closest PO solution obtained in the reference set Number of objectives.
and
is Maximum and Minimum value of I th objective function.
In this study, the accuracy of the pumpjack well system efficiency prediction model is evaluated using key metrics commonly employed in regression models, including Mean Squared Error (MSE), Root Mean Squared Error (RMSE), Mean Absolute Error (MAE), and the Coefficient of Determination (R
2). The mathematical models for these evaluation metrics are as follows:
where
represents the total number of samples.
the true values.
the predicted values.
4.5. Experimental Analysis of Influencing Factors
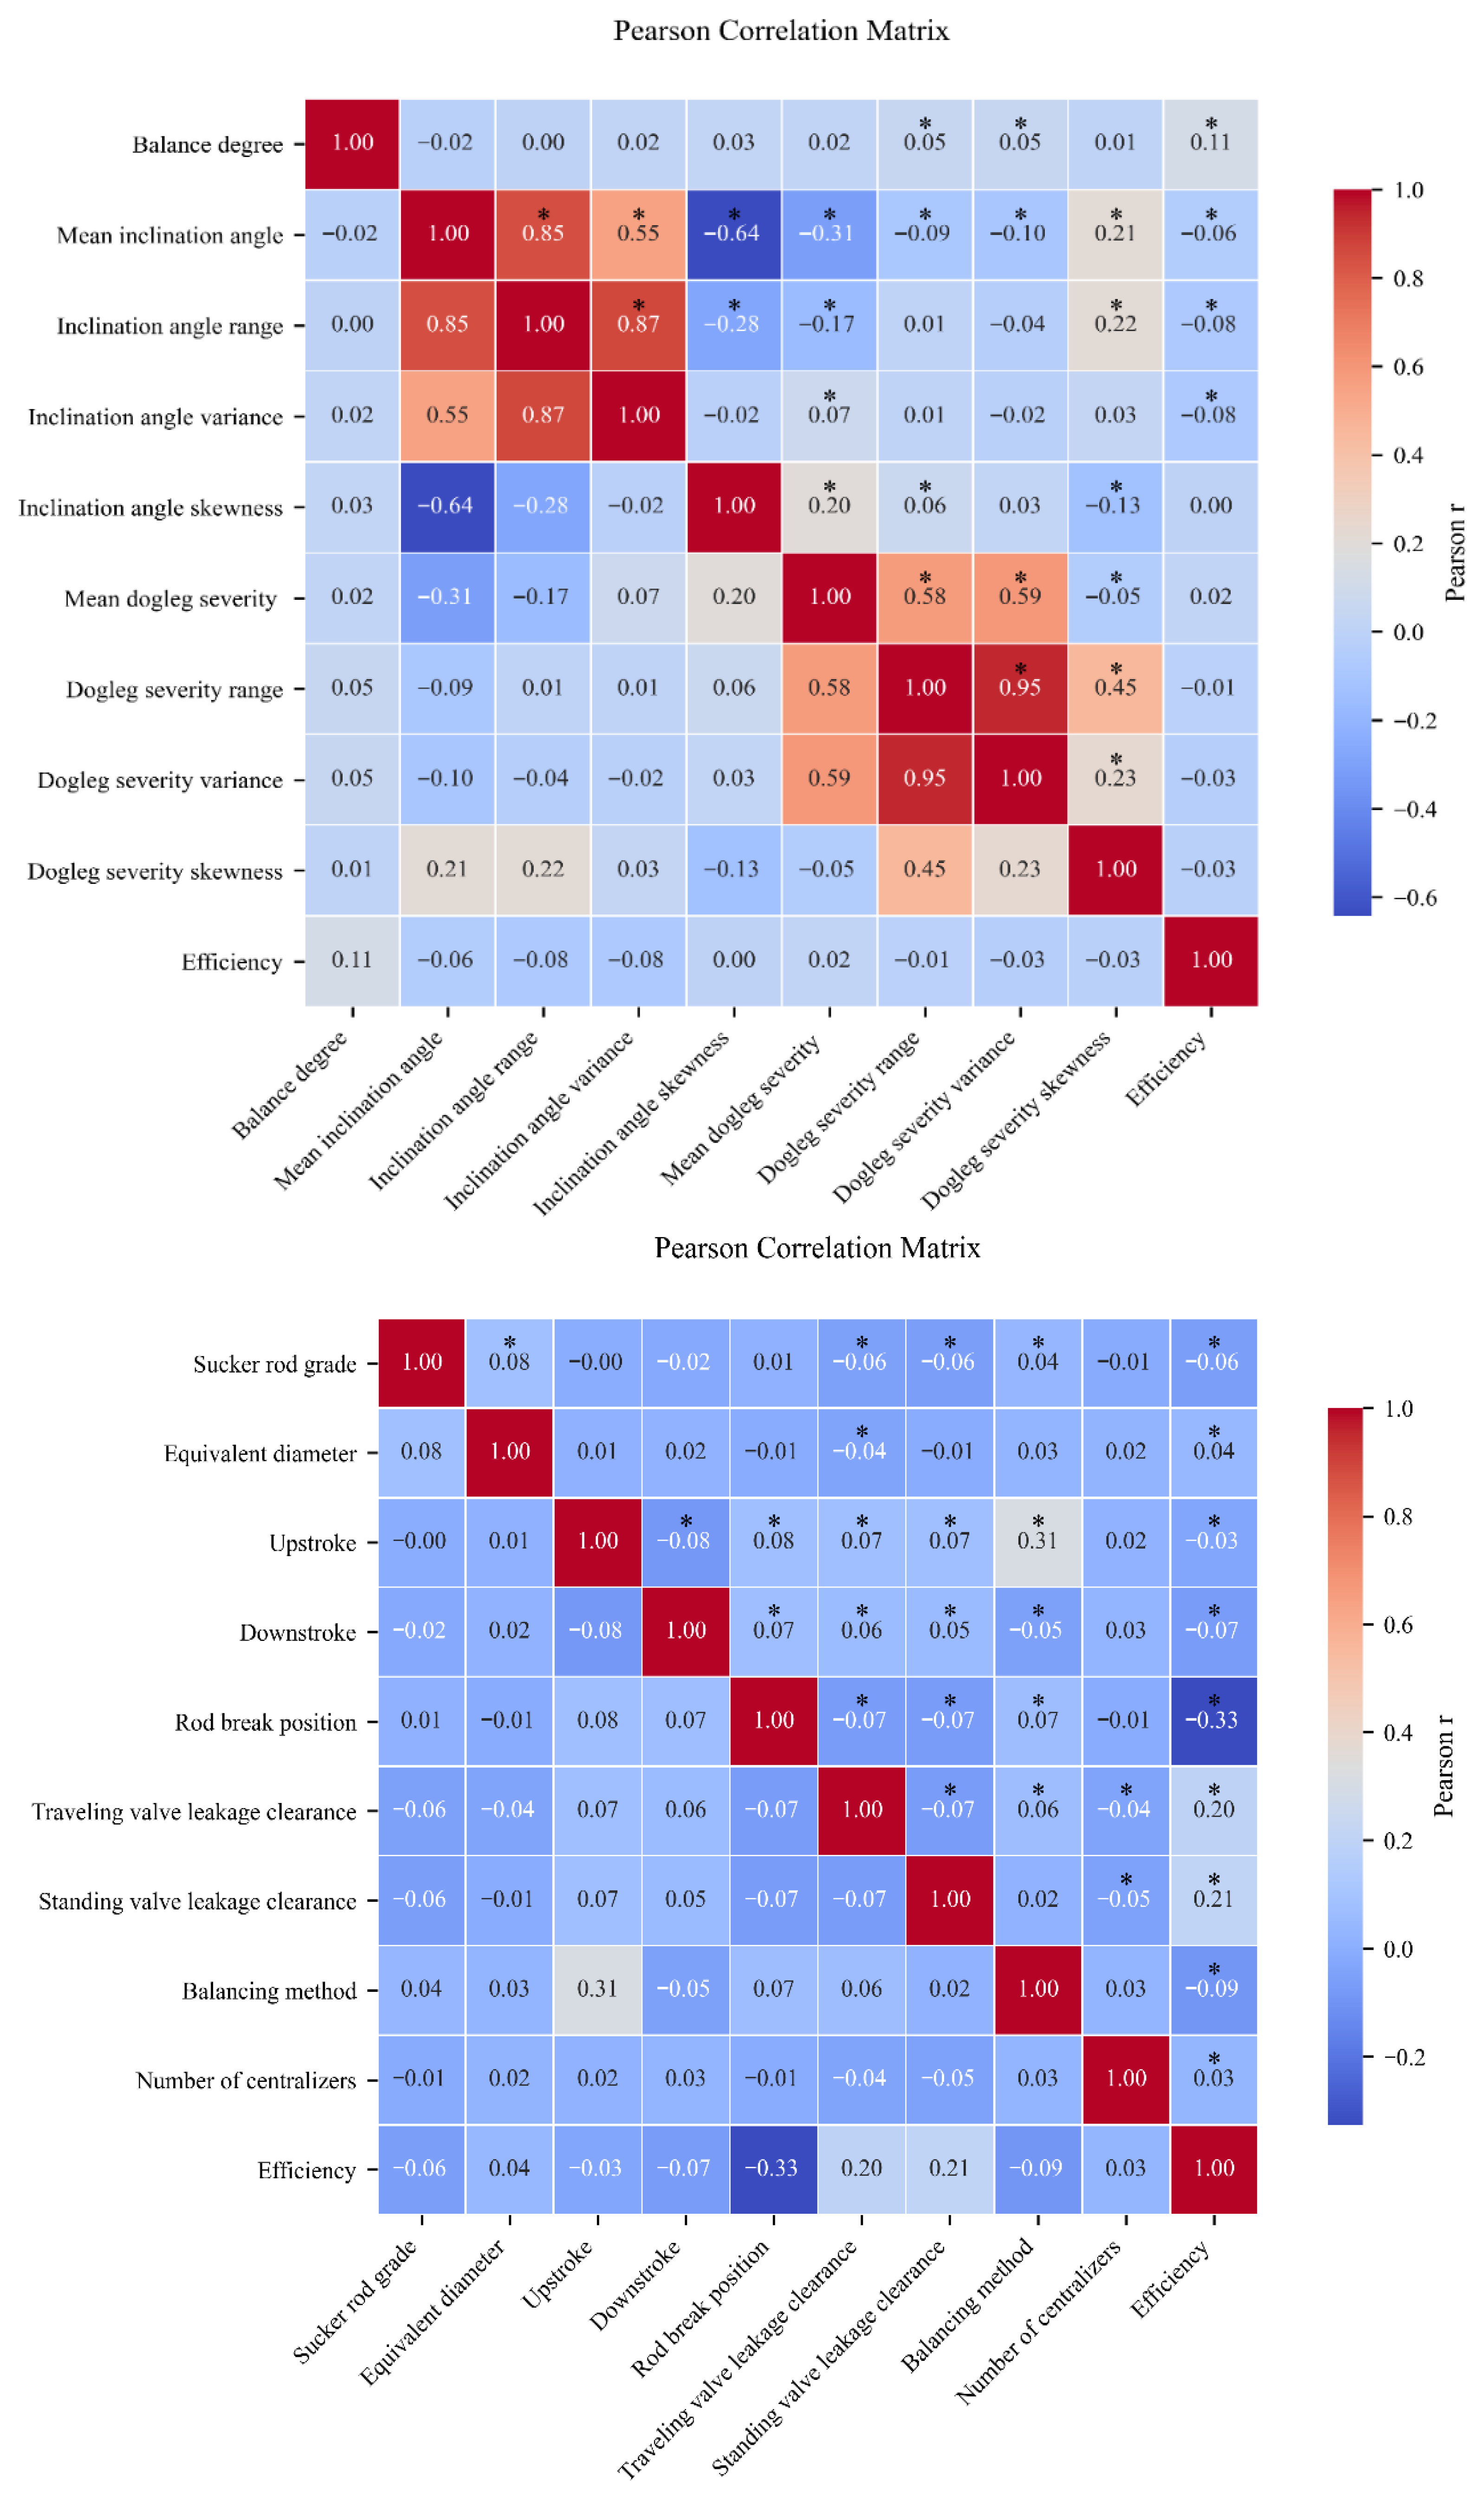
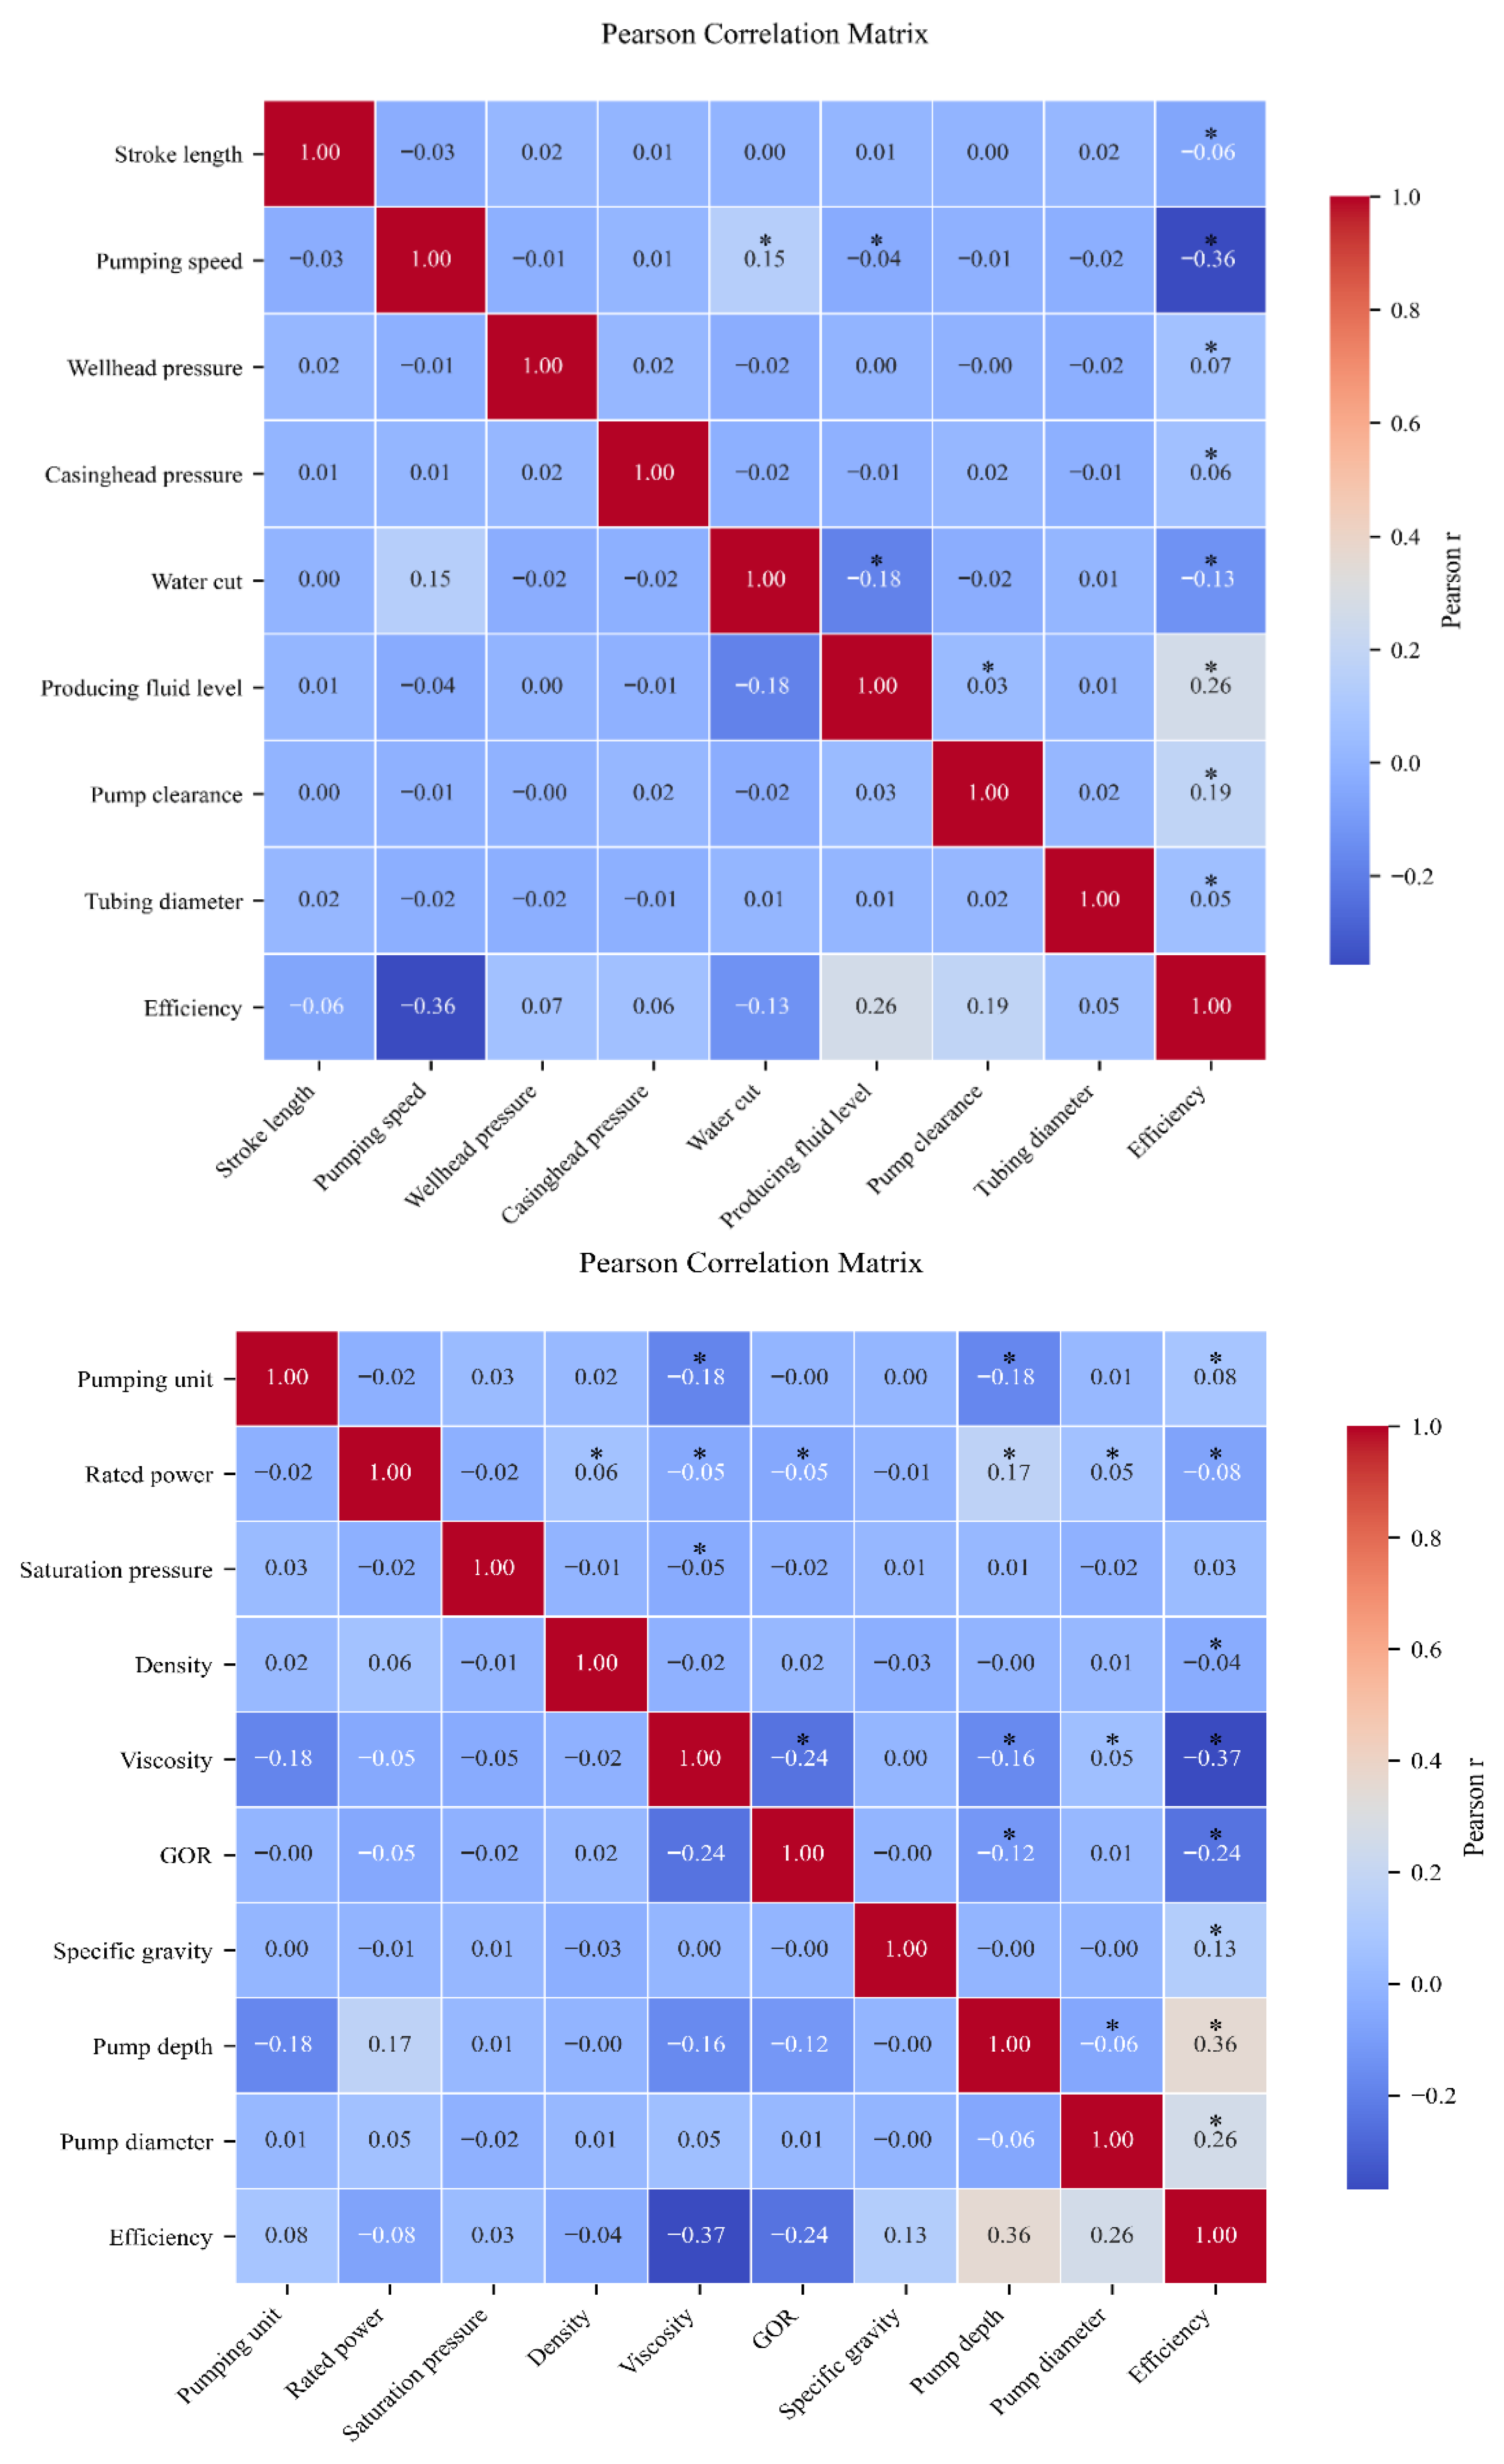
To identify the influential factors, we employ Pearson correlation coefficients and -value significance testing, with the analytical results presented in the following figure.
Because Pearson correlation coefficients quantify the strength of association between each candidate feature and system efficiency, and
p-value significance tests determine whether that association is statistically valid, we select only those features for which
exceeds the chosen threshold and
p < 0.05 as primary predictors. As shown in
Figure 6, the selected features include Pumping unit, Rated power, Density, Viscosity, GOR, Specific gravity, Pump depth, Pump diameter, Stroke length, Pumping speed, Wellhead pressure, Casinghead pressure, Water cut, Producing fluid level, Pump clearance, Tubing diameter, Sucker rod grade, Equivalent diameter, Upstroke, Downstroke, Rod break position, Traveling valve leakage clearance, Standing valve leakage clearance, Balancing method, Balance degree, Mean inclination angle, Inclination angle range, Inclination angle variance, Electric power skewness, Electric power kurtosis, and Electric power peak count.
4.6. Experimental Analysis of Approximate Models
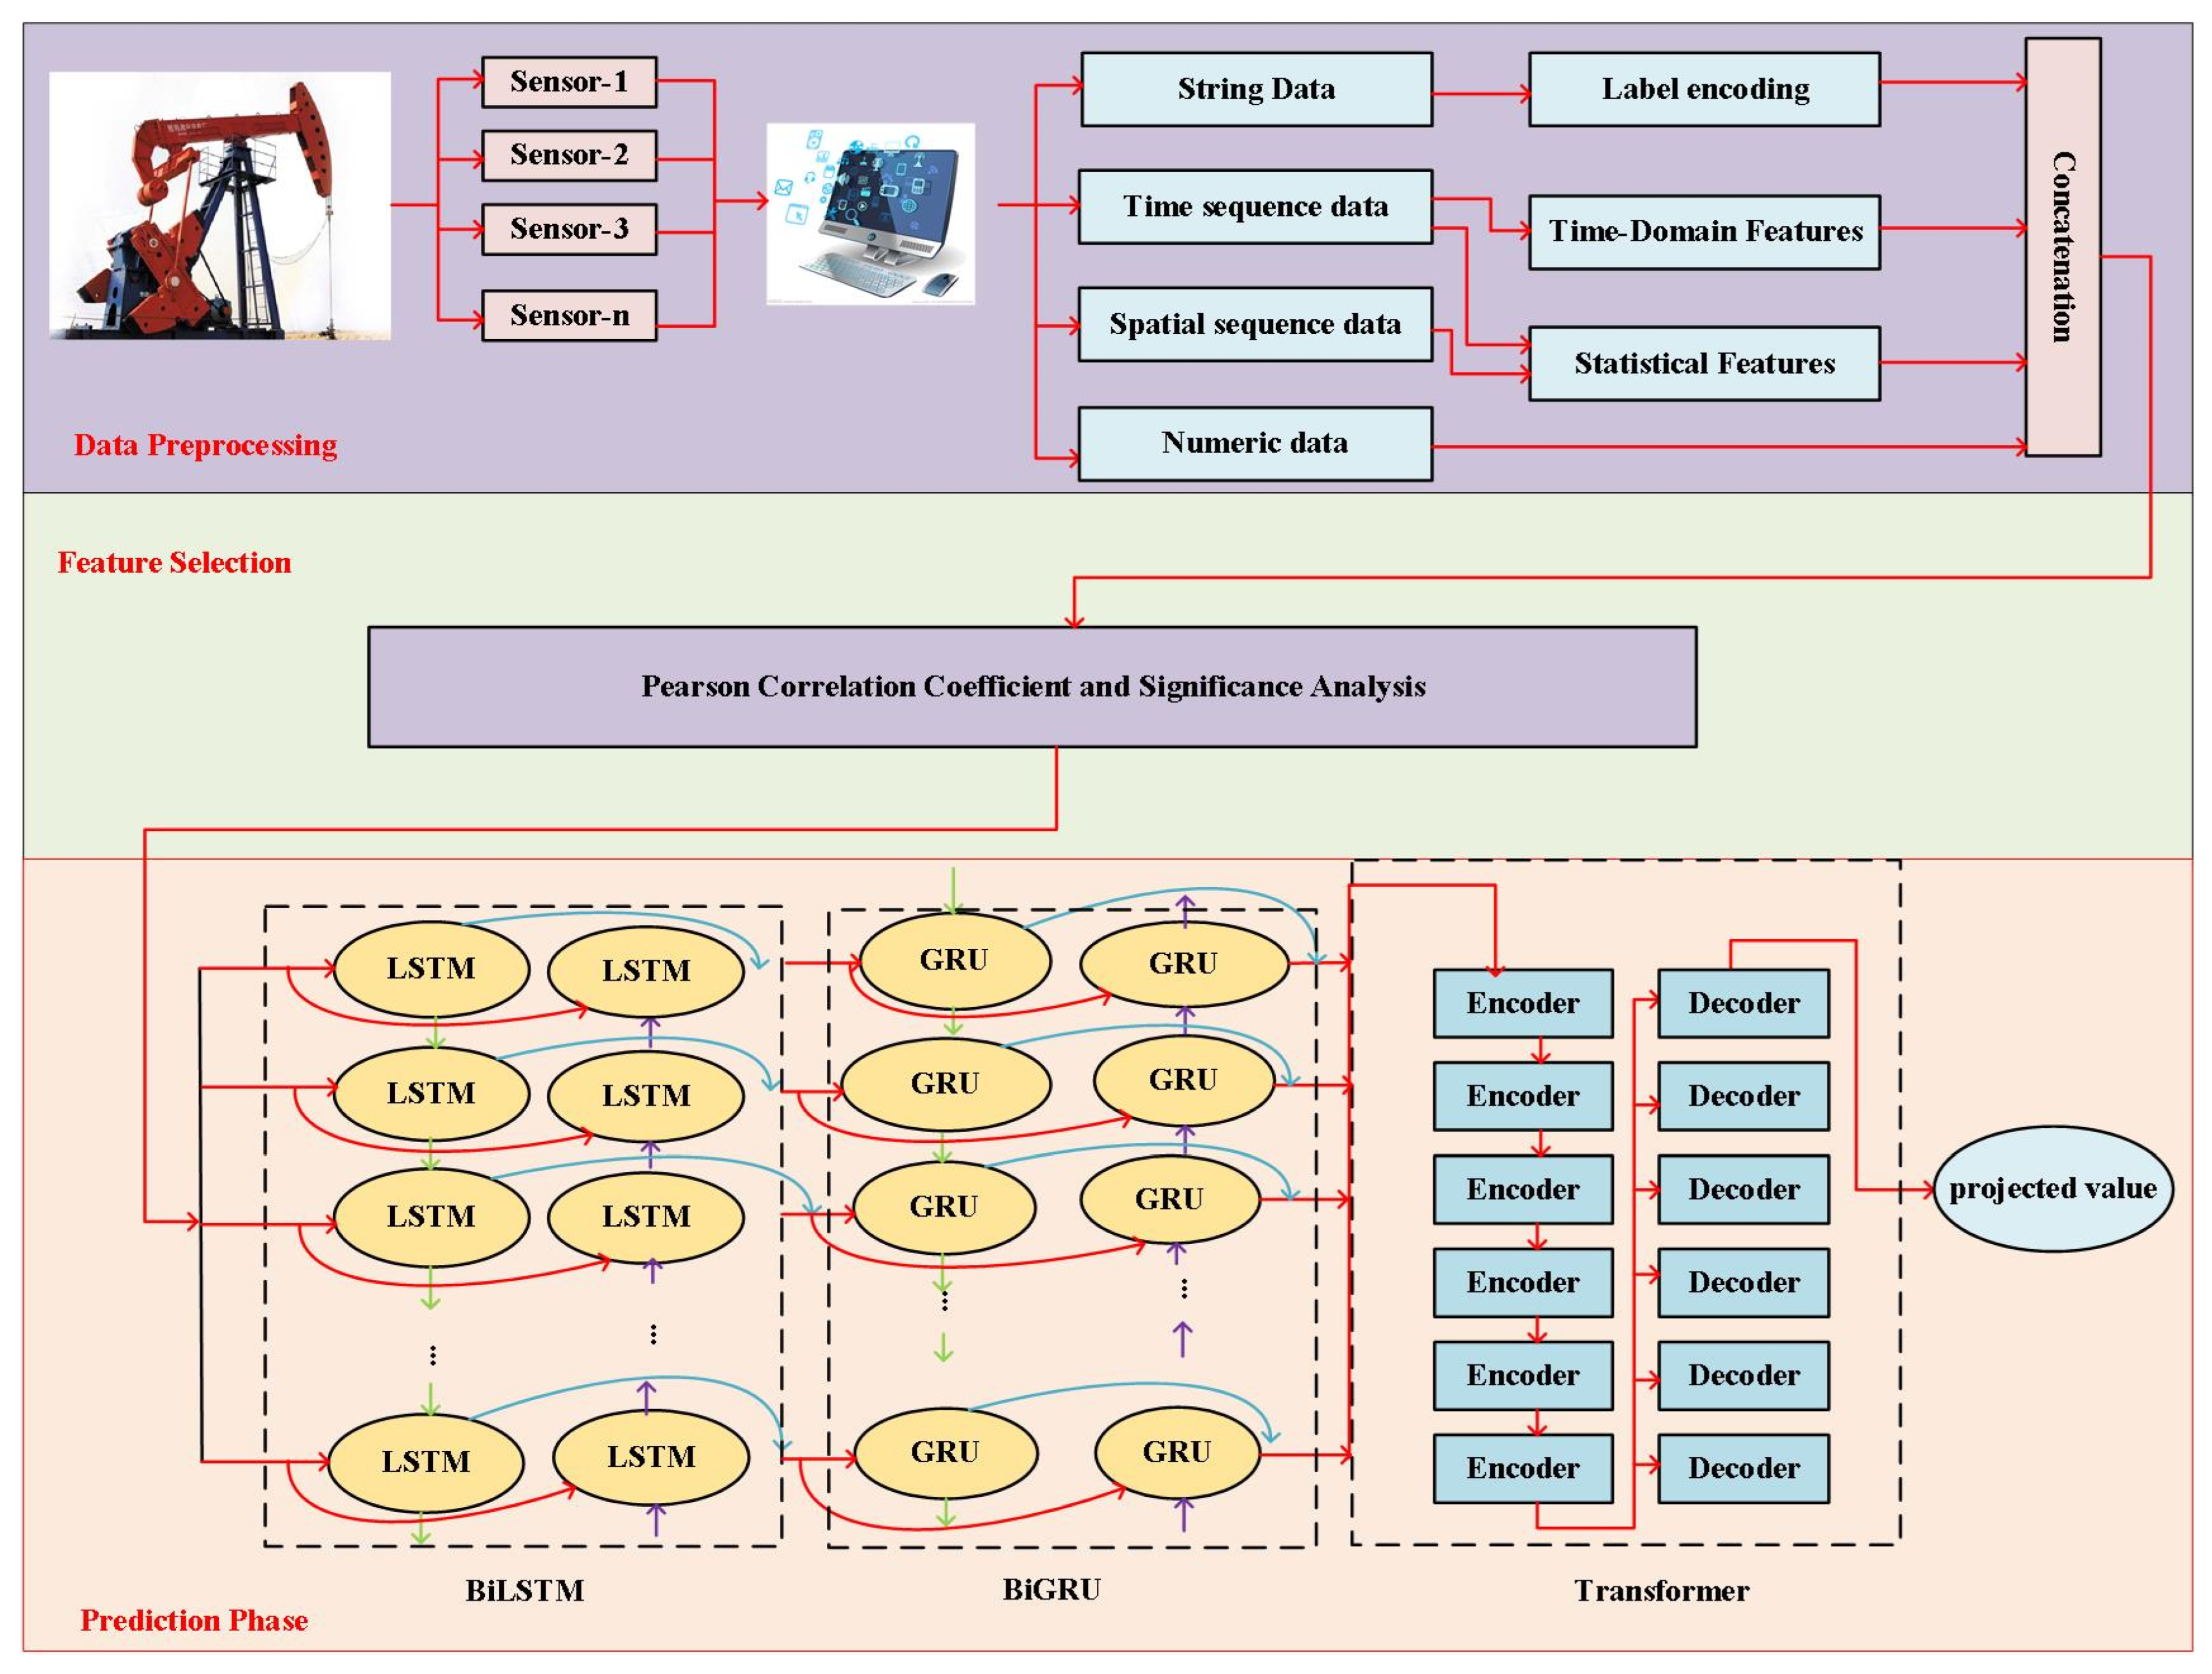
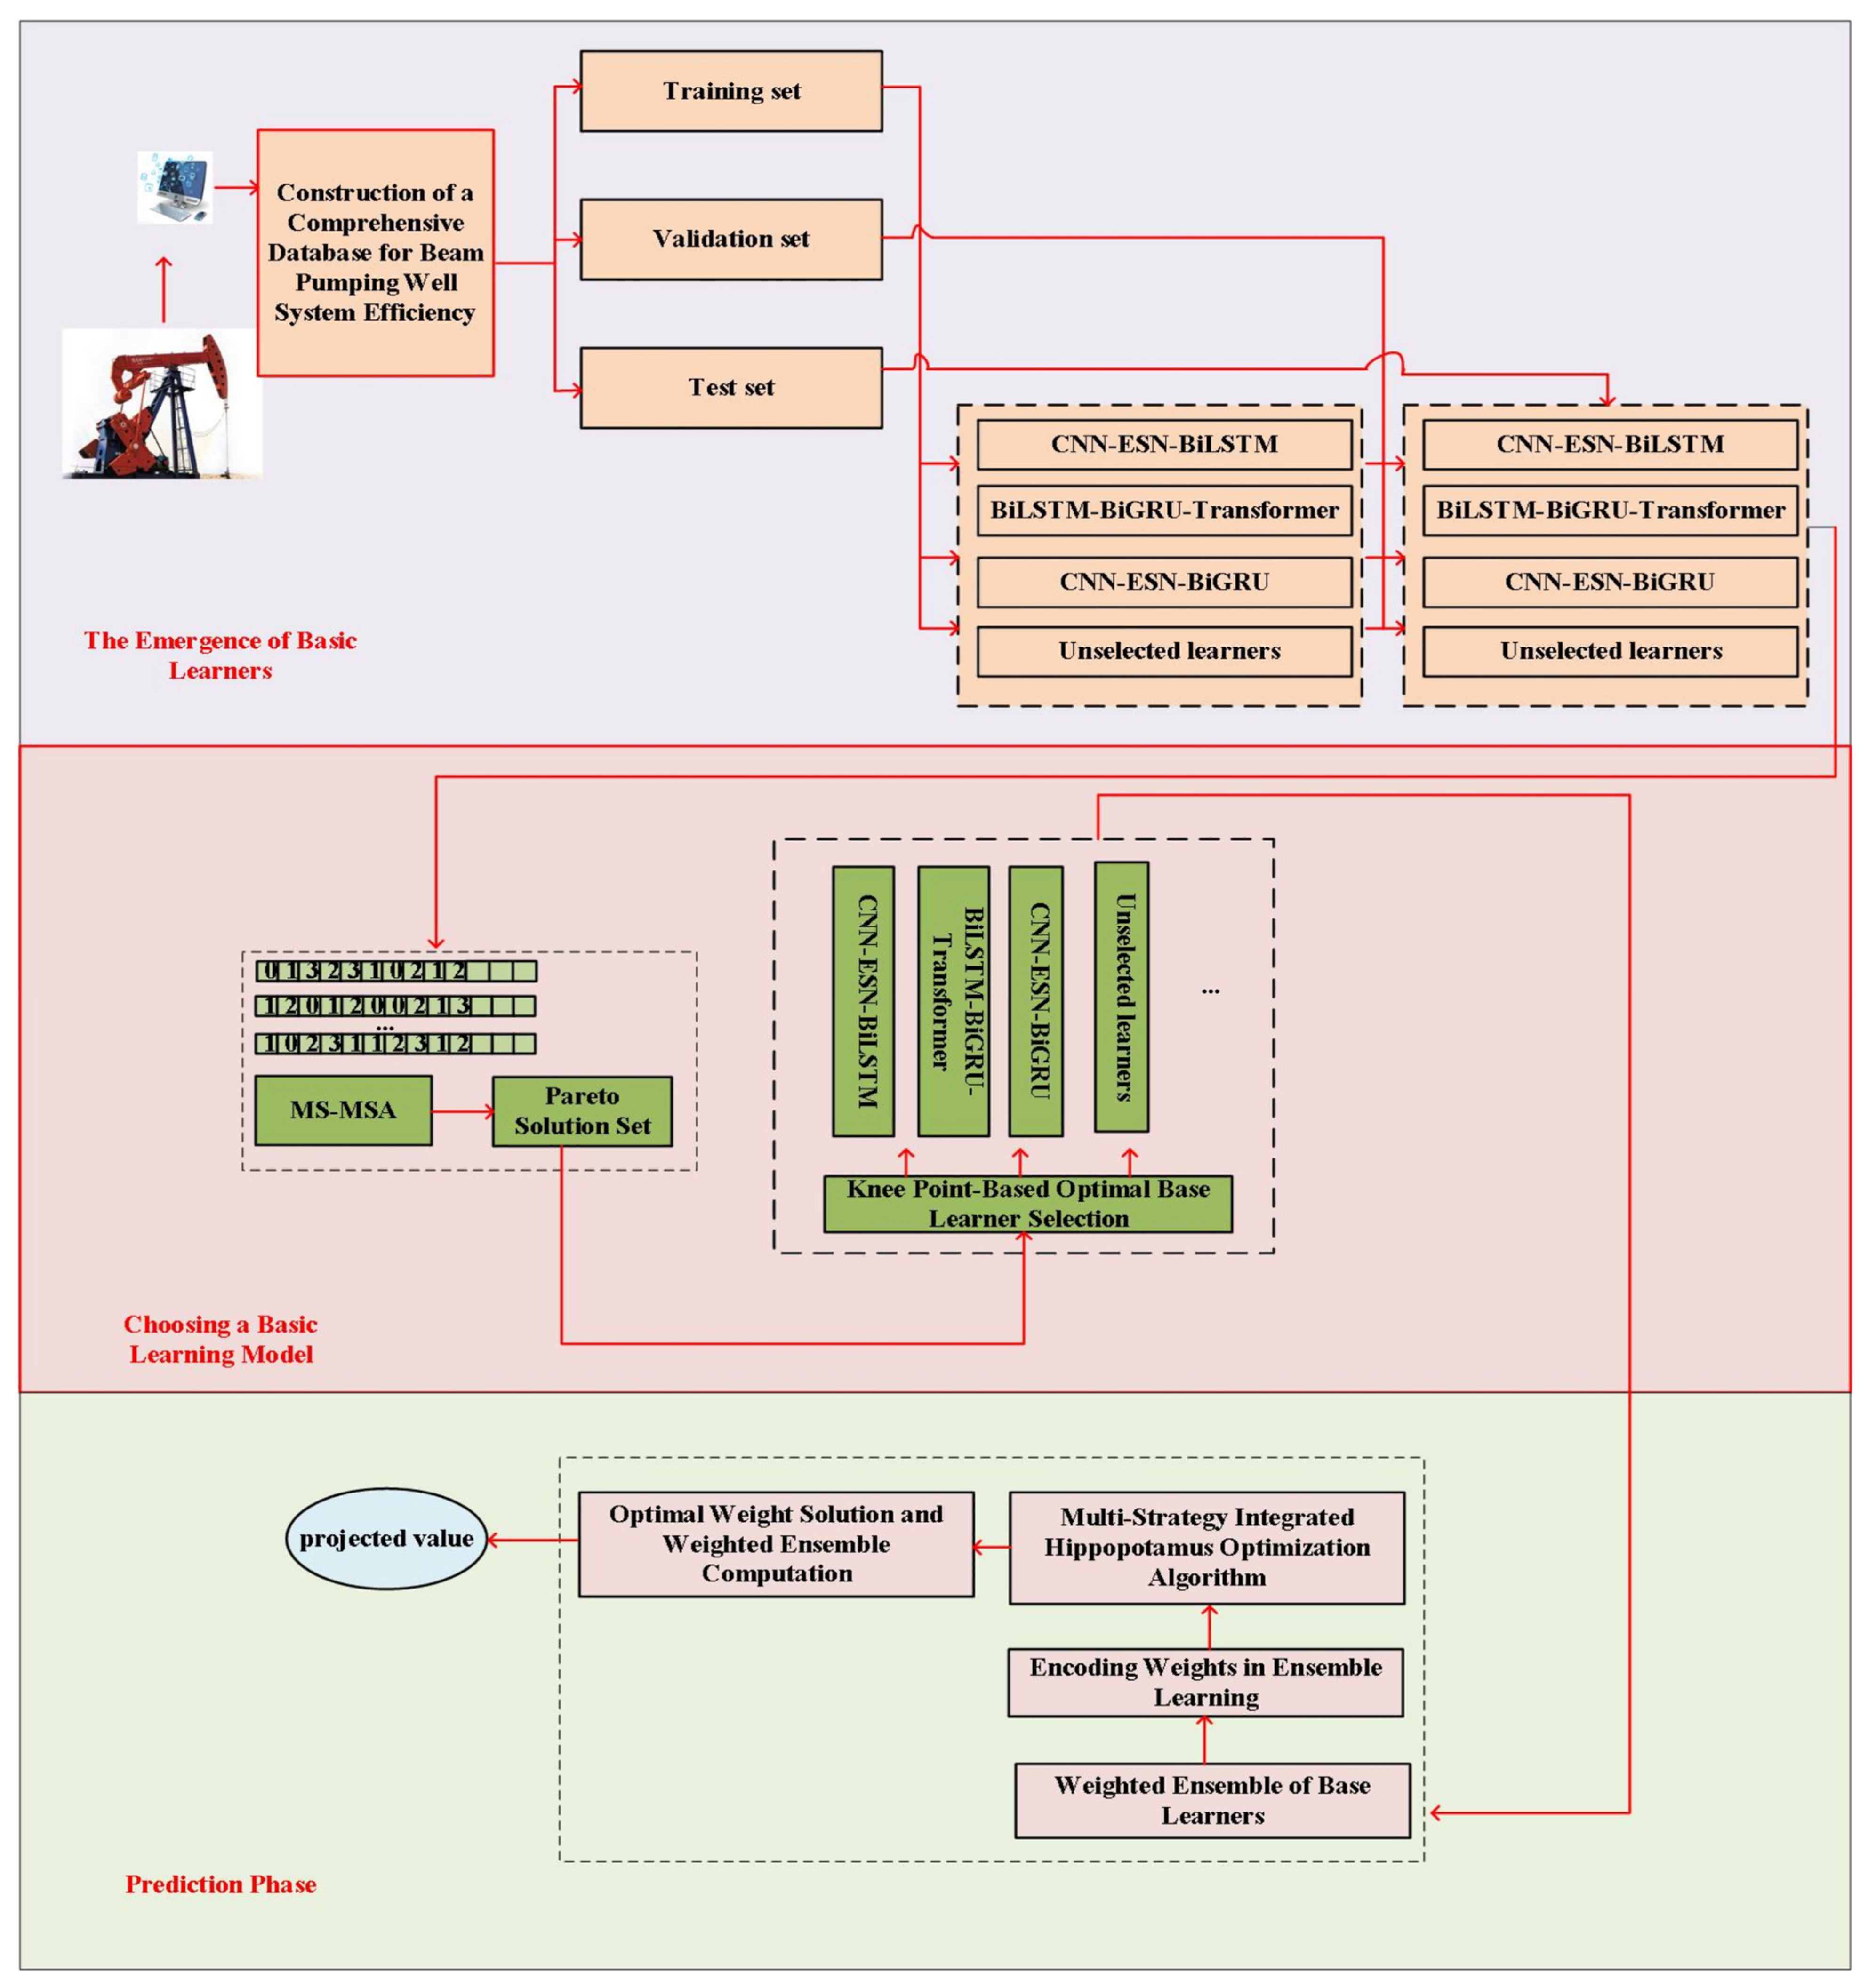
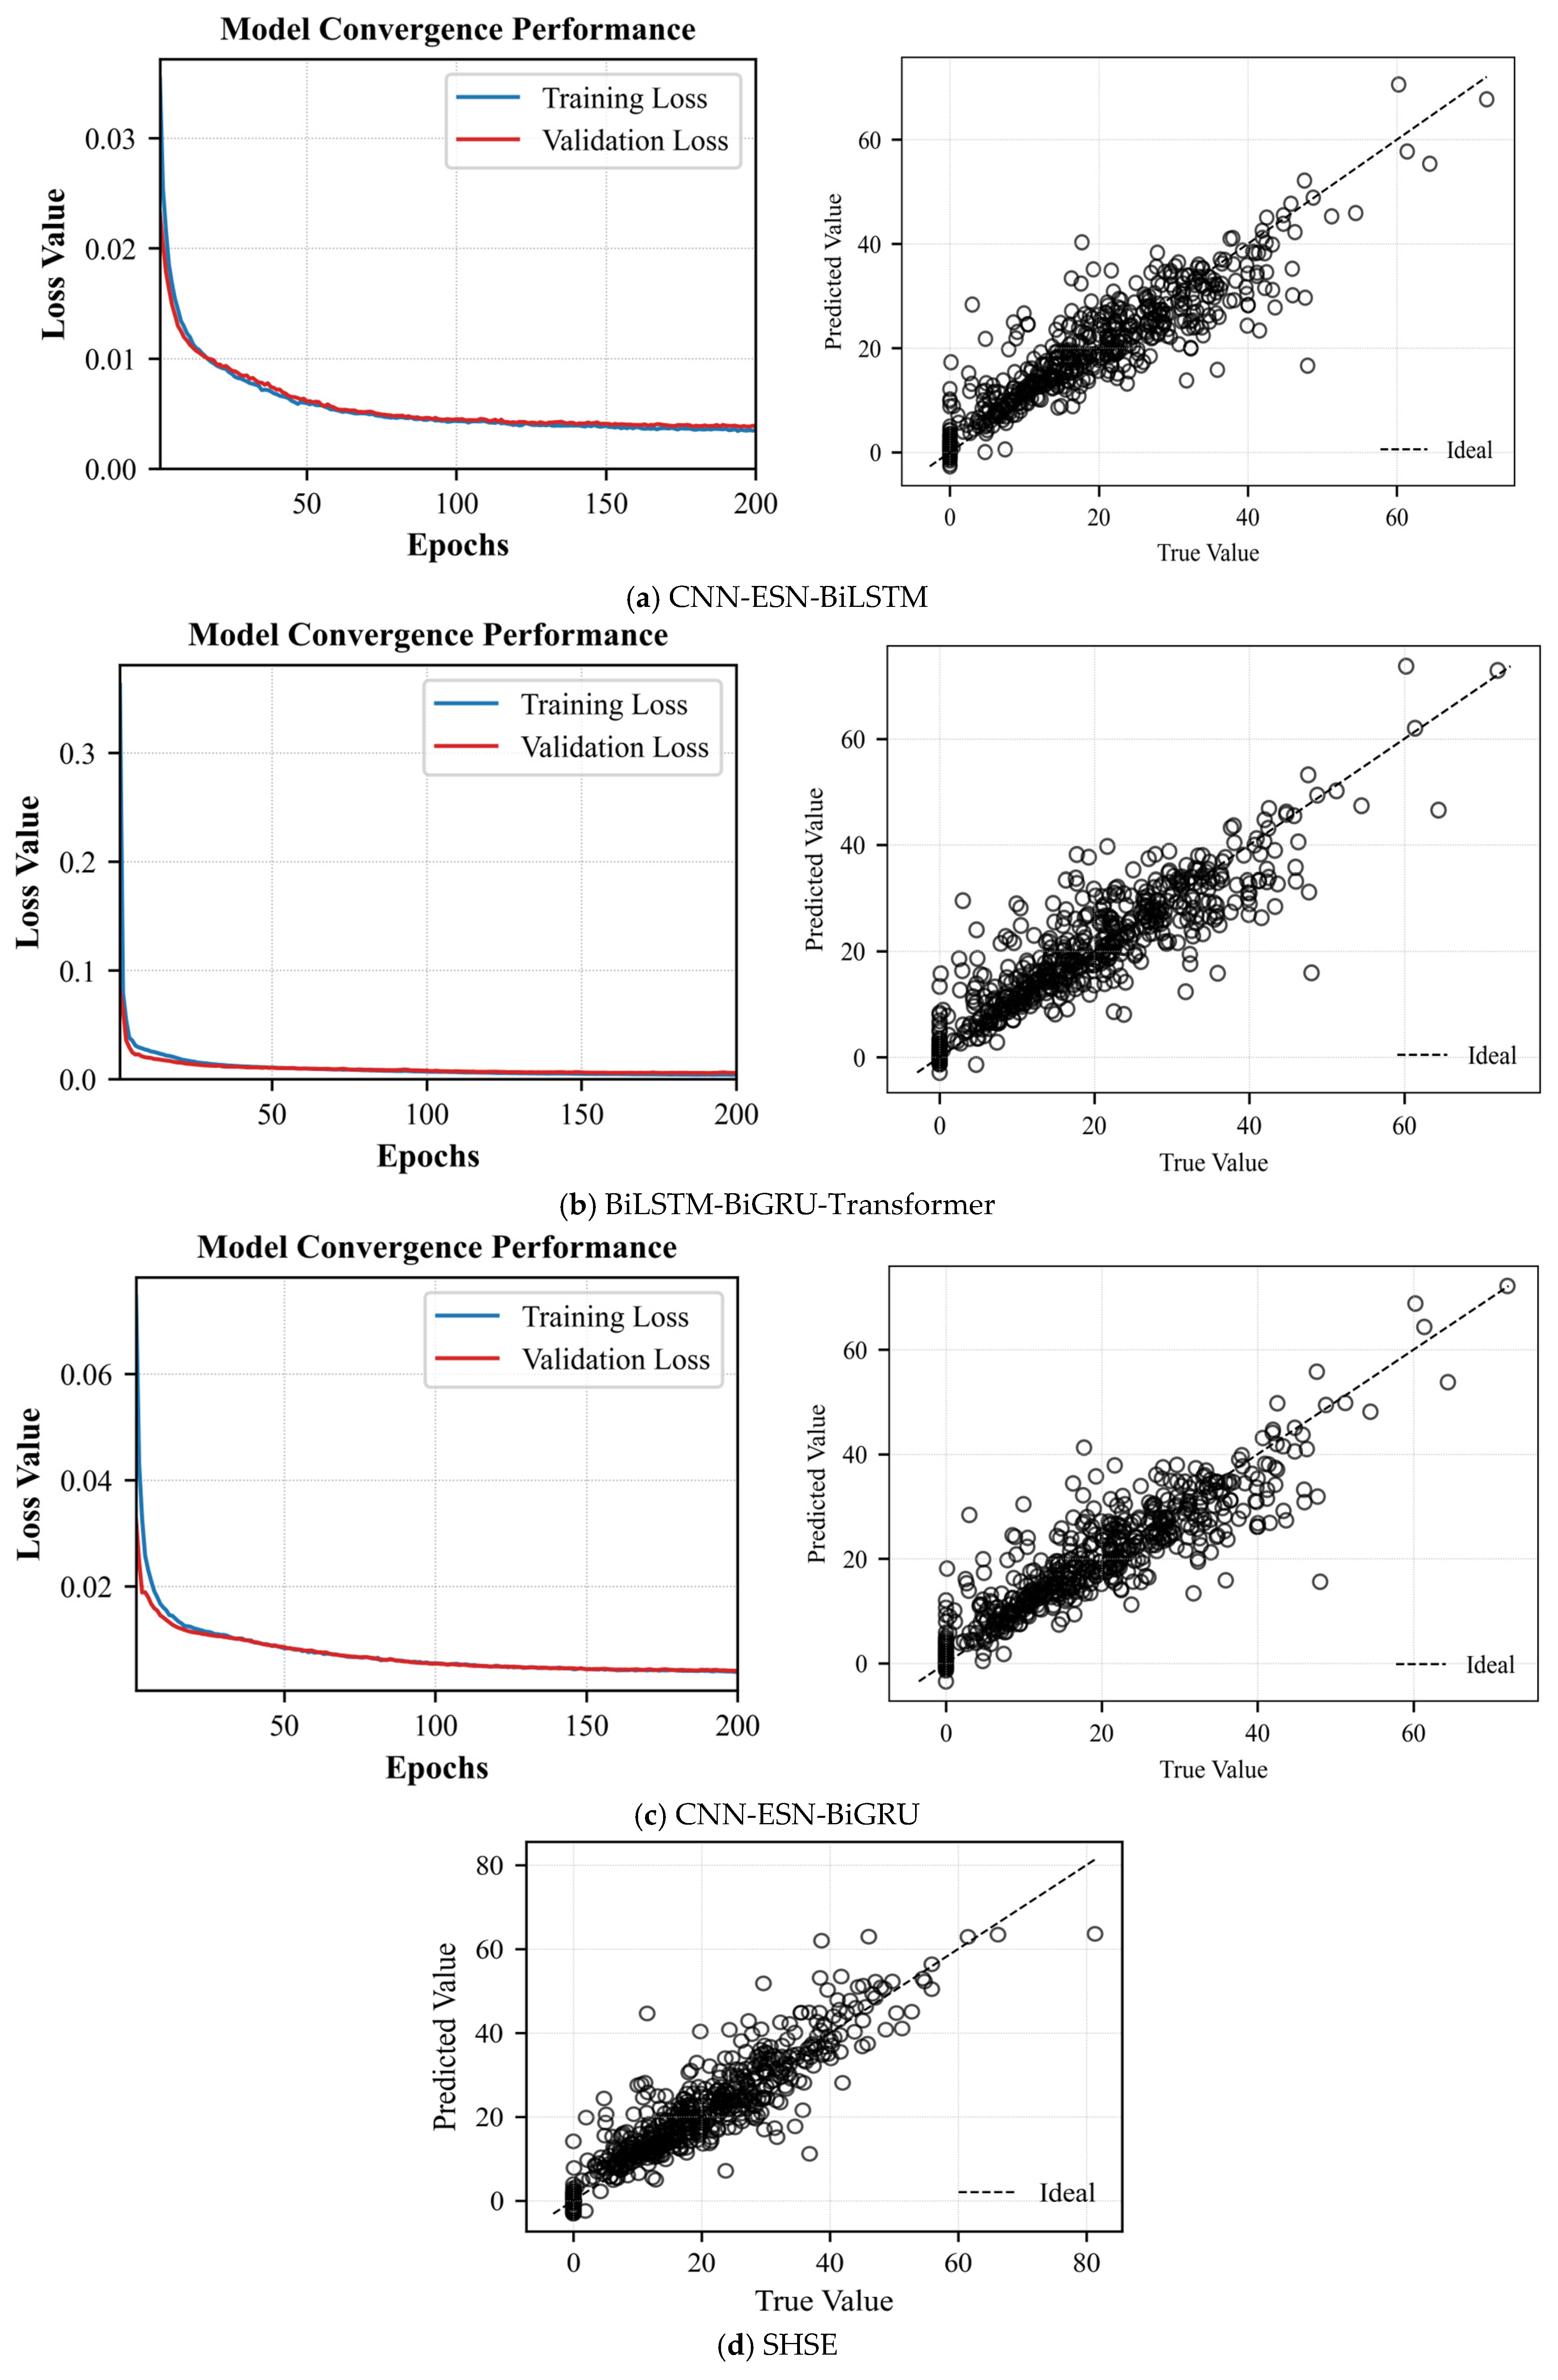
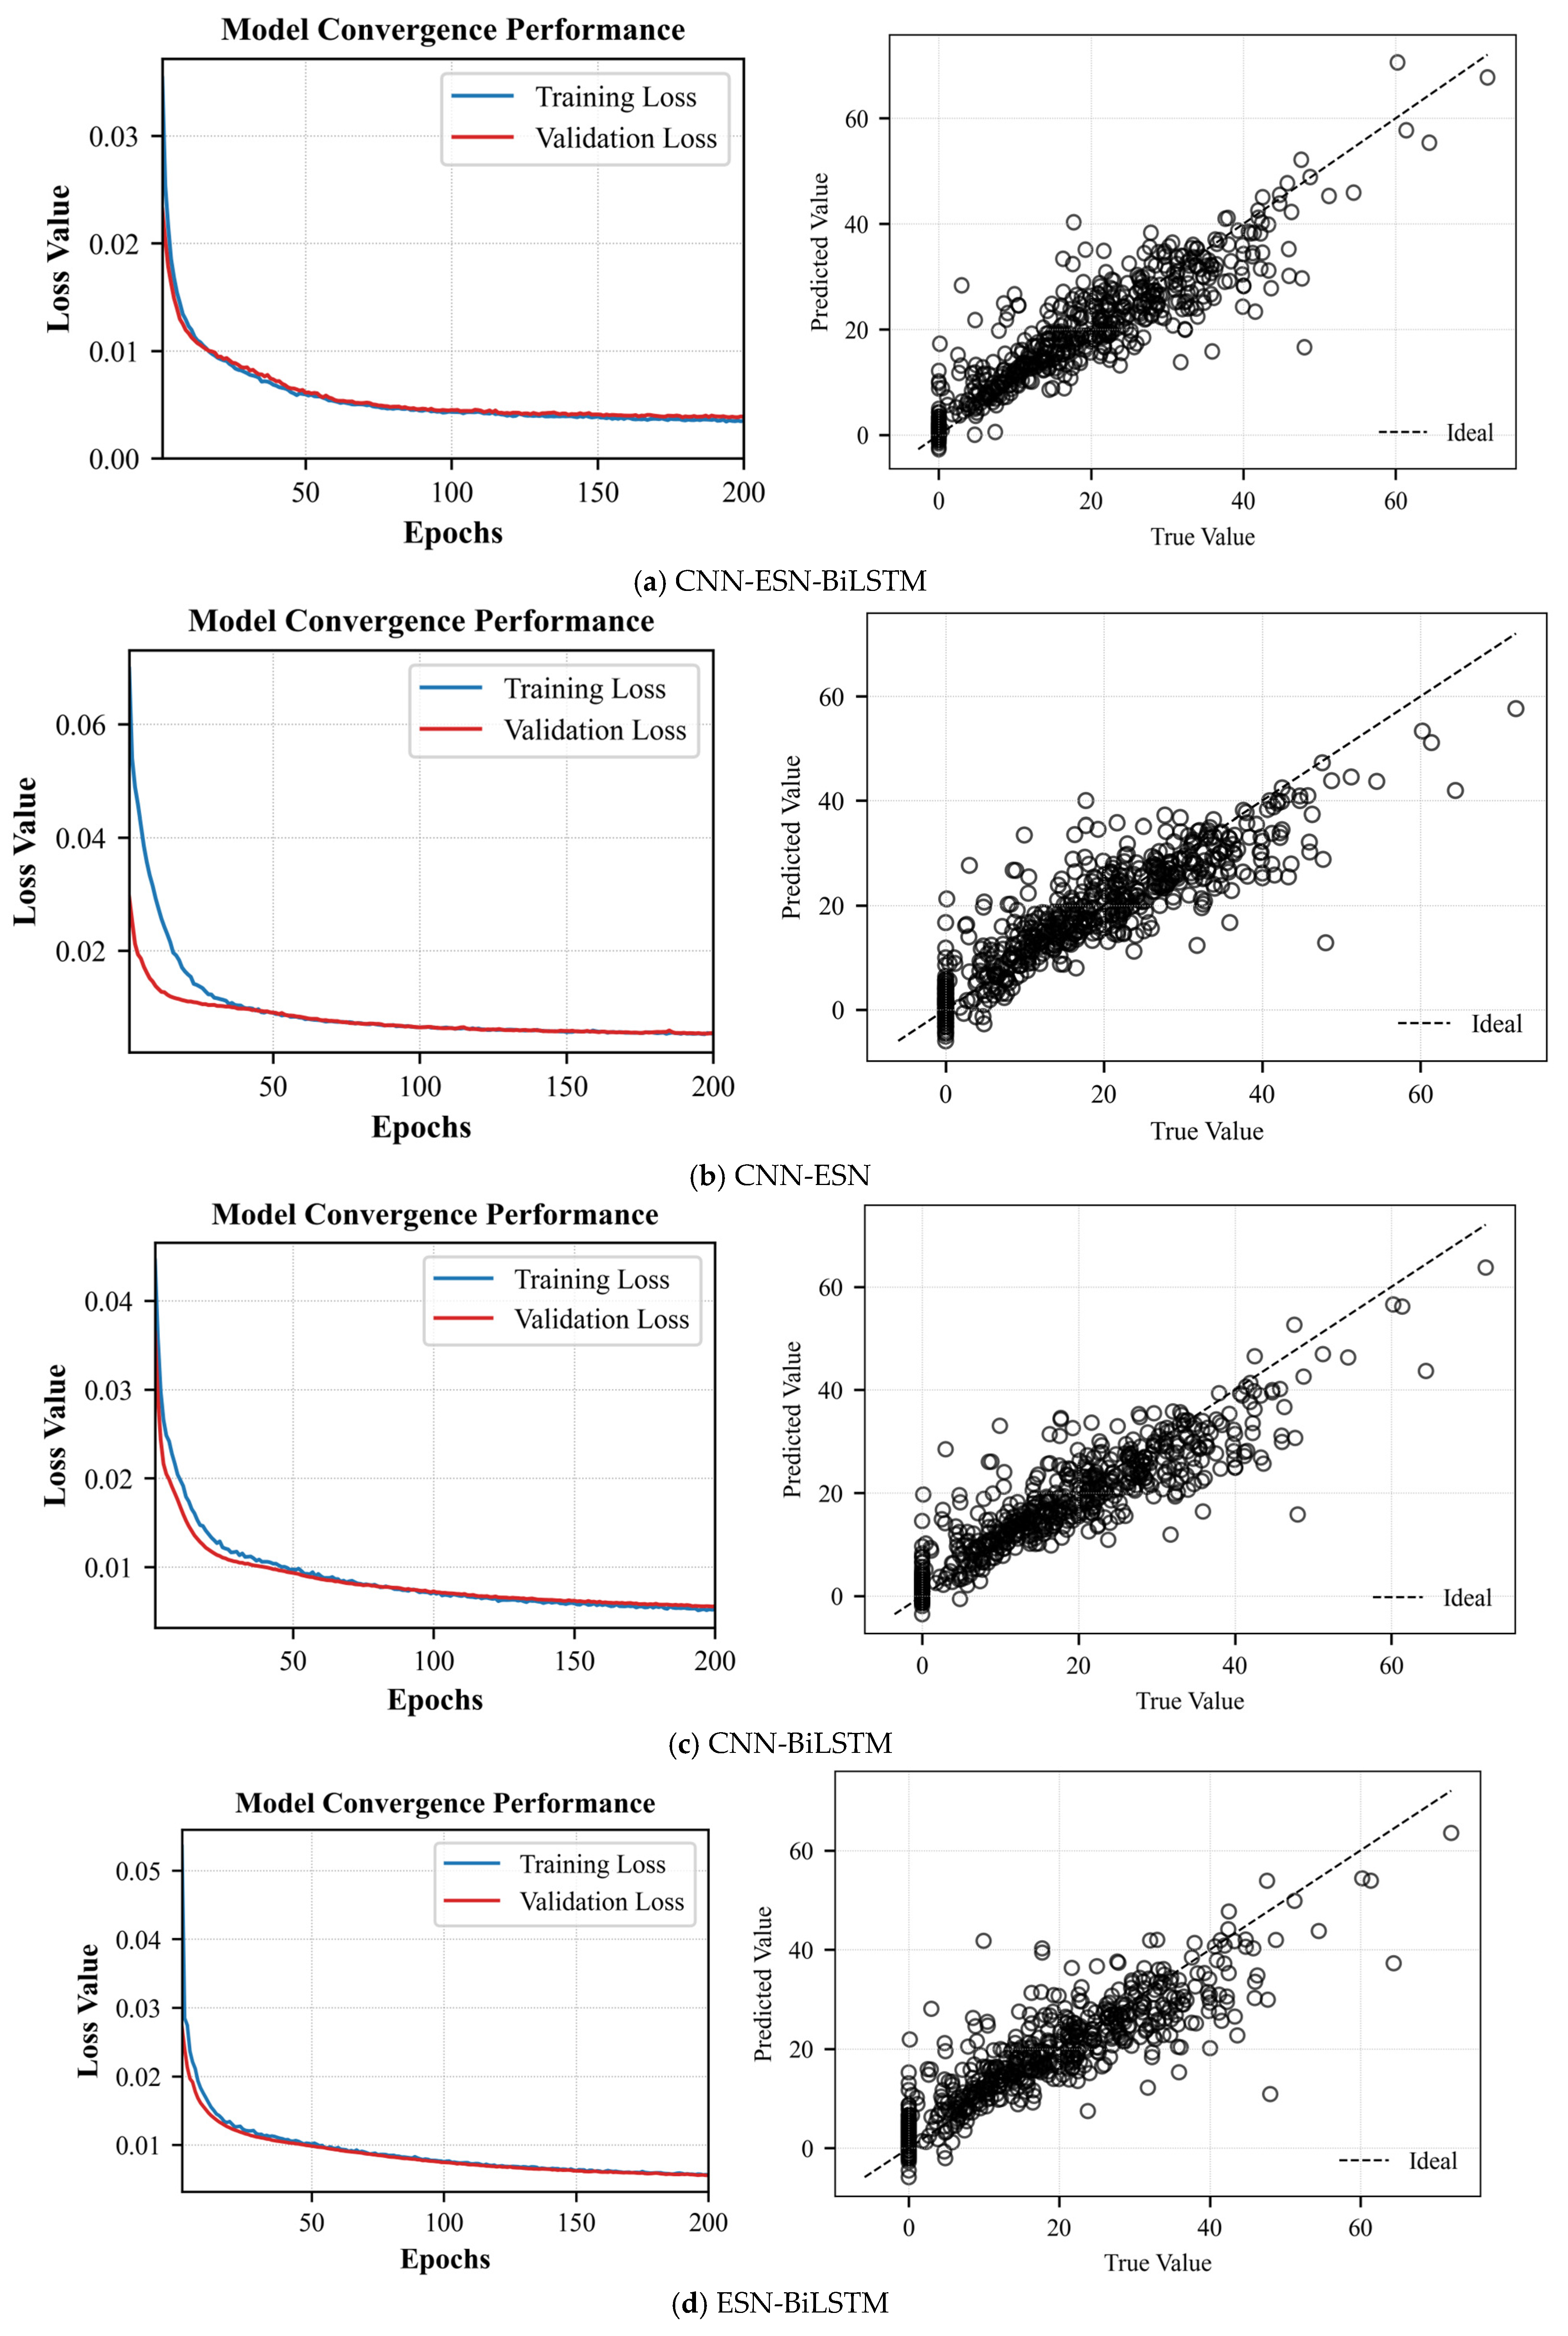
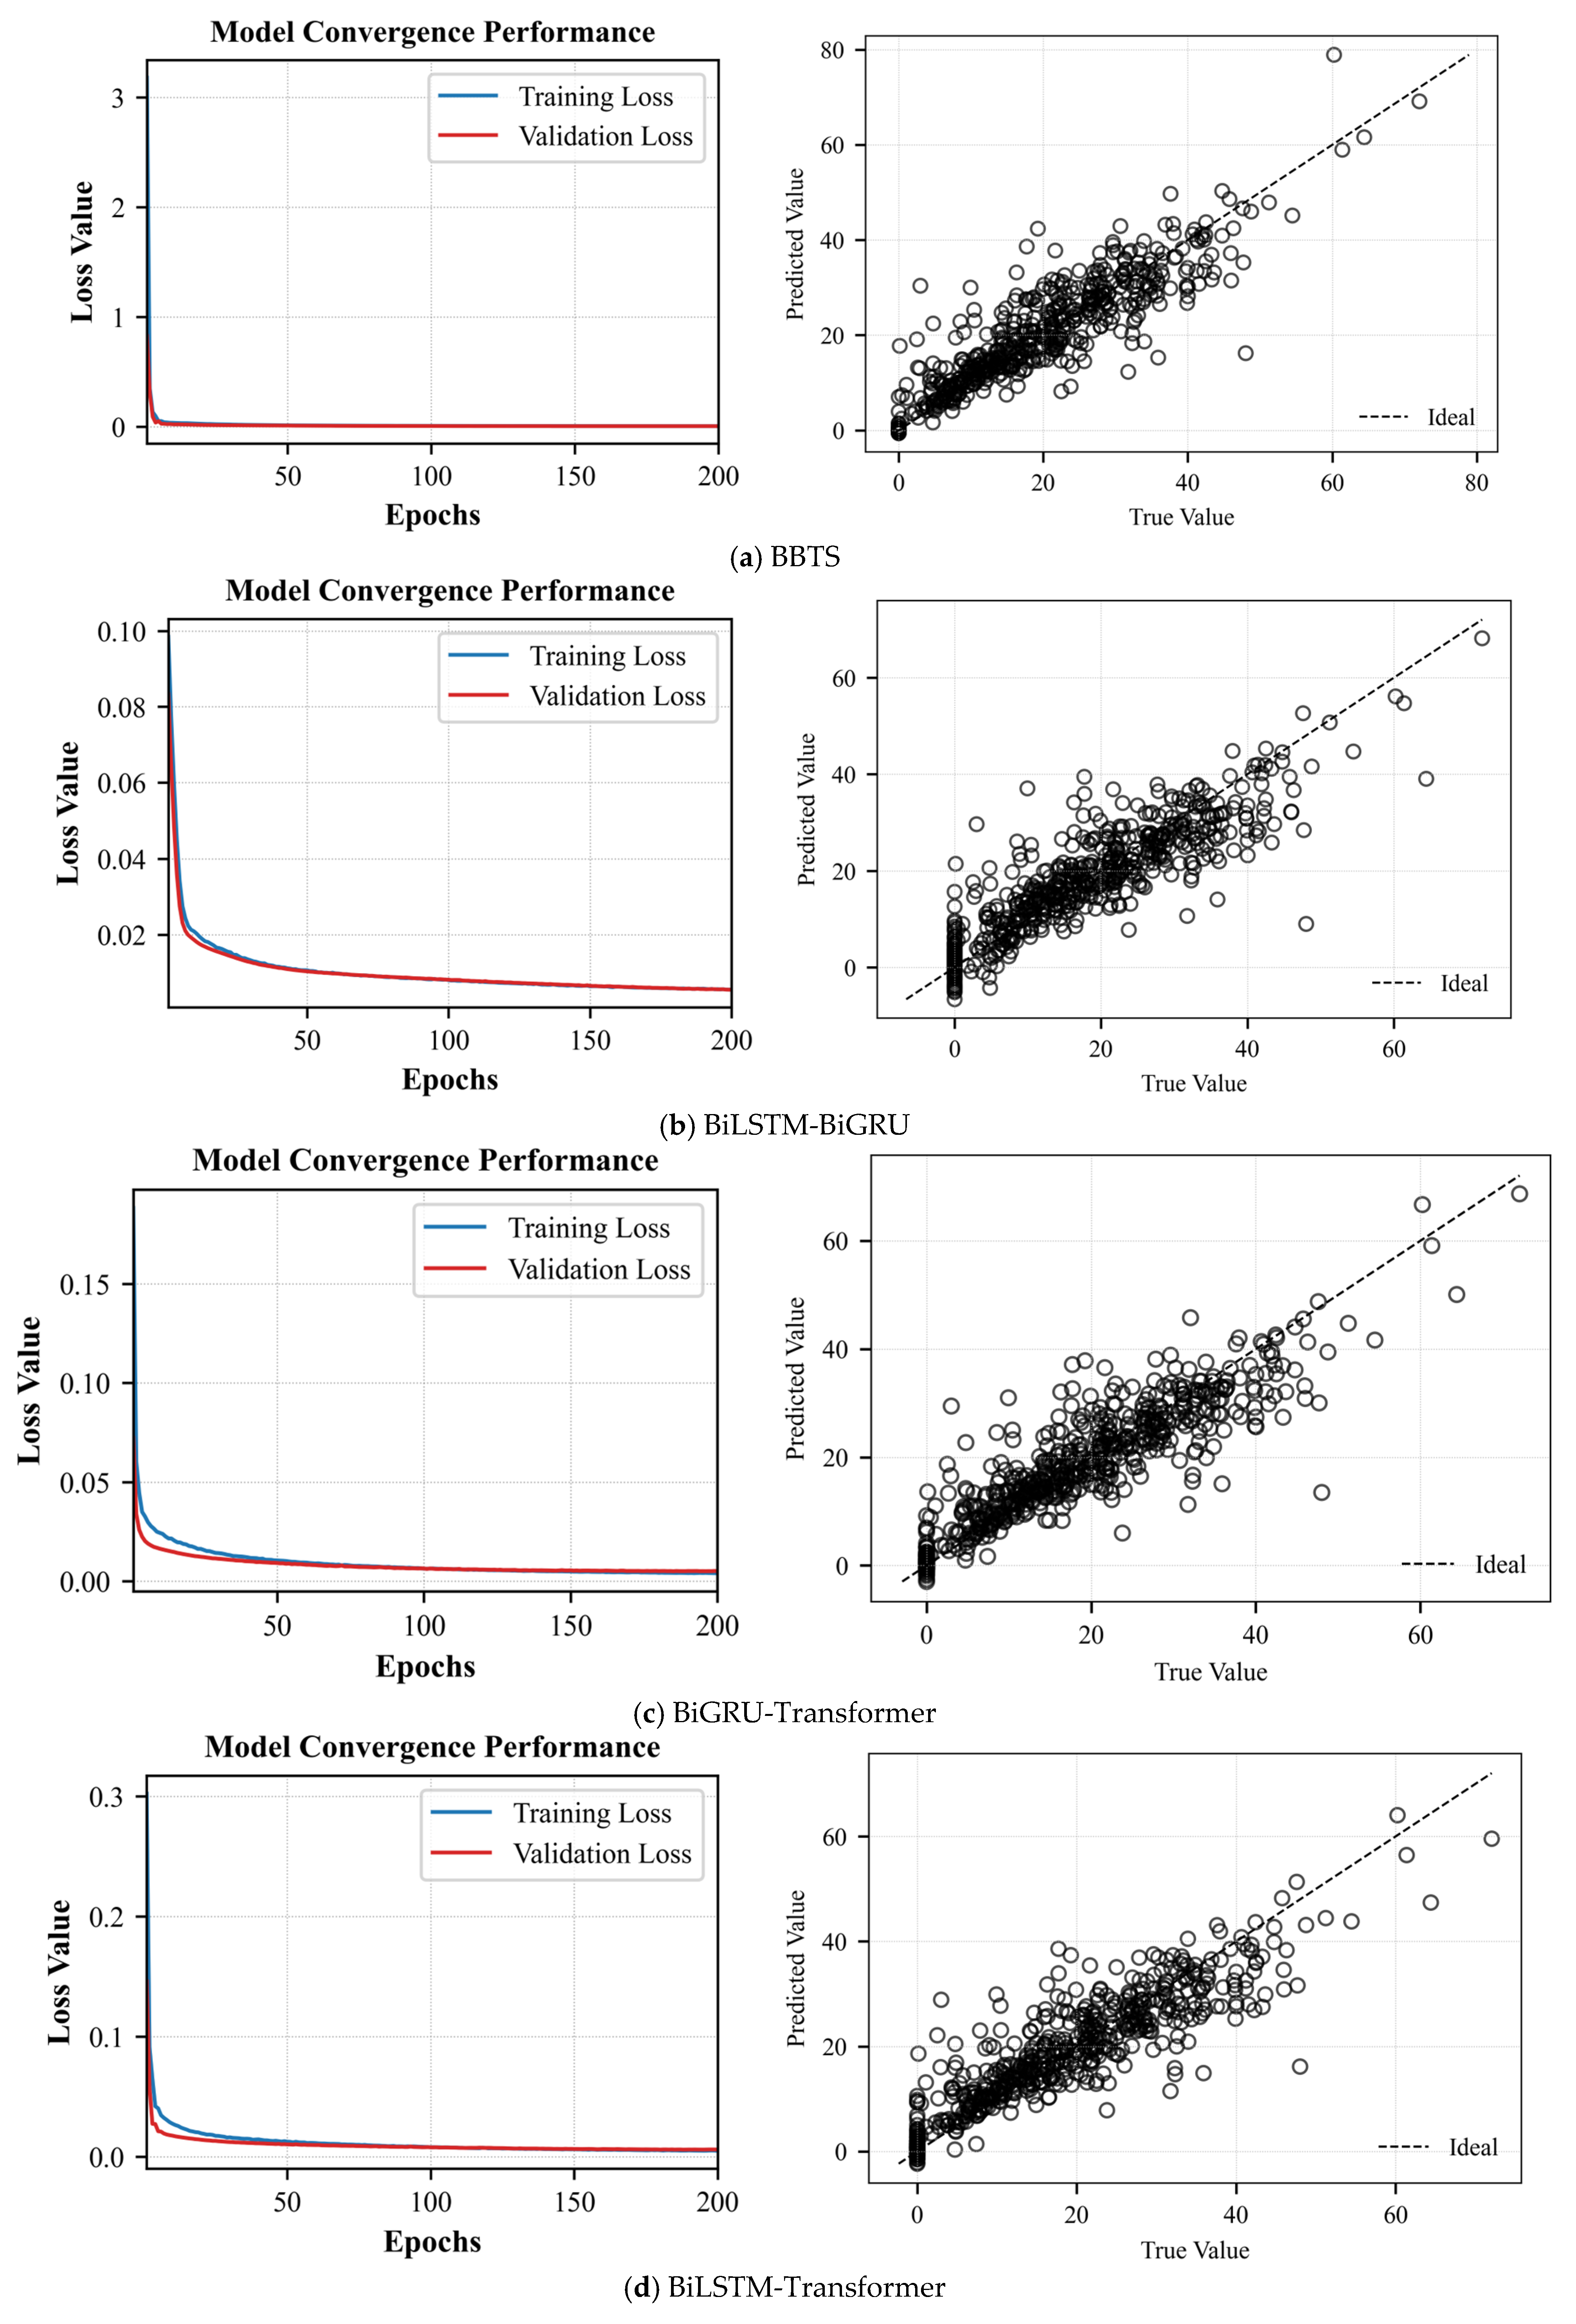
To assess the effectiveness of the proposed models, we conducted experiments on the CNN–ESN–BiLSTM, BiLSTM–BiGRU–Transformer, and CNN–ESN–BiGRU architectures, as well as on the selective heterogeneous ensemble–based online soft-measurement method for rod-pump system efficiency.
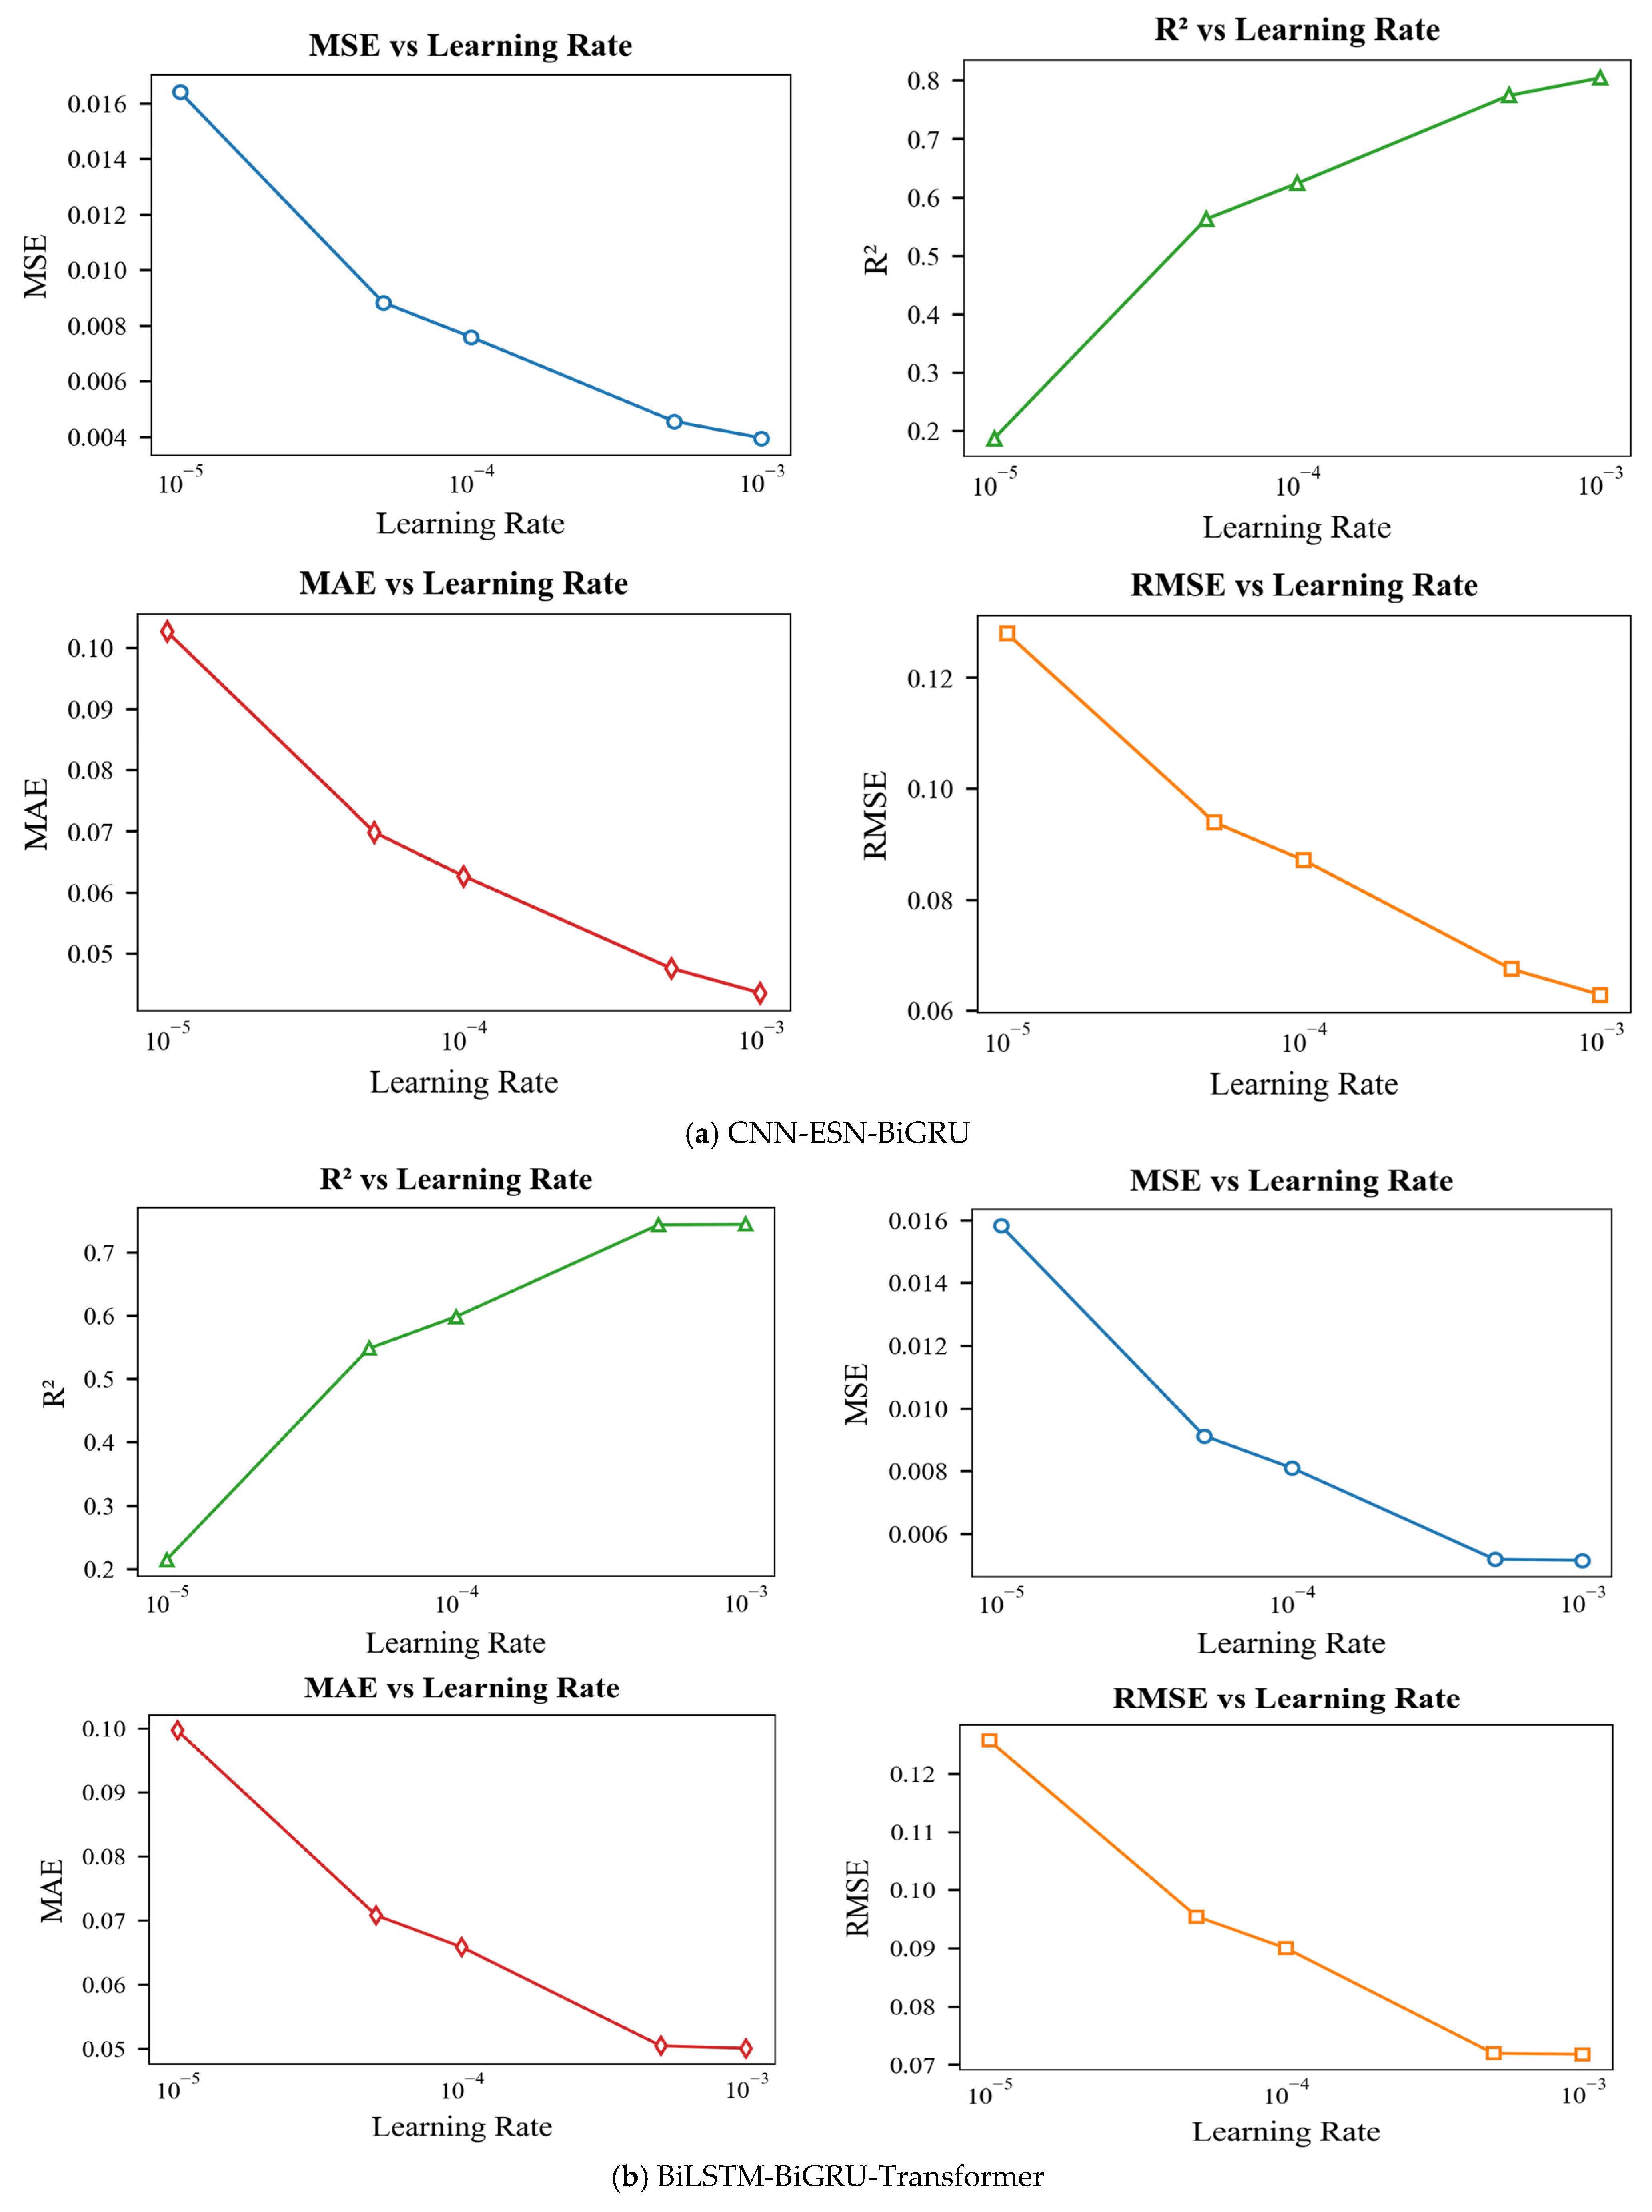
CNN-ESN-BiLSTM: To validate the CNN–ESN–BiLSTM approximate model, we used the following hyperparameters: a learning rate of 0.001, 200 training epochs, a batch size of 500, a single hidden layer with 20 neurons, a dropout rate of 0.5, a reservoir size of 500, a spectral radius of 1.2, an input scaling factor of 1.0, sparsity of 0.2, and a leak rate of 1.0.
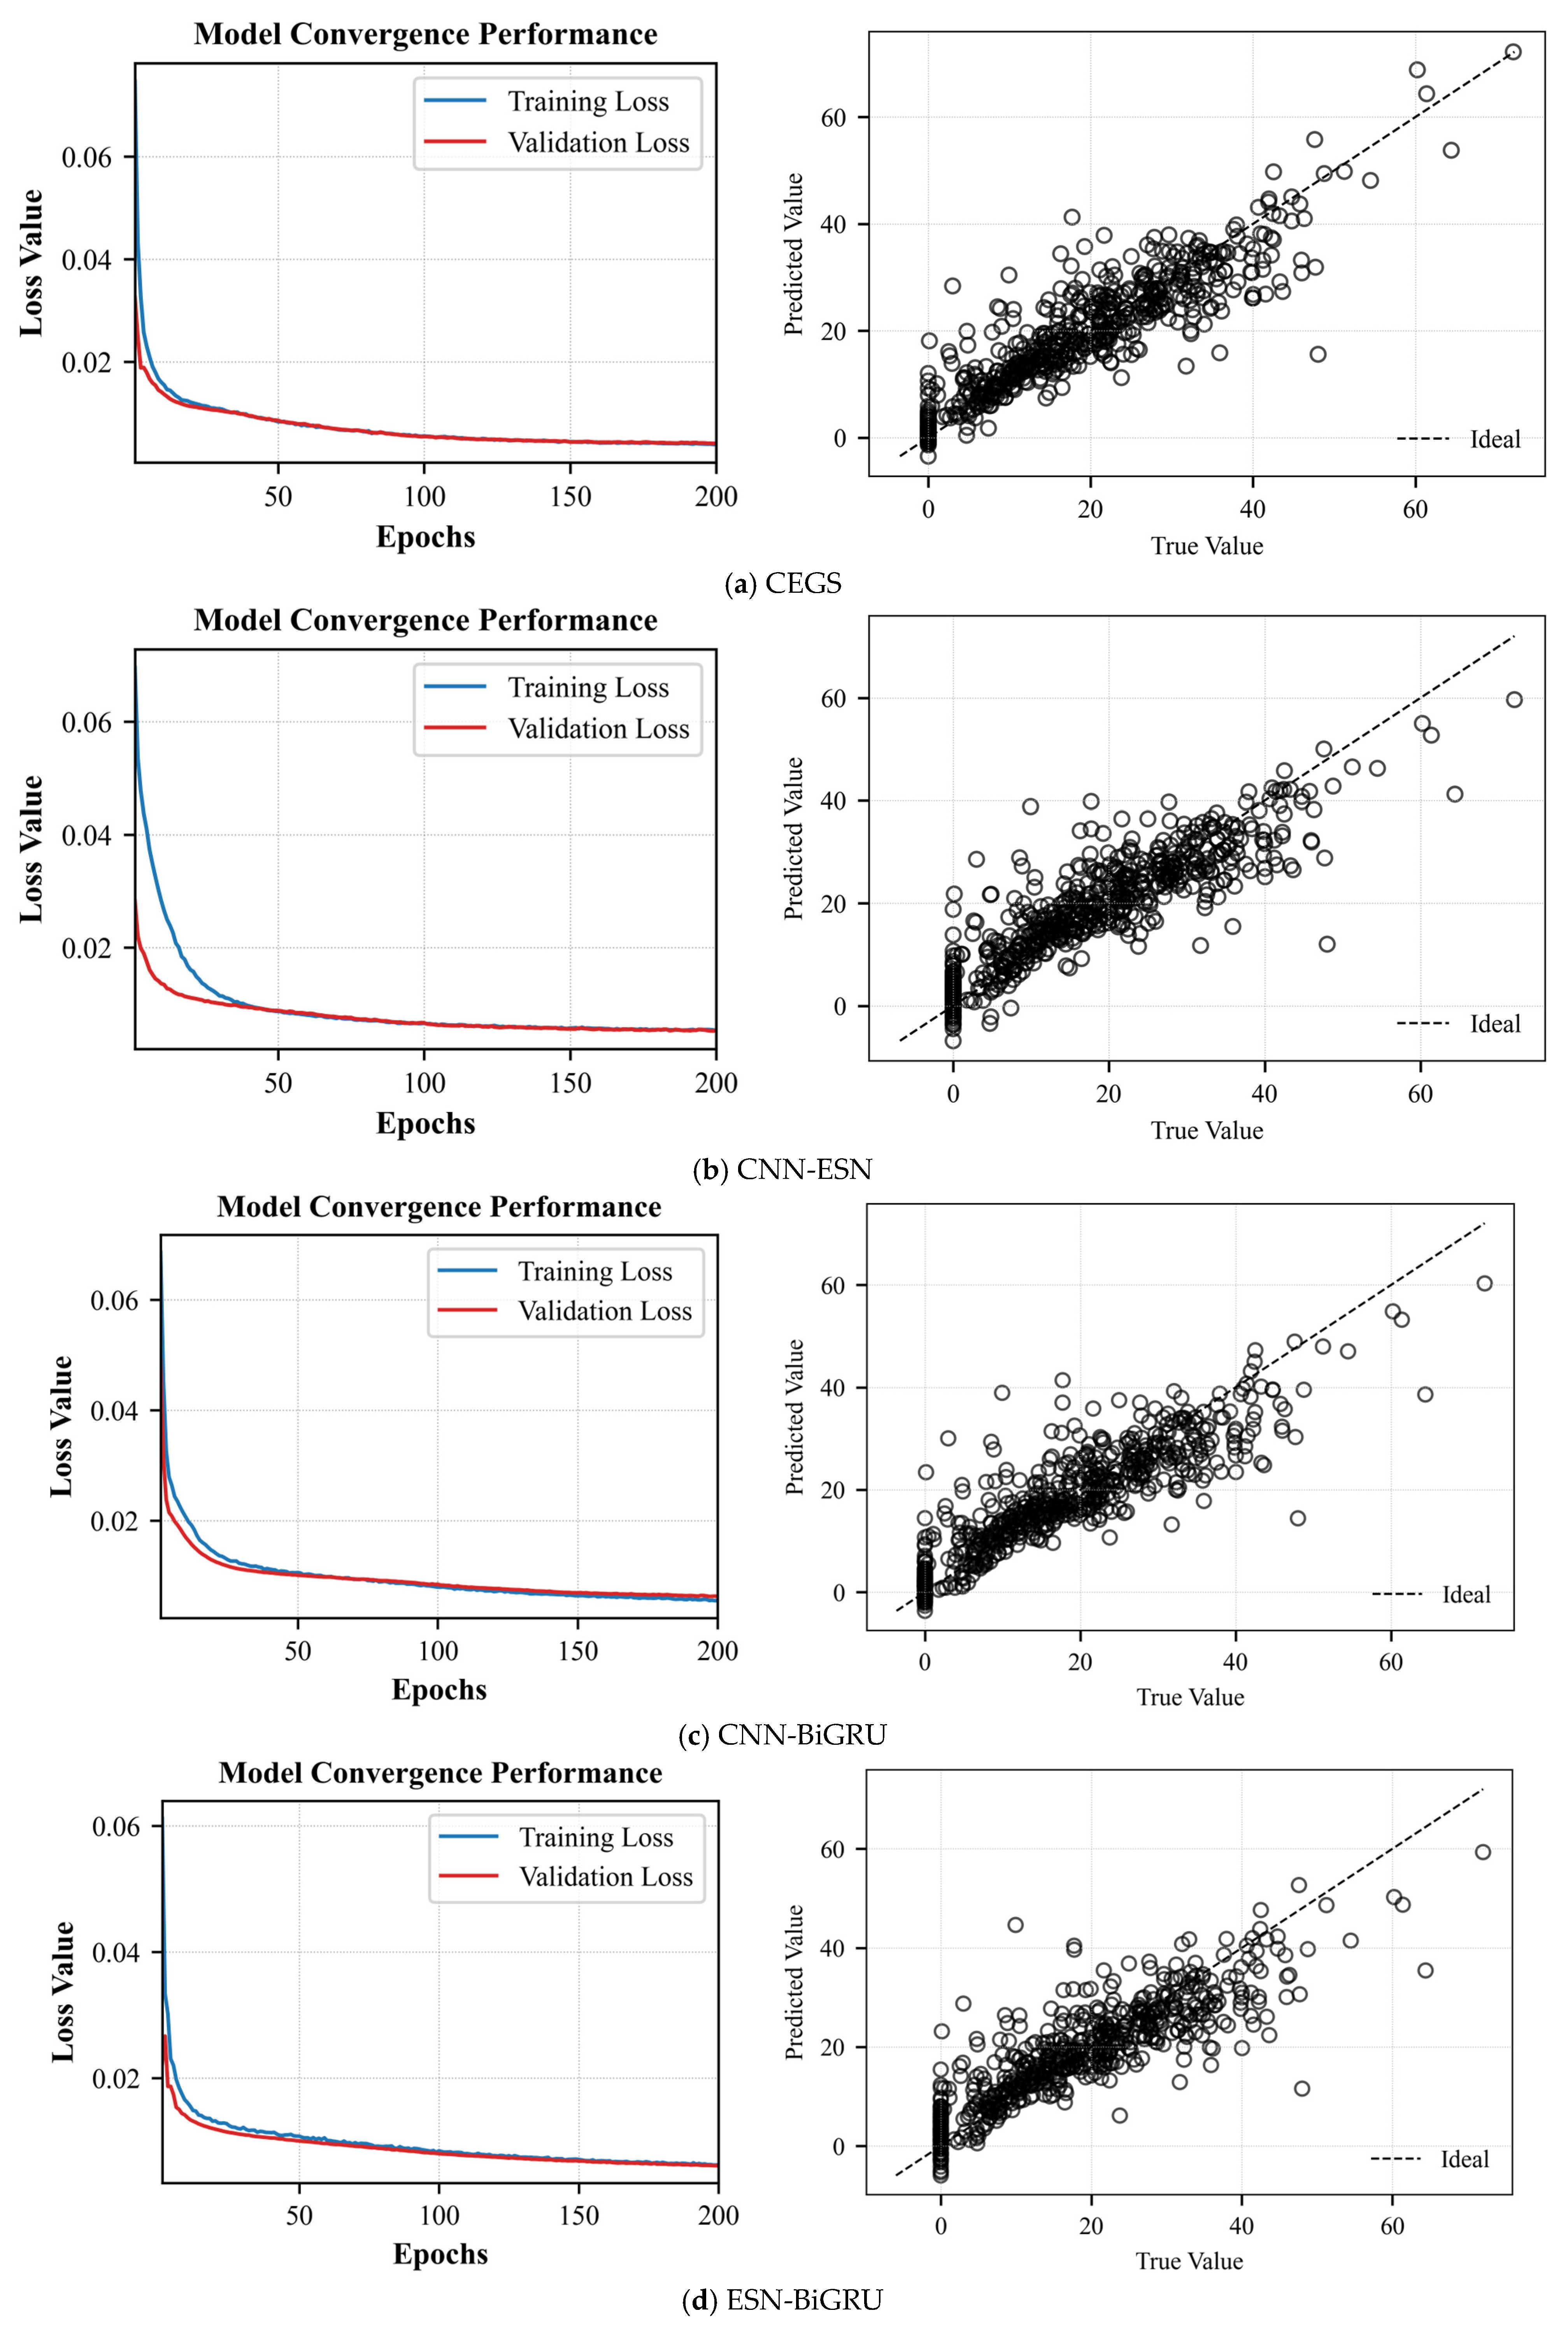
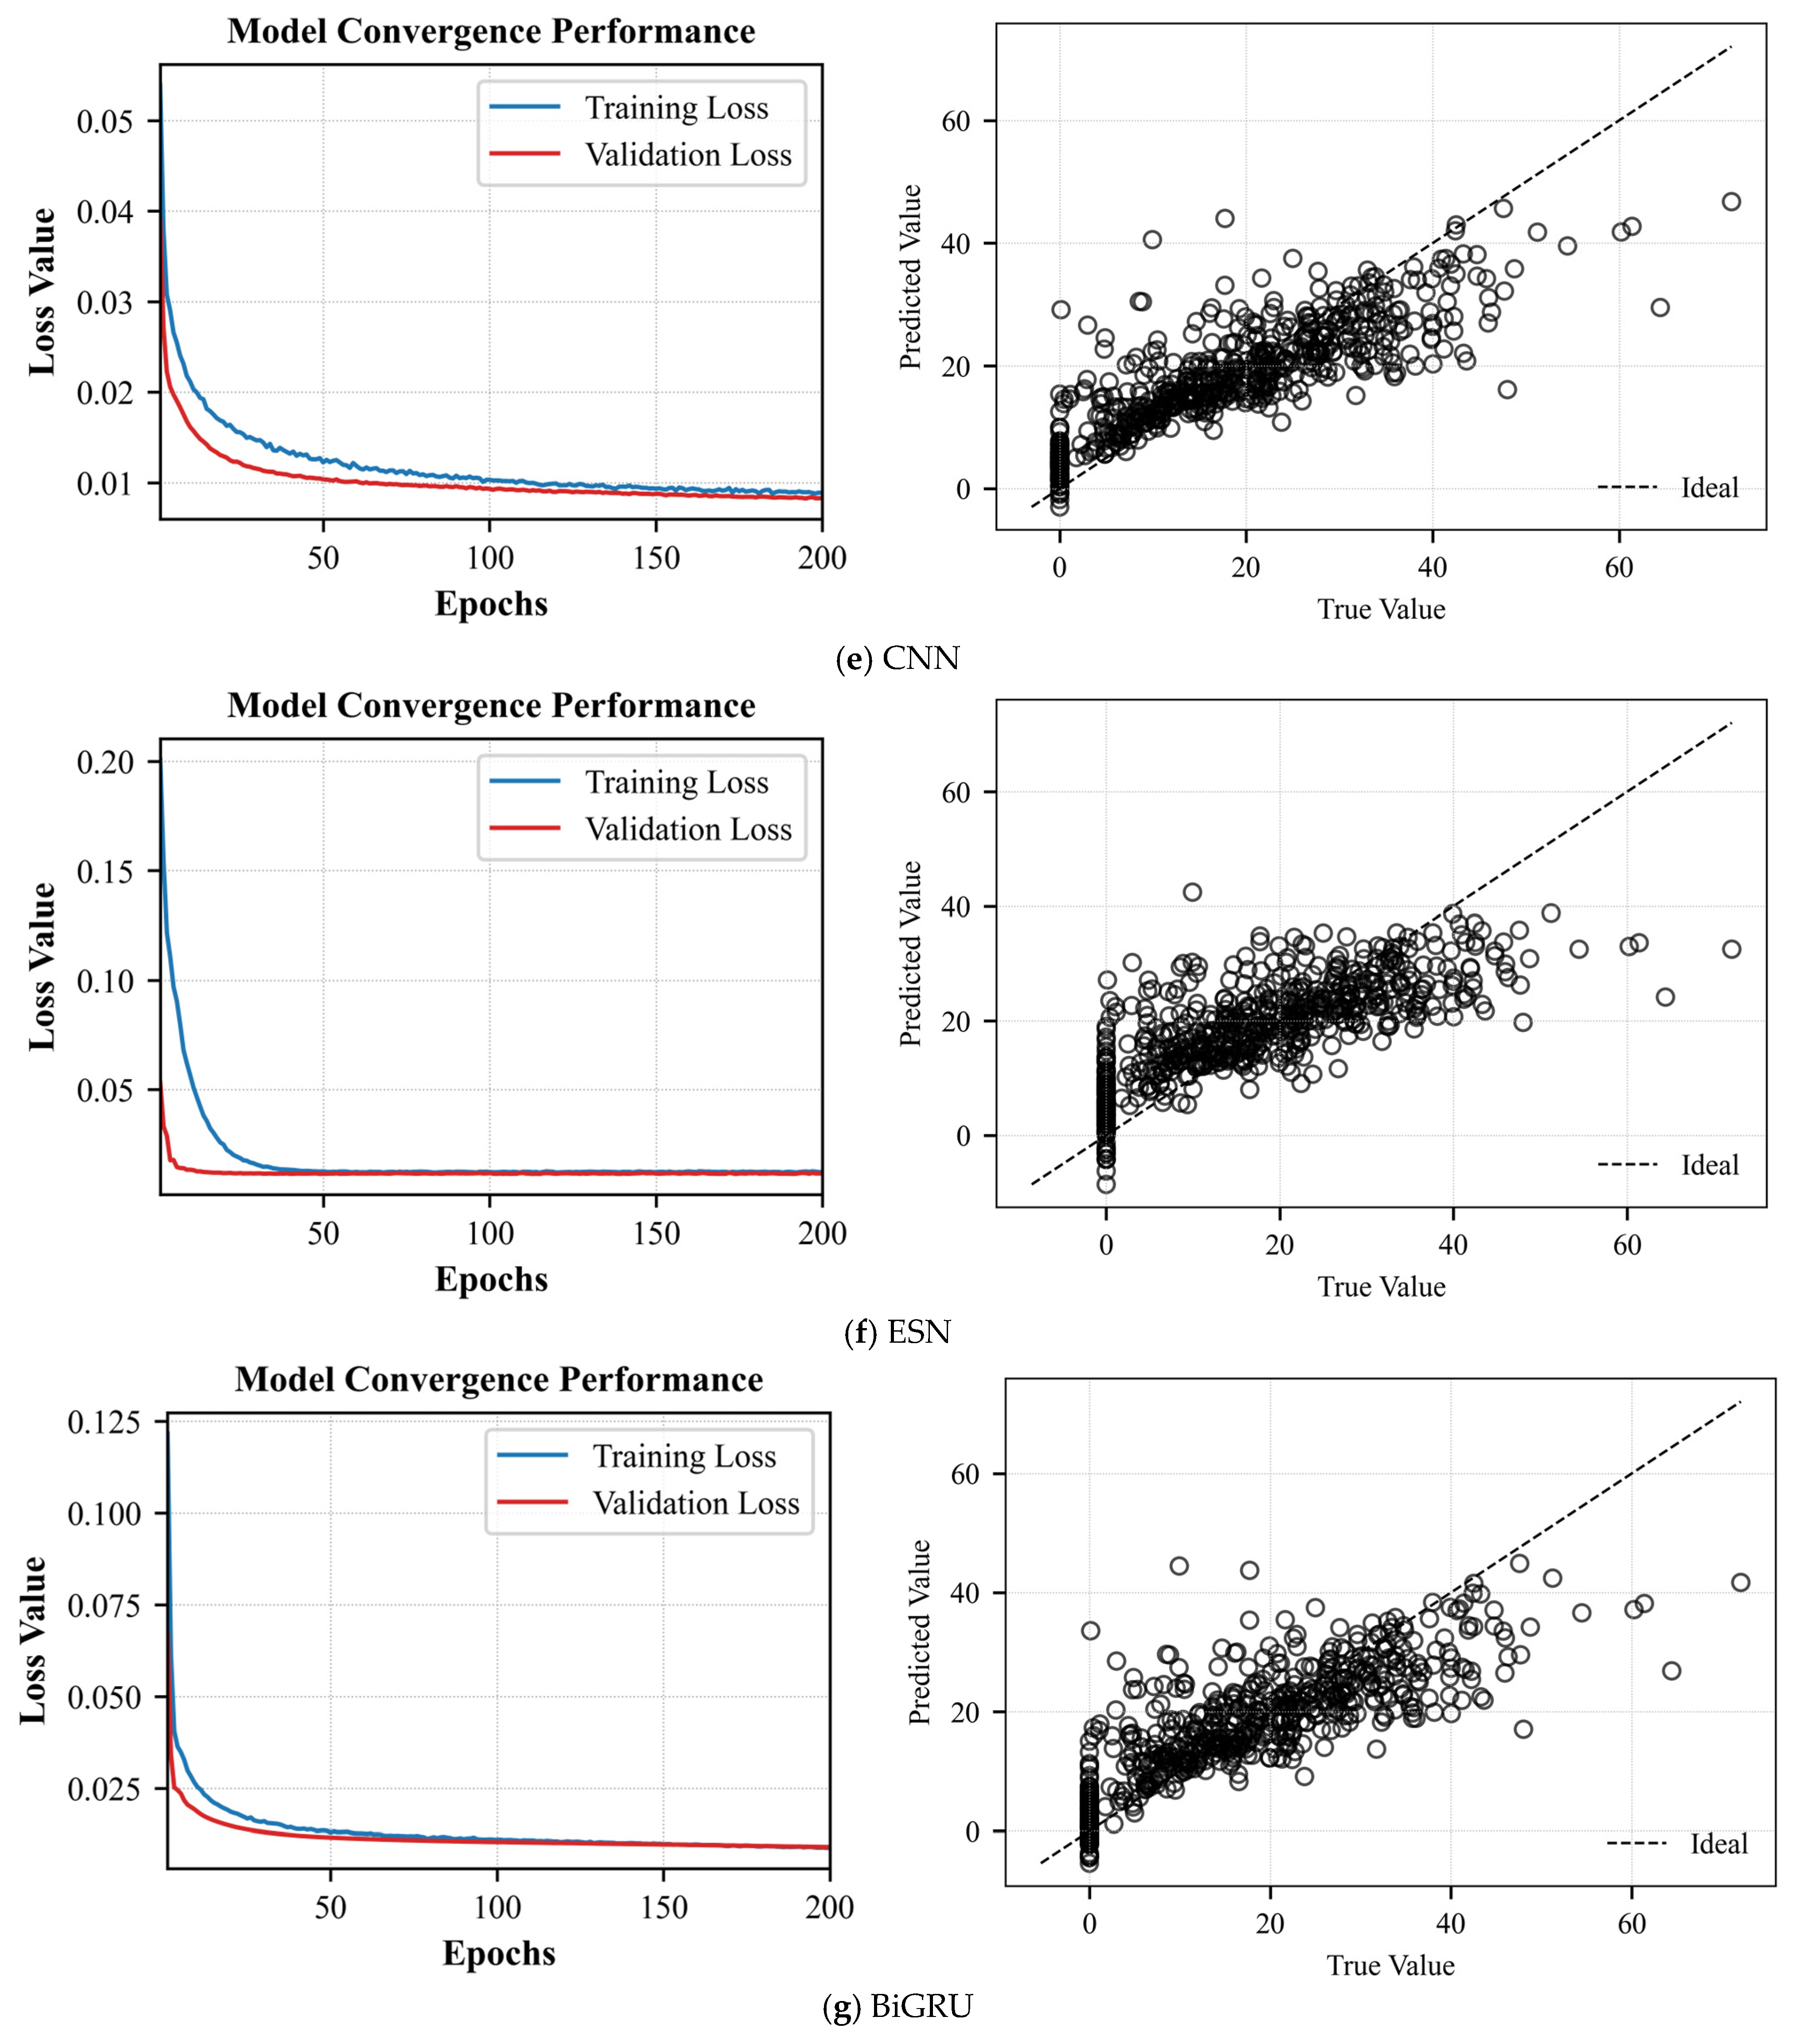
Figure 7 shows the average loss curves and the mean prediction scatter plots obtained from five experiments.
Table 6 summarizes the mean evaluation metrics, along with their standard deviations, across the five experiments.
BiLSTM-BiGRU-Transformer: To validate the BiLSTM–BiGRU–Transformer approximate model, the following settings were used: a learning rate of 0.001, 200 training iterations, a batch size of 500, one hidden layer with 10 neurons, and a dropout rate of 0.1.
Figure 7 shows the average loss curves and the mean prediction scatter plots obtained from five experiments.
Table 6 summarizes the mean evaluation metrics, along with their standard deviations, across the five experiments.
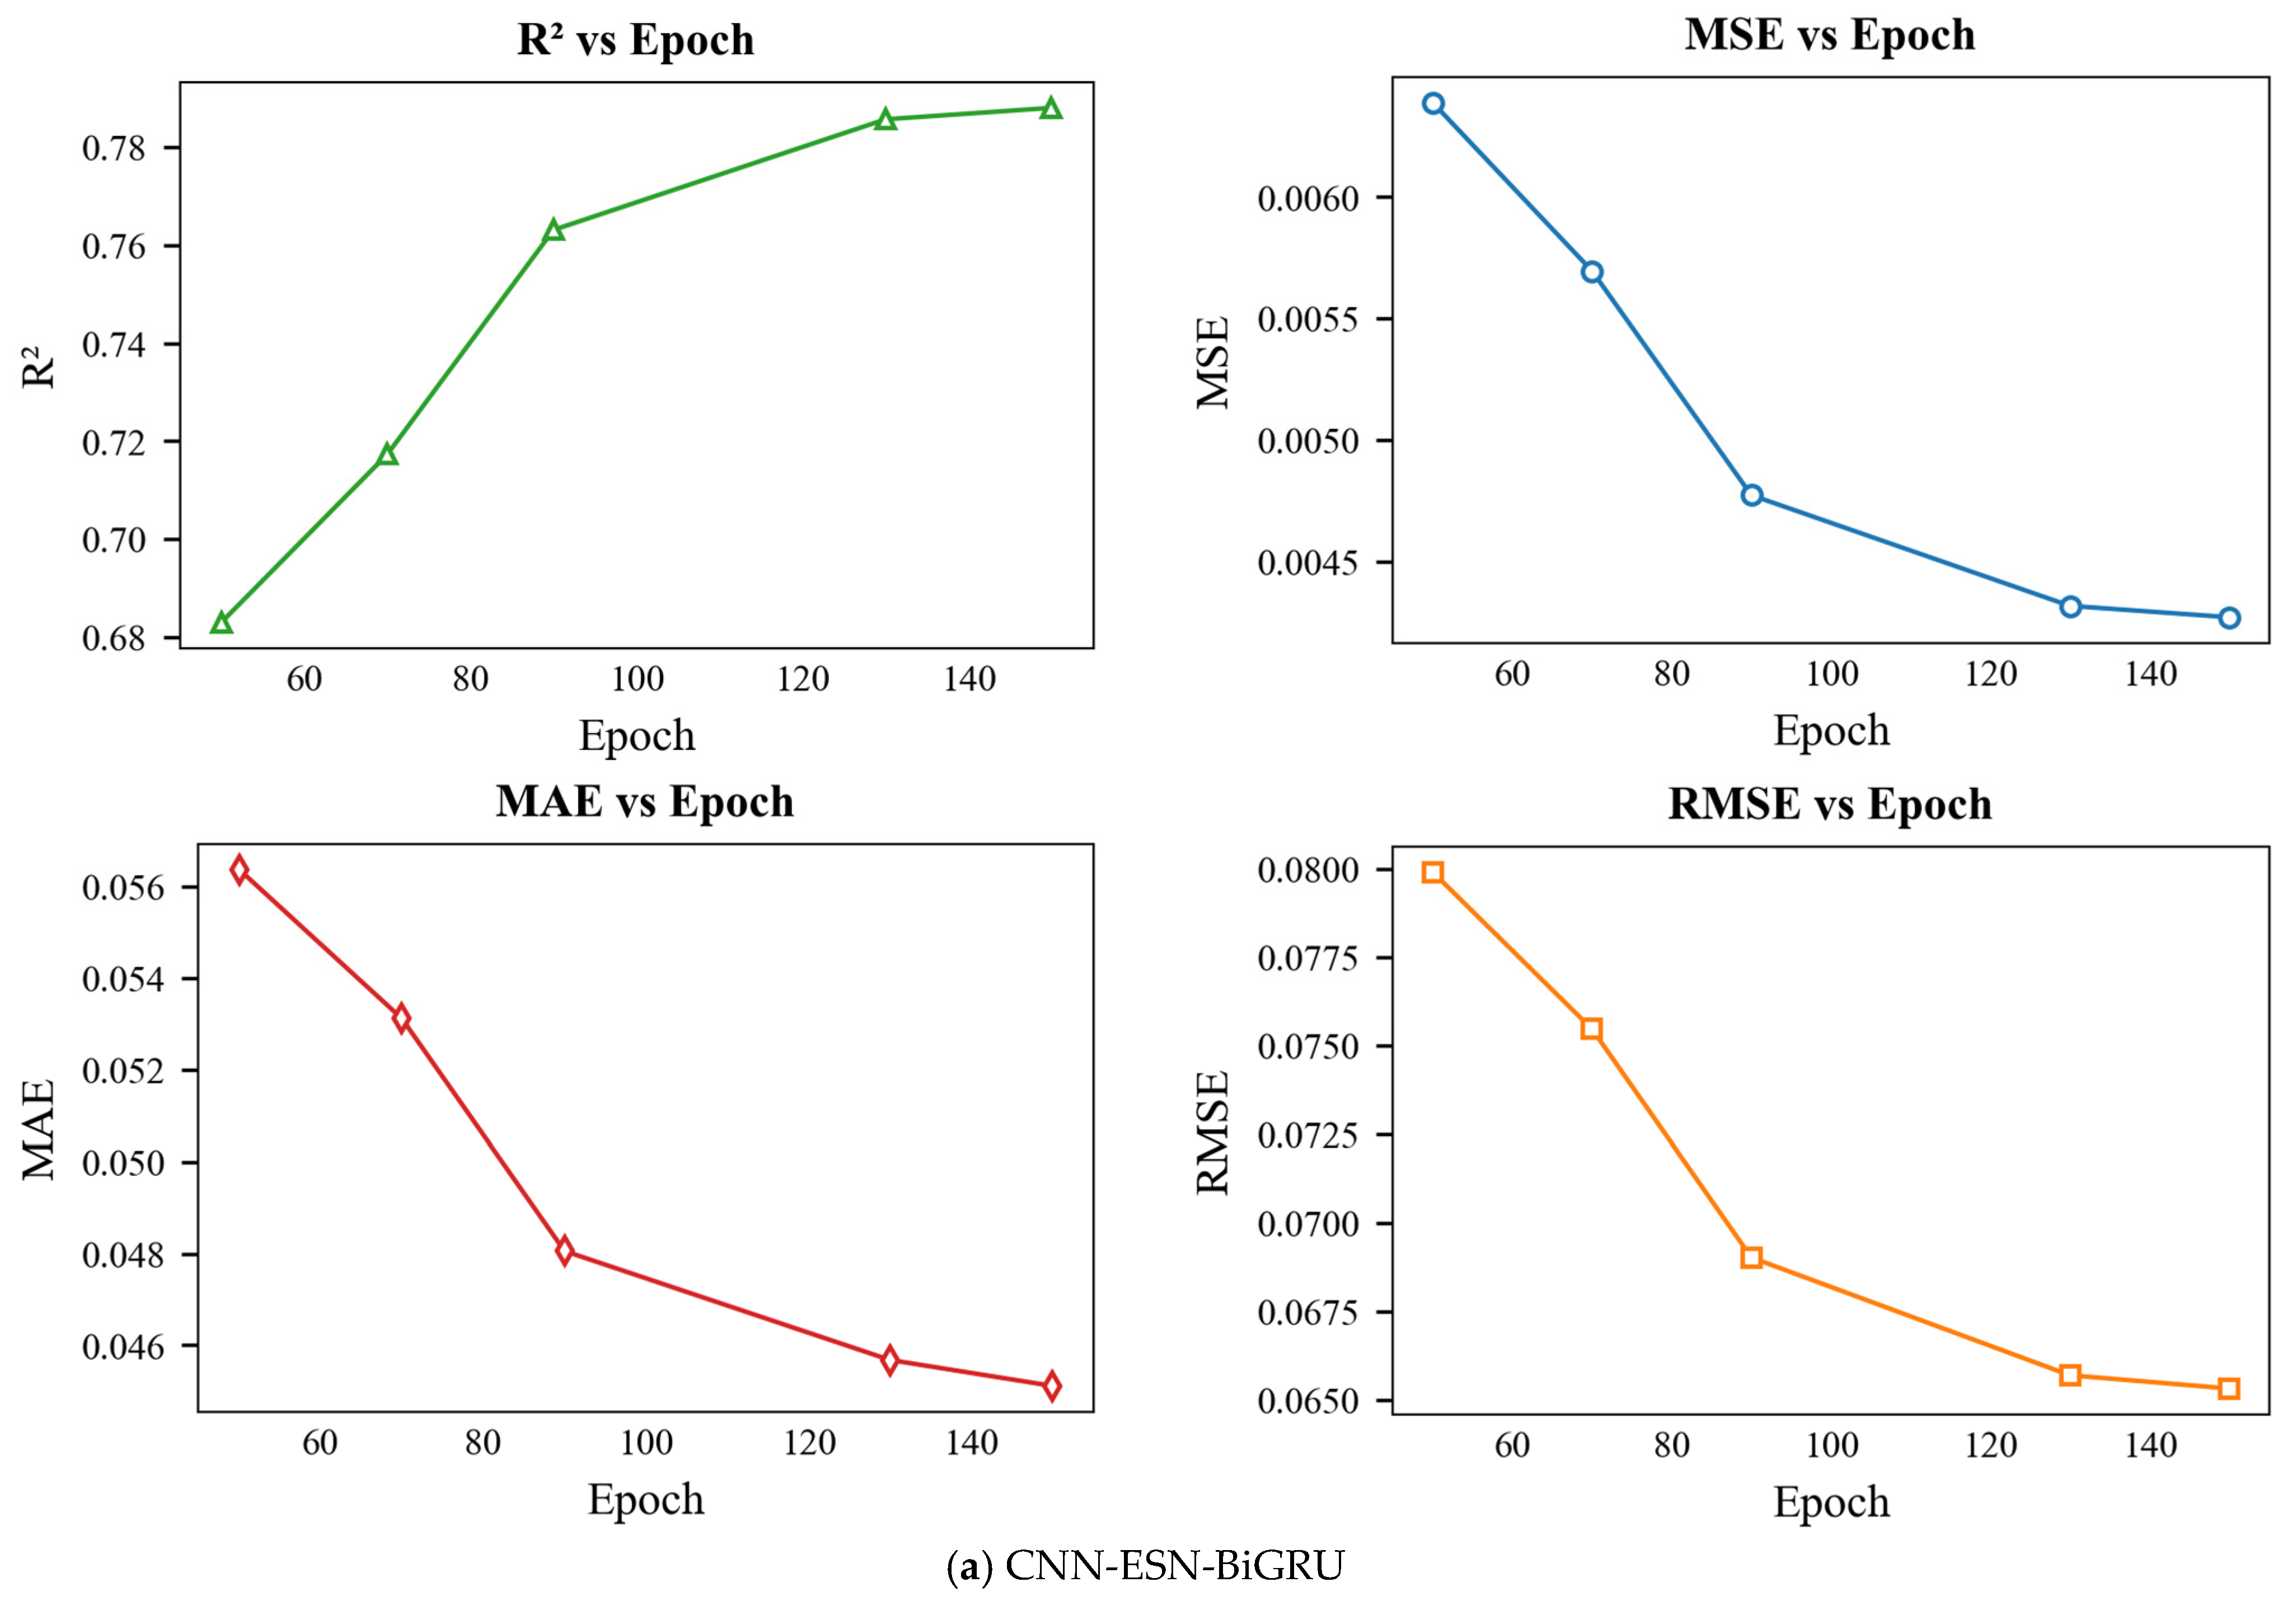
CNN-ESN-BiGRU: To validate the CNN–ESN–BiGRU approximate model, we used a learning rate of 0.001, 200 training iterations, a batch size of 500, one hidden layer with 20 neurons, a dropout rate of 0.5, a reservoir size of 500, a spectral radius of 1.2, an input scaling factor of 1.0, a sparsity of 0.2, and a leak rate of 1.0.
Figure 7 shows the average loss curves and the mean prediction scatter plots obtained from five experiments.
Table 6 summarizes the mean evaluation metrics, along with their standard deviations, across the five experiments.
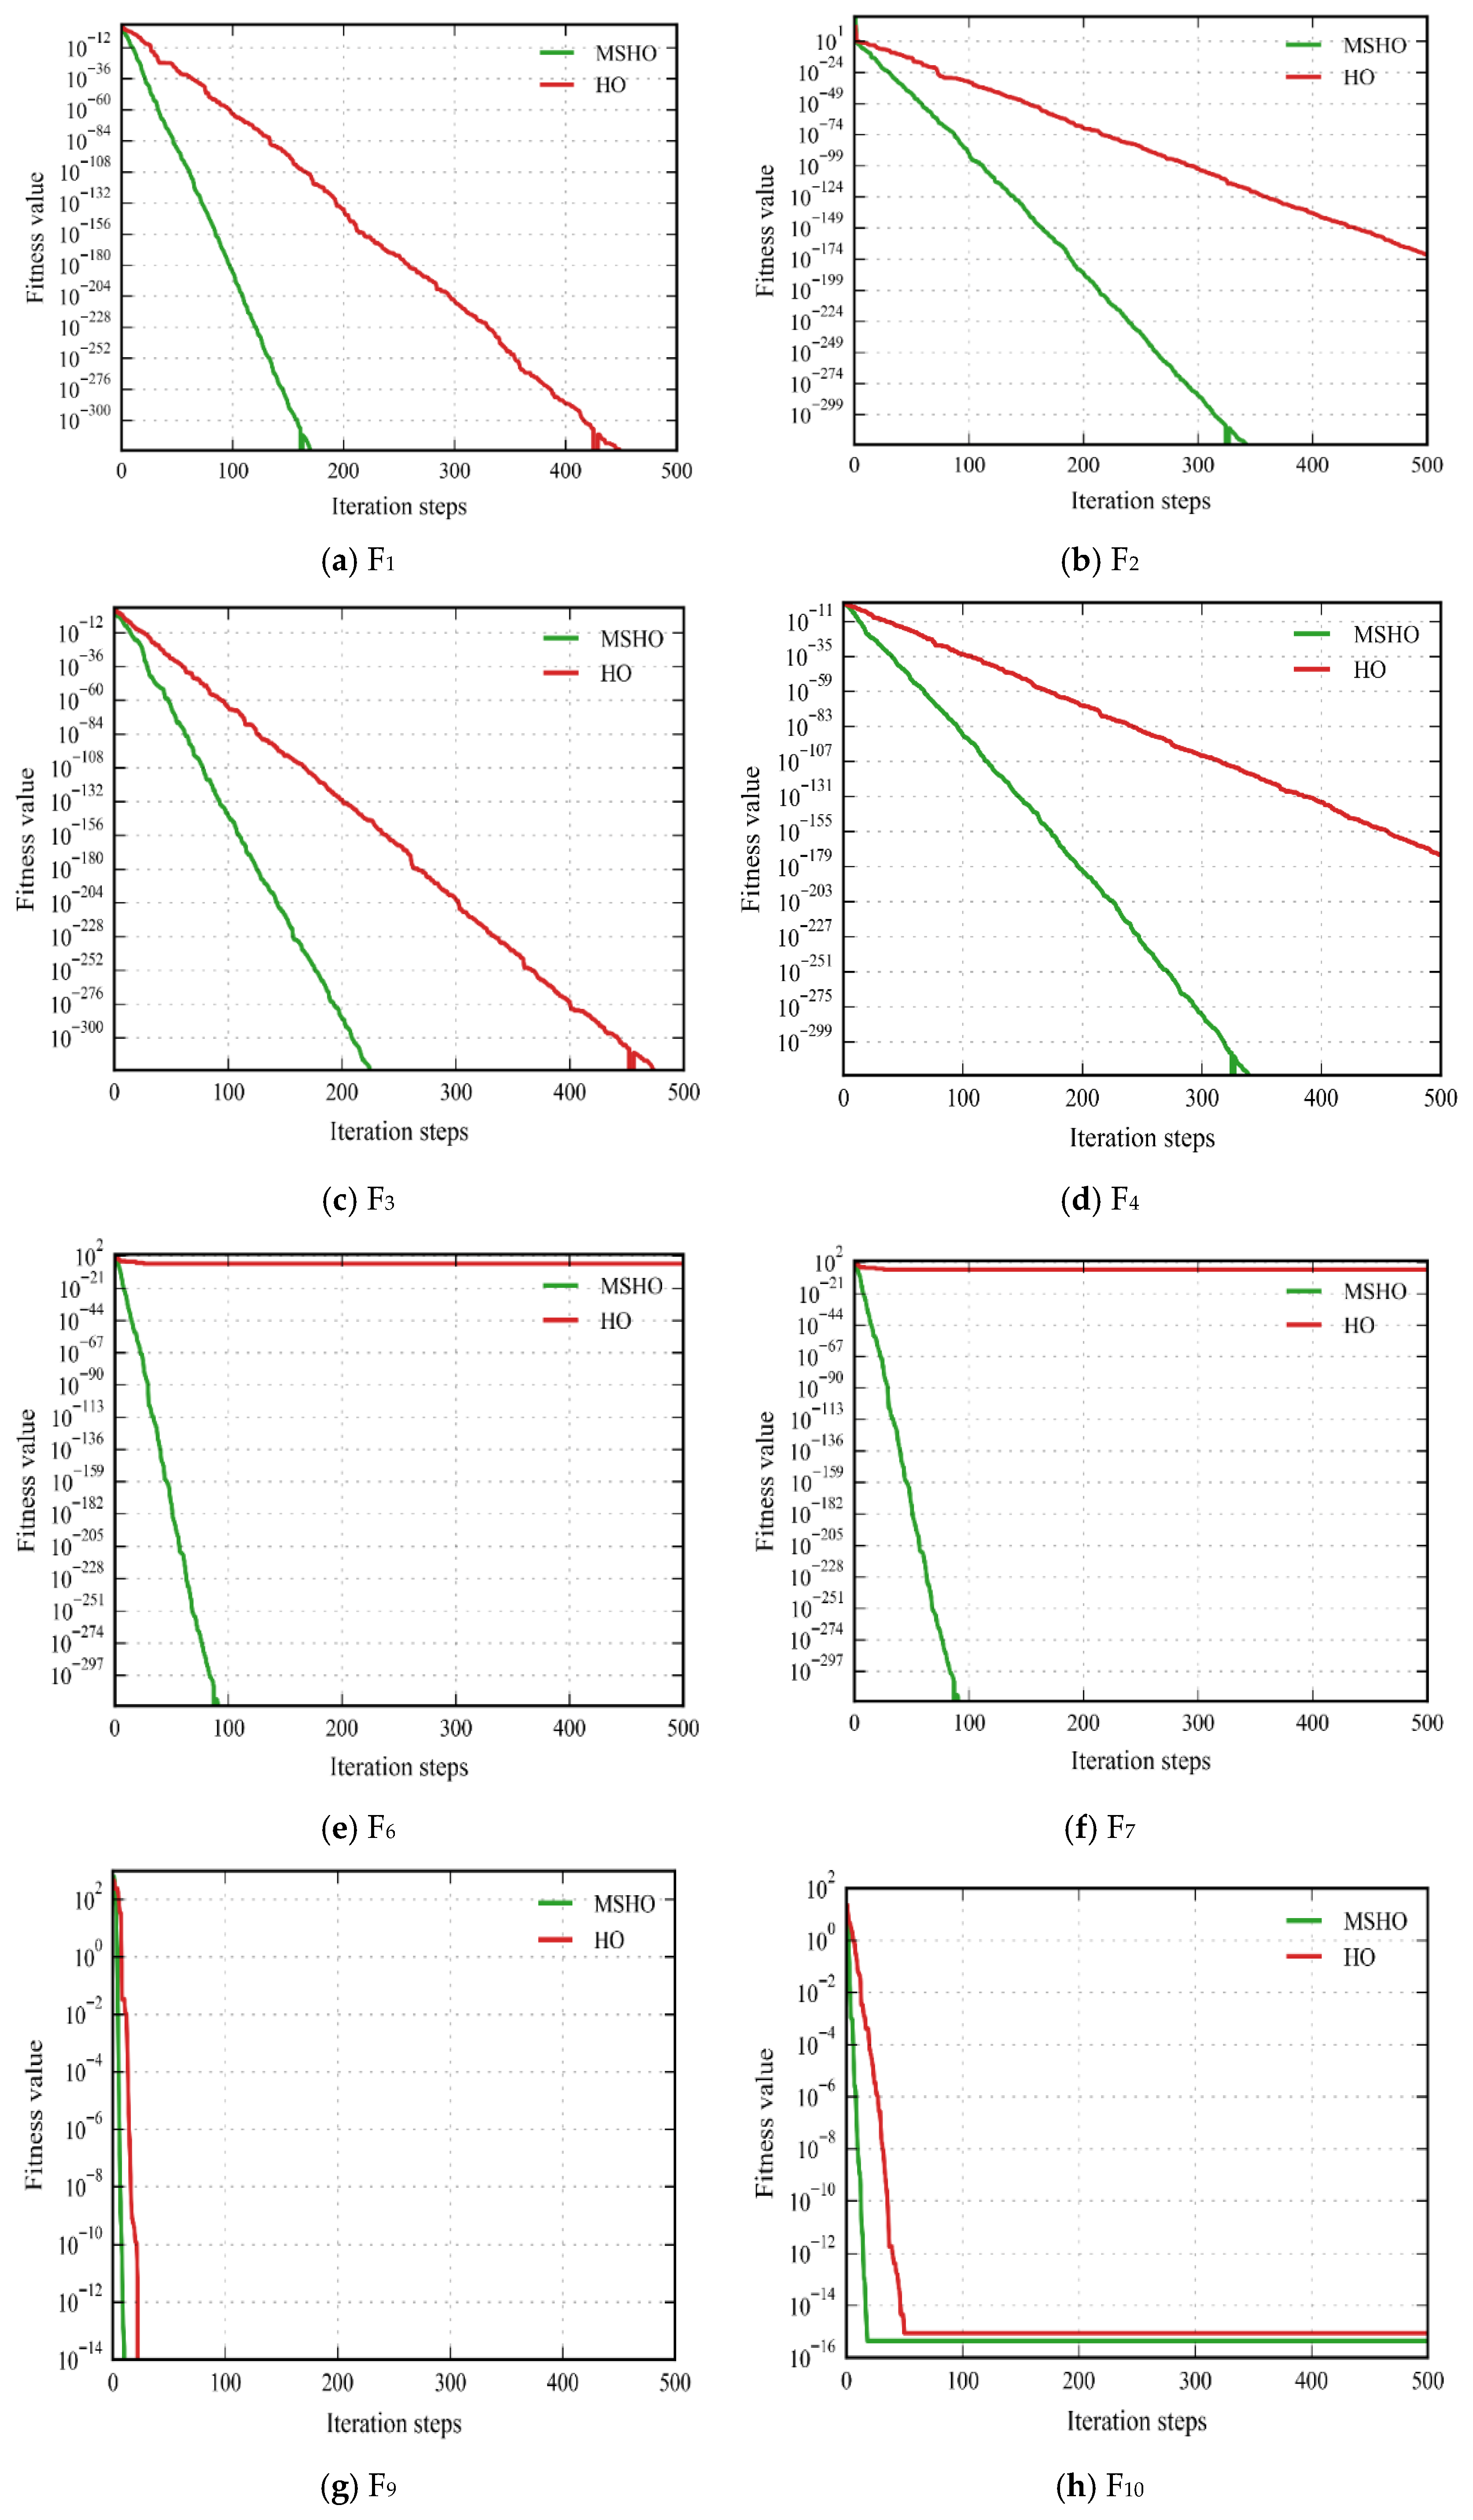
SHSE: Since the SHSE approximate model optimizes key hyperparameters—including base learner count, learning rate, hidden neurons per layer, dropout coefficient, hidden layer depth, and weighting coefficients—through MSMOMSA and MSHO algorithms, we configured model parameters as follows: CNN-ESN-BiLSTM: 200 iterations, batch size 500, reservoir size 500, spectral radius 1.2, input scaling 1, sparsity 0.2, leakage rate 1; BiLSTM-BiGRU-Transformer: 200 iterations, batch size 500; CNN-ESN-BiGRU: 200 iterations, batch size 500, reservoir size 500, spectral radius 1.2, input scaling 1, sparsity 0.2, leakage rate 1. For optimization algorithms: MSMOMSA: Population size 10, 100 iterations; MSHOA: Population size 10, 1000 iterations.
Figure 7 shows the average loss curves and the mean prediction scatter plots obtained from five experiments.
Table 6 summarizes the mean evaluation metrics, along with their standard deviations, across the five experiments.
From
Figure 7a and
Table 6, it can be observed that both training and validation average losses decrease rapidly within the first 50 epochs, indicating that the model completes the primary parameter tuning during the early stage. Subsequently, the average loss curves continue to decline slowly and eventually stabilize around 0.003–0.005 by the 200th epoch. The training and validation losses maintain a small and stable gap throughout, with no significant divergence or rebound, suggesting that the model does not suffer from severe overfitting or underfitting. The scatter plot points are generally distributed along the diagonal line, covering an efficiency range from 0% to 70%. The model achieves an MSE of 0.0038 ± 0.00019, an RMSE of 0.0613 ± 0.00080, an R
2 score of 0.8133 ± 0.0050, and a MAE of 0.0425 ± 0.00054. The low MSE, RMSE, and MAE values demonstrate high prediction accuracy, while the R
2 value exceeding 0.81 confirms that the model explains the majority of the variance in the data. These results collectively indicate that the proposed CEBS model exhibits both robustness and high predictive performance.
From
Figure 7b and
Table 6, it can be observed that within the first 10 epochs, the average training loss rapidly decreases from its initial value to below 0.01 after only a few iterations and continues to converge quickly toward zero during the subsequent 10–40 epochs. The average validation loss closely follows the average training loss throughout, with the two curves nearly overlapping after 30 epochs and remaining stable at very low values by the end of 200 epochs. Overall, there is no evident divergence or rebound in the average training and average validation losses, indicating that the model does not overfit during training and has sufficient capacity to fit complex functions without signs of underfitting. Most scatter points are concentrated near the diagonal line within the 0–70% efficiency range. The MSE, RMSE, R
2, and MAE values are 0.0039
0.00025, 0.0624
0.00199, 0.8068
0.00123, and 0.0420
0.00243, respectively, demonstrating that the proposed soft sensing method achieves low prediction errors with a uniform distribution across the majority of samples.
As shown in
Figure 7c and
Table 6, the average training loss drops sharply during the first 40 epochs, reaching about 0.01. By epoch 200, the average training and validation losses stabilize around 0.0045 and 0.0050, respectively. The average validation loss closely tracks the average training curve without any notable divergence, indicating strong generalization and absence of overfitting or underfitting. In the scatter plot, predicted versus actual efficiencies cluster tightly around the diagonal across the full range. Quantitatively, the CEGS achieves an MSE of 0.0040
0.00021, an RMSE of 0.0557
0.00031, an R
2 of 0.8620
0.00086, and an MAE of 0.0358
0.00019, demonstrating robust linear fitting performance across different efficiency levels.
As shown in
Figure 7d and
Table 6, most predicted values fall close to the red dashed line over the 0–80% efficiency range. Quantitatively, the model achieves an MSE of 0.0031
0.00011, an RMSE of 0.0557
0.00031, an R
2 of 0.8620
0.00086, and an MAE of 0.0358
0.00019, demonstrating a strong linear correlation across all efficiency levels.
4.7. Computational Complexity Analysis
To evaluate the real-time performance of each model, we measured the inference time of the proposed models and the traditional partial differential equation (PDE) solver over five independent runs. The mean and standard deviation were then calculated to ensure statistical reliability. The results are summarized in
Table 7.
As evidenced by the parallel inference times reported in
Table 7, the proposed SHSE model substantially reduces computational demands compared to the partial differential equation (PDE)-based approach, demonstrating superior computational efficiency. However, under serial inference settings, SHSE exhibits longer inference times than the three baseline models (CEBS, BBTS, and CEGS), which is attributable to its ensemble architecture that integrates multiple base learners. This design deliberately trades off some computational efficiency for enhanced predictive accuracy. Despite this trade-off, SHSE still maintains considerably higher operational efficiency than traditional PDE-based numerical methods. Furthermore,
Table 7 indicates that the serial inference time of SHSE is lower than its parallel execution time, making parallel configuration the preferred option in industrial deployment scenarios to further improve efficiency.
Analysis of model complexity reveals that the parameter counts of the CEBS, BBTS, and CEGS baseline models are 65 K, 91 K, and 86 K, respectively, whereas the SHSE model comprises 523 K parameters. Although SHSE has a significantly larger parameter footprint than each individual baseline model, it achieves corresponding improvements in predictive accuracy, reflecting an effective balance between model capacity and performance.

