Abstract
To investigate the flow characteristics of movable water in coal under the influence of micro-nano pore fractures with multiple fractal structures, this study employed nuclear magnetic resonance (NMR) and multifractal theory to analyze gas–water seepage under different injection pressures. Then, the scale threshold for mobile water entering coal pores and fractures was determined by clarifying the relationship among “injection pressure-T2 dynamic multiple fractal parameter seepage resistance-critical pore scale”. The results indicate that coal samples from Yiwu (YW) and Wuxiang (WX) enter the nanoscale pore size range at an injection pressure of 8 MPa, while the coal sample from Malan (ML) enters the nanoscale pore size range at an injection pressure of 9 MPa. During the water injection process, there is a significant linear relationship between the multiple fractal parameters log X(q, ε) and log(ε) of the sample. The generalized fractal dimension D(q) decreases monotonically with increasing q in an inverse S-shape. This decrease occurs in two distinct stages: D(q) decreases rapidly in the low probability interval q < 0; D(q) decreases slowly in the high probability interval q > 0. The multiple fractal singularity spectrum function f(α) has an asymmetric upward parabolic convex function relationship with α, which is divided into a rapidly increasing left branch curve and a slowly decreasing right branch curve with α0 as the boundary. Supporting evidence indicates the feasibility of a methodology for identifying the variation in multiple fractal parameters of gas–water NMR seepage and the critical scale transition conditions. This investigation establishes a methodological foundation for analyzing gas–water transport pathways within porous media materials.
1. Introduction
The rational use of water injection technology can not only reduce gas emissions in coal mining to effectively prevent gas outbursts, but also decrease reservoir pressure to promote gas desorption through drainage and gas extraction in the process of coalbed methane (CBM) exploitation and utilization [1,2]. Water molecules in coal seams can affect methane migration through adsorption, desorption, displacement, diffusion, and seepage [3,4,5,6]. From a macro perspective, this manifests as changes in gas and water production, with micro-scale changes appearing as alterations in the flow state of gas and water within pore fractures [7,8]. Analyzing changes in the distribution and flow paths of gas and water in the pores and fractures of coal at the micron-scale can support the selection of appropriate mining techniques and facilitate the efficient utilization and development of CBM [9,10].
Due to the presence of both cleats and pores in the coal matrix, water first infiltrates into the cleats and fractures during the coalbed water injection process. Then, the water enters the macropores, micropores, and nanopores under the influence of diffusion [11,12,13]. Water molecules adhere to the surface of the pores via adsorption, thereby displacing some of the gas from the pore surface [14,15,16]. Typically, scholars study the gas migration mechanism in water-bearing coal seams in terms of pore characteristics such as pore size, shape, connectivity, and fractal dimension [17,18,19]. Due to the complex pore structure and good self-similarity of coal rock, it is difficult to accurately characterize coal rock using traditional experimental methods and Euclidean geometry [20,21]. However, fractal theory can be used to quantitatively evaluate the complexity of coal rock [22,23]. In recent years, various methods have been employed to study the fractal characteristics of rock pore distribution [24,25,26], including scanning electron microscopy, small-angle neutron scattering, box counting, mercury intrusion porosimetry, industrial CT scanning combined with the Menger fractal model, and the FHH fractal model [27,28,29,30]. Building upon single-scale fractal theory, researchers have developed fractal Langmuir adsorption models, fractal diffusion models, and fractal seepage models to elucidate how pore structure governs the adsorption and transport behavior of coalbed methane (CBM). Moreover, multifractal theory has been widely applied to characterize the complexity and heterogeneity of nanoporous materials such as coal [22,25,27,31], revealing multifractal features in CBM adsorption and transport processes [32].
Nuclear magnetic resonance (NMR) has emerged as a rapid, non-destructive technique for characterizing the physical properties of coal rocks and fluid flow behaviors in unconventional reservoirs [33]. Through gas–water two-phase NMR experiments, researchers have analyzed the state and distribution of water within rock pores [22,25,33], demonstrating that the drainage efficiency during two-phase CBM extraction significantly affects recovery rates. Other studies have utilized relaxation times to interpret fluid distribution in pores [10,20,34], enabling fluid identification and pore structure characterization [35]. Additional approaches combine NMR with capillary pressure tests to determine relative permeability [34,35,36], while NMR imaging and T2 spectrum analysis have been applied to classify coal pores and assess pore size uniformity during displacement [37,38].
In summary, although substantial research has been conducted on two-phase micro-seepage, few studies have examined the real-time flow state and fluid distribution under varying water injection conditions in coal rocks. To address this gap, this study investigates the seepage characteristics of movable water in micro-nano fractures of coal under different injection pressures by integrating multifractal theory with NMR experiments. This approach allows us to establish the relationship among injection pressure, T2 dynamic multi-fractal parameter seepage resistance, and critical pore scale, and identify the corresponding threshold scale for water entry. This investigation can provide new insights into clarifying gas–water transport processes in porous media materials and improving CBM recovery rates.
2. Research Methodology
2.1. NMR Experiment
The coal samples used in this study were obtained from the Yuwu (YW), Wuxiang (WX), and Malan (ML) mines in Shanxi Province. Raw coal blocks were drilled, ground, and processed into cylindrical specimens measuring φ25 mm × 50 mm for subsequent analysis.
The test was conducted using a Meso MR23-060H-I low-field nuclear magnetic resonance instrument (From Nuomei Analytical Instrument Testing Co., Ltd., Suzhou, China), with a resonance frequency of 21.67568 MHz, a magnet temperature controlled at 32 ± 0.1 °C, and a magnetic field strength of 0.5 T (Figure 1). The NMR experimental procedure was to first put the samples into the sample compartment for 5 MPa nitrogen adsorption for 12 h, and then to perform the pressure preservation water injection under 5–9 MPa pressure, respectively, followed by the T2 spectrum test under nitrogen adsorption and different water injection pressures.
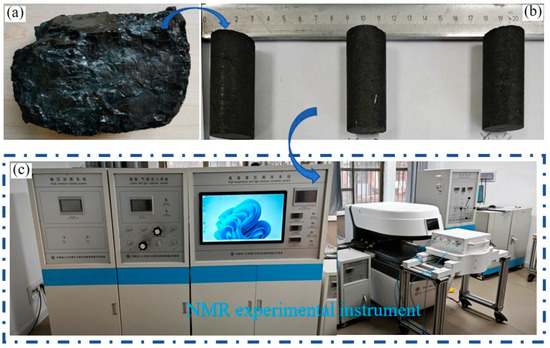
Figure 1.
NMR experiment flowchart. (a) Coal blocks collected from underground coal mines; (b) Drilled coal pillars; (c) NMR experimental instruments.
2.2. Calculation of Fractal Parameters
Surface relaxation rates were calculated for the pore and fracture distribution in coal based on the T2 spectrum data from the NMR experiments [39]. The formula was as follows:
where ρ is the surface relaxation rate, S is the pore-specific surface area, and V is the pore volume.
The cutoff value T2cutoff was calculated by the geometric mean method, and the movable and bound water in the coal pore space was divided by T2cutoff, where T2cutoff was calculated as follows:
where T2max is 10,000 ms; Ai is the signal amplitude at T2i transverse relaxation time; AT is the maximum amplitude of the NMR spectrum; T2s is the initial transverse relaxation time of the spectrum of 0.01 ms. The range of movable water aperture: T2 > T2cutoff.
Multifractal theory can be used to analyze the fractal characteristics of objects at different scales, with further accurate characterization of the complexity and non-uniformity of pore distribution. Typically, the box counting method is used to characterize multiple fractals in porous media, where the NMR signal is divided into N(ε) boxes. The mass probability of the ith box is defined as [40]:
where Ni(ε) is the NMR signal amplitude of the ith cassette; the relationship between Pi(ε) and cassette size ε follows a power exponential relationship.
where αi is the Lipschitz-Holder index indicating the singularity strength of the ith box. Boxes at different locations may have similar singularity indices αi. Assuming that the number of boxes with singular intensities ranging from α to α + dα is Nα(ε), Nα(ε) increases as the partition scale ε decreases [39]:
where f(α) is the fractal dimension of subsets with the same singularity index α. The distribution function is defined as [41]:
where q is the statistical moment order (−10 ≤ q ≤ 10); τ(q) is the mass index, and τ(q) is monotonically increasing with q.
α and f(α) can be obtained by the Legendre transformation [42], which is expressed as:
The multifractal set can also be computed by generalizing the fractal dimension Dq [40]:
The asymmetry of the multifractal singularity spectrum can be described by the parameter A, which represents the fluctuations of the pore size distribution. The larger the value of A, the stronger the volatility of the pore size distribution. When A > 1, the high probability density region has a significant effect on the pore size distribution, i.e., the pore size fluctuates more. When A < 1, the low probability density region has a significant effect on the pore size distribution, i.e., the pore size fluctuates less. The value A is calculated as follows:
3. Results and Discussion
3.1. Threshold for Water Entering Coal Borehole at Different Injection Pressures
The results of T2 spectra for 5 MPa nitrogen adsorption and 5~9 MPa holding pressure water injection were obtained by NMR seepage experiments, followed by the surface relaxation rate of T2 spectra as well as the cutoff point calculated by combining Equations (5) and (6). As shown in Table 1, the T2 cutoffs range from 0.65 to 1.28 ms, indicating that there are large differences in the lithology of the coal samples. The cutoff pore sizes ranged from 24.31 to 70.4 nm, suggesting that there were differences in the adsorption of gases in the coal samples. The T2 time distribution was converted to an equivalent aperture distribution using the surface relaxation rate in Table 1, with the aperture-converted NMR curves shown in Figure 2.

Table 1.
T2 time conversion to equivalent pore size distribution parameters.
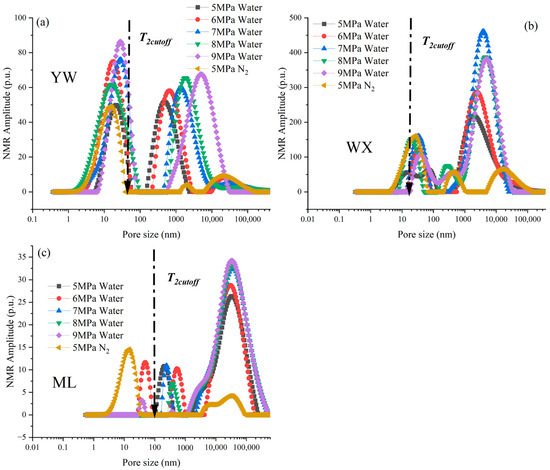
Figure 2.
NMR amplitude of equivalent pore size distribution. (a) Represents sample YW; (b) indicates sample WX; (c) denotes sample ML.
As shown in Figure 1, the NMR amplitudes of coal samples YW and BD gradually increased with the increase in water injection pressure during the water injection process (5 to 9 MPa). This indicates that more pores (including small pores) are filled with water as the pressure increases. The T2 cutoff shifted left during water injection, showing that smaller pores were filled. In the process of water injection in coal samples ML, the NMR amplitude increased significantly in the nanoscale pore size at high pressure of 9 MPa, suggesting that high pressure drove water into the nanopore space [10,21].
It can be seen that the NMR amplitude rises with the increase in water injection pressure, which significantly increases the fluid filling of small pores. High-pressure water injection mainly affects the nanoscale pores, and the difference in amplitude response of YW, WX, and ML is attributed to different pore size distributions.
3.2. Analysis of Multiple Fractal Results by NMR
The generalized fractal parameter spectra and singular fractal spectra derived from multiple fractal calculations based on the multiple fractal theory for the equivalent pore size distribution NMR spectra of movable water from NMR seepage experiments are shown in Figure 3 and Figure 4, respectively. Figure 2 shows the double logarithmic curves of X(q, ε) and ε, i.e., there is a significant linear relationship between log X(q, ε) and log(ε), with a correlation coefficient of R2 > 0.979, for coal samples during nitrogen adsorption and pressure-holding water injection from 5 to 9 MPa. This indicates that coal samples show clear multiple fractal features during both nitrogen adsorption at 5 MPa and water injection at holding pressures from 5 to 9 MPa. Log X (q, ε) is negatively correlated with log(ε) in the low-probability interval of q < 0, while it is positively correlated in the high-probability interval of q > 0. The large span of log X (q, ε) values for q < 0 demonstrates that the range corresponds to a wide distribution of apertures, whereas the small span of log X (q, ε) values for q > 0 suggests that q > 0 corresponds to a more concentrated distribution of apertures [11,23,31].
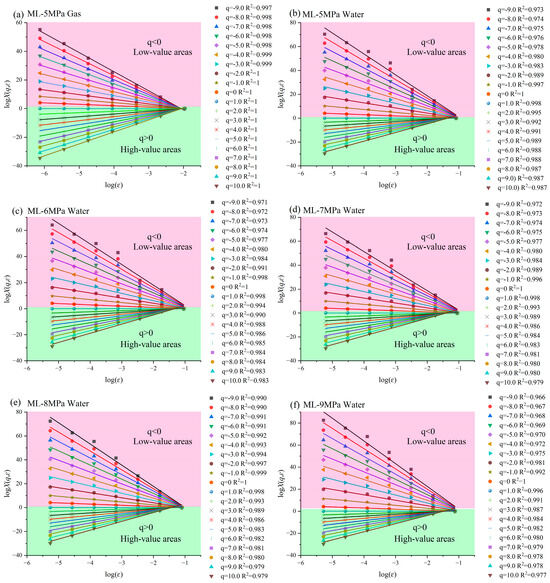
Figure 3.
Double logarithmic curves of X(q, ɛ) and ɛ for the coal sample ML. (a) ML-5MPa Gas; (b) ML-5MPa Water; (c) ML-6MPa Water; (d) ML-7MPa Water; (e) ML-8MPa Water; (f) ML-9MPa Water.
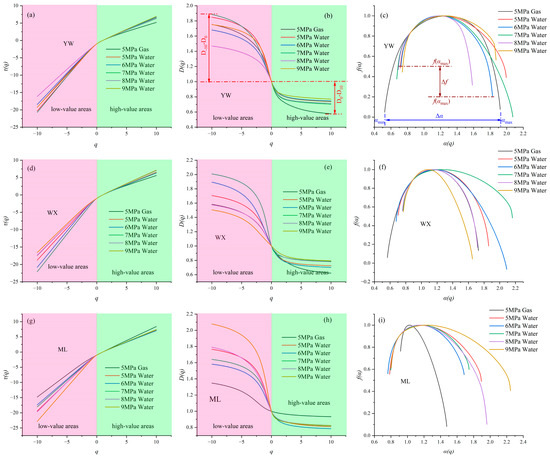
Figure 4.
Multifractal generalized and singularity spectra. (a,d,g) Relationship between the order parameter q and the mass exponent τ(q) for coal samples; (b,e,h) Generalized fractal dimension D(q) as a function of q; (c,f,i) Multifractal singularity spectrum f(α) versus the singularity strength α.
Multiple fractal parameters of movable water nuclear magnetic seepage in coal samples YW, WX, and ML were calculated with the multiple fractal theory (Table 2). From Figure 3 and Table 2, the mass indices q-τ(q) of coal samples YW, WX, and ML monotonically increase with a nonlinear relationship, indicating that the T2 spectra of coal samples during both nitrogen adsorption and pressure-retaining water injection from 5 to 9 MPa are characterized by multiple fractals. As q increases, τ(q) tends to be convex upwards. The main parameters of the generalized fractal spectrum (q-D(q)) include D−10, D10, ΔD, D0, D1, D2, and H, where D−10 is affected by the low probability measurement region and D10 by the high probability measurement region. ΔD is the difference between D−10 and D10, with a larger ΔD indicating greater heterogeneity of the pores. The larger the value of D0, the wider the range of pore size distribution and the more non-uniform the distribution. The smaller the value of D1, the more concentrated the pore size distribution, and the larger the value of D2, the more uniform the pore size distribution. The larger the value of H, the stronger the pore connectivity.
Table 2.
Table of NMR seepage multiple fractal parameters.
The generalized fractal dimension D(q) exhibits a decreasing inverse S-shape with increasing q, i.e., the value of D(q) decreases rapidly at low probability intervals of q < 0, while the value of D(q) decreases slowly at high probability intervals of q > 0. YW and WX in the q > 0 region, the curves keep shifting upward with time, indicating that the pore space changes significantly in the high probability region. The greater the curvature of the multifractal spectrum, the stronger the heterogeneity of the pore distribution [18,20,29].
The curvature of the coal samples increases sequentially with increasing water-driven pressure, suggesting that the increase in localized pore size distribution non-uniformity leads to an increase in pressure [2,17]. ML in the region of q > 0, the curve keeps moving downward with increasing pressure, showing that the heterogeneity of the pore distribution is weaker in the high probability region [10,21]. The curvature of the coal samples decreases sequentially as the water-driven pressure increases, demonstrating that the increase in the non-uniformity of the local pore size distribution leads to a decrease in the pressure [12], reflecting the transport process of water in the coal [30]. In the low probability interval of q < 0, the curve of ML with increasing pressure shifts upward continuously, implying that the heterogeneity of the pore distribution in the low probability region of ML is enhanced with increasing pressure [17,25,30].
The multifractal singularity spectral function f(α) is related to α as a convex function of an asymmetric upward parabolic curve, that is, a curve with a sharply increasing left branch bounded by α0 and a slowly decreasing right branch. The main parameters of α-f (α) include αmin, α0, αmax, Δα, Δf, and A. αmin is related to the distribution of small pores, while αmax is related to the distribution of large pores. The larger α0, the stronger the local fluctuation, and the narrower the distribution interval. Δα is the difference between αmax and αmin, and the larger the value is, the greater the inhomogeneity of pore size distribution. Δf is the difference between f(αmin) and f(αmax), reflecting the relative proportions of small-volume and large-volume pores. Δf > 0 means that the small pores dominate the seepage resistance with a large tortuous path. Conversely, Δf < 0 means that large pores dominate with uniform seepage paths [43,44,45,46,47]. In addition, the asymmetry of the multifractal singularity spectrum can be characterized by the parameter A, that is, the larger the value of A, the stronger the fluctuation of the aperture distribution [16,23]. A > 1 indicates that the high probability density region has a significant influence on the aperture distribution, with larger fluctuations in the aperture. A < 1 implies that the low probability density region has a significant influence on the aperture distribution, resulting in smaller fluctuations in the aperture [9,35].
3.3. Characterization of Multiple Fractal Features of Seepage
According to the data in Table 2, the relationship between the multiple fractal parameters was obtained as shown in Figure 5. The multiple fractal parameter D−10 of YW shows a significant positive relation to ΔD, αmax, and Δα, with correlation R2 above 0.764, indicating that the heterogeneity of the pore size distribution affected by the low-probability measurement region is positively correlated with the macropores [1,20]. The parameter D10 exhibits a significant positive correlation with D1, D2, αmin, and H, showing that the influence of the high probability measurement region is positively correlated with the pore size distribution, the degree of homogeneity, and the pore connectivity [10,25,27].
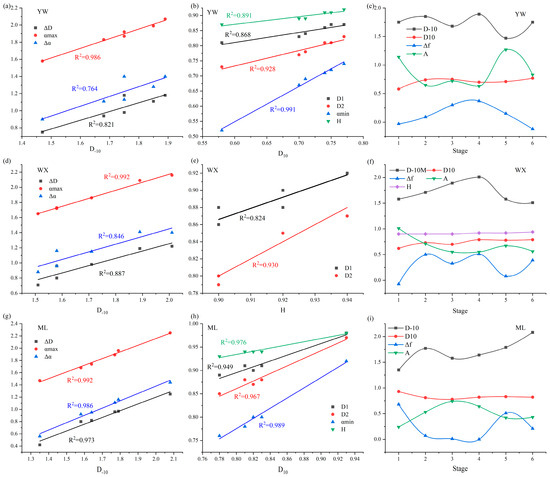
Figure 5.
The relationship between multiple fractal parameters. (a), (d), (g) show the relationships between the multifractal parameters ΔD, αmax, and Δα versus D-10 for coal samples YW, WX, and ML, respectively; (b), (e), (h) show the relationships between the multifractal parameters D1, D2, αmin, and H versus D10 for coal samples YW, WX, and ML, respectively; (c), (f), (i) show the variation curves of multifractal parameters D-10, D10, Δf, A, and H for coal samples YW, WX, and ML, respectively.
During the boost injection stage, the Δf of YW gradually increases from 0.09 at 5 MPa to 0.37 at 7 MPa, demonstrating that water is difficult to enter the adsorption pores with high seepage resistance at this stage [7]. Δf = 0.15 at 8 MPa, showing that the water starts to enter the nanoscale adsorption pores at 8 MPa, with significantly lower percolation resistance [33]. Δf = −0.12 at 9 MPa, meaning that the water enters the nanoscale adsorption pores smoothly with smooth channels and uniform percolation paths [28]. The parameter A = 1.27 > 1 at 8 MPa pressure with large pore size fluctuations indicates that the critical pressure for water to enter the nanoscale adsorption pores is 8 MPa.
The fractal parameter D−10 of WX shows a significant positive correlation with ΔD, αmax, and Δα, demonstrating that the influence of the low-probability measurement region has a significant positive correlation with the distribution of micropores [7,8]. H, D1, and D2 showed obvious positive correlations, with correlation R2 above 0.824, indicating that there is an obvious positive correlation between pore connectivity and the degree of dispersed uniformity of pore size distribution. During the boosting water injection and gas displacement stage, the Δf of WX is mostly above 0.3, reflecting that the pore and fracture channels of WX are more tortuous and rough. The gradual decrease in Δf from 0.5 at 5 MPa to 0.33 at 6 MPa indicates that the resistance to seepage decreases as the pressure rises. Water seepage from the millimeter-scale fracture into the micron-scale pore fracture at 5 MPa until Δf rises to 0.51 at 7 MPa, suggesting that water in the pore fracture is difficult to enter the nanoscale adsorption pores due to the increase in seepage resistance [5,8,24]. The Δf = 0.08 at 8 MPa indicates that water enters the nanoscale pores with less resistance to filling and larger pore volumes. Subsequently, Δf = 0.39 at 9 MPa shows that water has filled the nanoscale adsorption pores that continue to flow through the micrometer-sized pores as well as the millimeter-sized fractures [19,25,36]. The parameters A at 5 MPa and 8 MPa are 0.71 and 0.67, respectively, much higher than the values of A at other water-driven pressure points, demonstrating that the critical pressure for water to enter the micrometer-sized pores is 5 MPa, whereas the critical pressure for water to enter the nanosized adsorption pores is 8 MPa.
ML’s D−10 shows a significant positive correlation with ΔD, αmax, and Δα, revealing that the unevenness of the pore size distribution is positively correlated with the distribution of macropores affected by low-probability measurement areas [20,37]. Parameter D10 indicates a significant positive correlation with D1, D2, αmin, and H, demonstrating that the influence of high-probability measurement regions is positively correlated with pore size distribution, uniformity, micropore distribution, and pore connectivity [9,16]. During the pressure-boosting water injection gas displacement phase, ML’s Δf gradually decreased from 0.07 at 5 MPa to 0 at 7 MPa, showing that the flow resistance gradually decreased as the pressure increased. The Δf values for 8 MPa and 9 MPa are 0.51 and 0.21, respectively, indicating that the excessive pressure at 8 MPa causes some pores to be compressed, resulting in a more complex flow path and increased flow resistance [17,25].
3.4. Analysis and Verification of Gas–Water Seepage Characteristics
The T2 spectrum area was calibrated by injecting water of different masses into the nuclear magnetic resonance chamber, as shown in Figure 6. According to the results of the nuclear magnetic resonance calibration group experiment, the relationship between different water masses and T2 peak areas can be obtained as shown in Figure 6a. The T2 peak area (y) of coal samples in the study area is linearly related to the water mass (x) as y = 0.0114x − 0.3668 (Figure 6b), with a correlation coefficient R2 = 0.981. Based on the fitting curves obtained from the calibration results of different water quality standards, the movable water content in coal pores under different gas–water conditions for YW, WX, and ML can be calculated separately. As shown in Table 3 and Figure 7, the water intake of coal sample YW at 9 MPa was 0.934 g, while that of WX was 4.556 g, and that of coal sample ML was 0.111 g. This result indicates that the well-developed micron-scale fractures in coal sample WX facilitate water intrusion, leading to the highest water intake [15,26,33]. In contrast, the abundance of nanoscale pores in sample ML hinders water penetration, resulting in the lowest intake. Furthermore, the water content within the pores and fractures of all coal samples increases with injection pressure. However, due to variations in pore-fracture structures, the water injection volumes under the same pressure differ significantly among the samples [17,24].
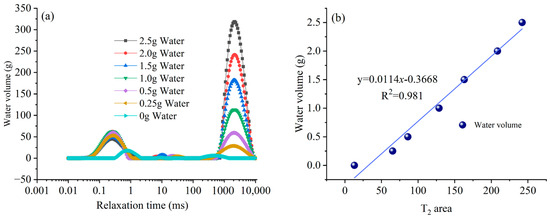
Figure 6.
Calibration results for different water qualities. (a) shows the relationship between relaxation time and water volume; (b) indicates the relationship between T2 area and water volume.
Table 3.
Movable water content in coal pores.
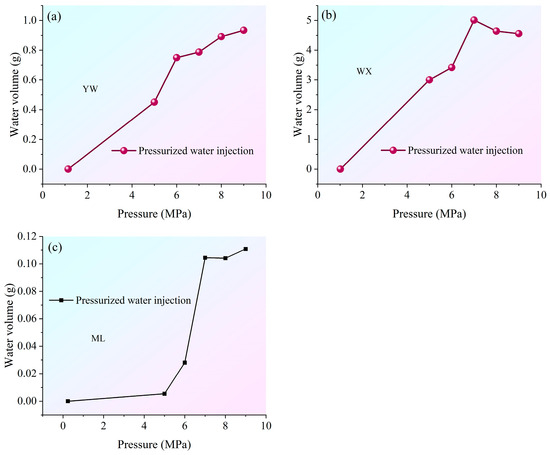
Figure 7.
Curve showing changes in movable water content. (a) Represents sample YW; (b) indicates sample WX; (c) denotes sample ML.
Combining Figure 3 and Figure 8, water enters the micron-scale drainage network at 5 MPa, with a slow increase in water volume between 6 MPa and 7 MPa, and injection into the nanoscale reservoir units only occurs at 8 MPa. This indicates that the nanoscale reservoir units in YW are relatively complex, with high injection resistance, making injection difficult at lower pressures, consistent with the analysis in the preceding text. The micron-scale flow channels of WX and ML are relatively tortuous, with high seepage resistance, causing the flow to be difficult for water to enter micron-scale pore fractures at low pressures. Both WX and ML exhibit a sharp increase in injection volume once pressure reaches 6 MPa, consistent with the multi-fractal parameter analysis of gas–water seepage characteristics discussed earlier. From the injection volume of ML, water has difficulty entering micron-scale pores and can only occupy a small portion of the fractures.
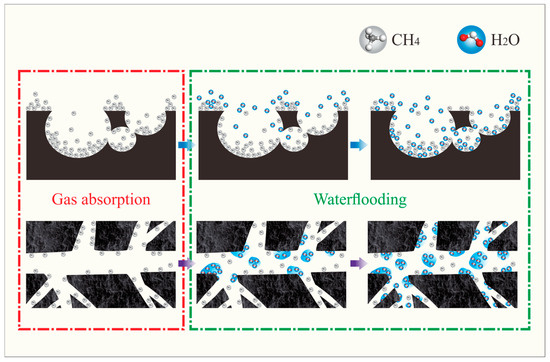
Figure 8.
Seepage characteristics of water injection into gas-bearing coal pores.
In summary, the gas–water transport characteristics obtained through variable water flow rates are basically consistent with the gas–water dynamic seepage characteristics analyzed via T2 dynamic multifractal seepage resistance parameters. This indicates that quantifying the gas–water dynamic seepage characteristics under different pressures through the relationship between “injection pressure-T2 dynamic multifractal parameter seepage resistance- critical pore scale” is accurate.
4. Conclusions
This paper analyzes the relationship between “micron-scale conductivity-nanoscale adsorption capacity-T2 dynamic multifractal parameter flow resistance” through nuclear magnetic resonance flow experiments and multifractal principles, followed by quantifying the gas–water dynamic seepage characteristics under different pressures. Subsequently, the scale threshold for movable water to enter coal pore fractures is determined. The main conclusions are as follows:
There is a significant linear relationship between log X(q, ε) and log(ε), with a negative correlation in the low probability interval of q < 0 and a positive correlation in the high probability interval of q > 0. Since the log X(q, ε) values for q < 0 exhibit a large range, this means that the pore size distribution for q < 0 is broad, while the log X(q, ε) values for q > 0 reveal a small range, indicating that the pore size distribution for q > 0 is more concentrated.
The quality index q-τ(q) increases monotonically in a nonlinear relationship, and τ(q) increases strictly, also showing an upward convex trend as q increases. The generalized fractal dimension D(q) decreases monotonically as q increases, forming an inverse S-shape. This can be divided into two stages: D(q) decreases rapidly in the low-probability interval of q < 0; D(q) decreases slowly in the high-probability interval of q > 0.
The multifractal singularity spectrum function f(α) exhibits an asymmetric convex function relationship with α, divided into a rapidly increasing left branch curve and a slowly decreasing right branch curve with α0 as the boundary. The T2 dynamic fractal parameters can be obtained by combining low-field NMR seepage experiments with multifractal theory, followed by determining the critical pressure values for water entering micron-scale fractures and nano-scale pores in coal samples from the study area through seepage resistance parameters.
Author Contributions
Q.J.: Investigation, Writing—original draft, Methodology, Project administration, Funding acquisition. X.N.: Conceptualization, Supervision, Funding acquisition, Project administration. J.Z.: Writing—original draft, Investigation, Data curation, Methodology. B.L.: Conceptualization, Methodology. L.L.: Supervision, Funding acquisition. J.W.: Investigation, Software. All authors have read and agreed to the published version of the manuscript.
Funding
This work was financially supported by the China Postdoctoral Science Foundation (Grant nos. BX20240287; 2024MD764013), the National Natural Science Foundation of China (Grant nos. 42372198; 42402186), the Key Research and Development Program of Shaanxi (Grant no. 2023-LL-QY-07), the Shaanxi Province Natural Science Basic Research Program (Grant no. 2024JC-YBQN-0305), the Shaanxi Province Youth Talent Support Program Project (Grant no. 20250706).
Data Availability Statement
The original contributions presented in this study are included in the article. Further inquiries can be directed to the corresponding author.
Conflicts of Interest
The authors declare no conflicts of interest.
References
- Xu, C.; Fu, Q.; Wang, K.; Guo, C.; Li, X. Effects of the deviatoric stress ratio on the coal failure and permeability during deep mining. Geotech. Geol. Eng. 2020, 38, 6093–6105. [Google Scholar] [CrossRef]
- Fan, Y.; Liu, J.; Ge, X.; Deng, S.; Liu, H.; Gu, D. Permeability evaluation of tight sandstone based on dual T2 cutoff values measured by NMR. Chin. J. Geophys.-Ch. 2018, 61, 1628–1638. [Google Scholar]
- Lin, J.; Ren, T.; Cheng, Y.; Nemcik, J.; Wang, G. Cyclic N2 injection for enhanced coal seam gas recovery: A laboratory study. Energy 2019, 188, 116115. [Google Scholar] [CrossRef]
- Zhang, J.; Wei, C.; Chu, X.; Vandeginste, V.; Ju, W. Multifractal analysis in characterizing adsorption pore heterogeneity of middle-and high-rank coal reservoirs. ACS Omega 2020, 5, 19385–19401. [Google Scholar] [CrossRef]
- Lin, B.; Nie, W.; Zhu, C.; Wang, Z.; Li, H. Microwave irradiation on pore morphology of coal powder. Fuel 2018, 227, 434–447. [Google Scholar] [CrossRef]
- Jia, Q.F.; Liu, D.M.; Cai, Y.D.; Lu, Y.J.; Li, R.; Wu, H.; Zhou, Y.F. Nano-CT measurement of pore-fracture evolution and diffusion transport induced by fracturing in medium-high rank coal. J. Nat. Gas Sci. Eng. 2022, 106, 104769. [Google Scholar] [CrossRef]
- Ge, X.; Fan, Y.; Li, J.; Zahid, M. Pore structure characterization and classification using multifractal theory—An application in Santanghu basin of western China. J. Petrol. Sci. Eng. 2015, 127, 297–304. [Google Scholar] [CrossRef]
- Zhang, J.; Ni, X.; Liu, X.; Su, E. Influences of Different Acid Solutions on Pore Structures and Fractal Features of Coal. Fractal Fract. 2024, 8, 82. [Google Scholar] [CrossRef]
- Ni, X.; Zhang, J.; Han, L.; Liu, X. Methane Desorption—Diffusion Behaviors in Micropores of Coal under Different Water Displacement Pressures. Langmuir 2024, 40, 23081–23093. [Google Scholar] [CrossRef]
- Li, W.; Liu, H.; Song, X. Multifractal analysis of Hg pore size distributions of tectonically deformed coals. Int. J. Coal Geol. 2015, 144, 138–152. [Google Scholar] [CrossRef]
- Liu, D.; Zhao, Z.; Cai, Y.; Sun, F. Characterizing coal gas reservoirs: A multiparametric evaluation based on geological and geophysical methods. Gondwana Res. 2024, 133, 91–107. [Google Scholar] [CrossRef]
- Li, H.; Li, X.; Fu, J.; Zhu, N.; Chen, D.; Wang, Y.; Ding, S. Experimental study on compressive behavior and failure characteristics of imitation steel fiber concrete under uniaxial load. Constr. Build. Mater. 2023, 399, 132599. [Google Scholar] [CrossRef]
- Liu, S.; Sun, H.; Zhang, D.; Yang, K.; Li, X.; Wang, D.; Li, Y. Experimental study of effect of liquid nitrogen cold soaking on coal pore structure and fractal characteristics. Energy 2023, 275, 127470. [Google Scholar] [CrossRef]
- Wang, Y.; Cheng, H.F.; Hu, Q.H.; Liu, L.F.; Jia, L.B.; Gao, S.S.; Wang, Y. Pore structure heterogeneity of Wufeng-Longmaxi shale, Sichuan Basin, China: Evidence from gas physisorption and multifractal geometries. J. Petrol. Sci. Eng. 2022, 208, 109313. [Google Scholar] [CrossRef]
- Zhao, Z.; Liu, D.; Cai, Y.; Sun, F.; Zhou, Y. Pathways and challenges of the application of geophysical techniques to multifaceted coalbed methane reservoir characterization. Gondwana Res. 2025, 147, 164–183. [Google Scholar] [CrossRef]
- Zhao, Z.; Liu, D.; Cai, Y.; Qiu, F.; Sun, F. Gas-Bearing Characteristics of Coal Measure Strata and Logging Evaluation of Fluid Pressure Systems. Phys. Fluids 2025, 37, 046618. [Google Scholar] [CrossRef]
- Jia, Q.; Liu, D.; Cai, Y.; Yao, Y.; Lu, Y.; Zhou, Y. Variation of adsorption effects in coals with different particle sizes induced by differences in microscopic adhesion. Chem. Eng. J. 2023, 452, 139511. [Google Scholar] [CrossRef]
- Si, N.; Liu, G.; Lin, J.; Chang, P.; Wang, X.; Zhang, Z.; Liu, H. Effects of CS2 Solvent Extraction on Nanopores in Coal. Energy Fuels 2023, 37, 13799–13809. [Google Scholar] [CrossRef]
- Han, W.; Zhou, G.; Gao, D.; Zhang, Z.; Wei, Z.; Wang, H.; Yang, H. Experimental analysis of the pore structure and fractal characteristics of different metamorphic coal based on mercury intrusion-nitrogen adsorption porosimetry. Powder Technol. 2020, 362, 386–398. [Google Scholar] [CrossRef]
- Xie, Y.; Hou, M.Z.; Li, C. Anisotropic characteristics of acoustic emission and the corresponding multifractal spectrum during progressive failure of shale under cyclic loading. Int. J. Rock Mech. Min. Sci. 2023, 165, 105364. [Google Scholar] [CrossRef]
- Jia, Q.; Liu, D.; Cai, Y.; Zhou, Y.; Zhao, Z.; Yang, Y. AFM characterization of physical properties in coal adsorbed with different cations induced by electric pulse fracturing. Fuel 2022, 327, 125247. [Google Scholar] [CrossRef]
- Shi, Q.; Shi, Y.; Wang, S.; Kou, B.; Zhao, H.; Ji, R.; Yang, X.; Liu, P.; Li, Z. Experimental study on the tar and gas distribution during tar-rich coal pyrolysis with stress loading. Fuel 2024, 376, 132727. [Google Scholar] [CrossRef]
- Liu, H.; Liu, G.; Zhang, Z.; Li, B.; Si, N.; Guan, W.; Lin, J. Effects of Liquid CO2 Phase Transition Fracturing on Mesopores and Micropores in Coal. Energy Fuels 2022, 36, 10016–10025. [Google Scholar] [CrossRef]
- Li, L.; Liu, D.; Cai, Y.; Wang, Y.; Jia, Q. Coal structure and its implications for coalbed methane exploitation: A review. Energy Fuels 2021, 35, 86–110. [Google Scholar] [CrossRef]
- Liu, Z.; Lv, J.; Yang, H.; Tian, F.; Han, J.; Zhang, M. Mechanism of methane adsorption and diffusion and its influencing factors based on the fractal structure of coal-based porous media. Energy Fuels 2022, 36, 6843–6859. [Google Scholar] [CrossRef]
- Wang, L.; Wu, S.; Han, S.; Hu, B.; Wang, Q.; Zhang, K.; Song, T. Fractal analysis of coal pore structure based on low-pressure gas adsorption and its influence on methane adsorption capacity: A perspective from micropore filling model. Energy Fuels 2024, 38, 4031–4046. [Google Scholar] [CrossRef]
- Zhang, Z.; Liu, G.; Liu, H.; Wang, X.; Lin, J.; Barakos, G.; Chang, P. Fractal dynamics model of gas adsorption in porous media. Phys. Fluids 2025, 37, 016623. [Google Scholar] [CrossRef]
- Porada, S. The influence of elevated pressure on the kinetics of evolution of selected gaseous products during coal pyrolysis. Fuel 2004, 83, 1071–1078. [Google Scholar] [CrossRef]
- Zhang, X.; Lin, B.; Li, Y.; Zhu, C.; Kong, J.; Li, Y. Enhancement effect of NaCl solution on pore structure of coal with high-voltage electrical pulse treatment. Fuel 2019, 235, 744–752. [Google Scholar] [CrossRef]
- Tong, Z.; Zhang, J.; Li, Z.; Wu, Y.; Wang, D.; Gong, D. Investigation of organic-shale nanopores in the Lower Cambrian Niutitang Formation using low temperature N2 and CO2 adsorption: Multifractality and classification. Micropor. Mesopor. Mater. 2022, 337, 111935. [Google Scholar] [CrossRef]
- Akimbekov, N.; Digel, I.; Tastambek, K.; Kozhahmetova, M.; Sherelkhan, D.; Tauanov, Z. Hydrogenotrophic methanogenesis in coal-bearing environments: Methane production, carbon sequestration, and hydrogen availability. Int. J. Hydrog. Energ. 2024, 52, 1264–1277. [Google Scholar] [CrossRef]
- Akimbekov, N.; Digel, I.; Tastambek, K.; Marat, A.; Turaliyeva, M.; Kaiyrmanova, G. Biotechnology of Microorganisms from Coal Environments: From Environmental Remediation to Energy Production. Biology 2022, 11, 1306. [Google Scholar] [CrossRef]
- Wang, J.; Wang, X.; Ding, S.; Ashour, A.; Yu, F.; Lv, X.; Han, B. Micro-nano scale pore structure and fractal dimension of ultra-high performance cementitious composites modified with nanofillers. Cement. Concrete. Comp. 2023, 141, 105129. [Google Scholar] [CrossRef]
- Sun, M.; Zou, C.; Xin, D. Pore structure evolution mechanism of cement mortar containing diatomite subjected to freeze-thaw cycles by multifractal analysis. Cement. Concrete. Comp. 2020, 114, 103731. [Google Scholar] [CrossRef]
- Zhang, X.; Lin, B.; Zhu, C.; Wang, Y.; Guo, C.; Kong, J. Improvement of the electrical disintegration of coal sample with different concentrations of NaCl solution. Fuel 2018, 222, 695–704. [Google Scholar] [CrossRef]
- Zhang, X.; Lin, B.; Li, Y. Experimental study on the effects of electrode materials on coal breaking by plasma. Fuel 2020, 270, 117085. [Google Scholar] [CrossRef]
- Xue, D.; Zhou, H.; Lu, Y. Study of drainage and percolation of nitrogen-water flooding in tight coal by NMR imaging. Rock Mech. Rock Eng. 2018, 51, 3421–34370. [Google Scholar] [CrossRef]
- Pan, J.; Niu, Q.; Wang, K.; Shi, X.; Li, M. The closed pores of tectonically deformed coal studied by small-angle X-ray scattering and liquid nitrogen adsorption. Micropor. Mesopor. Mat. 2016, 224, 245–252. [Google Scholar] [CrossRef]
- Niu, Q.; Pan, J.; Cao, L.; Ji, Z.; Wang, H.; Wang, K.; Wang, Z. The evolution and formation mechanisms of closed pores in coal. Fuel 2017, 200, 555–563. [Google Scholar] [CrossRef]
- Fu, X.; Zhao, C.; Lun, Z.; Wang, H.; Wang, M.; Zhang, D. Influences of controlled microwave field radiation on pore structure, surface chemistry and adsorption capability of gas-bearing shales. Mar. Petrol. Geol. 2021, 130, 105134. [Google Scholar] [CrossRef]
- Zheng, S.; Sang, S.; Yao, Y.; Liu, D.; Liu, S.; Wang, M.; Feng, G. A multifractal-based method for determination NMR dual T2 cutoffs in coals. J. Petrol. Sci. Eng. 2022, 214, 110488. [Google Scholar] [CrossRef]
- Jia, Q.; Kou, B.; Shi, Q. The evolution of closed pores induced by in situ pyrolysis of coal and its effect on volatile yield. J. Anal. Appl. Pyrol. 2026, 193, 107386. [Google Scholar] [CrossRef]
- Li, Q.; Liu, D.; Cai, Y.; Zhou, Y.; Yin, T. Investigation on the methane adsorption capacity in coals: Considerations from nanopores by multifractal analysis. Energy Fuels 2021, 35, 6633–6643. [Google Scholar] [CrossRef]
- Zhao, Y.; Wang, C.; Ning, L.; Zhao, H.; Bi, J. Pore and fracture development in coal under stress conditions based on nuclear magnetic resonance and fractal theory. Fuel 2022, 309, 122112. [Google Scholar] [CrossRef]
- Ji, S.; Lai, X.; Cui, F.; Liu, Y.; Pan, R.; Karlovšek, J. The failure of edge-cracked hard roof in underground mining: An analytical study. Int. J. Rock Mech. Min. 2024, 183, 105934. [Google Scholar] [CrossRef]
- Zhang, M.; Fu, X. Characterization of pore structure and its impact on methane adsorption capacity for semi-anthracite in Shizhuangnan Block, Qinshui Basin. J. Nat. Gas Sci. Eng. 2018, 60, 49–62. [Google Scholar] [CrossRef]
- Jia, Q.; Shen, L.; Zhou, Z.; Wang, S.; Liu, L.; Wang, Y.; Liu, L.; Wang, Y.; Li, Y.; Wang, J. Flowability, Carbon Sequestration, and Strength Properties of Carbonation-Cured Solid Waste-Based Backfilling Materials. Energy Fuels 2025, 39, 17990–18000. [Google Scholar] [CrossRef]
Disclaimer/Publisher’s Note: The statements, opinions and data contained in all publications are solely those of the individual author(s) and contributor(s) and not of MDPI and/or the editor(s). MDPI and/or the editor(s) disclaim responsibility for any injury to people or property resulting from any ideas, methods, instructions or products referred to in the content. |
© 2025 by the authors. Licensee MDPI, Basel, Switzerland. This article is an open access article distributed under the terms and conditions of the Creative Commons Attribution (CC BY) license (https://creativecommons.org/licenses/by/4.0/).