
Logging Evaluation of Irreducible Water Saturation: Fractal Theory and Data-Driven Approach—Case Study of Complex Porous Carbonate Reservoirs in Mishrif Formation


Abstract
1. Introduction
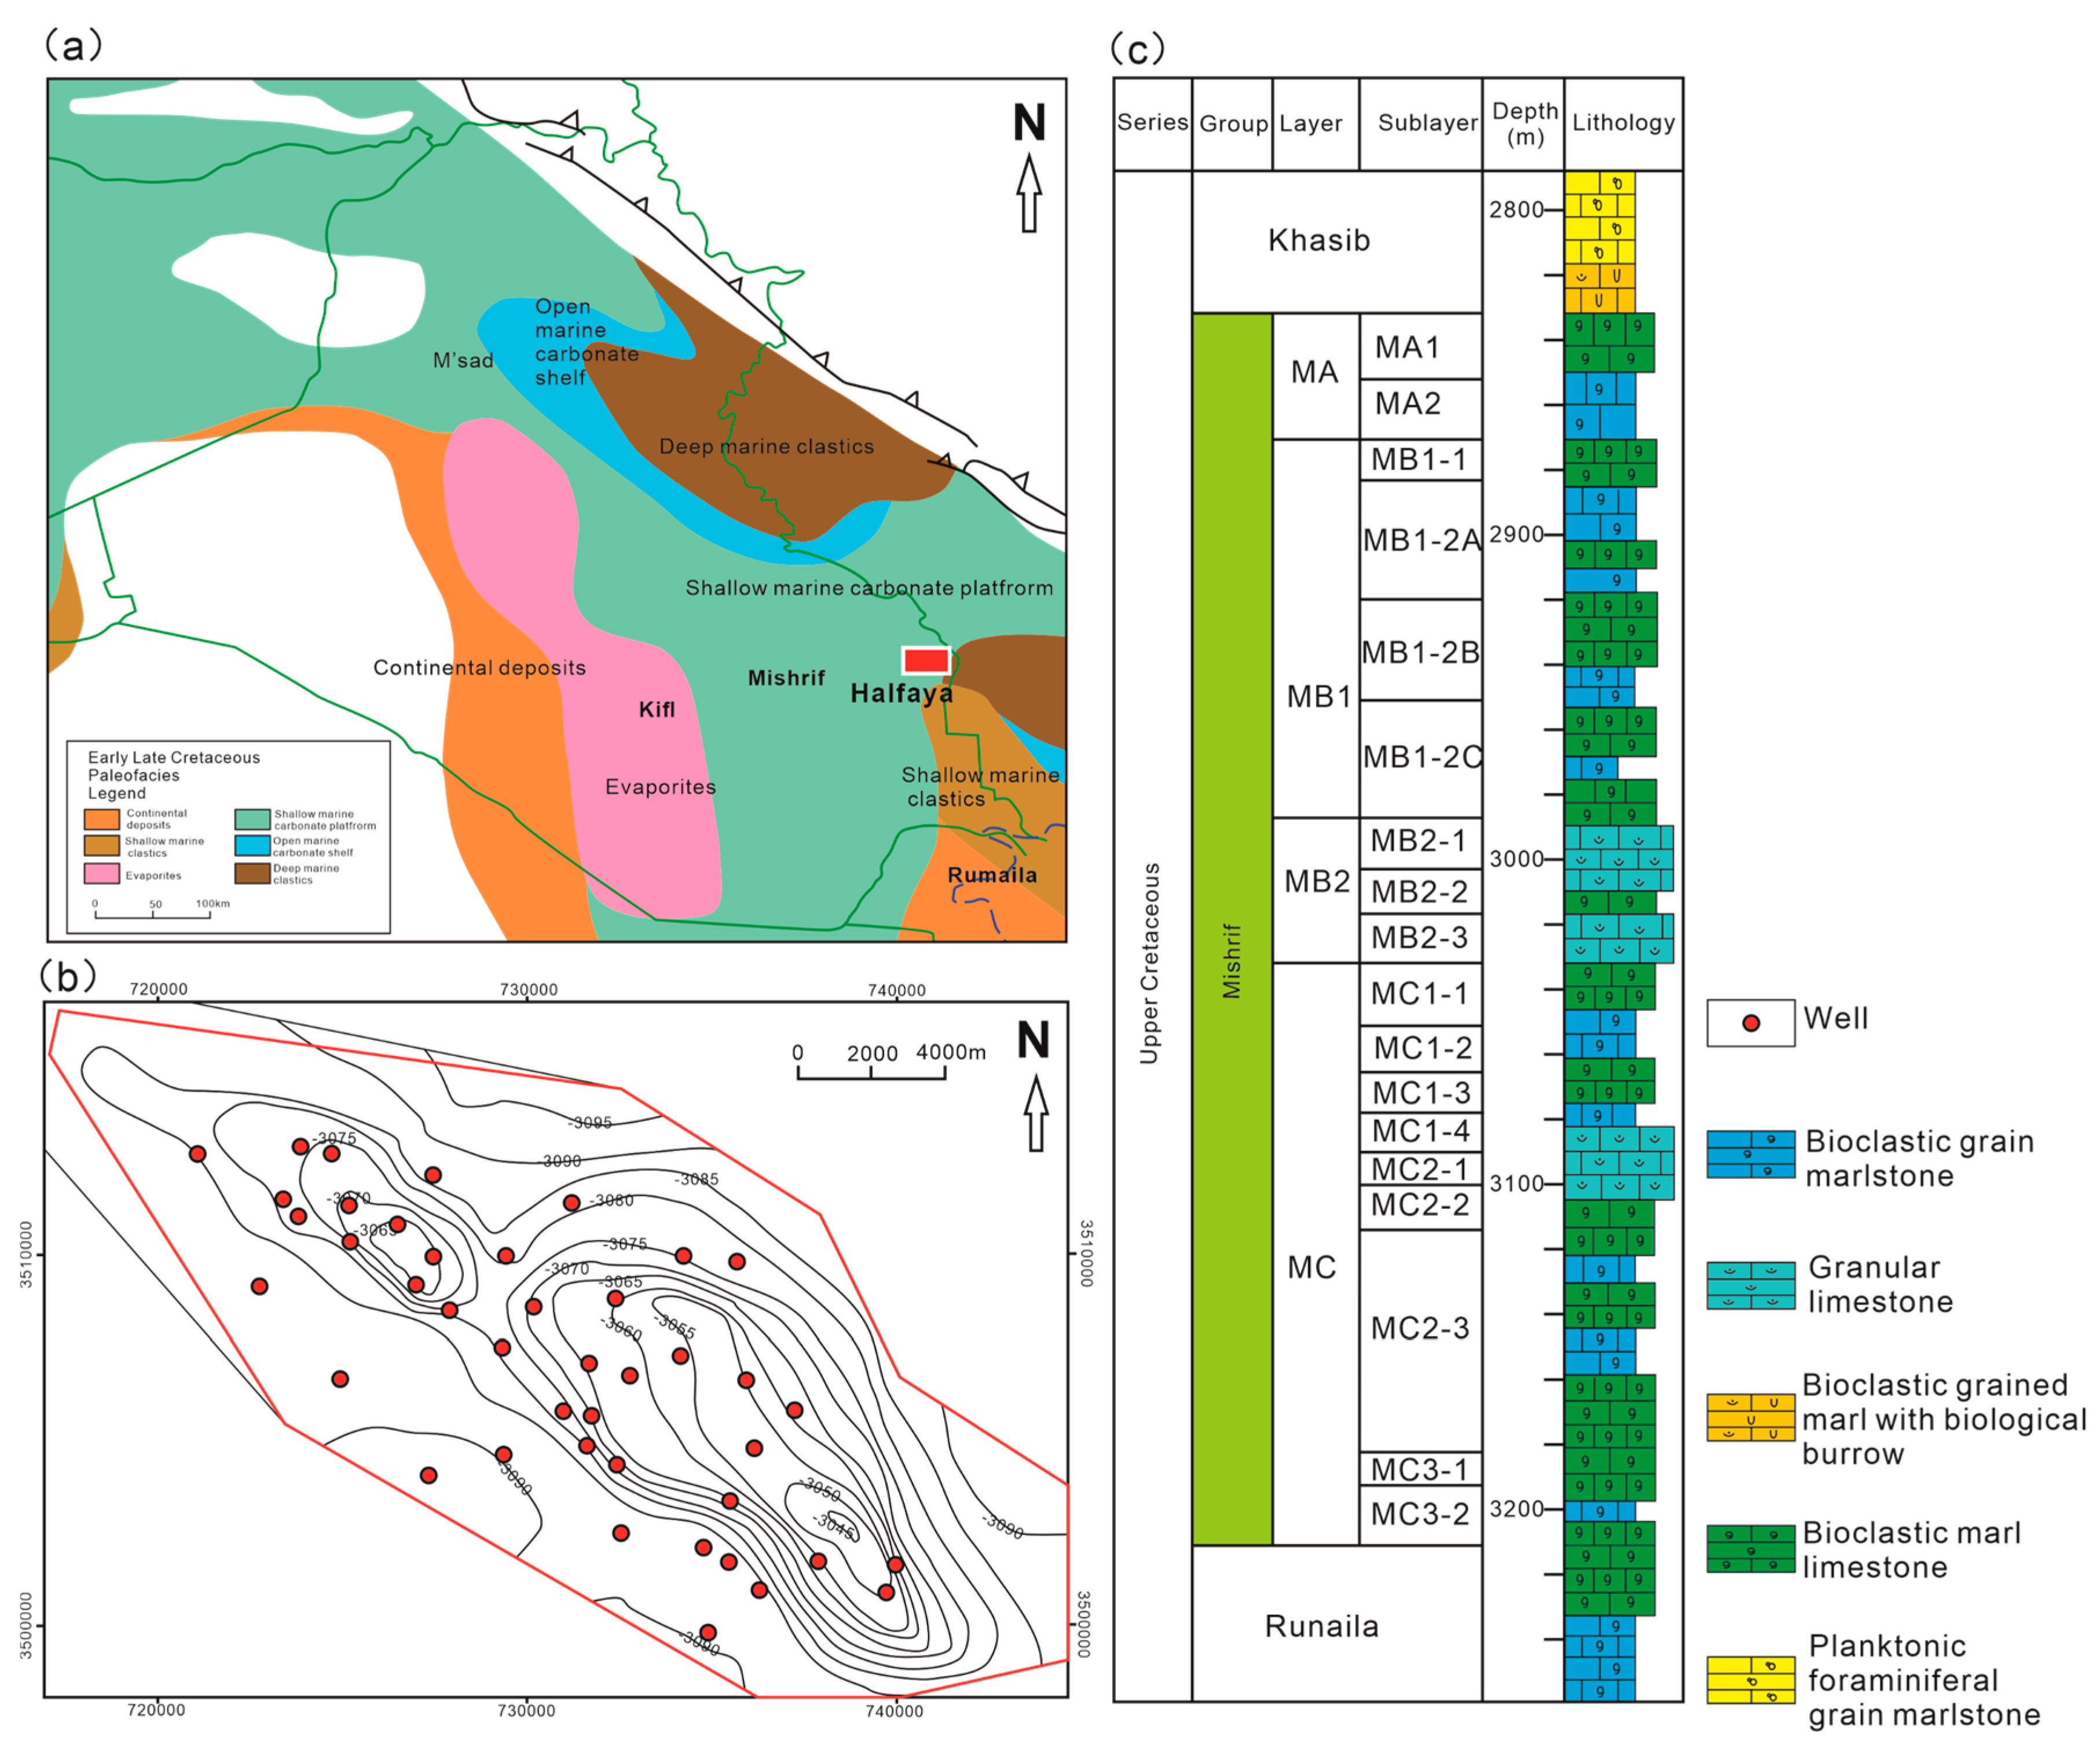
2. Overview of Geological Area
3. Material Source and Experiment
4. Methods and Principles
4.1. Derivation and Verification of Irreducible Water Saturation Formula Based on Fractal Nuclear Magnetic Permeability
4.1.1. Derivation of Irreducible Water Saturation Formula
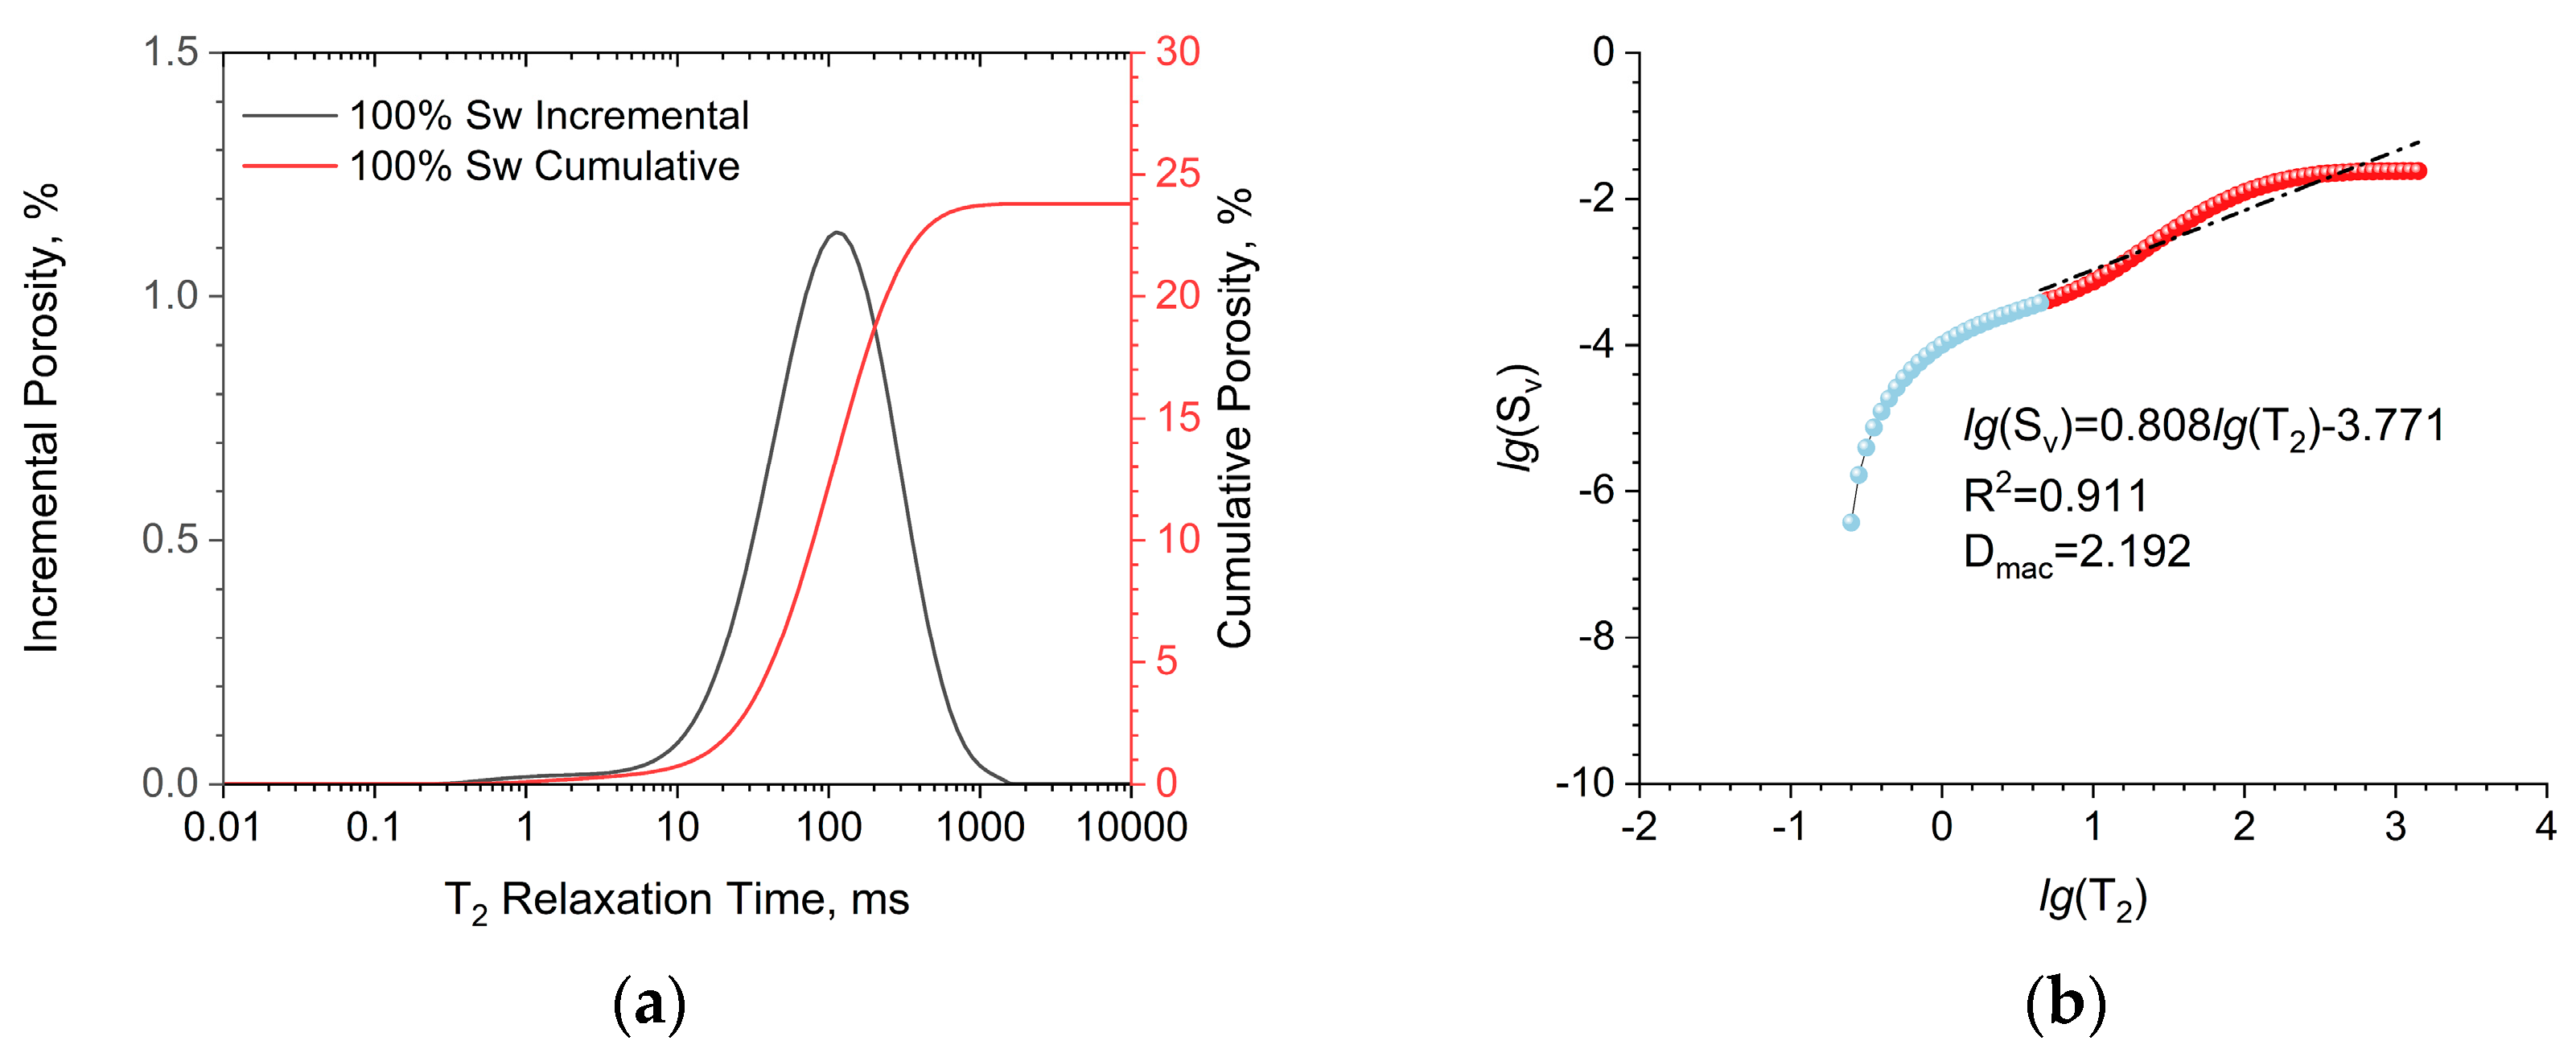
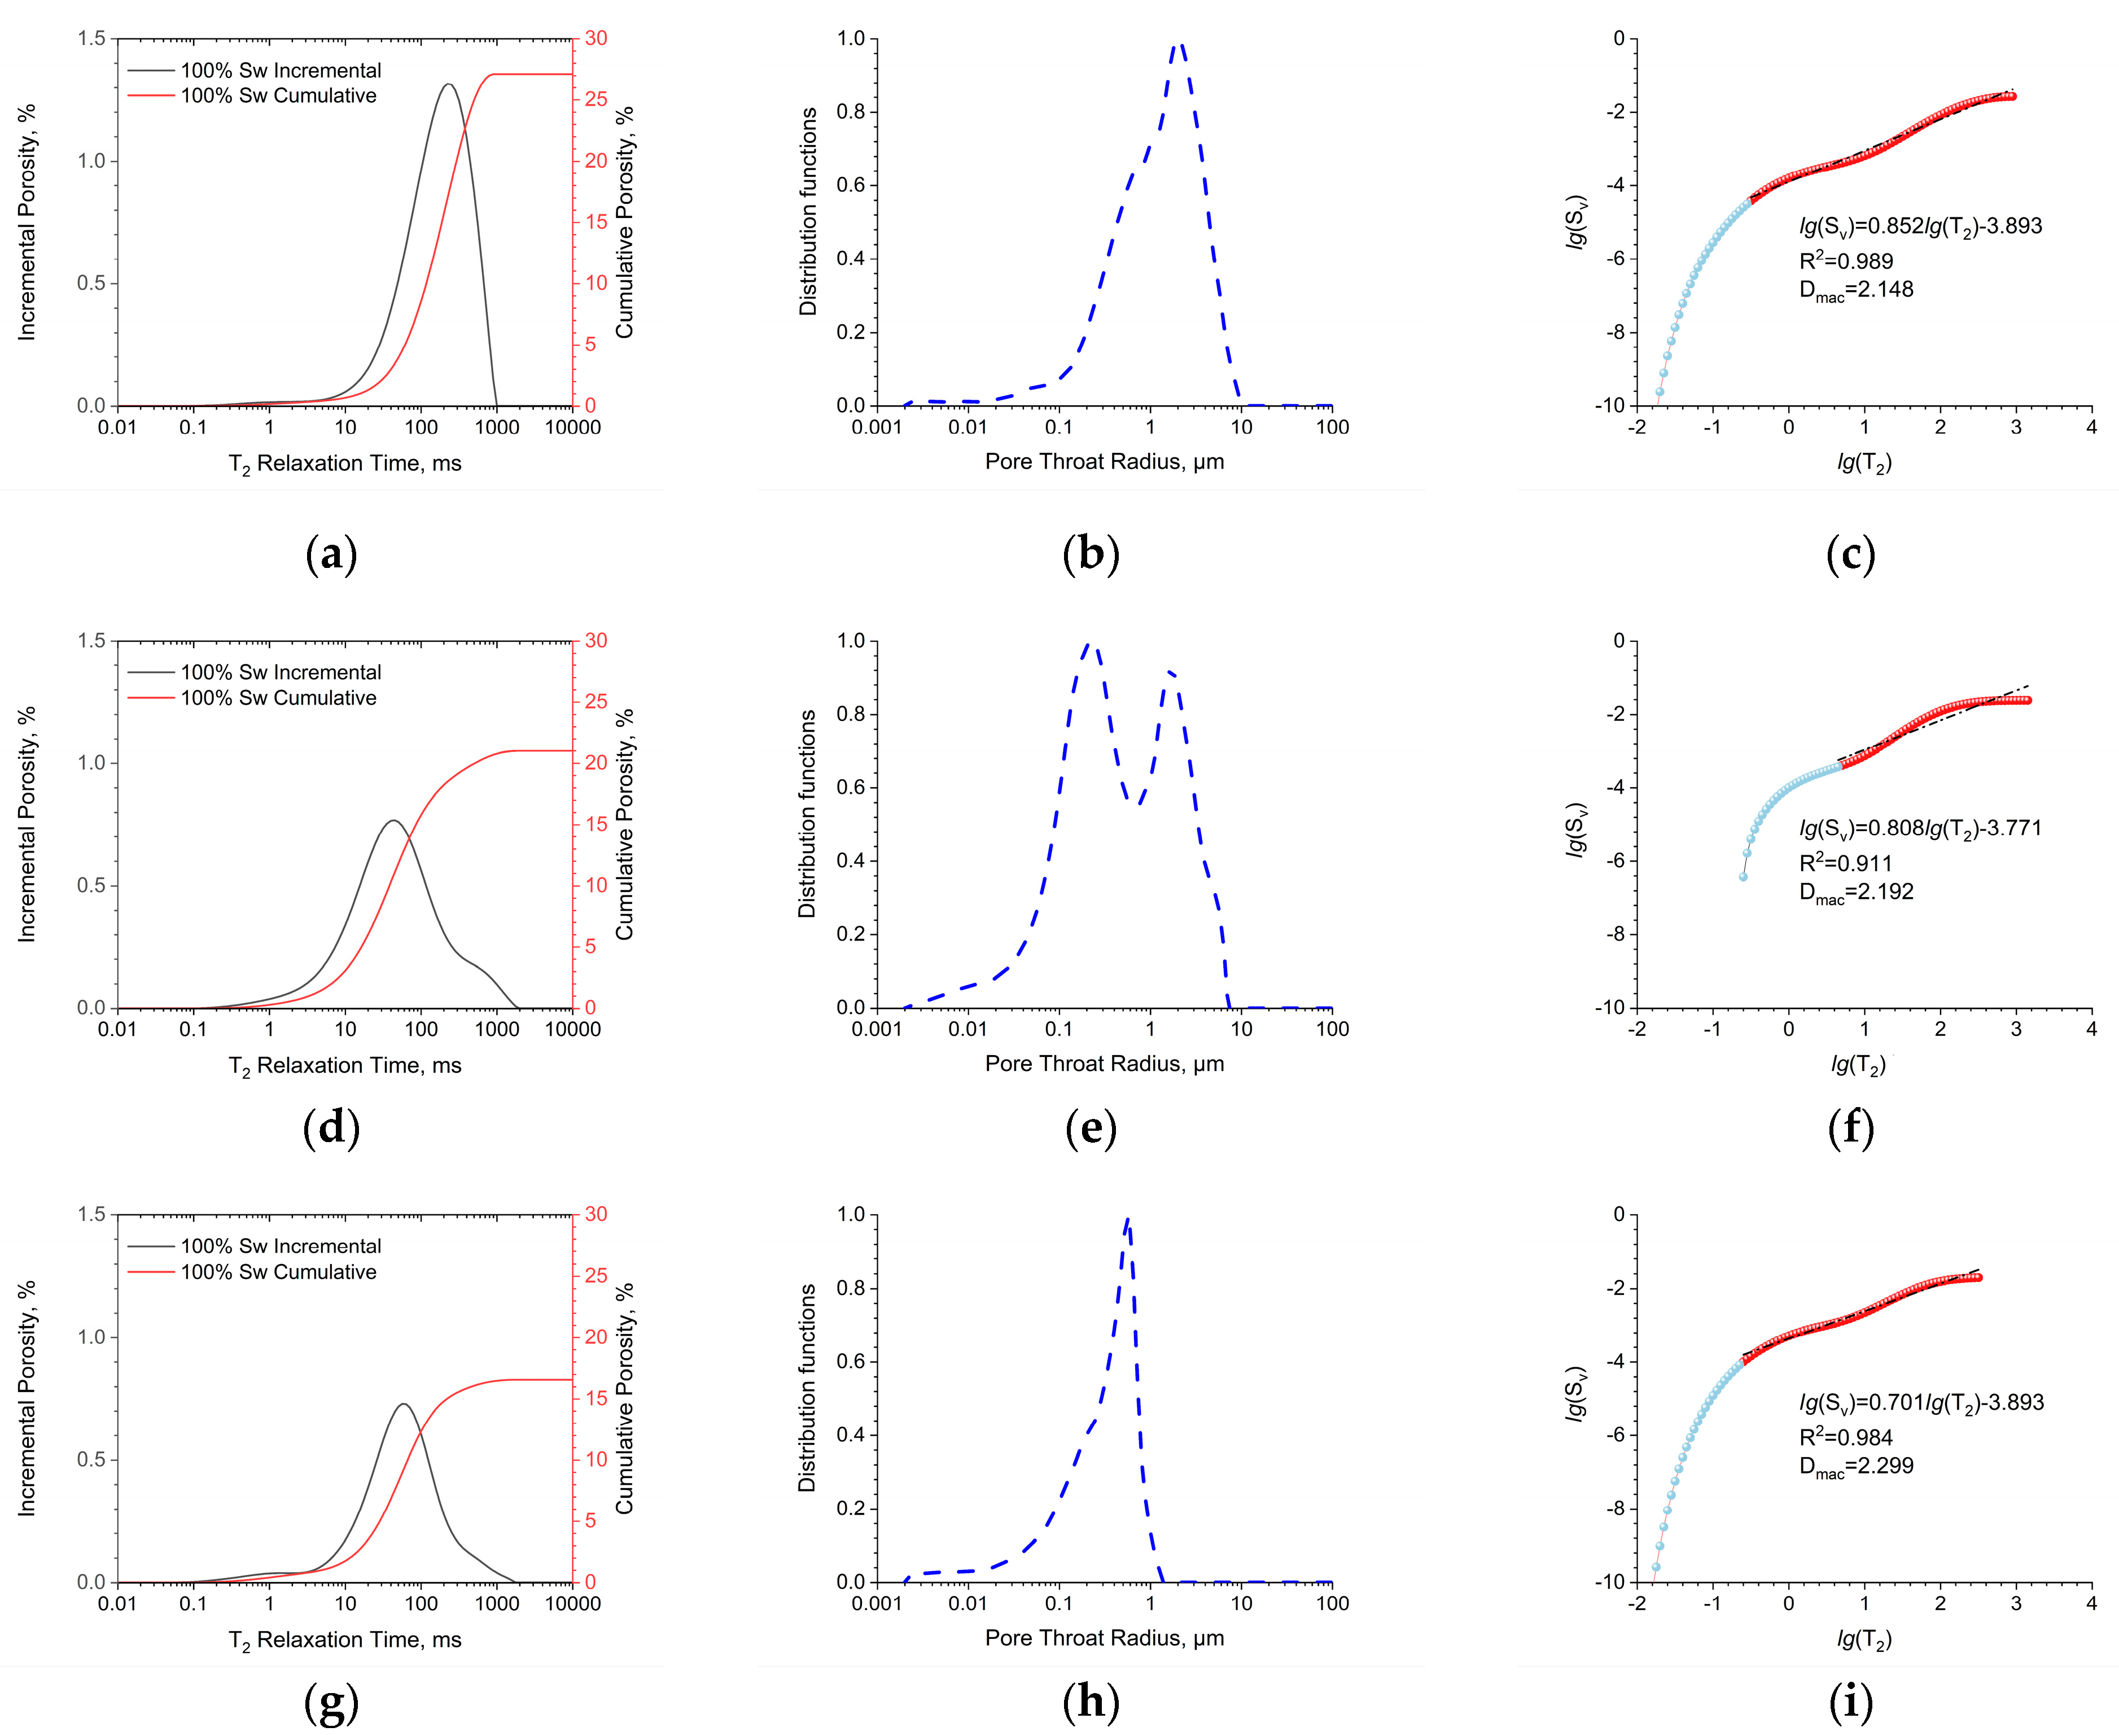
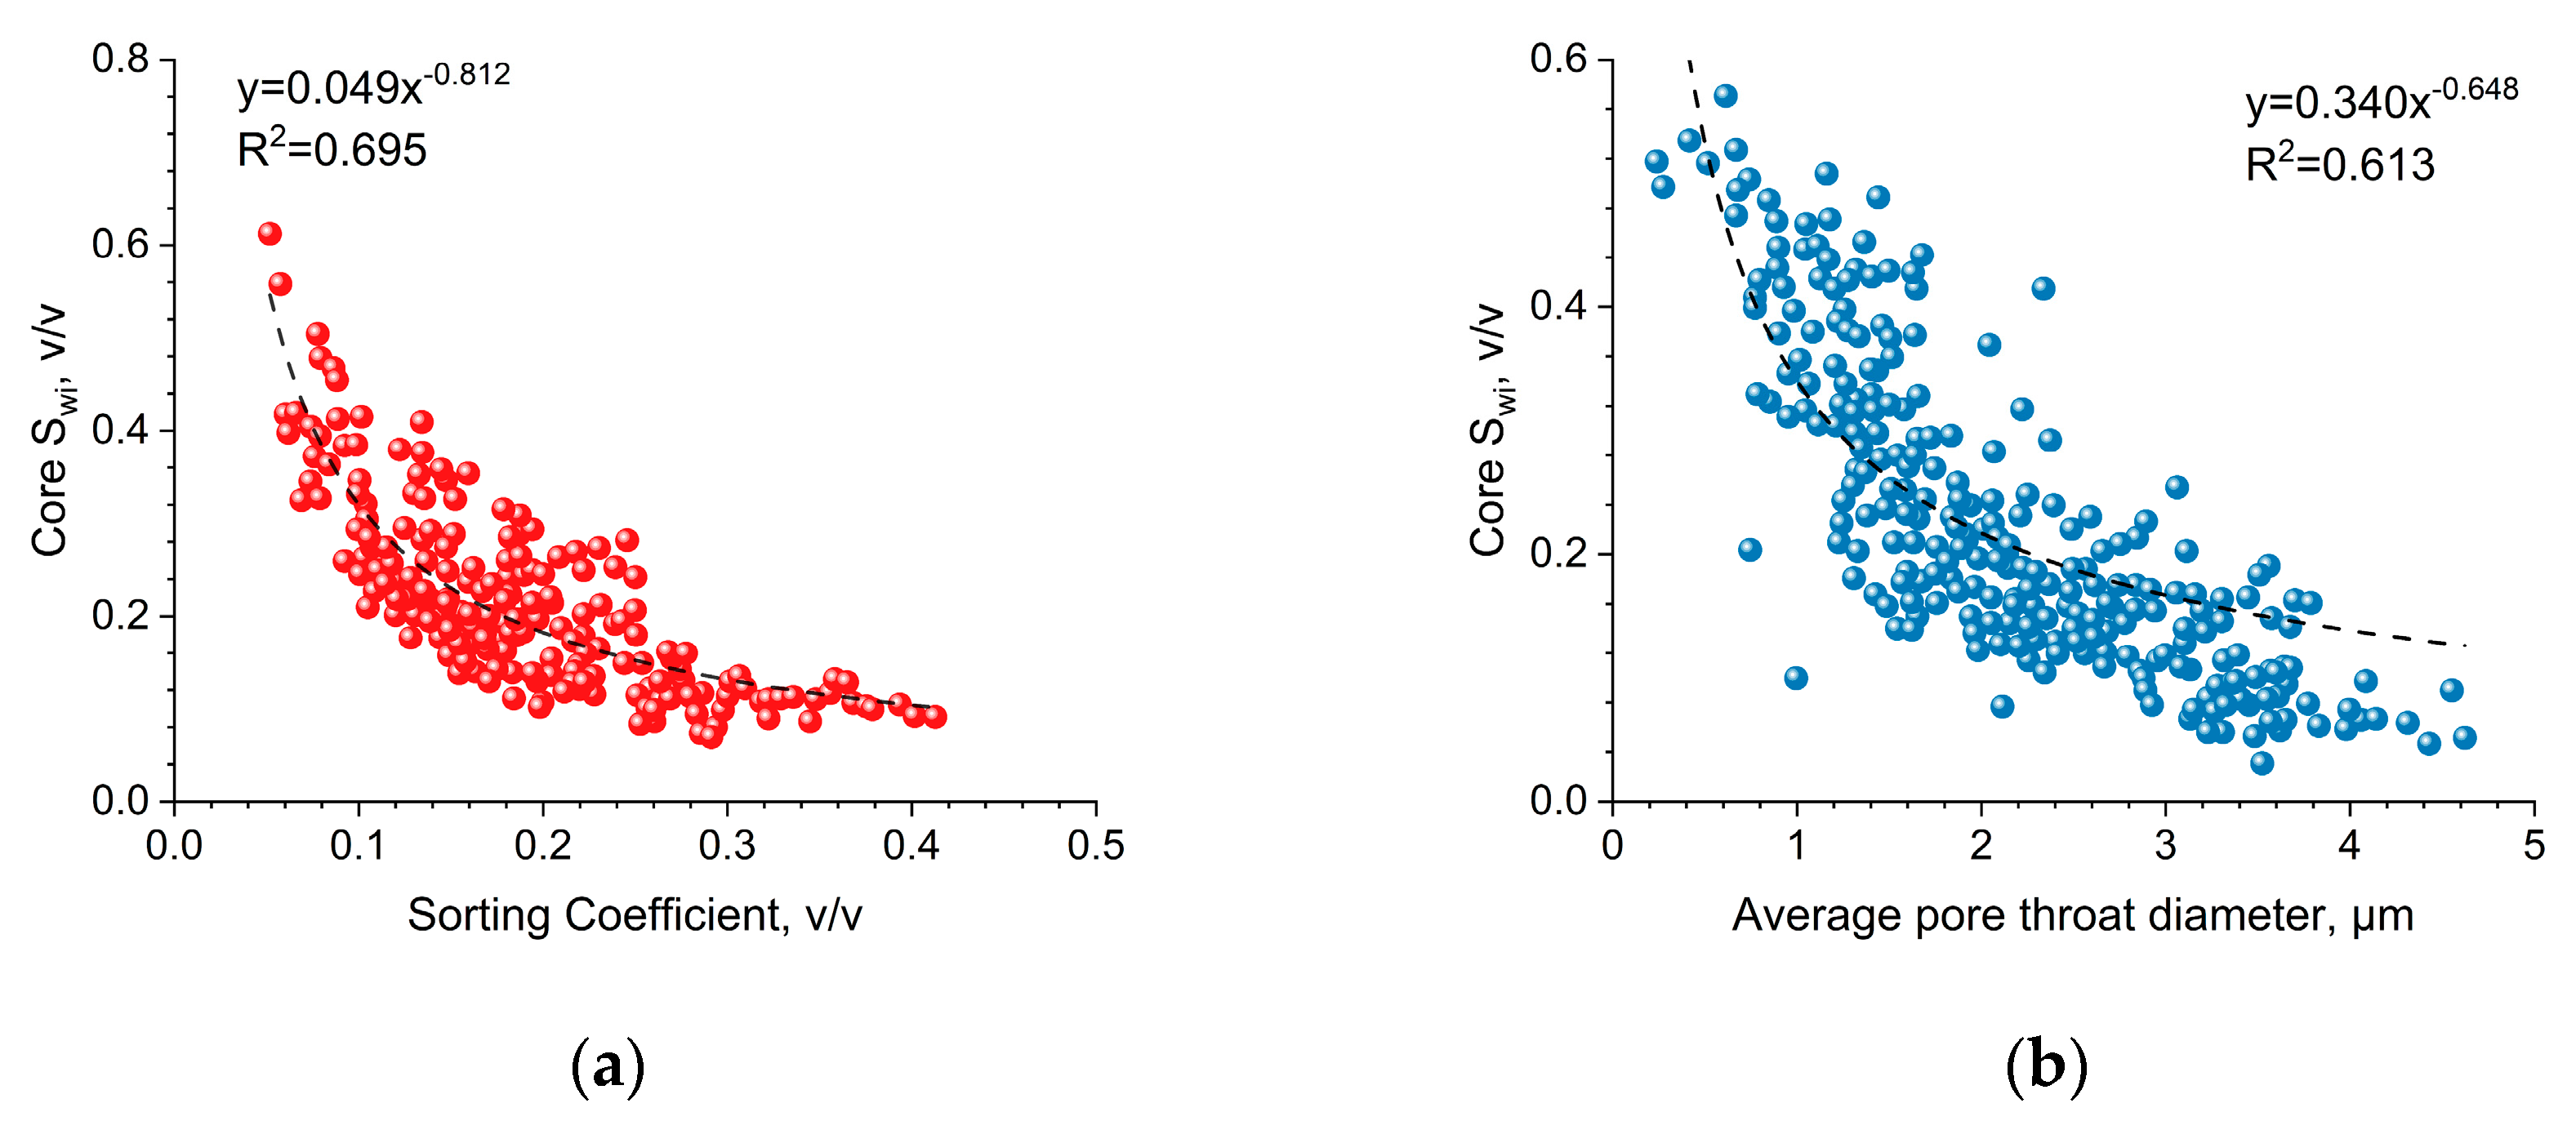
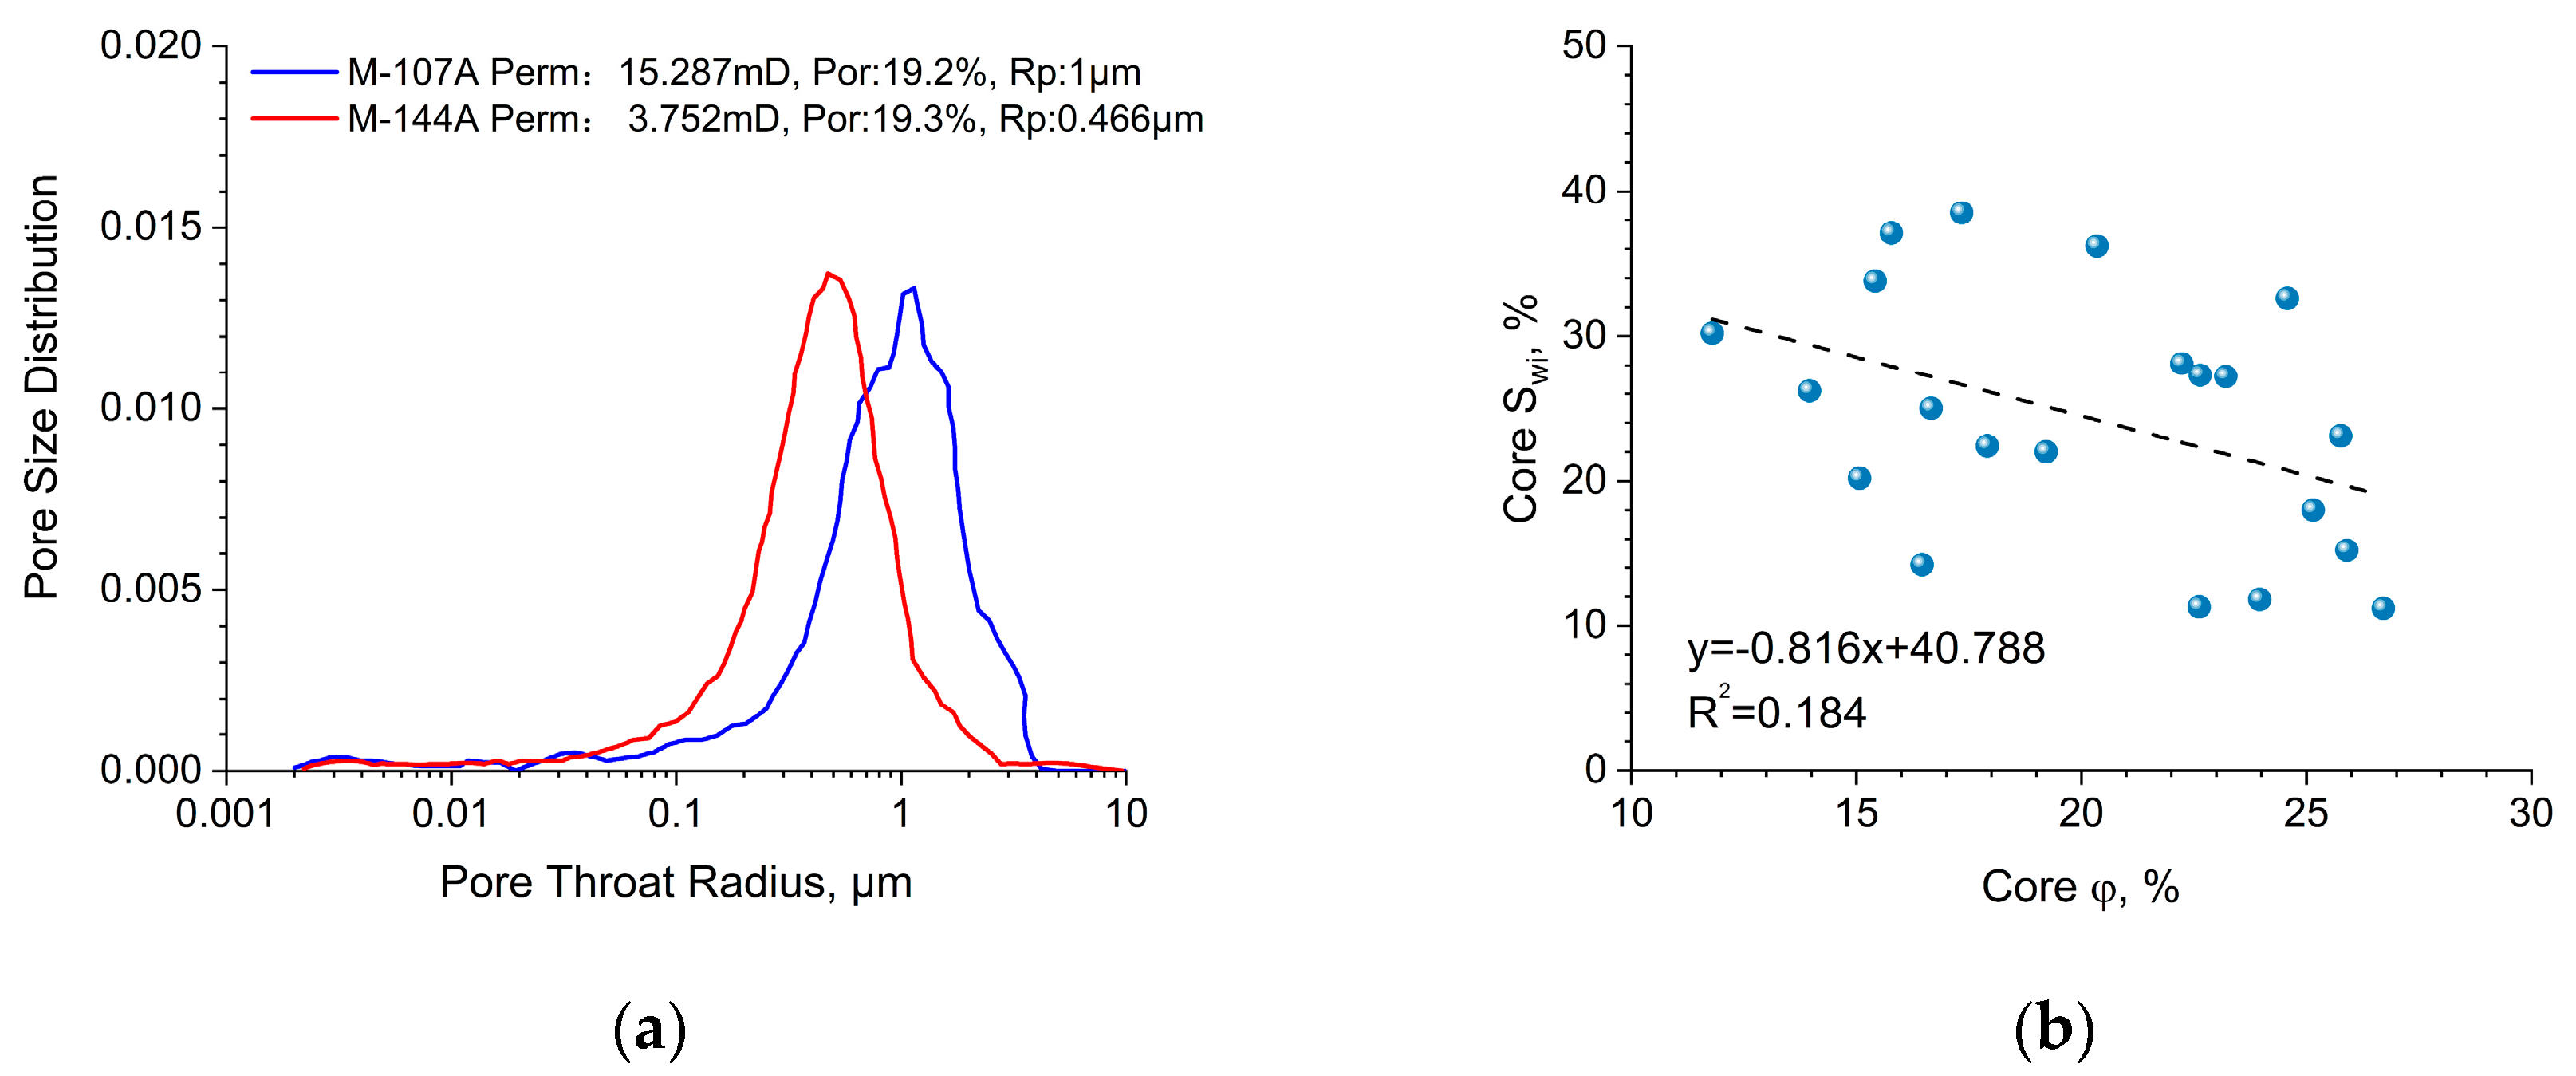
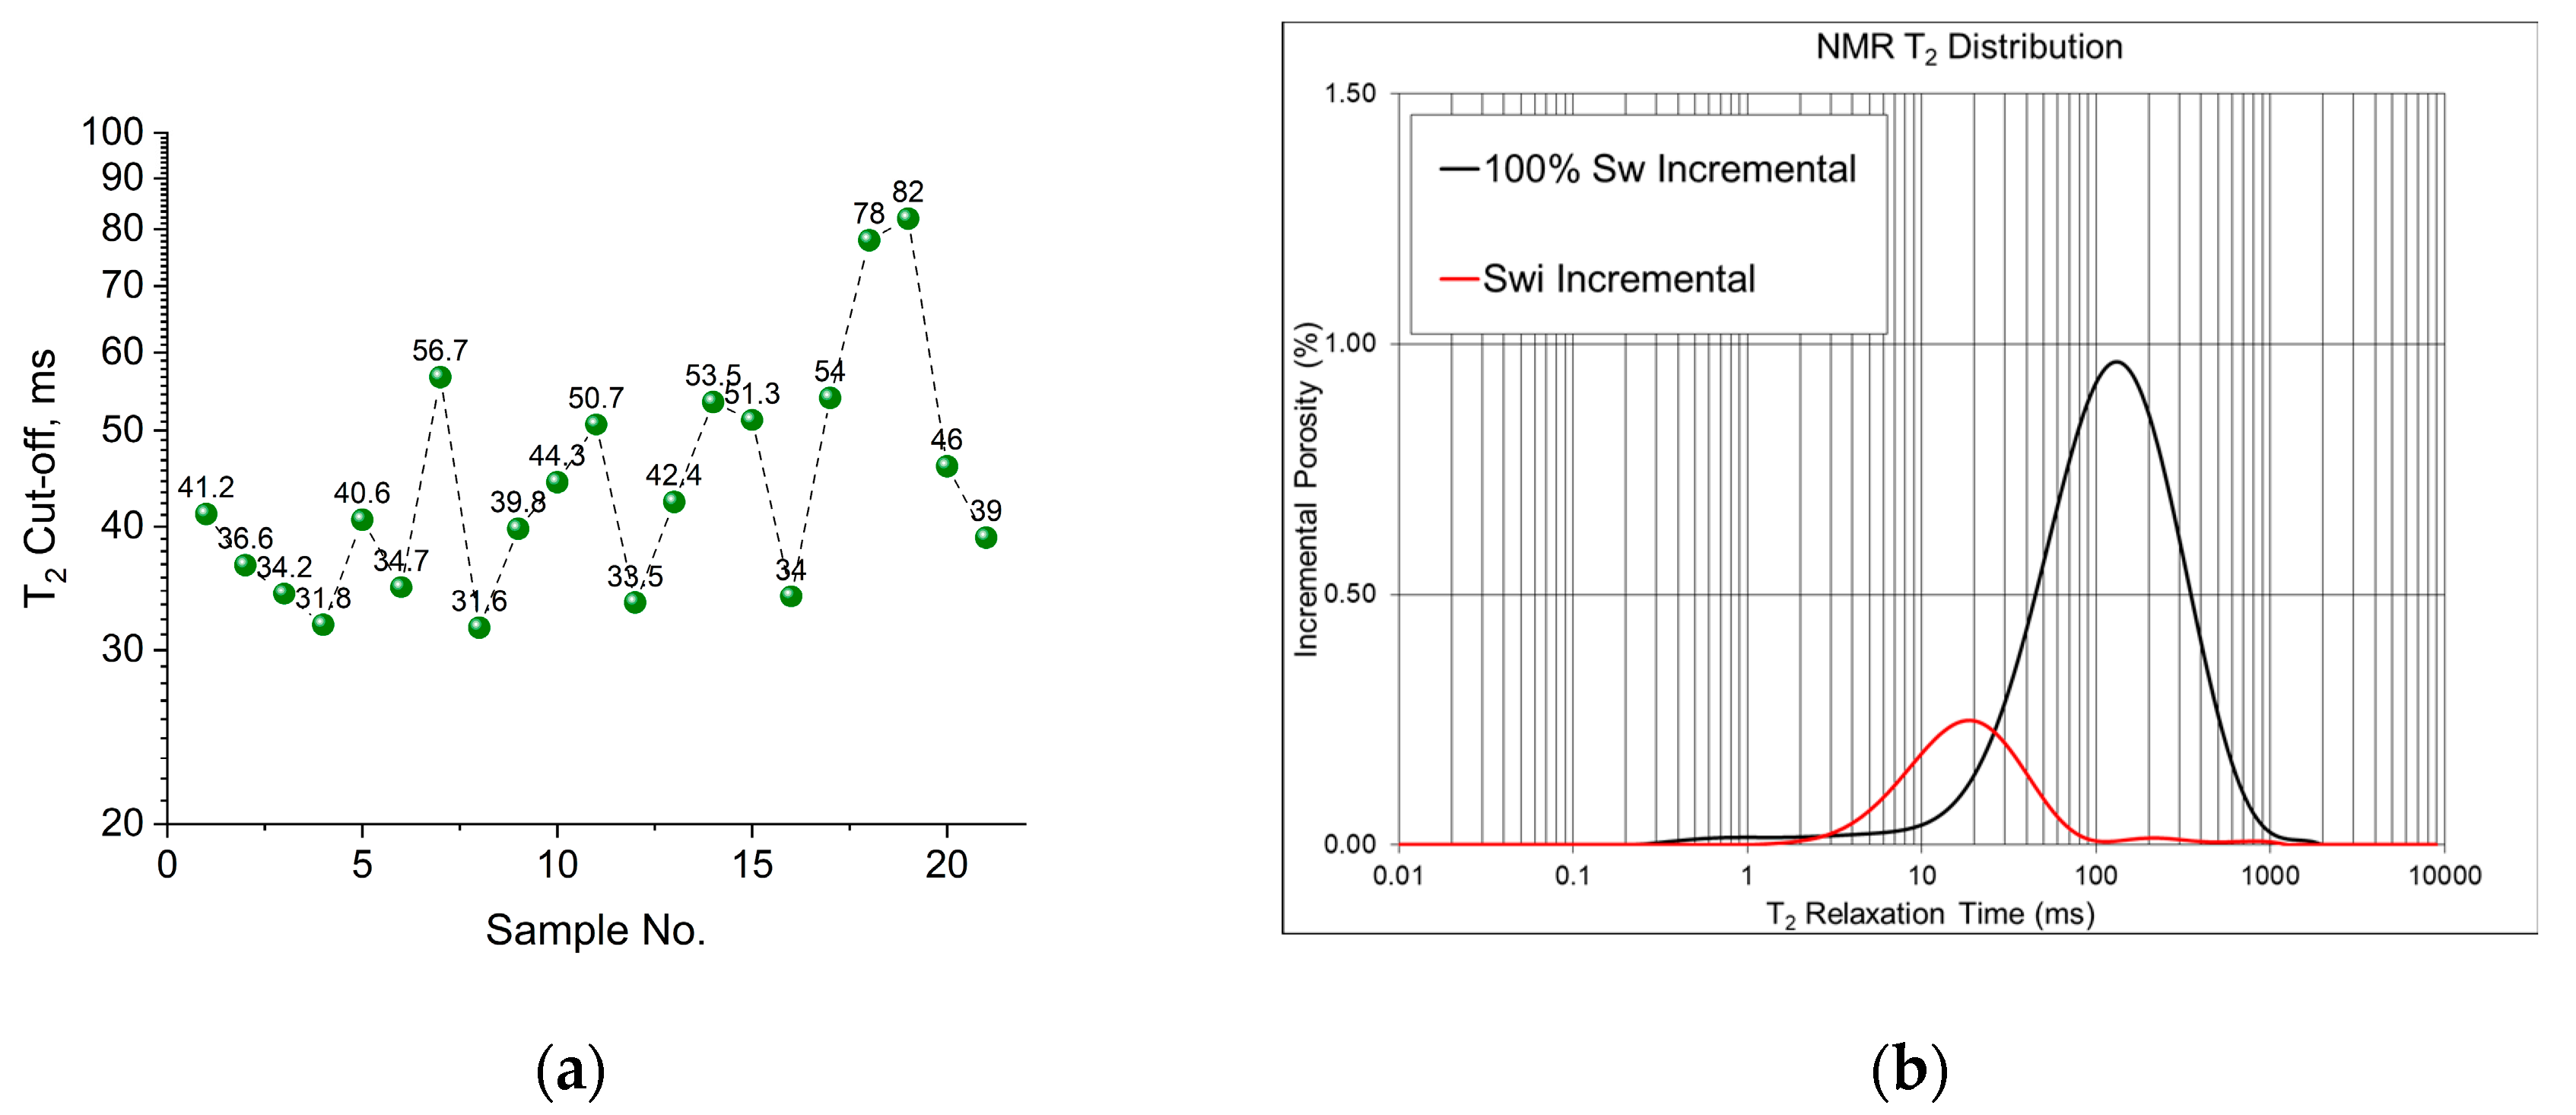
4.1.2. Verification of Irreducible Water Saturation Formula
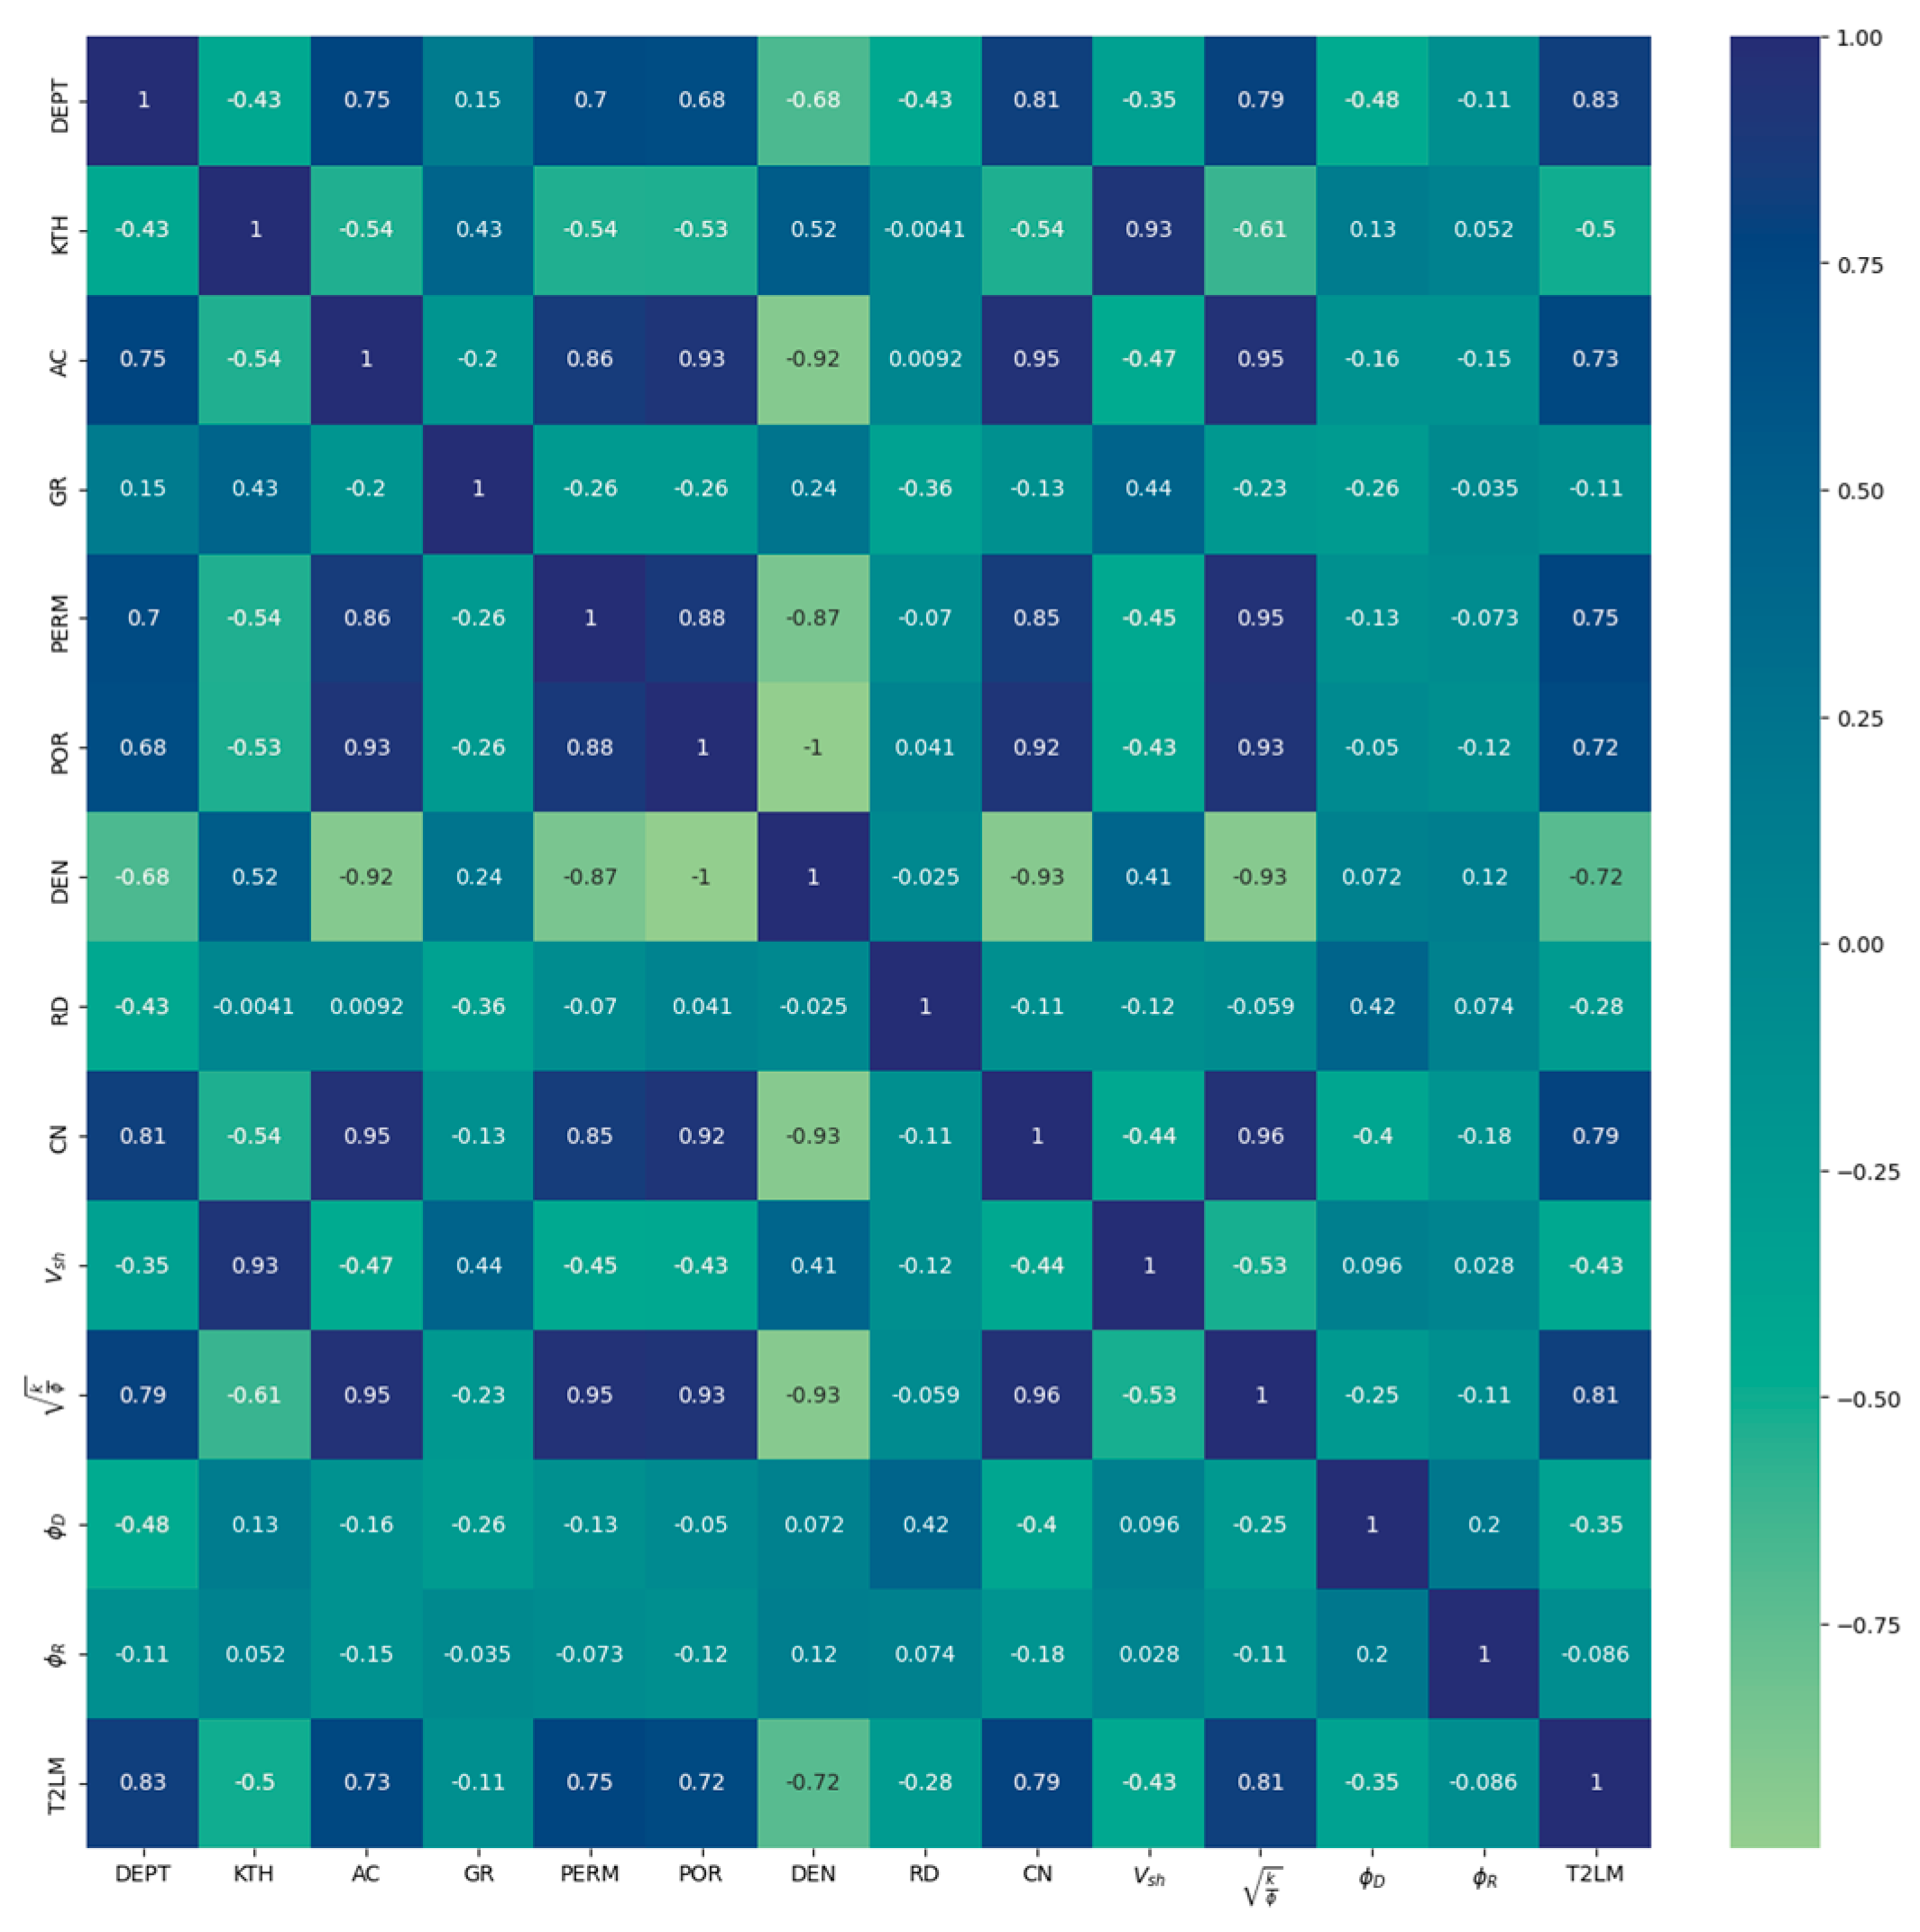
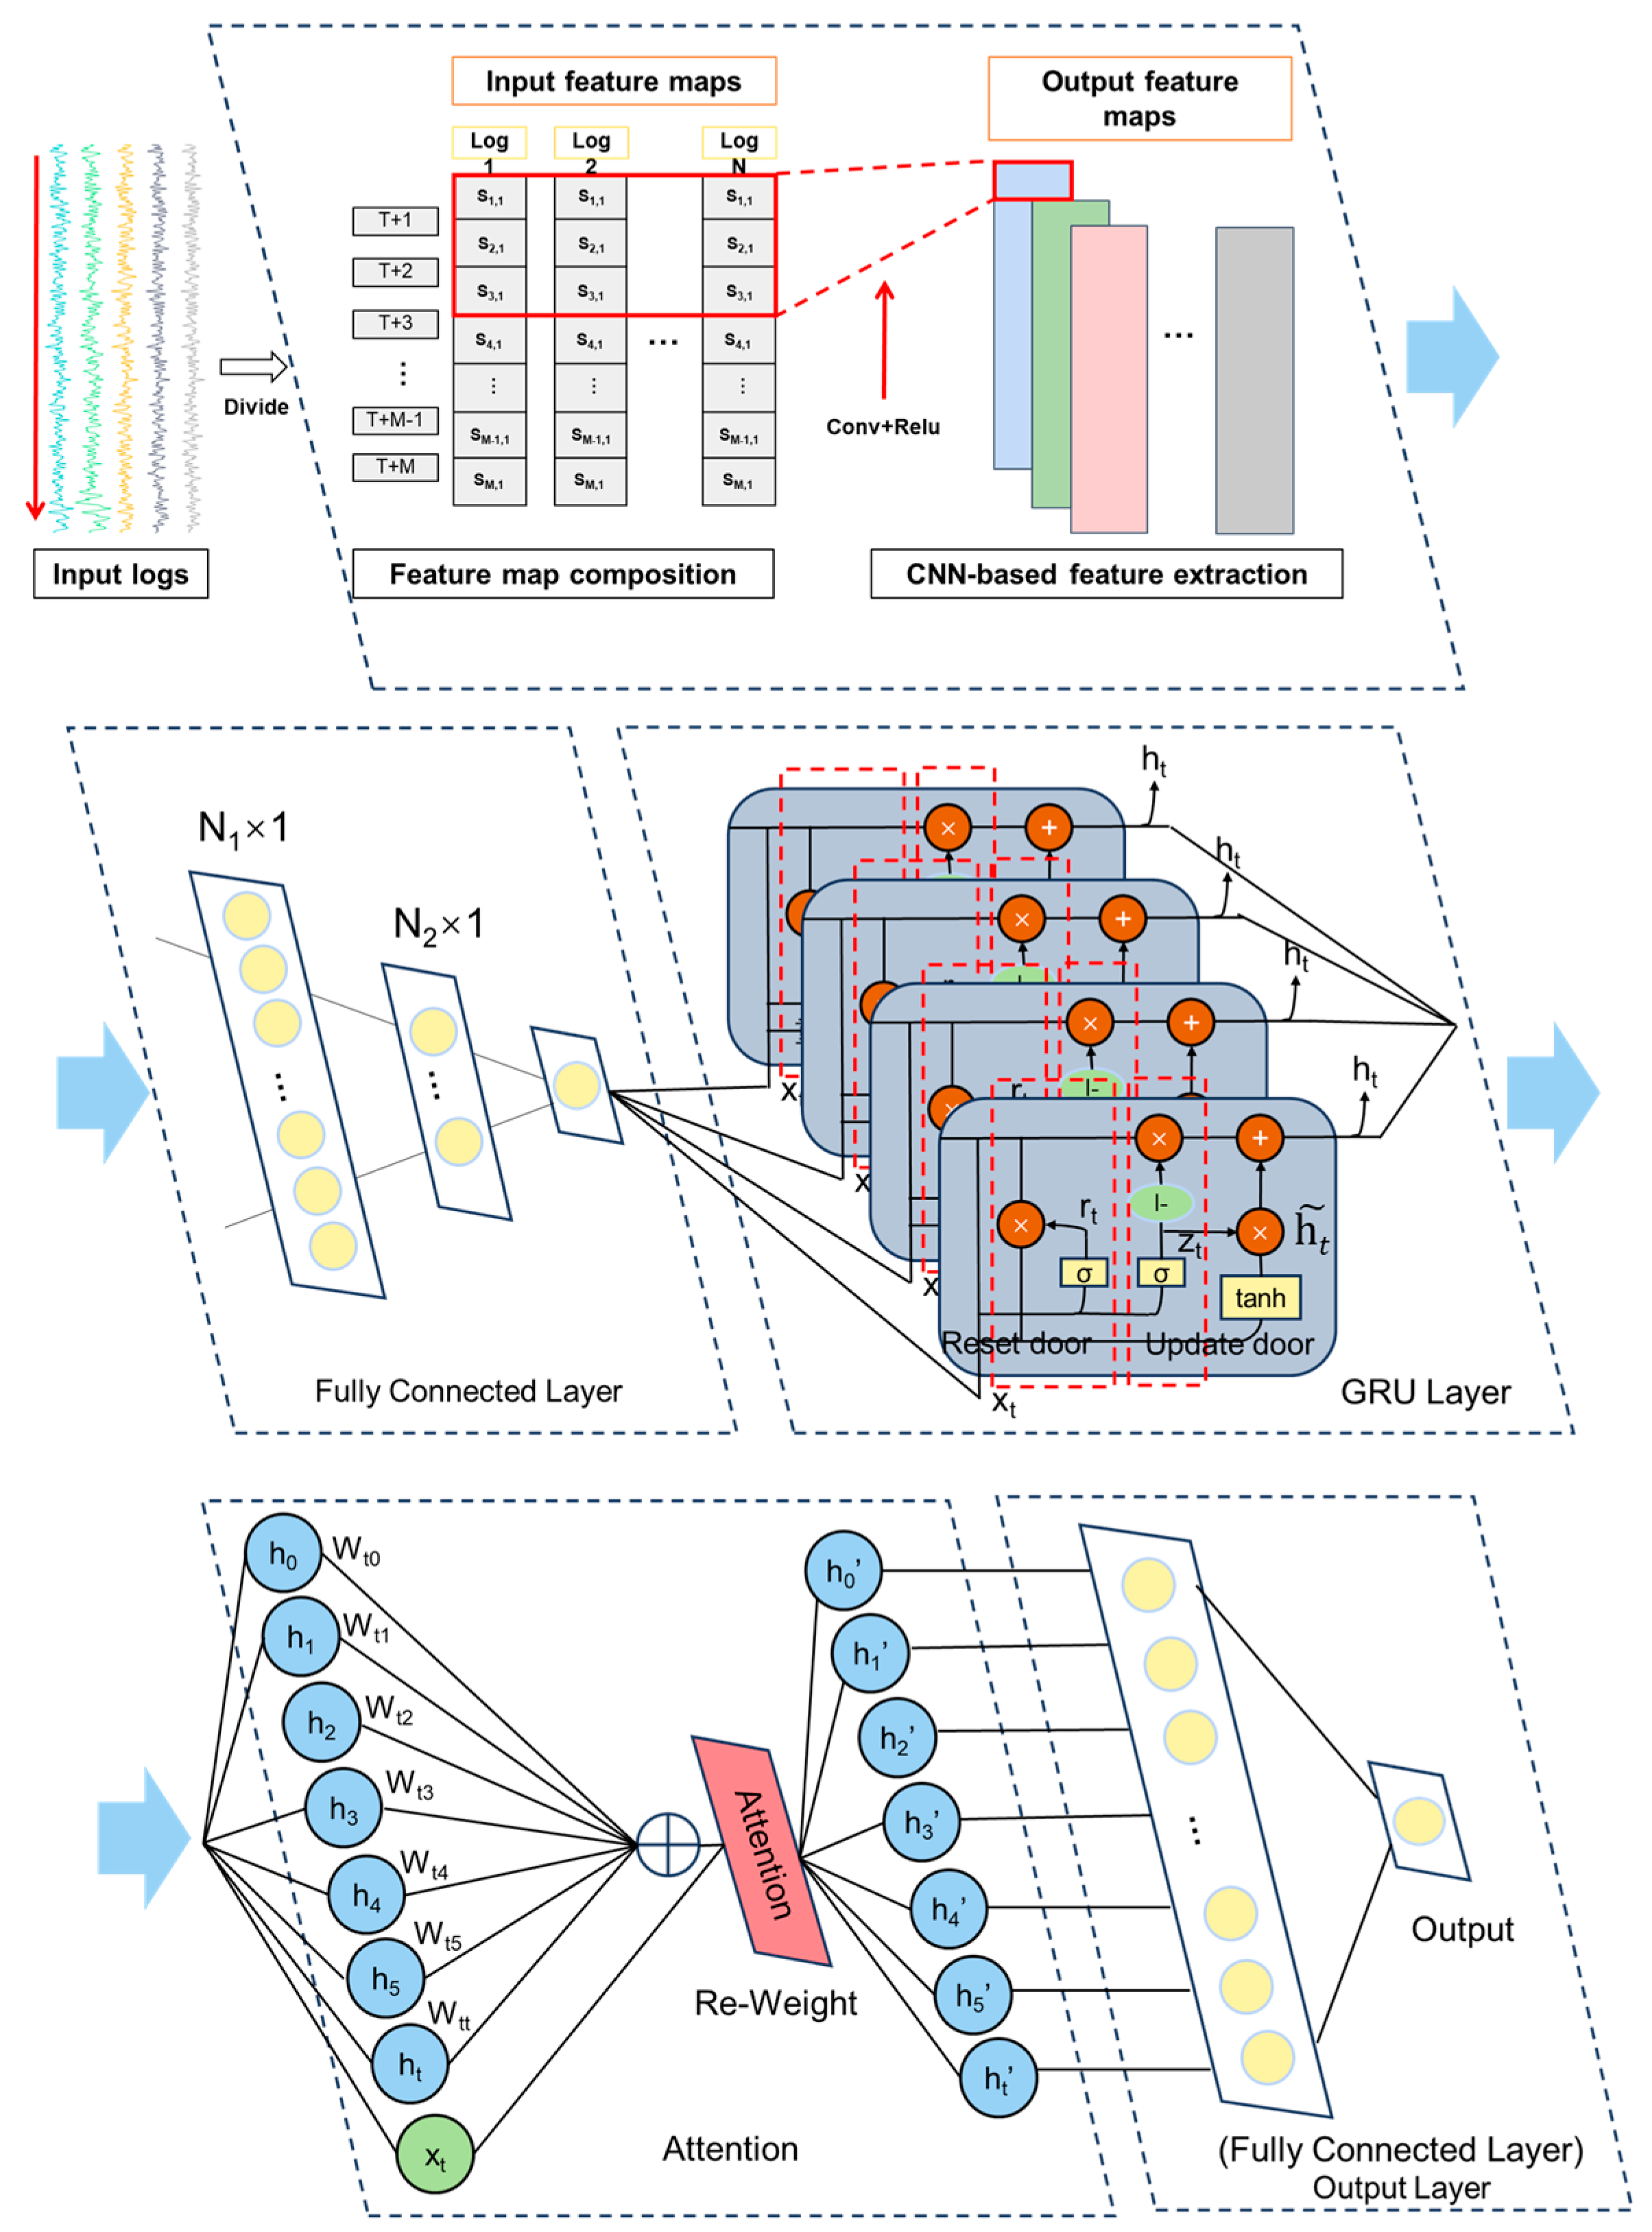
4.2. The Conventional Expression Form of T2lm and the Promotion of Deep Learning Algorithm
4.2.1. Numerical Expression of T2lm Based on Thomeer Function and Fractal Theory
- (1)
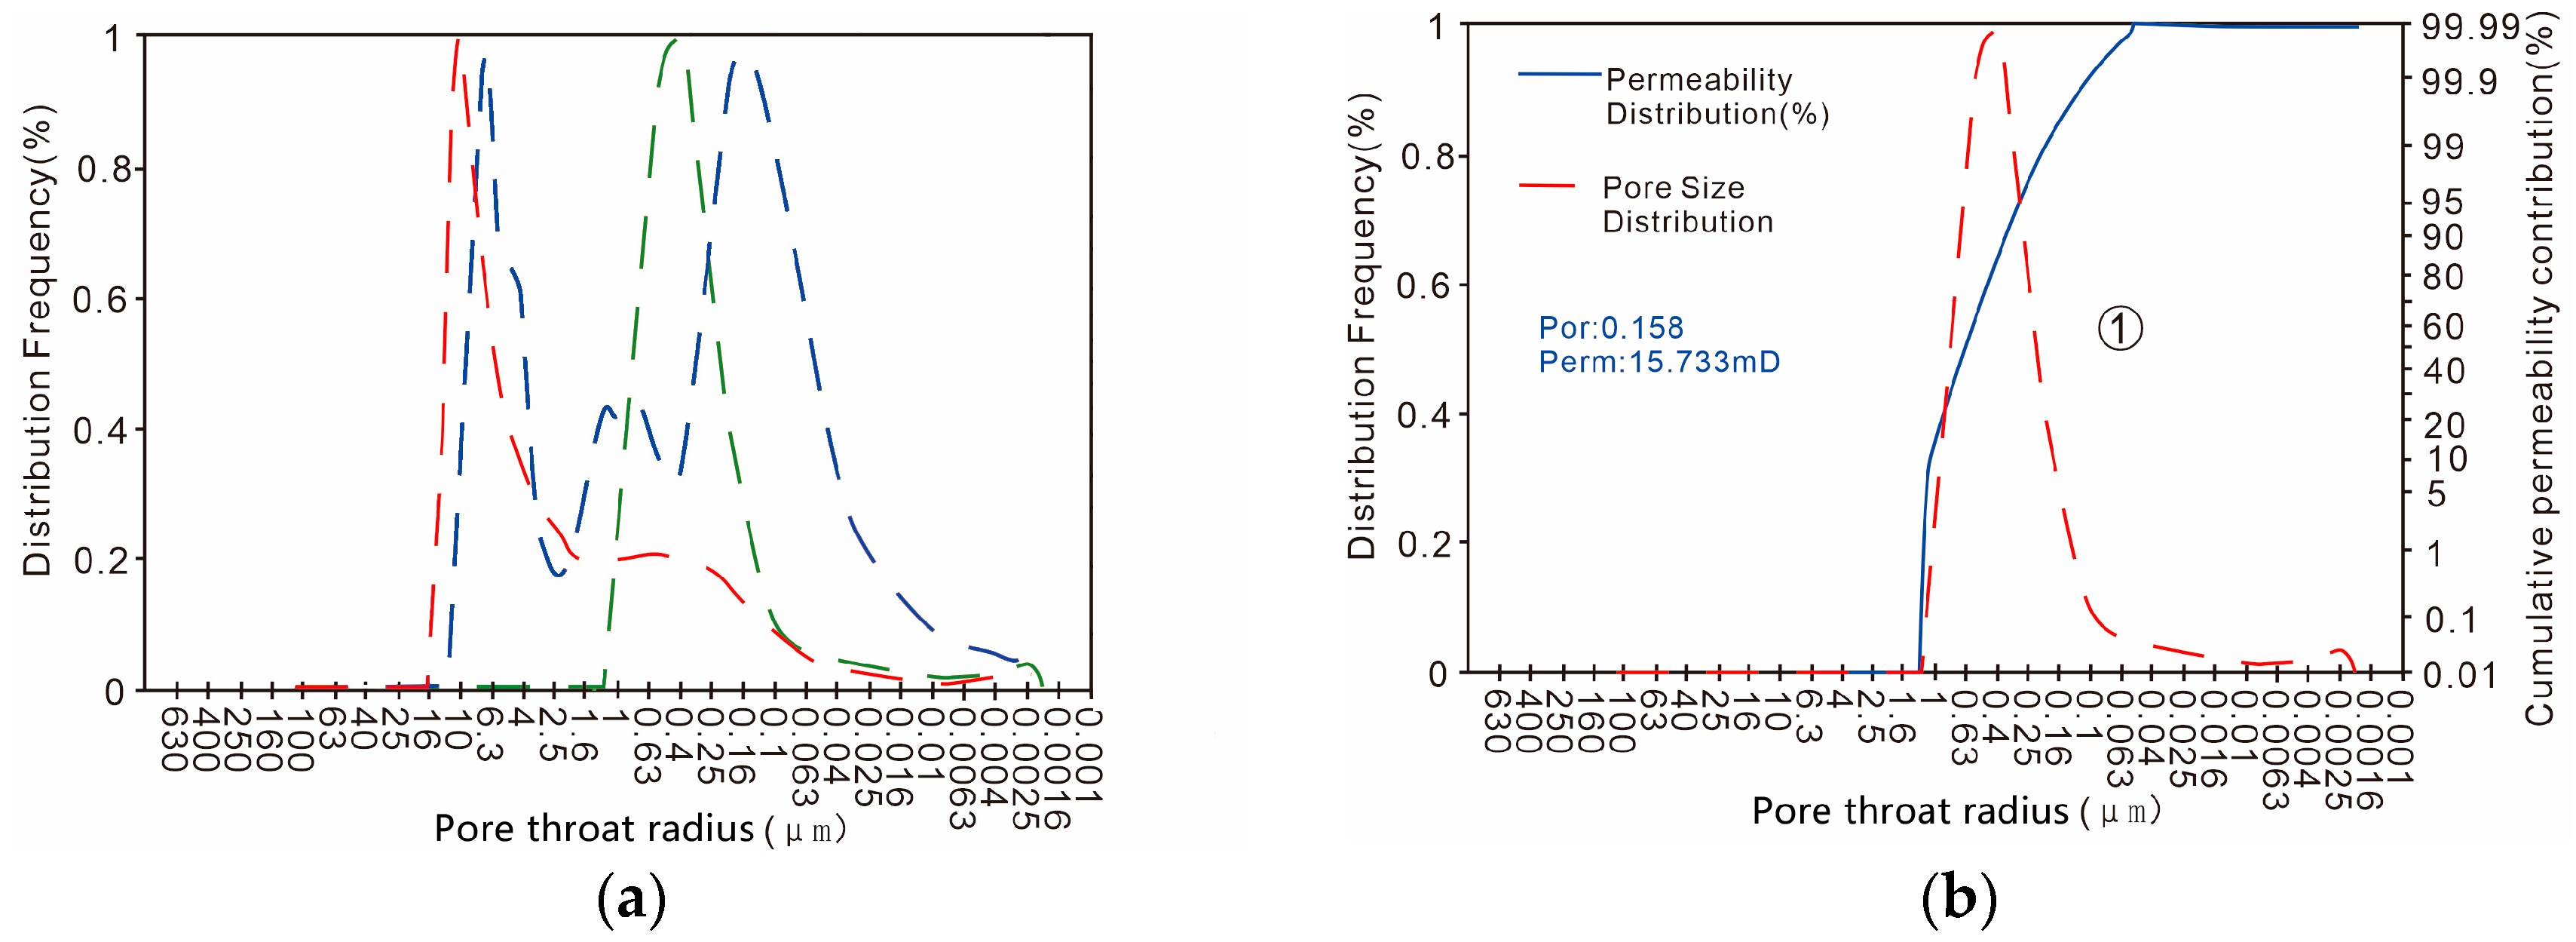
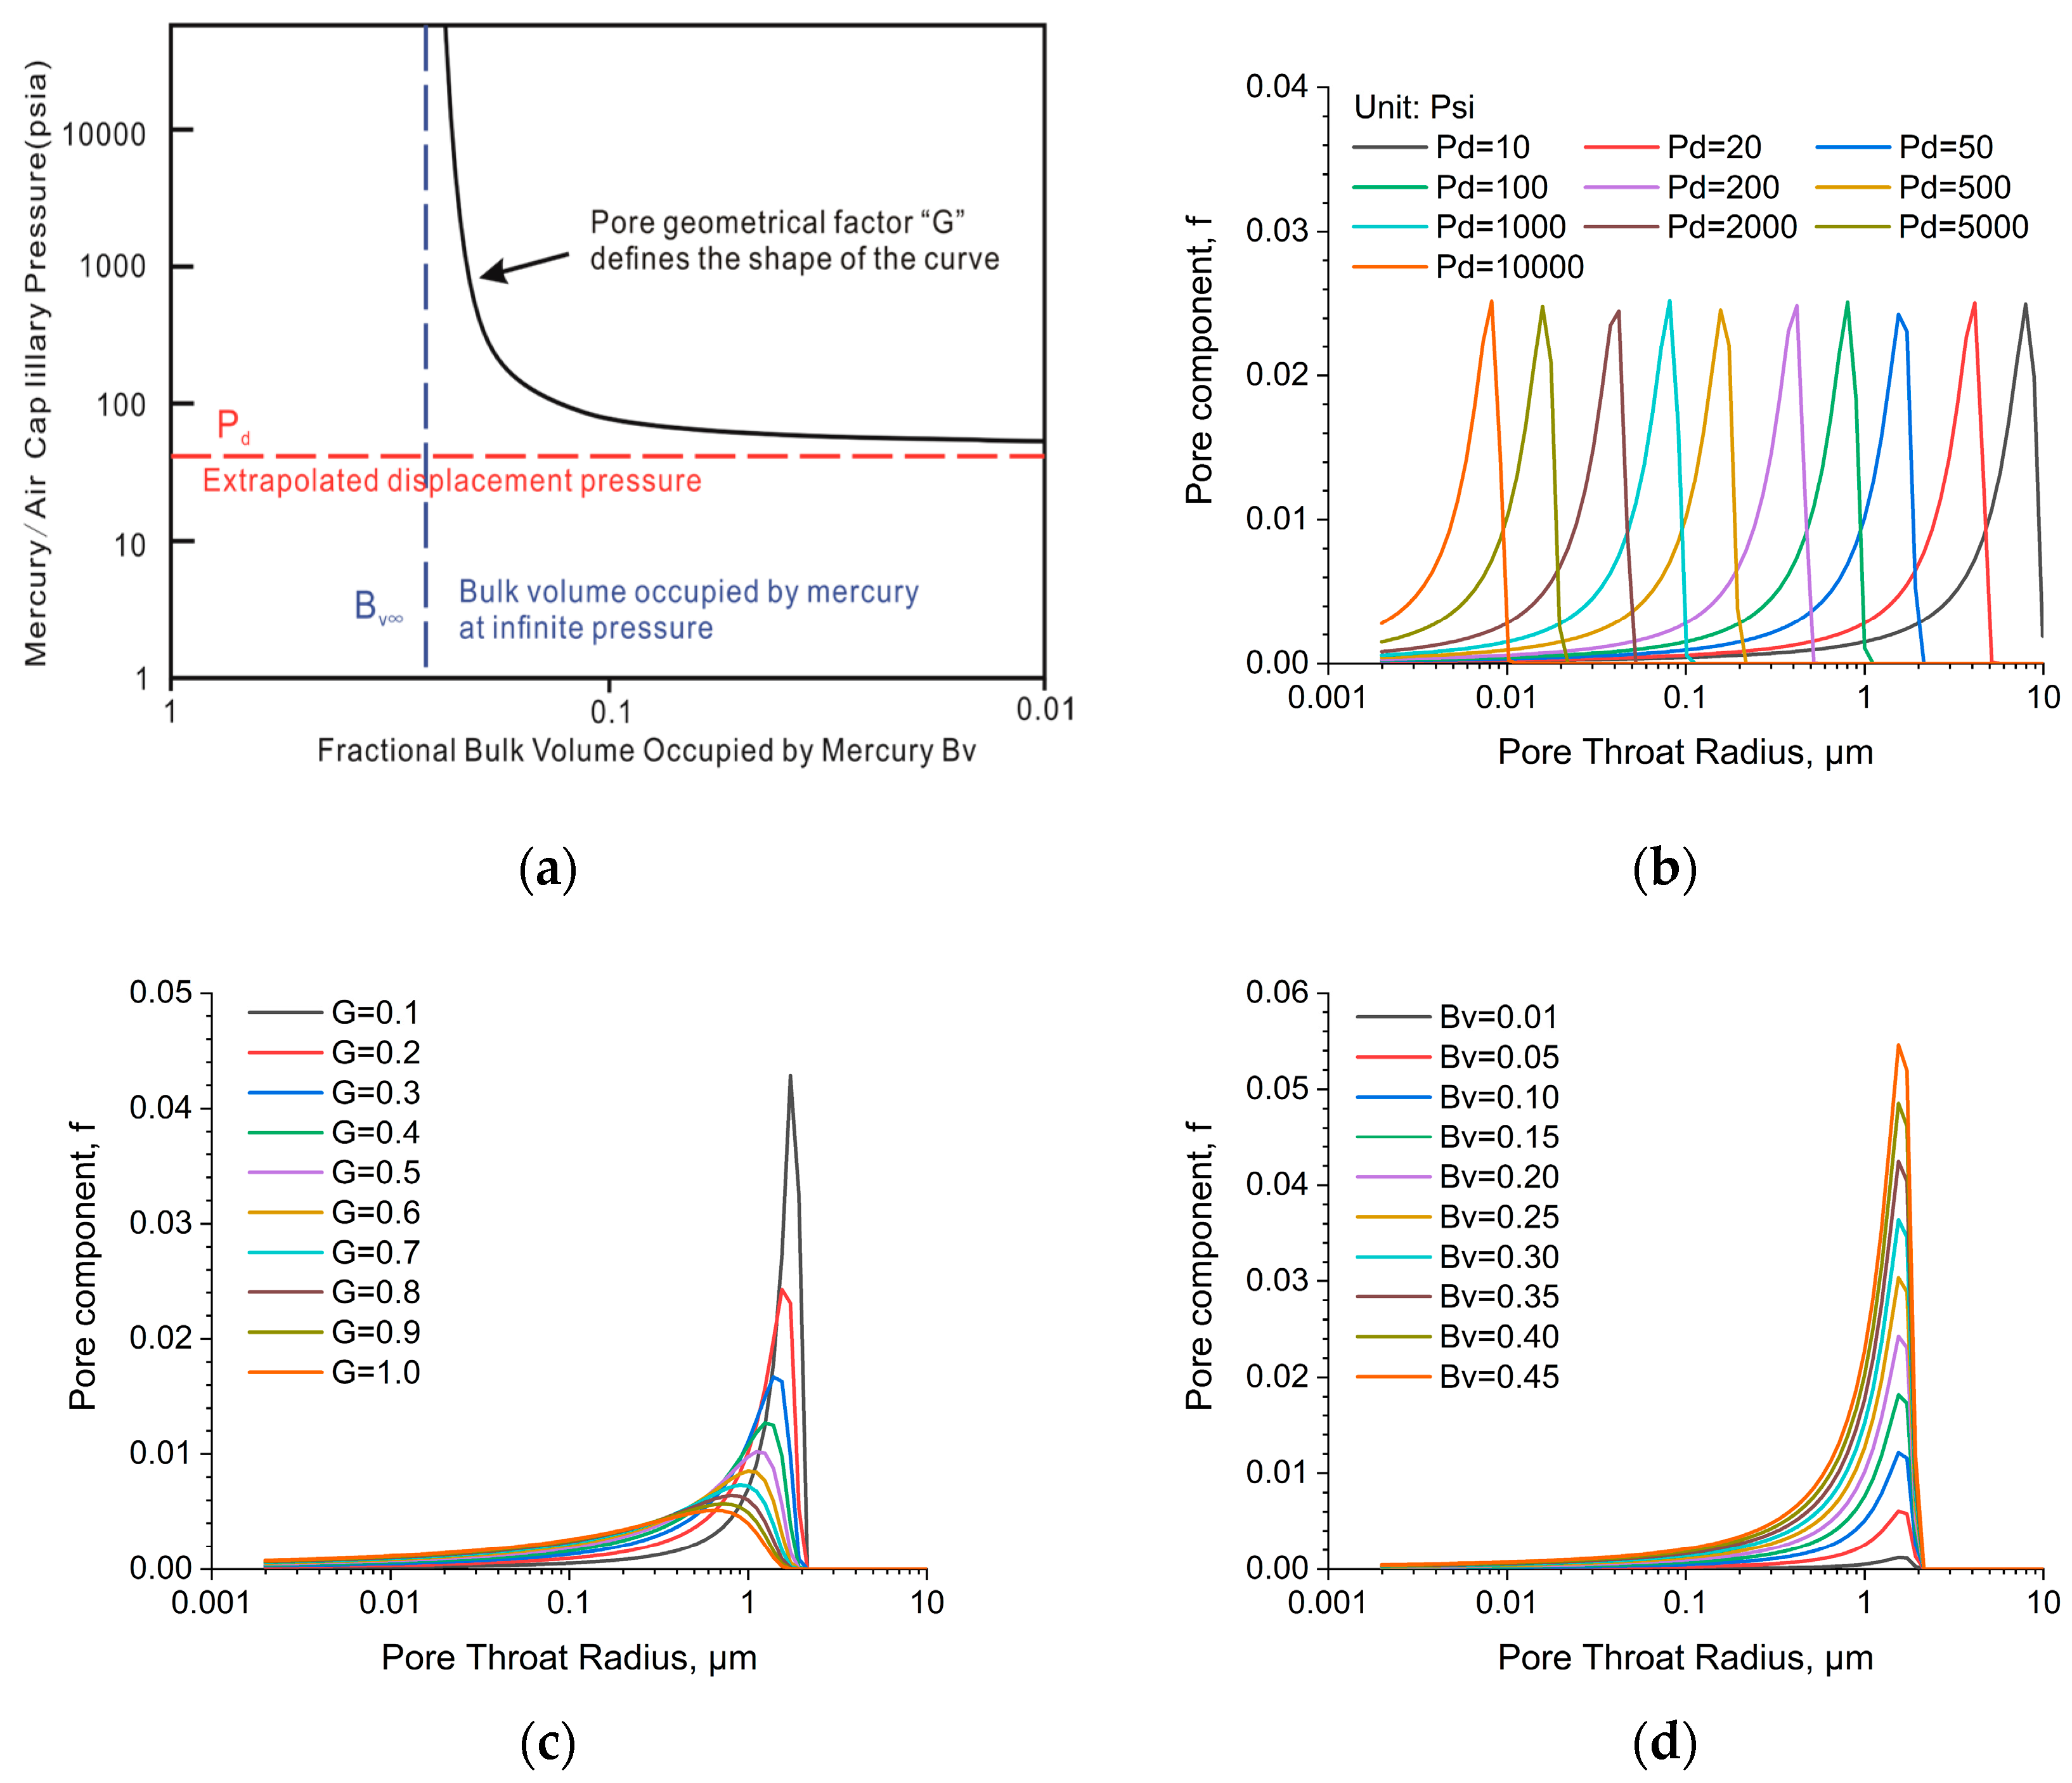
- Changing only the discharge pressure ( ); the larger the discharge pressure, the smaller the radius of the pore channel, indicating worse physical properties of the sample (Figure 8b).
- (2)
- Changing only the geometry factor ; the smaller G, the narrower the shape of the pore throat distribution curve, indicating that the pore channel is more concentrated and the sorting of rock samples is better (Figure 8c).
- (3)
- Changing only the maximum mercury feed volume ; the larger , the larger the pore volume, indicating better physical properties of rock samples (Figure 8d).
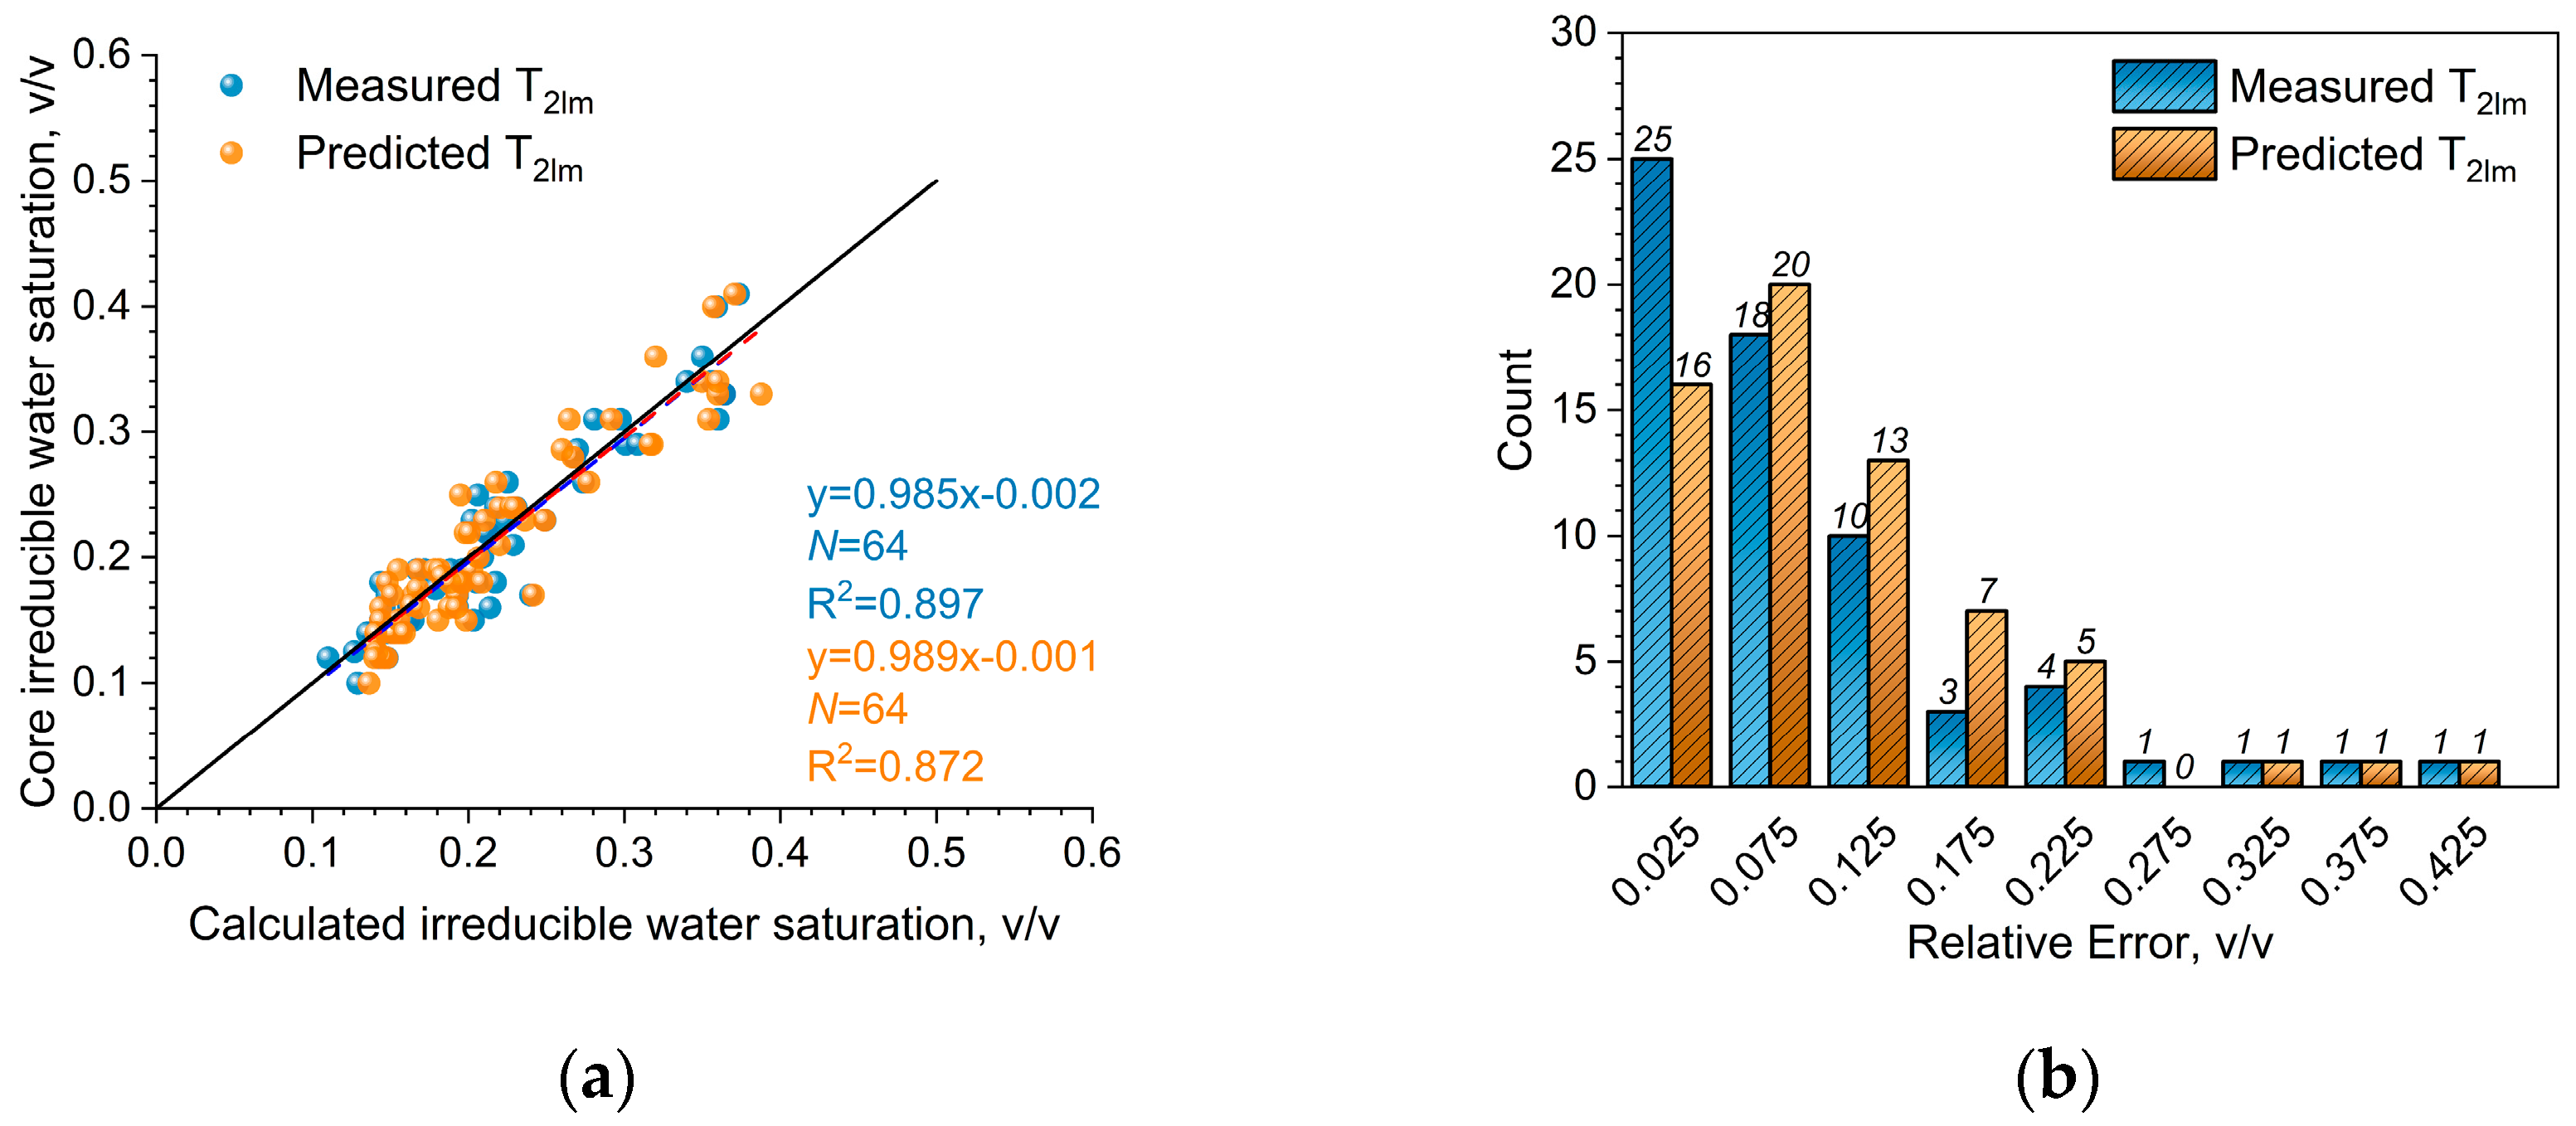
4.2.2. T2lm Inversion Based on Deep Learning Algorithm
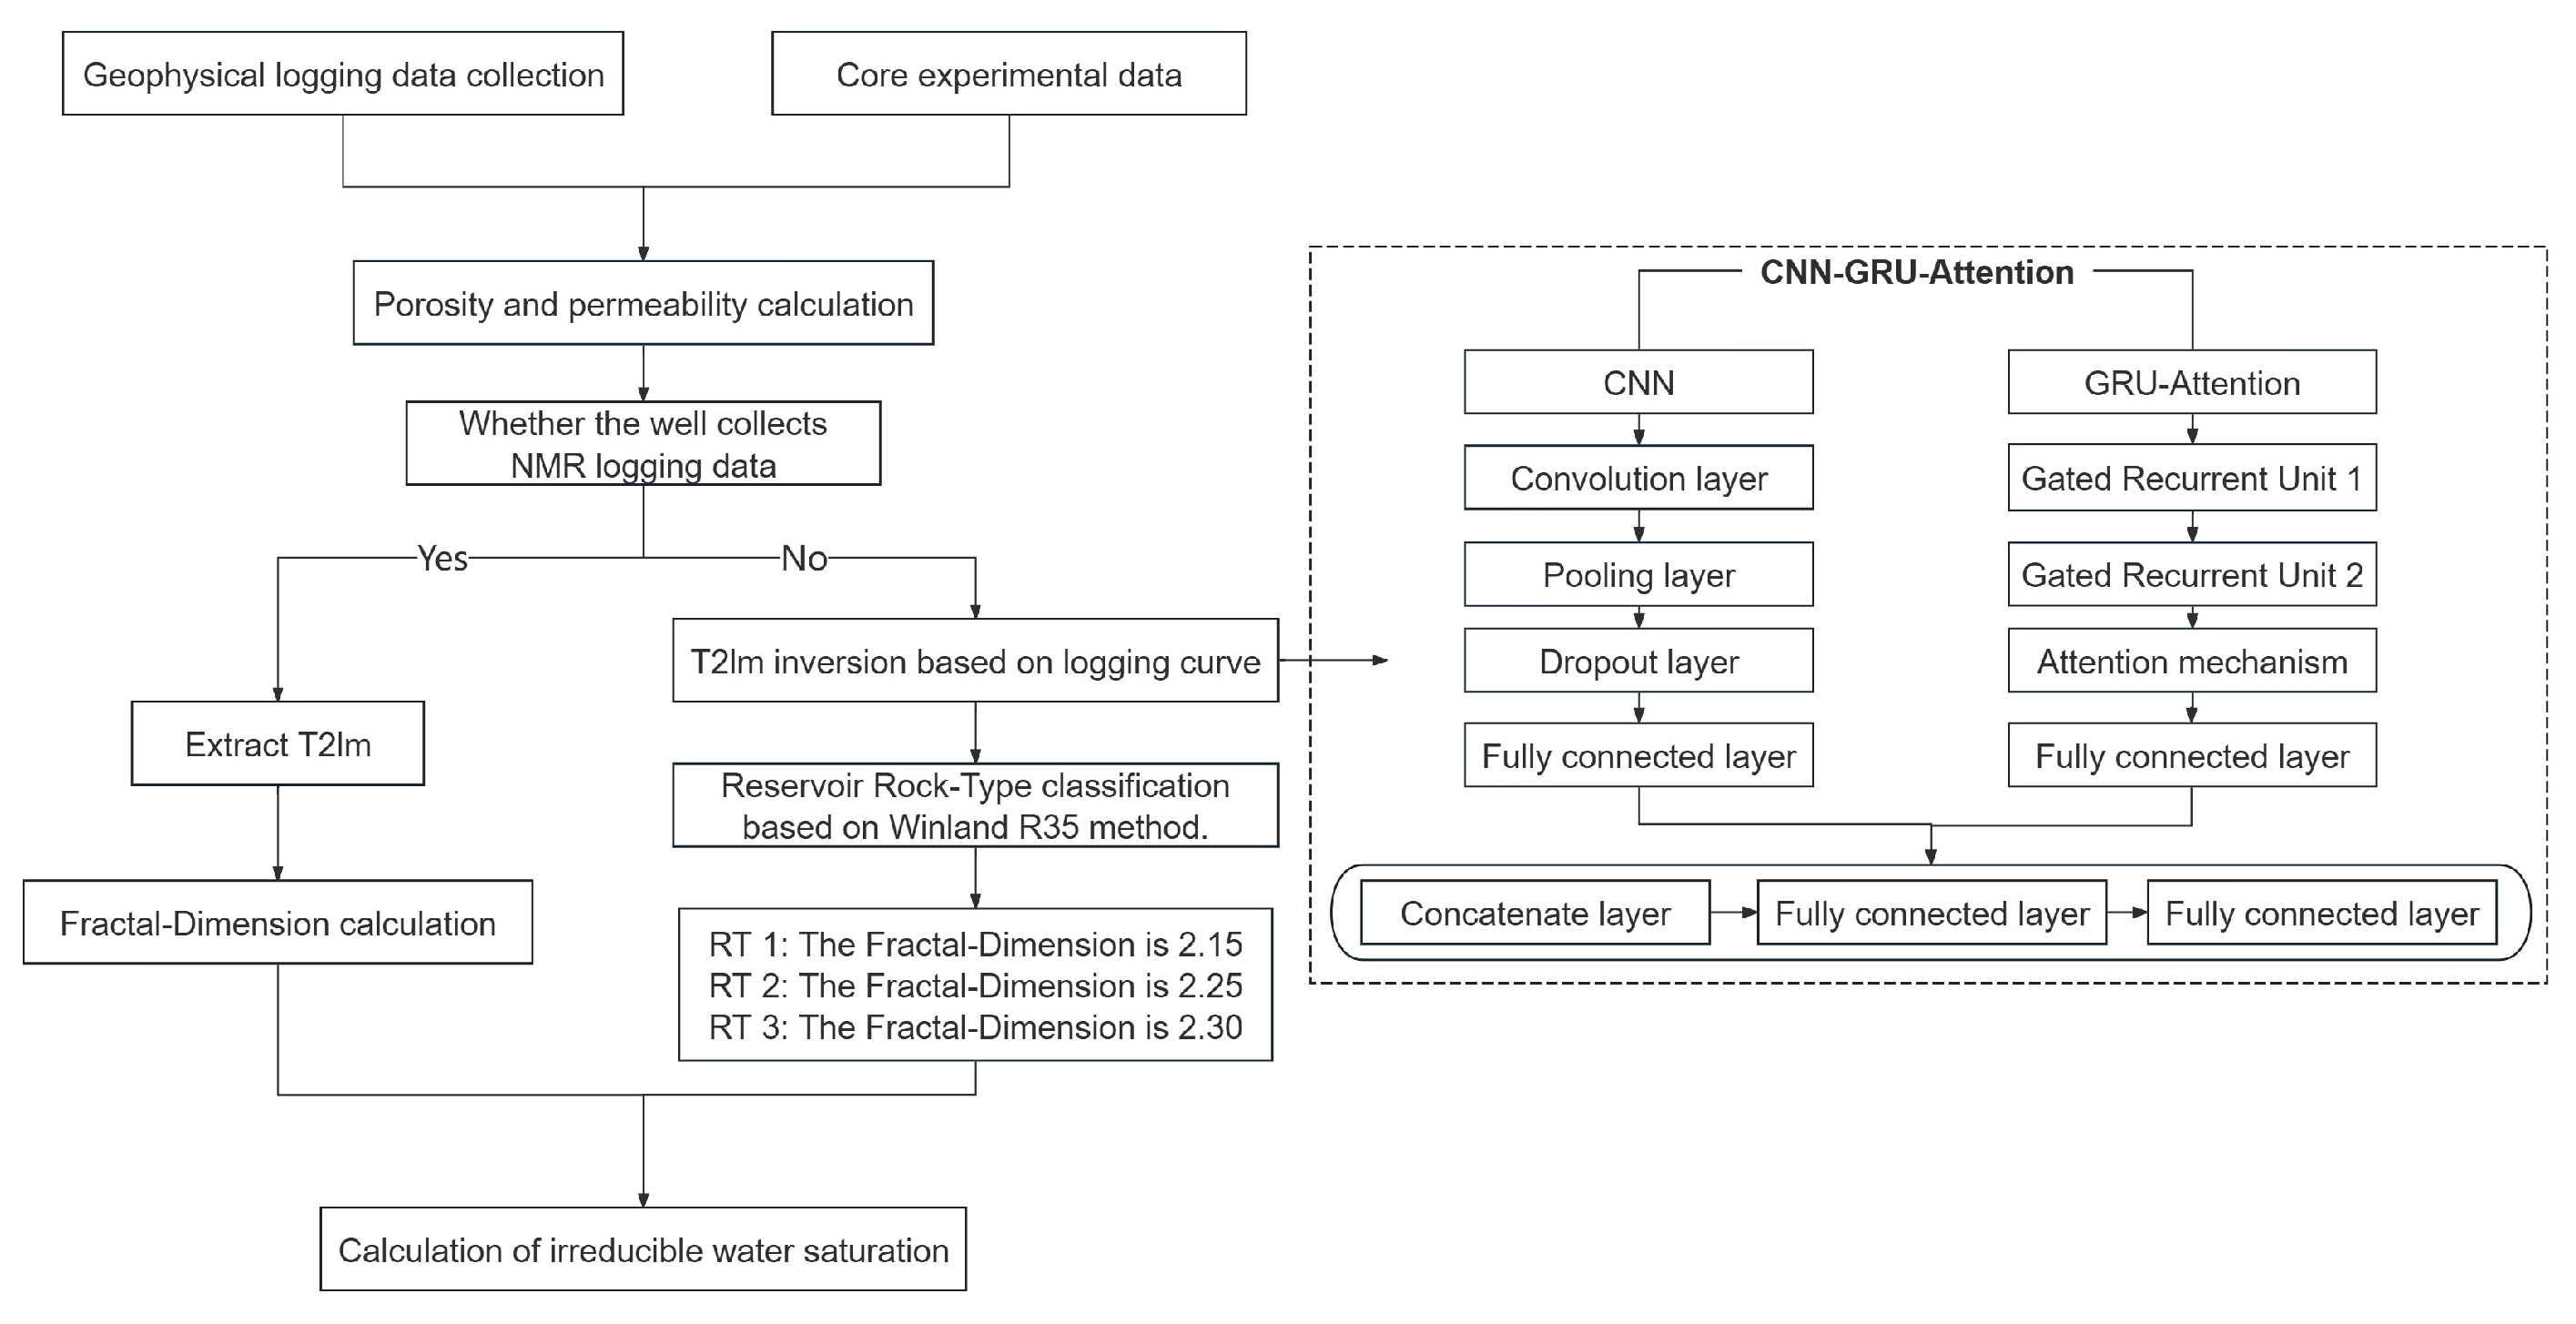
4.3. The Calculation Process of Irreducible Water Saturation
- If the borehole collects NMR logging data, extract T2lm from the T2 spectrum collected by the NMR logging instrument, calculate the fractal dimensions of each sample point, and ultimately calculate the irreducible water saturation.
- If the borehole did not collect NMR logging data, it is necessary to perform T2lm inversion based on the logging curve with the deep learning model, determine the fractal dimension for each type of reservoir using the Winland R35 method, and ultimately calculate the irreducible water saturation. This entire process considers both coring and production wells in the study area. Usually, the coring wells have a complete logging series and collect special logging series curves, while the production wells typically contain only conventional curves. The irreducible water evaluation method and process proposed in this paper take full account of this practical situation.
5. Results and Applications
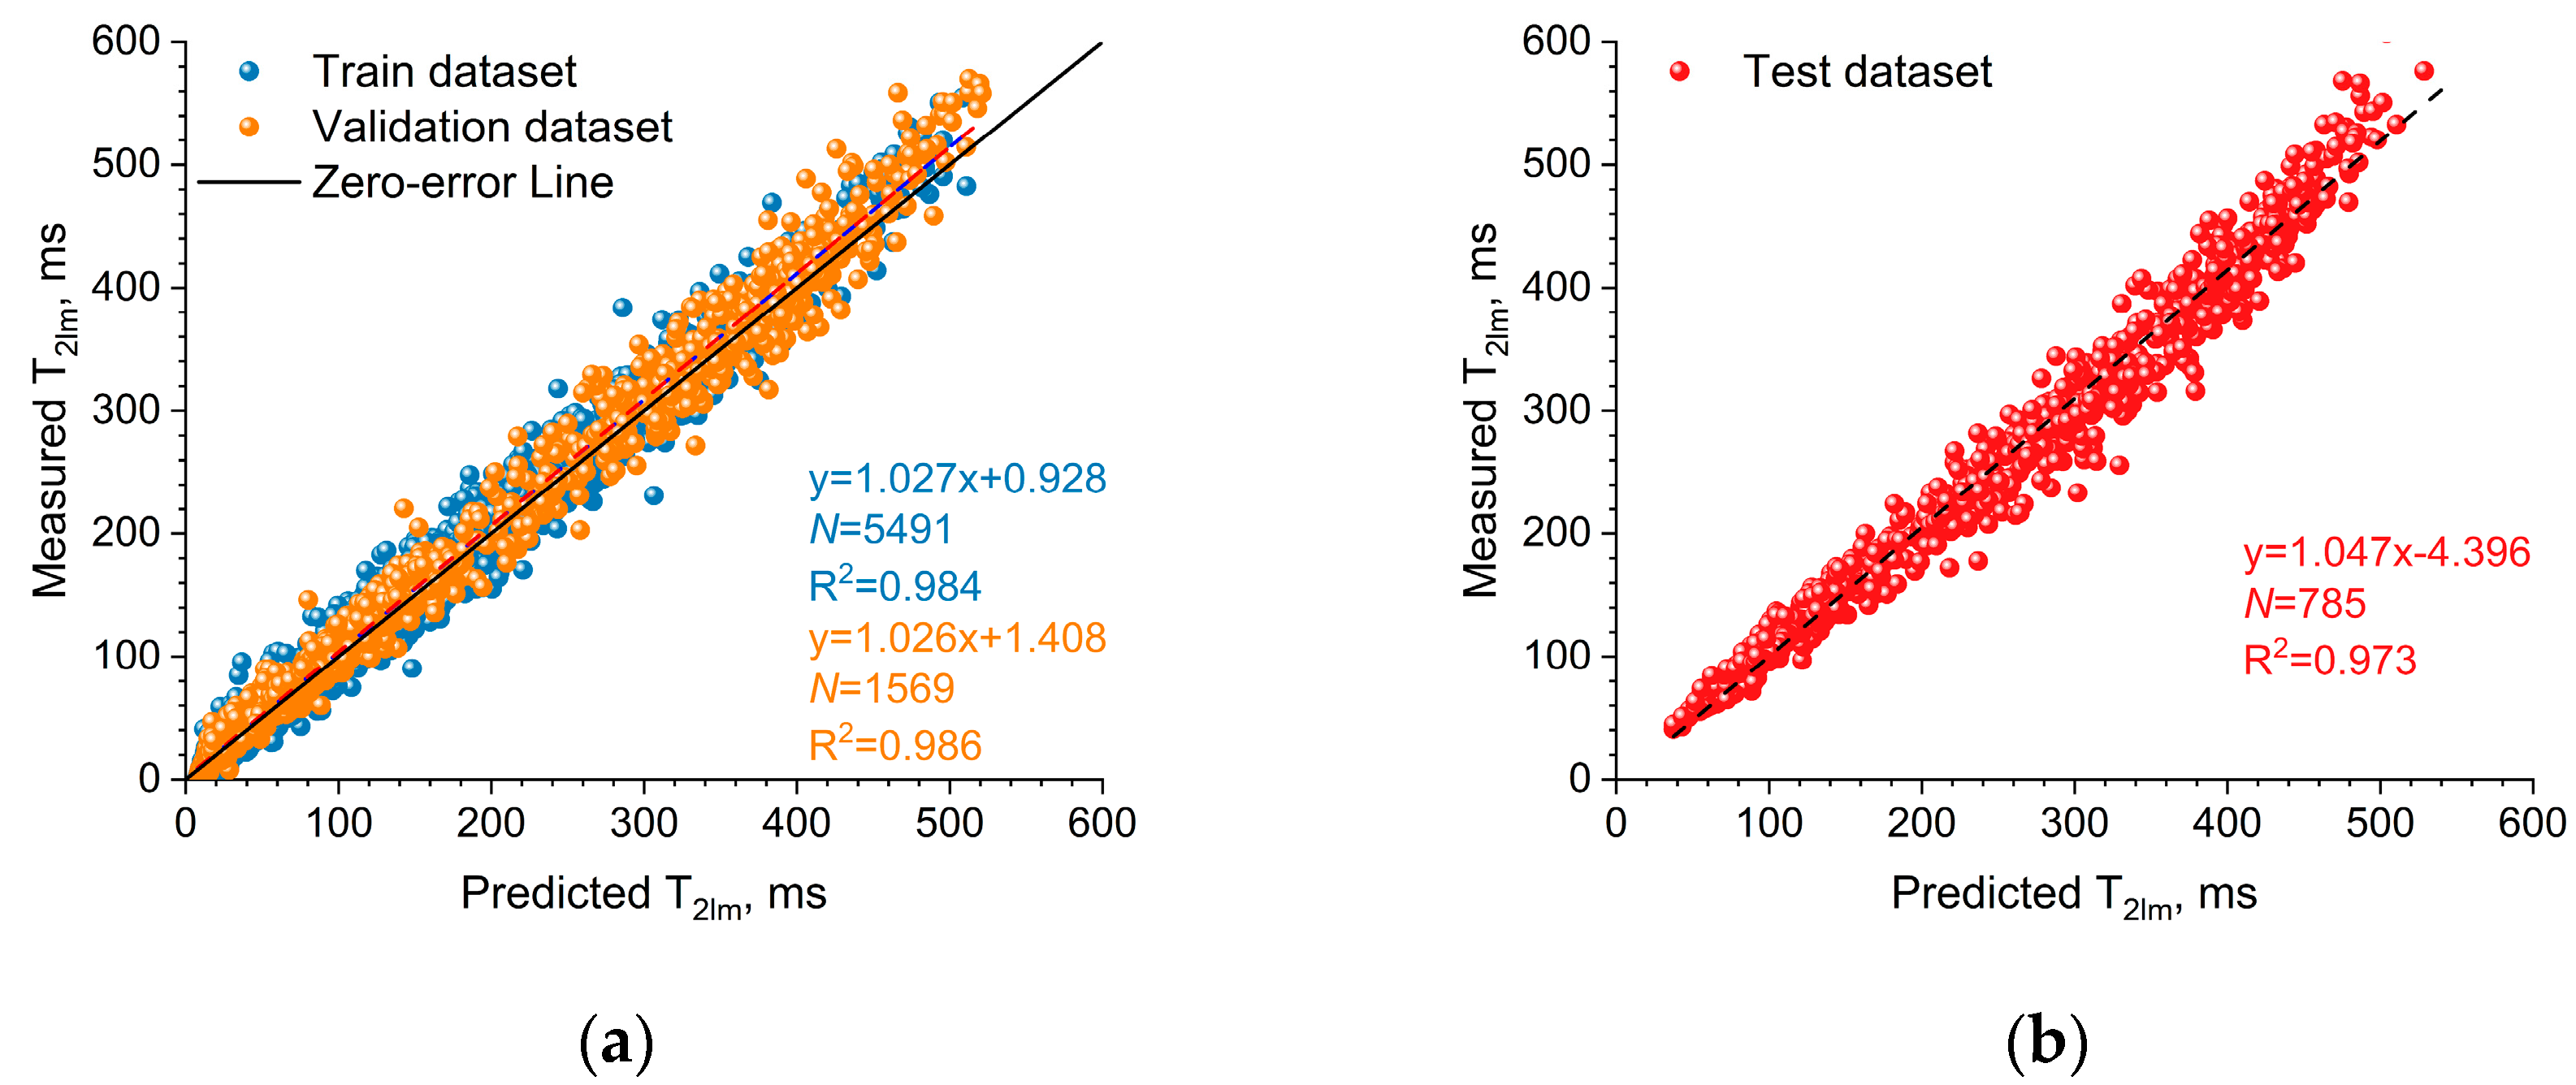
5.1. The Inversion Results of T2lm Curve
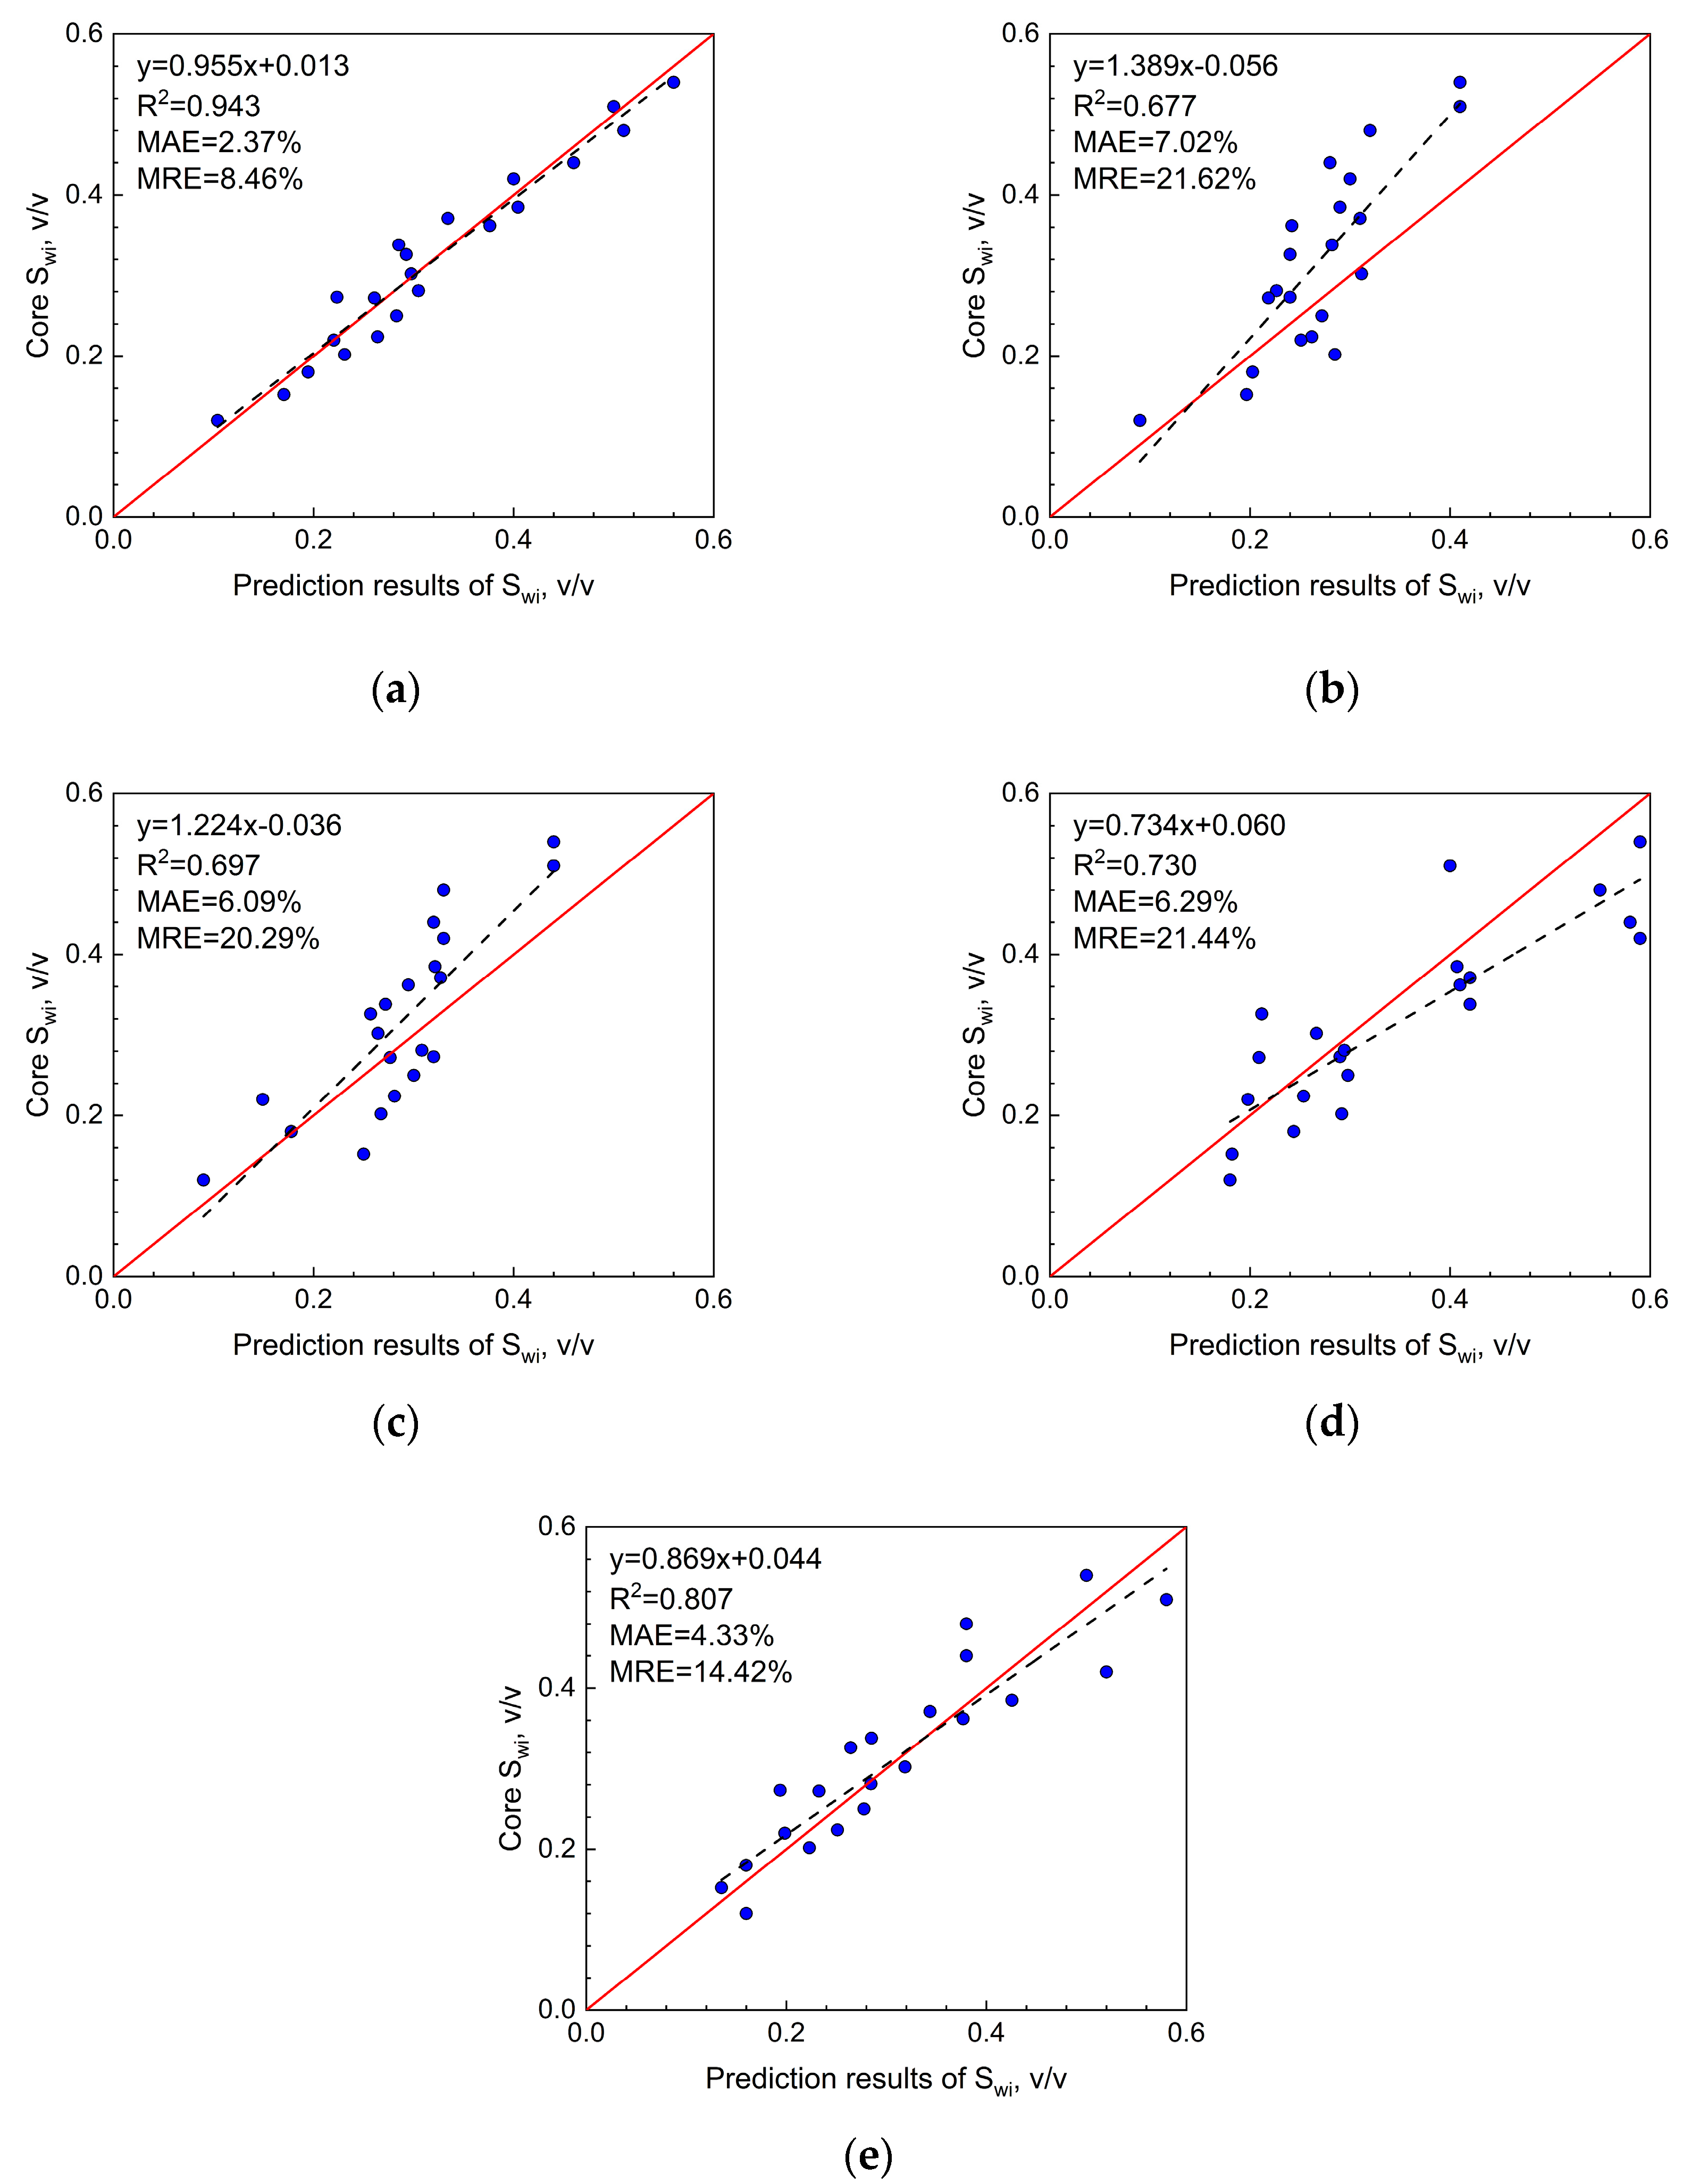
5.2. Evaluation Results and Application of Irreducible Water Saturation
6. Discussion
6.1. Methods Comparison
6.2. Limitations and Errors of the Method
7. Conclusions
- (1)
- The nuclear magnetic fractal permeability model effectively predicts irreducible water saturation.
- (2)
- A distinct numerical relationship exists between the modal parameter of pore throat diameter based on the Thomeer Function and T2lm. Utilizing fractal theory, this relationship clarifies the connection between each parameter and the physical property parameter in the Thomeer Function, thereby establishing the numerical association between T2lm and the Thomeer Function.
- (3)
- Employing deep learning, conventional logging curves, and derived parameter curves enables the effective inversion of the T2lm curve for evaluating irreducible water saturation. While the inverted T2lm curve exhibits a slightly higher relative error compared to that extracted from NMR logging data, it remains within an acceptable range, particularly valuable in the absence of NMR logging data. This method proves effective and feasible.
Author Contributions
Funding
Data Availability Statement
Acknowledgments
Conflicts of Interest
Appendix A
References
- Su, Y.; Fu, J.; Li, L.; Wang, W.; Zafar, A.; Zhang, M.; Ouyang, W. A new model for predicting irreducible water saturation in tight gas reservoirs. Petrol. Sci. 2020, 17, 1087–1100. [Google Scholar] [CrossRef]
- Gao, H.; Li, H.A. Pore structure characterization, permeability evaluation and enhanced gas recovery techniques of tight gas sandstones. J. Nat. Gas Sci. Eng. 2016, 28, 536–547. [Google Scholar] [CrossRef]
- Liu, D.; Yue, X.; Wang, L.; Hou, J.; Zhang, J. Model study on the irreducible water saturation by centrifuge experiments. J. Petrol. Sci. Eng. 2006, 53, 77–82. [Google Scholar] [CrossRef]
- Zhou, X.; Zhang, C.; Zhang, Z.; Zhang, R.; Zhu, L.; Zhang, C. A saturation evaluation method in tight gas sandstones based on diagenetic facies. Mar. Pet. Geol. 2019, 107, 310–325. [Google Scholar] [CrossRef]
- Zhu, L.; Ma, Y.; Cai, J.; Zhang, C.; Wu, S.; Zhou, X. Key factors of marine shale conductivity in southern China—Part II: The influence of pore system and the development direction of shale gas saturation models. J. Petrol. Sci. Eng. 2022, 209, 109516. [Google Scholar] [CrossRef]
- Neog, D. Effect of temperature on the pH of water flood effluents and irreducible water saturation: A study with reference to the Barail sandstone outcrop of the upper Assam Basin. J. Pet. Explor. Prod. Te. 2022, 12, 1–17. [Google Scholar] [CrossRef]
- Lai, F.; Li, Z.; Zhang, W.; Dong, H.; Kong, F.; Jiang, F. Investigation of pore characteristics and irreducible water saturation of tight reservoir using experimental and theoretical methods. Energy. Fuels. 2018, 32, 3368–3379. [Google Scholar] [CrossRef]
- Dong, X.; Sun, J.; Li, J.; Gao, H.; Liu, X.; Wang, J. Experimental research of gas shale electrical properties by NMR and the combination of imbibition and drainage. J. Geophys. Eng. 2015, 12, 610–619. [Google Scholar] [CrossRef]
- Liu, J.; Xie, R.; Guo, J.; Wei, H.; Fan, W.; Jin, G. Novel Method for Determining Irreducible Water Saturation in a Tight Sandstone Reservoir Based on the Nuclear Magnetic Resonance T2 Distribution. Energy Fuels 2022, 36, 11979–11990. [Google Scholar] [CrossRef]
- Sun, J.; Wang, K.; Li, W. Development and analysis of logging saturation interpretation models. Pet. Explor. Dev. 2008, 35, 107–113. [Google Scholar]
- Fu, X.; Qin, Y.; Wang, G.G.X.; Rudolph, V. Evaluation of coal structure and permeability with the aid of geophysical logging technology. Fuel 2009, 88, 2278–2285. [Google Scholar] [CrossRef]
- Morris, R.L.; Biggs, W.P. Using log-derived values of water saturation and porosity. In Proceedings of the SPWLA Annual Logging Symposium, Denver, Colorado, 12 June 1967; p. SPWLA-1967-X. [Google Scholar]
- Amaefule, J.O.; Altunbay, M.; Tiab, D.; Kersey, D.G.; Keelan, D.K. Enhanced reservoir description: Using core and log data to identify hydraulic (flow) units and predict permeability in uncored intervals/wells. In Proceedings of the SPE Annual Technical Conference and Exhibition, Houston, TX, USA, 3 October 1993; p. SPE-26436-MS. [Google Scholar]
- Arifianto, I.; Surjono, S.S.; Erlangga, G.; Abrar, B.; Yogapurana, E. Application of flow zone indicator and Leverett J-function to characterise carbonate reservoir and calculate precise water saturation in the Kujung formation, North East Java Basin. J. Geophys. Eng. 2018, 15, 1753–1766. [Google Scholar] [CrossRef]
- Lala, A.M.S.; El-Sayed, N.A.E.A. The application of petrophysics to resolve fluid flow units and reservoir quality in the Upper Cretaceous Formations: Abu Sennan oil field, Egypt. J. Afr. Earth Sci. 2015, 102, 61–69. [Google Scholar] [CrossRef]
- Mirzaei-Paiaman, A.; Ostadhassan, M.; Rezaee, R.; Saboorian-Jooybari, H.; Chen, Z. A new approach in petrophysical rock typing. J. Petrol. Sci. Eng. 2018, 166, 445–464. [Google Scholar] [CrossRef]
- Gao, C.; Yuan, Y.; Wu, H.; Li, H.; Hu, X. Research on the log evaluation method of irreducible water saturation in Yinggehai Basin. Nat. Gas. Ind. 2003, 5, 38–40+142. [Google Scholar]
- Taktak, F.; Rigane, A.; Boufares, T.; Kharbachi, S.; Bouaziz, S. Modelling approaches for the estimation of irreducible water saturation and heterogeneities of the commercial Ashtart reservoir from the Gulf of Gabès, Tunisia. J. Petrol. Sci. Eng. 2011, 78, 376–383. [Google Scholar] [CrossRef]
- Biswal, D.; Prasad, K.; Nedeer, N.; Lerdsuwankij, T.; Singh, K.H. Petrophysical modeling in the absence of core data in a small, marginal field in the Mumbai Offshore Basin, India. Interpretation 2021, 9, 1025–1038. [Google Scholar] [CrossRef]
- Lyu, C.; Ning, Z.; Cole, D.R.; Wang, Q.; Chen, M. Experimental investigation on T2 cutoffs of tight sandstones: Comparisons between outcrop and reservoir cores. J. Petrol. Sci. Eng. 2020, 191, 107184. [Google Scholar] [CrossRef]
- Xiao, L.; Li, J.; Mao, Z.; Lu, J.; Yu, H.; Guo, H.; Li, G. A method to determine nuclear magnetic resonance (NMR) T2cutoff based on normal distribution simulation in tight sandstone reservoirs. Fuel 2018, 225, 472–482. [Google Scholar] [CrossRef]
- Hossain, Z.; Grattoni, C.A.; Solymar, M.; Fabricius, I.L. Petrophysical properties of greensand as predicted from NMR measurements. Petrol. Geosci. 2011, 17, 111–125. [Google Scholar] [CrossRef]
- Straley, C.; Matteson, A.; Feng, S.; Schwartz, L.M.; Kenyon, W.E.; Banavar, J.R. Magnetic resonance, digital image analysis, and permeability of porous media. Appl. Phys. Lett. 1987, 51, 1146–1148. [Google Scholar] [CrossRef]
- Zhao, Y.; Lin, B.; Liu, T.; Zheng, Y.; Sun, Y.; Zhang, G.; Li, Q. Multifractal analysis of coal pore structure based on NMR experiment: A new method for predicting T2 cutoff value. Fuel 2021, 283, 119338. [Google Scholar] [CrossRef]
- Zhang, W.; Wan, J.; Wu, Y.; Qu, Y. Prediction of nuclear magnetic resonance (NMR) T2 cutoff based on multivariate statistical method. Nucl. Electron. Detect. Technol. 2020, 40, 193–199. [Google Scholar]
- Wu, F.; Sima, L.; Yang, H.; Ling, H.; Tian, C. Research on NMR T2 cutoff of complex lithology in the west Qaidam Basin. Well. Log. Technol. 2014, 38, 144–149. [Google Scholar]
- Wang, Y.; Tang, H.; Zheng, M.; Tian, G. The limitation of NMR to characterize the pore structure and irreducible water saturation of carbonate rocks: An experimental analysis. Mar. Orig. Pet. Geol. 2018, 23, 89–96. [Google Scholar]
- Kenyon, W.E.; Howard, J.J.; Sezginer, A.; Straley, C.; Matteson, A.; Horkowitz, K.; Ehrlich, R. Pore-size distribution and NMR in microporous cherty sandstones. In Proceedings of the SPWLA Annual Logging Symposium, Denver, CO, USA, 11 June 1989; p. SPWLA-1989-LL. [Google Scholar]
- Coates, G.R.; Galford, J.; Mardon, D.; Marschall, D. A new characterization of bulk-volume irreducible using magnetic resonance. Log. Anal. 1998, 39, 51–63. [Google Scholar]
- Zhu, L.; Zhang, C.; Shi, W.; Chen, Y.; Liu, J.; Guo, C.; Cheng, Y. Study on the method of prediction of irreducible water saturation by combining mercury intrusion and NMR logging data. Sci. Technol. Eng. 2016, 16, 22–29. [Google Scholar]
- Li, Y.; Zhang, Z.; Hu, S.; Zhou, X.; Guo, J.; Zhu, L. Evaluation of irreducible water saturation by electrical imaging logging based on capillary pressure approximation theory. Geoenergy Sci. Eng. 2023, 224, 211592. [Google Scholar] [CrossRef]
- Zhu, L.; Zhang, C.; Zhang, C.; Zhang, Z.; Nie, X.; Zhou, X.; Liu, W.; Wang, X. Forming a new small sample deep learning model to predict total organic carbon content by combining unsupervised learning with semisupervised learning. Appl. Soft Comput. 2019, 83, 105596. [Google Scholar] [CrossRef]
- Gao, J.; Tian, C.; Zhang, W.; Song, X.; Liu, B. Characteristics and genesis of carbonate reservoir of the Mishrif Formation in the Rumaila oil field, Iraq. Acta Pet. Sin. 2013, 34, 843–852. [Google Scholar]
- Zhang, M.; Qiao, Z.; Gao, J.; Zhu, Y.; Sun, W. Characteristics and evaluation of carbonate reservoirs in restricted platform in the MB1-2 Sub-Member of Mishrif formation, Halfaya oilfield, Iraq. J. Northeast Pet. Univ. 2020, 44, 35–45. [Google Scholar]
- Alsharhan, A.; Nairn, A. A review of the Cretaceous formations in the Arabian Peninsula and Gulf: Part I. Lower Cretaceous (Thamama Group) stratigraphy and paleogeography. J. Pet. Geol. 1986, 9, 365–391. [Google Scholar] [CrossRef]
- Alsharhan, A.; Nairn, A. A review of the ctretaceous formations in the Arabian Peninsula and gulf: Part II. Mid-cretaceous (Wasia Group) stratigraphy and paleogeography. J. Pet. Geol. 1988, 11, 89–112. [Google Scholar] [CrossRef]
- Sadooni, F.; Alsharhan, A. Stratigraphy, microfacies, and petroleum potential of the Mauddud Formation (Albian-Cenomanian) in the Arabian Gulf basin. AAPG Bull. 2003, 87, 1653–1680. [Google Scholar] [CrossRef]
- Timur, A. An investigation of permeability, porosity, and residual water saturation relationships. In Proceedings of the SPWLA Annual Logging Symposium, New Orleans, LA, USA, 23 June 1968; p. SPWLA-1968-J. [Google Scholar]
- Coates, G.R.; Xiao, L.; Prammer, M.G. NMR logging. In Principles and Interpretation; Halliburton Energy Service: Huston, TX, USA, 1999. [Google Scholar]
- Kenyon, W.E.; Day, P.I.; Straley, C.; Willemsen, J.F. A three-part study of NMR longitudinal relaxation properties of water-saturated sandstones. SPE Form. Eval. 1988, 3, 622–636. [Google Scholar] [CrossRef]
- Morriss, C.E.; Maclnnis, J.; Freedman, R.; Smaardyk, J.; Straley, C.; Kenyon, W.E.; Vinegar, H.J.; Tutunjian, P.N. Field test of an experimental pulsed nuclear magnetism tool. In Proceedings of the SPWLA Annual Logging Symposium, Calgary, AB, Canada, 13 June 1993; p. SPWLA-1993-GGG. [Google Scholar]
- Wu, F.; Li, Y.; Burnham, B.; Zhang, Z.; Yao, C.; Yuan, L.; Zhang, F.; Deng, H.; Xi, Y.; He, J. Fractal-based NMR permeability estimation in tight sandstone: A case study of the Jurassic rocks in the Sichuan Basin, China. J. Petrol. Sci. Eng. 2022, 218, 110940. [Google Scholar] [CrossRef]
- Mandelbrot, B.B.; Passoja, D.E.; Paullay, A.J. Fractal Character of Fracture Surfaces of Metals. Nature 1984, 308, 721–722. [Google Scholar] [CrossRef]
- Brooks, R.H.; Corey, A.T. Hydraulic Properties of Porous Media; Hydrology Paper; Colorado State University: Fort Collins, CO, USA, 1964; pp. 3–27. [Google Scholar]
- He, T.; Zhou, Y.; Chen, Z.; Zhang, Z.; Xie, H.; Shang, Y.; Cui, G. Fractal Characterization of the Pore-Throat Structure in Tight Sandstone Based on Low-Temperature Nitrogen Gas Adsorption and High-Pressure Mercury Injection. Fractal Fract. 2024, 8, 356. [Google Scholar] [CrossRef]
- Geological Applications of Capillary Pressure: A Review1|AAPG Bulletin|GeoScienceWorld. Available online: https://pubs.geoscienceworld.org/aapgbull/article/76/6/840/38801/Geological-Applications-of-Capillary-Pressure-A (accessed on 1 June 1992).
- Lai, J.; Wang, G. Fractal Analysis of Tight Gas Sandstones Using High-Pressure Mercury Intrusion Techniques. J. Nat. Gas Sci. Eng. 2015, 24, 185–196. [Google Scholar] [CrossRef]
- Dullien, F.A.L. Porous Media: Fluid Transport and Pore Structure; Academic Press, Department of Chemical Engineering, University of Waterloo: Waterloo, ON, Canada, 2012. [Google Scholar]
- Han, Y.; Zhang, C.; Zhang, Z.; Zhang, H.; Chen, L. Pore structure classification and logging evaluation method for carbonate reservoirs: A case study from an oilfield in the Middle East. Energy Source Part A 2019, 41, 1701–1715. [Google Scholar] [CrossRef]
- Cheng, Y.; Zhang, C.; Zhu, L. A fractal irreducible water saturation model for capillary tubes and its application in tight gas reservoir. J. Petrol. Sci. Eng. 2017, 159, 731–739. [Google Scholar] [CrossRef]
- Zhang, C.; Cheng, Y.; Zhang, C. An improved method for predicting permeability by combining electrical measurements and mercury injection capillary pressure data. J. Geophys. Eng. 2017, 14, 132–142. [Google Scholar] [CrossRef]
- Tang, X.; Zhou, W.; Yang, W.; Zhang, C.; Zhang, C. An improved method in petrophysical rock typing based on mercury-injection capillary pressure data. Energy Source Part A 2020, 2020, 1–16. [Google Scholar] [CrossRef]
- Martin, A.J.; Solomon, S.T.; Hartmann, D.J. Characterization of petrophysical flow units in carbonate reservoirs. AAPG Bull. 1997, 81, 734–759. [Google Scholar]
- Thomeer, J.H.M. Introduction of a pore geometrical factor defined by the capillary pressure curve. J. Pet. Technol. 1960, 12, 73–77. [Google Scholar] [CrossRef]
- Chen, X.; Zhang, C.; Zhu, L.; Zhang, C.; Zhang, Z.; Guo, J. Evaluation of the saturation of carbonate reservoirs by combining the nuclear magnetic resonance logging and the Thomeer model. Geophys. Geochem. Explor. 2023, 47, 110–119. [Google Scholar]
- Chen, L.; Jiang, Z.; Liu, Q.; Jiang, S.; Liu, K.; Tan, J.; Gao, F. Mechanism of shale gas occurrence: Insights from comparative study on pore structures of marine and lacustrine shales. Mar. Pet. Geol. 2019, 104, 200–216. [Google Scholar] [CrossRef]
- Mei, P.; Li, M.; Zhang, Q.; Li, G.; Song, L. Prediction model of drinking water source quality with potential industrial-agricultural pollution based on CNN-GRU-Attention. J. Hydrol. 2022, 610, 127934. [Google Scholar] [CrossRef]
- Wang, Y.; Sun, Y.; Liu, Z.; Sarma, S.E.; Bronstein, M.M.; Solomon, J.M. Dynamic graph cnn for learning on point clouds. ACM T Graphic. 2019, 38, 1–12. [Google Scholar] [CrossRef]
- Das, V.; Pollack, A.; Wollner, U.; Mukerji, T. Convolutional neural network for seismic impedance inversion. Geophysics 2019, 84, 869–880. [Google Scholar] [CrossRef]
- Jiao, R.; Huang, X.; Ma, X.; Han, L.; Tian, W. A model combining stacked auto encoder and back propagation algorithm for short-term wind power forecasting. IEEE Access. 2018, 6, 17851–17858. [Google Scholar] [CrossRef]
- Chen, T.; Gao, G.; Liu, H.; Li, Y.; Gui, Z.; Yu, Z.; Zhai, X. Rock brittleness index inversion method with constraints of seismic and well logs via a CNN-GRU fusion network based on the spatiotemporal attention mechanism. Geoenergy Sci. Eng. 2023, 225, 211646. [Google Scholar] [CrossRef]
- Li, N.; Xu, B.; Wu, H.; Feng, Z.; Li, Y.; Wang, K.; Liu, P. Application status and prospects of artificial intelligence in well logging and formation evaluation. Acta Pet. Sin. 2021, 42, 508. [Google Scholar]
- Sabour, S.; Frosst, N.; Hinton, G.E. Dynamic routing between capsules. Adv. Neural Inf. Process. Syst. 2017, 30, 1–11. [Google Scholar]
- Buckles, R.S. Correlating and averaging connate water saturation data. J. Can. Petrol. Technol. 1965, 4, 42–52. [Google Scholar] [CrossRef]
- Fordham, E.J.; Kenyon, W.E.; Ramakrishnan, T.S.; Schwartz, L.M.; Wilkinson, D.J. Forward models for nuclear magnetic resonance in carbonate rocks. Log Anal. 1999, 40, SPWLA-1999-v40n4a1. [Google Scholar]
- Wang, H.; Kou, Z.; Bagdonas, D.A.; Phillips, E.H.W.; Alvarado, V.; Johnson, A.C.; Jiao, Z.; McLaughlin, J.F.; Quillinan, S.A. Multiscale petrophysical characterization and flow unit classification of the Minnelusa eolian sandstones. J. Hydrol. 2022, 607, 127466. [Google Scholar] [CrossRef]
- Bai, Z.; Tan, M.; Li, G.; Shi, Y. Analysis of low-resistivity oil pay and fluid typing method of Chang 81 Member, Yanchang Formation in Huanxian area, Ordos Basin, China. J. Petrol. Sci. Eng. 2019, 175, 1099–1111. [Google Scholar] [CrossRef]
- Ren, X.; Zhao, Y.; Deng, Q.; Kang, J.; Li, D.; Wang, D. A relation of hydraulic conductivity—Void ratio for soils based on Kozeny-Carman equation. Eng. Geol. 2016, 213, 89–97. [Google Scholar] [CrossRef]


| Method Type | Specific Methods | Advantages | Disadvantages | References |
|---|---|---|---|---|
| Core experiment | Mercury injection capillary pressure experiment | High accuracy | High costs, poor generalization | [7,8,9] |
| Semi-permeable membrane technique | ||||
| Nuclear magnetic resonance testing | ||||
| Phase infiltration testing | ||||
| Conventional logging method | Physical property parameter fitting method | Strong generalization, cost-effective | Low precision | [12,13] |
| Division of flow unit construction model method | Raises the accuracy, cost-effective | Non-uniform division standards | [14,15] | |
| Physical model method | Strong anti-interference ability, cost-effective | Low precision, high operation complexity | [18,19] | |
| Special logging method | Nuclear magnetic resonance logging method | Theoretically strong, diversified forms, high recognition | Difficult to promote, high costs, destabilization | [21,22,23,24,25,26,29,30] |
| Imaging logging method | Theoretically strong, moderate cost performance | Difficult to promote, poor feasibility | [31] |
| Coefficient Value | |||
|---|---|---|---|
| 0.034 | 0.607 | −0.256 | 0.903 |
| (16) | |||
| Layer | Parameters | Value |
|---|---|---|
| CNN Layer | Number of Convolutional Kernels | 32 |
| Convolutional Kernel Size | 3 × 3 | |
| Activation Function of Convolutional Layer | ReLu | |
| Padding Method of Convolutional Layer | Valid | |
| Pooling Layer Pooling Window Size | 2 × 2 | |
| Pooling Layer Activation Function | ReLu | |
| Dropout Rate | 0.3 | |
| GRU Layer | Number of Hidden Neurons | 10 |
| Number of Hidden Neurons | 20 | |
| Attention | Dimensionality | 50 |
| Output Layer | Dense1 | 10 |
| (Fully Connected Layer) | Dense2 | 1 |
Disclaimer/Publisher’s Note: The statements, opinions and data contained in all publications are solely those of the individual author(s) and contributor(s) and not of MDPI and/or the editor(s). MDPI and/or the editor(s) disclaim responsibility for any injury to people or property resulting from any ideas, methods, instructions or products referred to in the content. |
© 2024 by the authors. Licensee MDPI, Basel, Switzerland. This article is an open access article distributed under the terms and conditions of the Creative Commons Attribution (CC BY) license (https://creativecommons.org/licenses/by/4.0/).
Share and Cite
Guo, J.; Zhang, Z.; Nie, X.; Zhao, Q.; Lv, H. Logging Evaluation of Irreducible Water Saturation: Fractal Theory and Data-Driven Approach—Case Study of Complex Porous Carbonate Reservoirs in Mishrif Formation. Fractal Fract. 2024, 8, 487. https://doi.org/10.3390/fractalfract8080487
Guo J, Zhang Z, Nie X, Zhao Q, Lv H. Logging Evaluation of Irreducible Water Saturation: Fractal Theory and Data-Driven Approach—Case Study of Complex Porous Carbonate Reservoirs in Mishrif Formation. Fractal and Fractional. 2024; 8(8):487. https://doi.org/10.3390/fractalfract8080487
Chicago/Turabian StyleGuo, Jianhong, Zhansong Zhang, Xin Nie, Qing Zhao, and Hengyang Lv. 2024. "Logging Evaluation of Irreducible Water Saturation: Fractal Theory and Data-Driven Approach—Case Study of Complex Porous Carbonate Reservoirs in Mishrif Formation" Fractal and Fractional 8, no. 8: 487. https://doi.org/10.3390/fractalfract8080487
APA StyleGuo, J., Zhang, Z., Nie, X., Zhao, Q., & Lv, H. (2024). Logging Evaluation of Irreducible Water Saturation: Fractal Theory and Data-Driven Approach—Case Study of Complex Porous Carbonate Reservoirs in Mishrif Formation. Fractal and Fractional, 8(8), 487. https://doi.org/10.3390/fractalfract8080487