Abstract
The traditional Langmuir equation displays drawback in accurately characterizing the methane adsorption behavior in coal, due to it assuming the uniform surface of coal pores. Additionally, the decay law of gas adsorption capacity with an increasing coal reservoir temperature remains unknown. In this study, the fractal adsorption model is proposed based on the fractal dimension (Df) of coal pores and the attenuation coefficient (n) of the adsorption capacity. The principles and methods of this fractal adsorption model are deduced and summarized in detail. The results show that the pore structures of the two coal samples exhibit obvious fractal characteristics, with the values of fractal dimensions (Df) being 2.6279 and 2.93. The values of adsorption capacity attenuation coefficients (n) are estimated as −0.006 and −0.004 by the adsorption experiments with different temperatures. The proposed fractal adsorption model presents a greater theoretical significance and higher accuracy than that of the Langmuir equation. The accuracy of the fractal adsorption model with temperature effect dependence is verified, establishing a prediction method for methane adsorption capacity in deep coal reservoirs. This study can serve as a theoretical foundation for coalbed methane exploration and development, as well as provide valuable insights for unconventional natural gas exploitation.
1. Introduction
Coalbed methane (CBM) is the gas associated with the process of coal generation and metamorphism, primarily existing in the pore space of coal seams in an adsorbed state [,,]. The traditional Langmuir adsorption equation is a classical model for characterizing the adsorption behavior of methane in coal. Accordingly, the Langmuir equation is widely applied in investigations into factors influencing methane adsorption in coal [,], calculations of critical desorption pressure and gas saturation [], and predictions regarding CBM-rich areas and estimations of CBM resources [,,].
Coal as a heterogeneous porous medium exhibits complex pore structures and obvious fractal characteristics [,,]. The adsorption capacity of methane in coal is largely affected by the pore structure parameters, including specific surface area, volume, distribution, and size [,,]. Wang conducted a study on the isothermal and kinetic adsorption processes of three sorbents on activated carbon. To elucidate the kinetic mechanism of adsorbent molecules on fractal particle surfaces, they established a relationship between the fractal dimension and cross-sectional area of adsorbed gas molecules, thereby verifying the fractal characteristics of activated carbon []. Karacan and Okandan utilized CT imaging technology to investigate the fractal dimensions of different ranks of coal. The results indicated that higher fractal dimensions corresponded to stronger methane adsorption capacities []. Lu analyzed the fractal characteristics of middle-rank structural deformation coal and explored the applicability of various pore-fractal models, such as the Sierpinski model, Frenkel–Halsey–Hill model, and Menger model, for adsorption and seepage purposes. Additionally, they investigated how these models respond to tectonic deformations in coal [].
The present studies indicate that the Langmuir adsorption model is not accurate in quantitatively characterizing the adsorption behavior of coal’s heterogeneous pore structures [,]. Hall et al. utilized the volume method to measure methane, nitrogen, carbon dioxide, and their binary mixed gases’ adsorption isotherm data on water-containing coal samples, respectively []. They used experimental data to evaluate ideal solution gas adsorption models, the two-dimensional equation of state models, and extended Langmuir adsorption models. It was found that these models were biased to varying degrees. Saad Alafnan discussed the applicability and limitations of Langmuir adsorption isotherms in CBM resource estimation and pointed out that the theoretical hypothesis of Langmuir equations describing the adsorption behavior of coal was insufficient []. In addition, the reservoir temperature also plays a crucial role in influencing the storage and migration of coalbed methane []. As temperature increases, thermal expansion, cracking, and stress occur within the coal matrix, leading to alterations in its pore structure [,], thereby impeding methane molecule adsorption [,,]. Numerous studies have confirmed that rising temperatures can inhibit methane adsorption capacity [,,]. Based on the above analysis, a fractal adsorption model on methane in coal with temperature effect dependence is worth exploring, which is conducive to understanding the mechanism of methane adsorption in coal and enhancing the prediction accuracy of methane adsorption in deep coal seams.
In this study, the coal samples from Caiyuan Mine and Xiqu Mine in Shandong and Shanxi provinces of China were selected as the research subjects. The adsorption isotherms and fractal dimensions of these coal samples were determined through the weight method isothermal adsorption experiment and liquid nitrogen adsorption experiment. A fractal adsorption model, considering the temperature effect, was established. The theoretical equation of the new model was derived in detail, and its accuracy was verified. Based on this, a method for estimating methane adsorption in deep coalbed was proposed. This new model provides a significant reference for comprehending the adsorption mechanism of coalbed methane and predicting deep coalbed methane resources.
2. Principle and Methodology
2.1. Principle
As shown in Figure 1a, the Langmuir adsorption equation assumes that methane molecules are homogeneously distributed in single molecular layers, with θ representing the adsorption coverage on a homogeneous solid surface [,,]. However, the scanning electron microscopy (SEM) results reveal that the pore structure of coal is heterogeneously distributed, as depicted in Figure 1b. Based on the relationship between the fractal adsorbent’s surface coverage and the ideal adsorbent’s behavior, a generalized form can be derived to characterize the heterogeneous surface coverage θf [], where σ denotes the cross-sectional area of methane molecules, and Df represents the fractal dimension of coal. Ultimately, based on this expression for θf, we derive a theoretical equation for the fractal adsorption model.
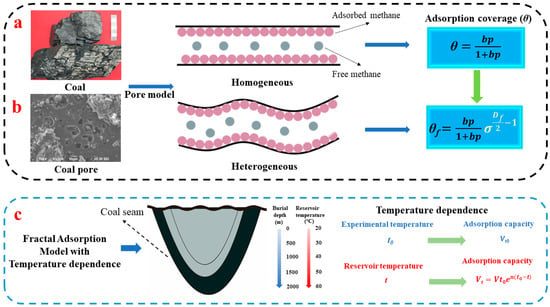
Figure 1.
Adsorption principle for coal; (a) conventional Langmuir equation that does not involve the heterogeneous pore structure; (b) fractal equation based on heterogeneous pore structure; (c) fractal adsorption with temperature dependence.
The temperature of the coal reservoir increases with increasing burial depth, and a higher temperature leads to a lower methane adsorption [,,,]. If t0 and t represent the experimental temperature and the coal reservoir temperature, respectively, Vt0 and Vt denote the maximum adsorption capacity corresponding to t0 and t. These values exhibit an exponential decline rule [], where n represents the attenuation coefficient of adsorption capacity under the influence of temperature. Therefore, based on the relationship between temperature and maximum methane adsorption, we can derive a fractal adsorption model on methane in coal with temperature effect dependence.
2.2. Methodology
The surface coverages of both the fractal adsorbent and the ideal adsorbent are quantitatively calculated in this section, establishing their relationship and proposing a fractal adsorption model on methane in coal with temperature effect dependence. The principle and methodology of the proposed equation are derived and comprehensively summarized in detail.
2.2.1. Coverage of Homogeneous Pore Surface
The Langmuir model assumes the monolayer adsorption of adsorbent molecules on a homogeneously distributed surface, without any intermolecular interactions [], using θ to represent the adsorption coverage on a homogeneous surface:
where represents the surface area covered by the adsorbent; represents the total surface area of the solid; and (1 − θ) denotes the percentage of unoccupied space. At equilibrium, the adsorption rate equals the desorption rate, based on the fundamental assumption. According to the kinetic theory of gas molecules, N signifies the number of colliding molecules per unit time on a unit surface.
Considering the variables in the Langmuir model, namely gas pressure (p), mass of the gas molecule (m), Boltzmann constant (k), and absolute temperature (T), represents the fraction of the collision molecules adsorbed. Following the fundamental assumption of the Langmuir model, it is expected that the adsorption rate should be determined as:
According to the fundamental assumption, the rate of desorption per unit time and unit area is directly proportional solely to the number of molecules adsorbed, thereby yielding the desorption rate :
v is the desorption proportional constant.
The above formula represents the desorption velocity when θ = 1. When the adsorption equilibrium is Va = Vd, the following equation can be derived:
where θ represents the surface coverage percentage, denoting the degree of coverage; p denotes gas pressure; α signifies the fraction adsorbed during molecular collisions; and b is the adsorption coefficient, which can be determined using the following expression:
where b represents a function dependent on temperature and adsorption heat, and serves as the initial constant for desorption proportionality.
2.2.2. Coverage of Heterogeneous Pore Surface
According to fractal theory, natural objects are fundamentally characterized by irregularity and disorder [,], with the self-similar fractal geometry being defined by its fractal dimension:
The adsorbent surface characterized by a fractal dimension is marked by the presence of adsorbent molecules, each possessing a radius denoted as r. Using Equation (6), the minimum number of required adsorbent molecules N can be expressed proportionally to the negative quadratic relationship concerning the cross-section radius r of these adsorbent molecules.
where A represents the proportionality constant; considering a series of adsorbents wherein the adsorption cross-sectional area of methane molecules is 0.181 nm2 of each constituent molecule and is directly proportional to the square of its cross-sectional radius r, the following equation can be obtained:
where C represents a constant. By substituting Formula (8) into Formula (7), we obtain the following expression:
Assuming there is a homogeneous adsorbent surface and that there is a complete monolayer saturation adsorption of adsorbent molecules across the entire surface, then:
Formula (9) represents the number of monolayer-saturated adsorption molecules on the surface of the fractal adsorbent, denoted as , which is determined by the ideal adsorbent’s cross-sectional area, and S represents the surface area of the adsorbent.
This relationship can be derived from Equations (9) and (10):
When Df = 2, , resulting in , so:
The concept of surface coverage can alternatively be articulated as:
The formula of n represents the quantity of adsorbent molecules present on the surface, while Nm denotes the number of fully saturated adsorbent molecules on that same surface.
The surface coverage on the homogeneous adsorbent is as follows:
The surface coverage on the fractal adsorbent is as follows:
The obtained results can be derived from Equations (13), (15), and (16):
The relationship between the surface coverage of the fractal adsorbent and that of the ideal adsorbent can be derived from Equations (5) and (17):
2.2.3. Fractal Adsorption Model with Temperature Effect Dependence
The fractal adsorption model can be derived in a general form from the equation for adsorption coverage on heterogeneous solid surfaces:
After transformation, it can be obtained as follows:
The gas pressure, denoted as p, is associated with the adsorption amount V of the adsorbed gas at a given pressure. The cross-sectional area σ represents the size of the adsorbent molecules, while the fractal dimension Df characterizes their structural complexity. Vm denotes the maximum adsorption capacity of the adsorbent. Vf refers to the fractal volume, and is the fractal pressure.
The fractal adsorption model can be transformed into the Langmuir equation when the value of Df = 2. Therefore, compared with the Langmuir equation, this model has more general significance.
where p represents gas pressure, V denotes the adsorption capacity of the gas corresponding to the given pressure, VL signifies the Langmuir volume, and PL refers to the Langmuir pressure at which adsorption occurs.
The maximum methane adsorption capacity in coal decreases exponentially with increasing reservoir temperature []. Here, we introduce the attenuation coefficient (n) to represent this decrease and derive a fractal adsorption model on methane in coal with temperature effect dependence:
The temperature correction coefficient, denoted as n, is applied to adjust the experimental temperature (t0) in degrees to match the temperature of the coal reservoir (t).
3. Sample and Experiment
3.1. Sample
The coal samples used in this experiment were collected from Caiyuan Coal Mine and Xiqu Coal Mine in the Shandong and Shanxi provinces of China, respectively. The sample numbers were designated as CY and XQ. Table 1 presents the coal quality analysis results and maceral components of the experimental samples. The vitrinite reflectance values for the XQ and CY samples were 1.3% and 2.1%, respectively, indicating that the coal samples corresponded to gas coal and coking coal.

Table 1.
Industrial analysis and maceral results of experimental coal samples.
3.2. Measurement of Pore Structure Parameters
The liquid nitrogen adsorption method is a commonly used technique for characterizing the pore structure of coal. It is based on the interaction between coal samples and nitrogen at liquid nitrogen temperature and involves measuring the relationship between the nitrogen adsorption amount and different relative pressures to obtain an adsorption isotherm. This allows for the determination of the distribution characteristics of the pore structure.
In this study, we employed an ASAP2020M automatic specific surface area and physical adsorption analyzer from Micromeritics Instrument Company (Norcross, GA, USA) to estimate the pore volume and specific surface area using the Brunauer–Emmett–Teller (BET) theoretical model, as well as the Barrett–Joyner–Halenda (BJH) method. Additionally, density functional theory (DFT) analysis was utilized to estimate the pore size distributions. The lower limit of the specific surface area measurement was set at 0.0005 m2/g, with no upper limit specified. The aperture analysis range spanned from 3.5 A to 5000 A, with a resolution of 0.2 A in the micropore section, while the minimum detectable pore volume was set at 0.0001 mm3/g.
3.3. Methane Isothermal Adsorption Experiment
The ISOSORP-GAS SC weight adsorption instrument was utilized to conduct isothermal adsorption experiments on the experimental samples, employing a magnetic suspension balance as its core component with an accuracy of up to 10 μg []. In comparison with the volumetric method, the gravimetric method provided a more reliable determination of experimental data []. To simulate the temperature conditions of deep coalbed methane reservoirs, the maximum experiment temperature was set at 70 °C. Isothermal adsorption experiments were performed on coal samples under water equilibrium conditions at temperatures of 30 °C, 50 °C, and 70 °C, respectively. Methane gas with a purity of 99.99% was used as the adsorbate in these experiments, and the maximum experimental pressure reached 10 MPa. A total of eight equilibrium adsorption pressure points were established, each with an adsorption equilibrium time of 12 h. This experiment successfully simulated both temperature and pressure conditions found in coal seams buried at depths ranging from 1000 to 2000 m. The specific experimental process is illustrated in Figure 2.
where ∆m indicates the magnetic suspension balance reading, g; Fb is the pull of the balance, N; g is the acceleration of gravity, m/s2; msc represents the mass of the sample barrel, g; ms represents sample mass, g; ma represents the mass of adsorbed methane, g; Vsc represents the sample barrel volume, cm3; Vs represents the sample volume, cm3; Va represents the adsorption phase volume, cm3; and represents the density of methane gas at different pressure points, g/cm3.
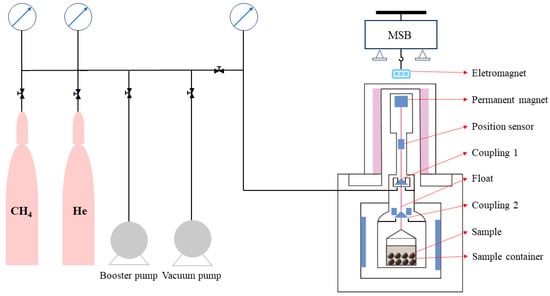
Figure 2.
Schematic diagram of the gravimetric isothermal adsorption experiment.
3.4. Calculation of Pore Fractal Dimension
The concept of fractal dimension was first proposed by Mandelbrot in 1975 [], and it has now become a widely used parameter for quantitatively characterizing the heterogeneous pore structure of coal [,,]. In coal samples, the fractal dimension of adsorption pores is calculated based on experimental results from liquid nitrogen adsorption using the Frenkel–Halsey–Hill (FHH) model []. The calculation formula is as follows:
The adsorption capacity (Vm) was determined by the fractal dimension (Df), saturated vapor pressure of the gas (P0), equilibrium pressure of gas adsorption (P), and a constant (C).
Finally, based on experimental coal sample data, a statistical relationship between LogV and Ln[Ln(P0/P)] was established to determine the fractal dimension of the coal sample.
4. Results
4.1. Pore Structure Parameter Analysis
According to the original data from the low-temperature liquid nitrogen adsorption experiment, an adsorption loop line is plotted. Figure 3 shows that the actual adsorption loop line of the CY coal sample exhibits minimal magnitude, indicating that the pore structure of coal primarily consists of nearly closed-end breathable pores with a diverse range of shapes and sizes. At lower relative pressures, there is an overlap between the adsorption and desorption branches, while the adsorption loop emerges at higher relative pressures. In contrast, for XQ coal samples, both the adsorption and desorption branches remain horizontal and parallel to each other across a wide pressure range, suggesting a significant presence of micropores in the coal.
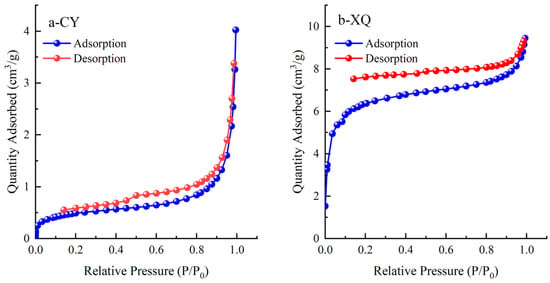
Figure 3.
Curves of adsorption and desorption loops.
Figure 4 and Figure 5 show the specific pore volume, specific surface area, and their respective proportions for each pore segment in the tested coal samples. Based on the experimental data obtained from low-temperature liquid nitrogen adsorption, relationships between pore size and the stage-specific pore volume, as well as the cumulative pore volume, are established. Additionally, relationships between pore size and the stage-specific surface area, as well as the cumulative pore-specific surface area, are also derived.
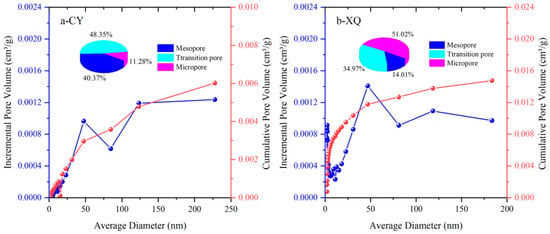
Figure 4.
Pore volume of the CY and XQ coal samples.
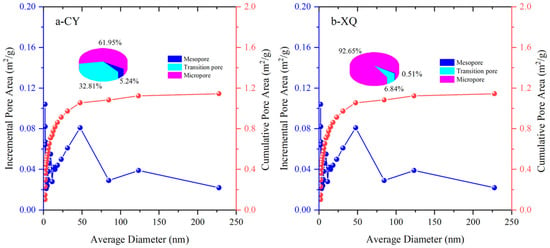
Figure 5.
Pore-specific surface area of the CY and XQ coal samples.
The total pore volume of the CY coal sample (gas coal) is 0.006019 mL/g, with transitional pores being the dominant type, accounting for 48.35%. Mesopores constitute the second largest fraction at 40.37%, while micropores have the smallest proportion at 11.28%. The total pore volume of the XQ coal sample (coking coal) is 0.01476 mL/g, with micropores being predominant at 51.02%, followed by transitional pores at 34% and with the medium-sized pores having the smallest proportion.
The above results indicate that there is a significant increase in micropore capacity as the coalification degree increases from gas to coking coal. Furthermore, it leads to a higher number of micropores when the coalification degree increases, suggesting that increased metamorphism promotes their formation. Additionally, the total pore volume also increases with a higher coalification degree, due to an augmentation in micropore content.
4.2. Estimation of Fractal Dimension (Df) for Coal Pore
The fractal dimension (Df) for pore size is the one of fundamental parameters for establishing the fractal adsorption model with temperature effect dependence in Equation (22). According to the experimental adsorption data of liquid nitrogen, a statistical relationship was established between LnV and Ln[ln(P0/P)] for two coal samples. Subsequently, the fractal dimension (Df) of the coal samples was calculated using Equation (10). The calculation results are presented in Figure 6. The obtained fractal dimensions for the coal samples were found to be 2.6279 and 2.93, respectively, with corresponding adjusted R2 values of 0.98509 and 0.99062, respectively. These results reveal that the pore structure of the experimental coal sample exhibits distinct fractal characteristics, with a higher complexity observed in the CY sample compared to the XQ sample.
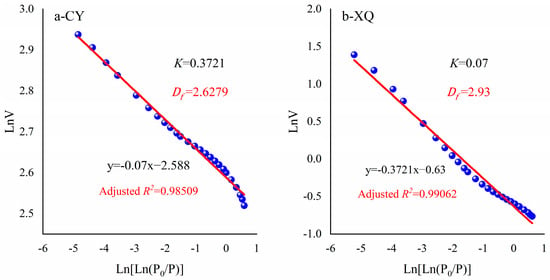
Figure 6.
Estimation of the fractal dimension Df for the pore.
4.3. Langmuir Adsorption Equation Fitting
According to Equation (7), the isothermal adsorption curves of CY and XQ samples, as well as VL and PL, at temperatures of 30 °C, 50 °C, and 70 °C, are depicted and summarized in Figure 7.
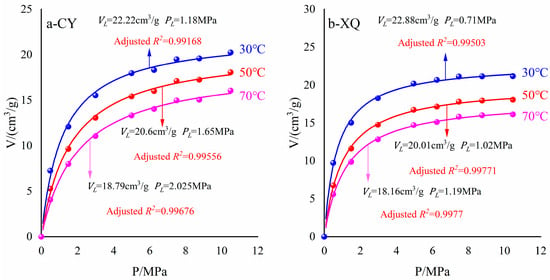
Figure 7.
Langmuir adsorption equation fitting.
The fitting of adsorption data for coal samples is illustrated in Figure 7. At temperatures of 30 °C, 50 °C, and 70 °C, the maximum adsorption capacities (VL) of the CY coal sample were determined to be 22.22 cm3/g, 20.6 cm3/g, and 18.79 cm3/g, respectively. Similarly, for the XQ coal sample, the maximum adsorption capacities (VL) were found to be 22.88 cm3/g, 20.01 cm3/g, and 18.16 cm3/g at the respective temperatures mentioned above.
Furthermore, as the pressure increased, the adsorption capacity of coal samples gradually rose before reaching a plateau phase, indicating saturation; this behavior aligns with previously established rules by Li [] and Liu []. It is worth noting that both the maximum adsorption capacity and adsorption isotherms decreased with increasing temperature for each specific coal sample. Deng [] conducted a similar study on anthracite using the volumetric method at temperatures of 25 °C, 35 °C, and 45 °C, which yielded consistent results with our experiment’s findings. This can be attributed to the increased kinetic energy of methane molecules due to the elevated temperature, resulting in more methane transitioning from an absorbed state to a free state []. Additionally, the heat released during the process of adsorption also contributed to reducing methane’s overall adsorption capacity within coal [,].
PL gradually increased with the temperature, while the Langmuir volume and pressure exhibited an inverse relationship. Yang conducted high-pressure methane adsorption experiments on four coal samples with varying pore structures, investigating the correlation between the Langmuir constant and proposing a fractal dimension-based adsorption model incorporating the Langmuir constant. The experimental findings indicate that PL is not independent of VL, and a complex pore structure corresponds to a higher number of adsorption energy sites, leading to multilayer adsorption, which enhances VL but reduces PL []. Consequently, methane’s adsorption capacity weakens as temperature rises. Considering the influence of the heterogeneous coal structure on adsorption behavior, multi-layered adsorption can occur within coal pores, thereby increasing methane’s adsorption capacity [].
4.4. Fractal Langmuir Adsorption Equation Fitting
To facilitate the calculation of the volume and pressure of fractal equation, the fractal model was converted into a linear line, represented by:
The detailed calculation procedure for determining the volume and pressure of the fractal equation is as follows: Firstly, was calculated based on data obtained from isothermal adsorption experiments. Secondly, was plotted against p, and a linear intercept of and slope of were fitted. Thirdly, the and from and were computed. The fitting process and results for two coal samples under different temperature conditions are presented in Figure 8.
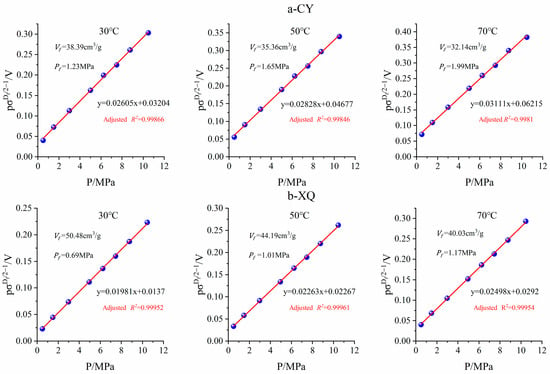
Figure 8.
Fitting results of fractal adsorption model parameters.
The adjusted R2 of the linear fractal model ranged from 0.9984 to 0.9997, indicating a high degree of fitting goodness. The maximum adsorption capacities Vf for CY and XQ coal samples at 30 °C were determined as 38.39 cm3/g and 50.48 cm3/g, respectively. As the temperature increased, Vf decreased while Pf increased, consistent with the adsorption constant observed in the Langmuir model.
The comparison revealed that for the same coal sample, Pf and PL values were closely aligned; however, Vf exhibited a significant increase, compared to VL. Under identical temperatures, the CY coal sample demonstrated an approximately 1.73-fold increase in Vf, whereas the XQ coal sample showed a greater enhancement by about 2.21 times. The curved and heterogeneous pore structure provided additional methane adsorption sites within the pores, leading to potential multi-layer adsorption [,,]. Therefore, the fractal model fitting yielded significantly higher maximum adsorption capacities than those obtained through Langmuir modeling.
Previous studies demonstrated a positive correlation between the fractal dimension of porous media and its adsorption capacity [,,]. In comparison to the CY coal sample, the XQ coal sample exhibited a higher fractal dimension, indicating an increased number of adsorption sites within its pore structure. Moreover, considering that the XQ coal sample possessed a higher coalification degree than the CY coal sample, it consequently displayed a relatively higher Vf value and thus showcased an enhanced adsorption capacity.
5. Discussion
5.1. Estimation of Attenuation Coefficient
Previous studies have confirmed a gradual decrease in the maximum adsorption capacity of methane with increasing temperature. For instance, Ettinger initially proposed an empirical equation demonstrating an exponential decline in methane adsorption in coal as temperature rises. Levy observed that at a pressure of 5 MPa and within the temperature range of 10–70 °C, the equilibrium water–coal sample’s methane adsorption capacity decreased by 0.12 cm3/g for every 10 °C increase in experimental temperature []. Ryan emphasized that methane adsorption in deep coal seams is primarily influenced by temperature rather than pressure and exhibits a weak correlation with pressure []. Jing conducted measurements on methane adsorption under various pressure conditions ranging from 20 °C to 100 °C, revealing a gradual reduction in methane adsorption with increasing temperature, particularly during high-pressure stages, where temperature exerted a significant influence on the amount of methane adsorbed [].
To further investigate the relationship between different temperature conditions and the maximum adsorption capacity of methane, we introduced the attenuation coefficient n to characterize the variation pattern of adsorption capacity with increasing temperature. Due to variations in pore structure among different coal samples, the adsorption attenuation coefficients differed as temperature increased. Based on the calculation results in Section 4.4, an exponential relationship was fitted for the maximum adsorption capacities Vf of both samples at 30 °C, 50 °C, and 70 °C. As shown in Figure 9, CY and XQ coal samples had attenuation coefficients of −0.006 and −0.004, respectively. Compared to XQ coal samples, CY coal samples exhibited a faster decrease in maximum adsorption capacity with increasing temperature.
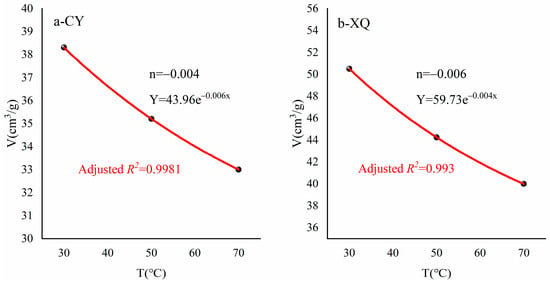
Figure 9.
Estimation of the attenuation coefficient.
5.2. Accuracy Verification of Fractal Adsorption Model with Temperature Effect Dependence
According to the estimation results in Section 4.4 and Section 5.1, the Vf values of CY and XQ coal samples and their attenuation coefficients were substituted into Equation (22) to predict the corresponding Vf at 30 °C, 50 °C, and 70 °C (Equations (26) and (27)), which were then compared with the actual values calculated in Section 4.4.
To assess the accuracy of the model, two parameters, absolute error and relative error, were employed (Figure 10). As depicted in Figure 10, under temperature conditions of 30 °C, 50 °C, and 70 °C, the absolute errors between actual and predicted Vf values for CY and XQ coal samples ranged from 0.06 to 1.08 cm3/g, while relative errors ranged from 0.001 to 0.024. Specifically for CY coal samples, absolute errors were found as follows, respectively: at a temperature of (i) 30 °C, 0.6 cm3/g; (ii) at 50 °C, 0.63 cm3/g; and (iii) at 70 °C, 1.08 cm3/g, with the corresponding relative errors being (i) 0.011, (ii) 0.013, and (iii) 0.024. For XQ coal samples, absolute errors were found as follows, respectively: (i) at a temperature of (i) 30 °C, 0.59 cm3/g; (ii) at 50 °C, 0.06 cm3/g; and (iii) at 70 °C, 0.78 cm3/g, with the corresponding relative errors being (i) 0.008, (ii) 0.001, and (iii) 0.014. Therefore, the fractal adsorption model incorporating temperature effect dependence exhibits high accuracy.
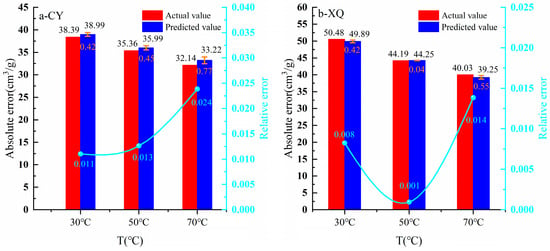
Figure 10.
Comparison of the actual value of Vf with the predicted value.
5.3. Application
The gas storage capacity of a coalbed methane reservoir is a crucial parameter for estimating the reserves of coalbed methane resources [,]. Additionally, the temperature of the coal reservoir plays a significant role in evaluating its gas storage capacity. Since methane in coal primarily exists in an adsorbed state within the reservoirs [], gas content is typically determined through isothermal adsorption experiments on methane in coal []. However, accurately characterizing the methane adsorption capacity of deep coal reservoirs using experimental methods remains challenging. Therefore, we propose a method to estimate the methane adsorption capacity of deep coal seams. Considering the geothermal gradient of the coal reservoir, it can be observed that every 100 m increase in burial depth leads to a corresponding rise in reservoir temperature by 3 °C []. Hence, we establish the following correlation between burial depth and temperature of the deep coal reservoir:
where T is the coal reservoir temperature, T0 is the experimental temperature, h is the buried depth, and α = 3, is the temperature gradient.
The calculation process for determining the methane adsorption capacity of deep coal reservoirs is as follows: (a) 2–3 experimental temperatures based on the burial depth of the coal seam were set, and the corresponding adsorption isotherms for samples at different temperature conditions were measured; (b) the fractal dimension (Df) of the sample using the liquid nitrogen adsorption method was determined; (c) the Vf and Pf values were obtained using a linear fractal model, and the attenuation coefficient n of the adsorption capacity was determined based on the exponential relationship of Vf at different temperatures; and (d) the temperature corresponding to the burial depth of the coal seam was substituted into Equation (28) to obtain the methane adsorption capacity specific to that depth. The detailed calculation method is illustrated in Figure 11.
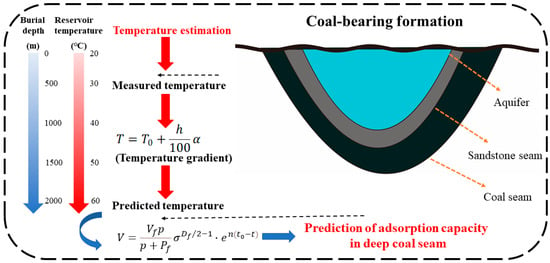
Figure 11.
Prediction strategy of methane adsorption in a deep coal seam.
The occurrence modes of coalbed methane include the adsorbed state, free state, and dissolved state. Among them, the adsorbed state typically accounts for more than 80 percent, which sets it apart from conventional natural gas. This difference makes the extraction of coalbed methane more challenging, compared to conventional natural gas. Therefore, accurately estimating the amount of adsorbed gas in a coal seam is crucial for effective extraction. This study comprehensively examines the heterogeneity and temperature effects of coal, subsequently unveiling the occurrence state of deep coalbed methane. It provides a theoretical basis for the exploration and development of deep coalbed methane. Furthermore, this approach can provide a theoretical foundation for understanding accumulation conditions and distribution patterns and predicting sweet spots in deep CBM reservoirs. It also presents the significance as a reference for exploring and developing other unconventional gas reservoirs, such as shale gas, tight sandstone gas, water-soluble gas, and natural gas hydrate.
6. Conclusions
In this study, the pore structure parameters and the fractal dimensions for the pore size of gas coal and coking coal are investigated by the low-temperature N2 adsorption experiment. Additionally, the fractal equation based on the fractal dimension (Df) of coal pores and the attenuation coefficient (n) of adsorption capacity is proposed. Subsequently, the accuracy of this novel model is thoroughly investigated. Finally, a predictive approach for methane adsorption in deep coal reservoirs is proposed, leading to the following conclusions.
- The pore structure heterogeneity in coal manifests pronounced fractal features that can be described using the fractal dimension (Df), and the fractal dimensions (Df) for the gas coal and coking coal are 2.6279 and 2.93, respectively.
- The fractal adsorption constants, Vf and Pf, corresponding to coal samples at 30 °C, 50 °C, and 70 °C are calculated, respectively, and n is used to characterize the attenuation coefficient of Vf with increasing temperature. The adsorption capacity attenuation adsorptions of gas coal and coking coal are −0.006 and −0.004, respectively.
- The fractal equation fitting demonstrates a higher adjusted R2, compared to the Langmuir equation fitting. In addition, under temperature conditions of 30 °C, 50 °C, and 70 °C, the absolute errors between actual and predicted Vf values for CY and XQ coal samples range from 0.06 to 1.08 cm3/g, while relative errors range from 0.001 to 0.024, indicating that the proposed fractal equation demonstrates a higher accuracy than the traditional Langmuir equation.
- Based on the relationship between the temperature gradient and the buried depth of coal reservoirs, a prediction method of methane adsorption in deep coal reservoirs is established to furnish a reference point to aid in the exploration and development efforts of unconventional gas.
Author Contributions
Conceptualization, G.L. and P.C.; data curation, F.G., Z.Z. and B.X.; formal analysis, F.G., J.L., R.L., B.X. and G.B; funding acquisition, G.L.; methodology, F.G. and G.L.; supervision, G.L; visualization, F.G.; writing—original draft, F.G. and G.L.; writing—review and editing, G.L., G.B. and P.C. All authors have read and agreed to the published version of the manuscript.
Funding
This research was supported by the National Natural Science Foundation of China (No. 42230814 and No. 42372204), the China Scholarship Council (No. 202308410549), the Henan Province International Science and Technology Cooperation Project (No. 242102520034), the Henan Province Science and Technology Research Project (No. 242102320365), and the Key Research Project of Higher Education Institutions in Henan Province (No. 24B170005).
Data Availability Statement
Data are contained within the article.
Conflicts of Interest
The authors declare no conflicts of interest.
References
- Zhang, X.G.; Ranjith, P.G.; Perera, M.S.A.; Ranathunga, A.S.; Haque, A. Gas transportation and enhanced coalbed methane recovery processes in deep coal seams: A review. Energy Fuels 2016, 30, 8832–8849. [Google Scholar] [CrossRef]
- Li, L.; Liu, D.; Cai, Y.; Wang, Y.; Jia, Q. Coal structure and its implications for coalbed methane exploitation: A review. Energy Fuels 2020, 35, 86–110. [Google Scholar] [CrossRef]
- Liu, G.F.; Liu, H.; Xian, B.A.; Gao, D.L.; Wang, X.M.; Zhang, Z. Fuzzy pattern recognition model of geological sweetspot for coalbed methane development. Pet. Explor. Dev. 2023, 50, 924–933. [Google Scholar] [CrossRef]
- Sun, F.; Liu, D.; Cai, Y.; Qiu, Y. Coalification degree-pressure coupling control mechanism on gas adsorption/desorption in coalbed methane reservoirs. Energy 2023, 270, 126849. [Google Scholar] [CrossRef]
- Wang, F.; Yao, Y.; Wen, Z.; Sun, Q.; Yuan, X. Effect of water occurrences on methane adsorption capacity of coal: A comparison between bituminous coal and anthracite coal. Fuel 2020, 266, 117102. [Google Scholar] [CrossRef]
- Liu, G.F.; Li, B.L.; Zhang, Z.; Liu, H.; Xiong, X.; Wang, X. Effects of liquid CO2 phase transition fracturing on methane adsorption of coal. Energy Fuels 2023, 37, 1949–1961. [Google Scholar] [CrossRef]
- Zhou, D.; Wu, C.; Song, Y.; Xian, B.; Gao, B.; Zhang, Z.; Liu, G.F. Evolution characteristic and implication of coalbed methane desorption stages division for tectonically deformed coals. Transp. Porous Media 2022, 141, 713–736. [Google Scholar] [CrossRef]
- Meng, Y.; Tang, D.; Xu, H.; Qu, Y.; Li, Y.; Zhang, W. Division of coalbed methane desorption stages and its significance. Pet. Explor. Dev. 2014, 41, 671–677. [Google Scholar] [CrossRef]
- Connell, L.D.; Pan, Z.; Camilleri, M. The variation in produced gas composition from mixed gas coal seam reservoirs. Int. J. Coal Geol. 2019, 201, 62–75. [Google Scholar] [CrossRef]
- Yu, B.; Cheng, P. A fractal permeability model for bi-dispersed porous media. Int. J. Heat Mass Transf. 2002, 45, 2983–2993. [Google Scholar] [CrossRef]
- Zhang, Y.; Zeng, J.; Cai, J.; Feng, S.; Feng, X.; Qiao, J. A mathematical model for determining oil migration characteristics in low-permeability porous media based on fractal theory. Transp. Porous Media 2019, 129, 633–652. [Google Scholar] [CrossRef]
- Guo, H.; Yuan, L.; Cheng, Y.; Wang, K.; Xu, C. Experimental investigation on coal pore and fracture characteristics based on fractal theory. Powder Technol. 2019, 346, 341–349. [Google Scholar] [CrossRef]
- Liu, X.; Kong, X.; Nie, B.; Song, D.; He, X.; Wang, L. Pore Fractal dimensions of bituminous coal reservoirs in north china and their impact on gas adsorption capacity. Nat. Resour. Res. 2021, 30, 4585–4596. [Google Scholar] [CrossRef]
- Zhang, Z.; Liu, G.F.; Wang, X.M.; Lv, R.S.; Liu, H.; Lin, J.; Barakos, G.; Chang, P. A fractal Langmuir adsorption equation on coal: Principle, methodology and implication. Chem. Eng. J. 2024, 488, 150869. [Google Scholar] [CrossRef]
- Zhang, Z.; Liu, G.F.; Chang, P.; Wang, X.M.; Lin, J. Fractal characteristics for coal chemical structure: Principle, methodology and implication. Chaos Solitons Fractals 2023, 173, 113699. [Google Scholar] [CrossRef]
- Wang, Y.; Zhou, H.; Yu, F.; Shi, B.; Tang, H. Fractal adsorption characteristics of complex molecules on particles-A case study of dyes onto granular activated carbon (GAC). Physicochem. Eng. Asp. 2007, 299, 224–231. [Google Scholar]
- Karacan, C.O.; Okandan, E. Adsorption and gas transport in coal microstructure: Investigation and evaluation by quantitative X-ray CT imaging. Fuel 2001, 80, 509–520. [Google Scholar] [CrossRef]
- Lu, G.; Wang, J.; Wei, C.; Song, Y.; Yan, G.; Zhang, J.; Cheng, G. Pore fractal model applicability and fractal characteristics of seepage and adsorption pores in middle rank tectonic deformed coals from the Huaibei coal field. Pet. Sci. Eng. 2018, 171, 808–817. [Google Scholar]
- Wang, J.G.; Hu, B.; Wu, D.; Dou, F.; Wang, X. A multiscale fractal transport model with multilayer sorption and effective porosity effects. Transp. Porous Media 2019, 129, 25–51. [Google Scholar] [CrossRef]
- Zhang, Z.; Liu, G.; Wang, X.; Li, B.; Liu, H. Fractal characterization on fracture volume in coal based on CT scanning: Principle, methodology, and implication. Fractals 2022, 30, 2250124. [Google Scholar] [CrossRef]
- Hall, F.E.; Zhou, C.; Gasem, K.A.M.; Robinson, R.L., Jr.; Yee, D. Adsorption of pure methane, nitrogen, and carbon dioxide and their binary mixtures on wet Fruitland coal. In Proceedings of the SPE Eastern Regional Meeting, Charleston, WV, USA, 8–10 November 1994; p. 29194. [Google Scholar]
- Alafnan, S.; Awotunde, A.; Glatz, G.; Adjei, S.; Alrumaih, I.; Gowida, A. Langmuir adsorption isotherm in unconventional resources: Applicability and limitations. J. Pet. Sci. Eng. 2021, 207, 109172. [Google Scholar] [CrossRef]
- Larsson, A.O. Online, all the time? A quantitative assessment of the permanent campaign on Facebook. New Media Soc. 2016, 18, 274–292. [Google Scholar] [CrossRef]
- He, J.; Shi, Y.; Ahn, S.; Kang, J.W.; Lee, C.H. Adsorption and desorption of CO2 on Korean coal under subcritical to supercritical conditions. J. Phys. Chem. B 2010, 114, 4854–4861. [Google Scholar] [CrossRef]
- Pan, J.; Hou, Q.; Ju, Y.; Bai, H.; Zhao, Y. Coalbed methane sorption related to coal deformation structures at different temperatures and pressures. Fuel 2012, 102, 760–765. [Google Scholar] [CrossRef]
- Qiao, K.; Zhong, S.; Tang, S.; Yang, K.; Yue, H.; Ma, K.; Liang, B. Influence of pore structure on thermal stress distribution inside coal particles during primary fragmentation. Particuology 2024, 85, 49–61. [Google Scholar] [CrossRef]
- Teng, T.; Wang, J.G.; Gao, F.; Ju, Y.; Jiang, C. A thermally sensitive permeability model for coal-gas interactions including thermal fracturing and volatilization. J. Nat. Gas Sci. Eng. 2016, 32, 319–333. [Google Scholar] [CrossRef]
- Kang, J.; Elsworth, D.; Fu, X.; Liang, S.; Chen, H. Contribution of thermal expansion on gas adsorption to coal sorption-induced swelling. Chem. Eng. J. 2022, 432, 134427. [Google Scholar] [CrossRef]
- Mukherjee, M.; Misra, S. A review of experimental research on Enhanced Coal Bed Methane (ECBM) recovery via CO2 sequestration. Earth-Sci. Rev. 2018, 179, 392–410. [Google Scholar] [CrossRef]
- Wang, Z.; Tang, X.; Yue, G.; Kang, B.; Xie, C.; Li, X. Physical simulation of temperature influence on methane sorption and kinetics in coal: Benefits of temperature under 273.15 K. Fuel 2015, 158, 207–216. [Google Scholar] [CrossRef]
- Busch, A.; Gensterblum, Y. CBM and CO2-ECBM related sorption processes in coal: A review. Int. J. Coal Geol. 2011, 87, 49–71. [Google Scholar] [CrossRef]
- Bolis, V. Fundamentals in Adsorption at the Solid-Gas Interface. Calorim. Therm. Methods Catal. 2013, 3–50. [Google Scholar] [CrossRef]
- Berezin, G.I.; Kiselev, A.V. Adsorbate-adsorbate association on a homogenous surface of a nonspecific adsorbent. J. Colloid Interface Sci. 1972, 38, 227–233. [Google Scholar] [CrossRef]
- Yan, M.; Bai, Y.; Li, S.G.; Lin, H.F.; Yan, D.J.; Shu, C.M. Factors influencing the gas adsorption thermodynamic characteristics of low-rank coal. Fuel 2019, 248, 117–126. [Google Scholar] [CrossRef]
- Rahman, N.; Raheem, A. Adsorption of Cd (II) ions on magnetic graphene oxide/cellulose modified with β-cyclodextrin: Analytical interpretation via statistical physics modeling and fractal like kinetic approach. Environ. Res. 2024, 243, 117868. [Google Scholar] [CrossRef] [PubMed]
- Yang, W.; Wang, Y.; Yan, F.; Si, G.; Lin, B. Evolution characteristics of coal microstructure and its influence on methane adsorption capacity under high temperature pyrolysis. Energy 2022, 254, 124262. [Google Scholar] [CrossRef]
- Wang, Z.; Fu, X.; Pan, J.; Deng, Z. Effect of N2/CO2 injection and alternate injection on volume swelling/shrinkage strain of coal. Energy 2023, 275, 127377. [Google Scholar] [CrossRef]
- Liu, Y.; Zhu, Y.; Liu, S.; Li, W.; Tang, X. Temperature effect on gas adsorption capacity in different sized pores of coal: Experiment and numerical modeling. J. Pet. Sci. Eng. 2018, 165, 821–830. [Google Scholar] [CrossRef]
- Zhang, J.; Wei, C.; Zhao, C.; Zhang, T.; Lu, G.; Zou, M. Effects of nano-pore and macromolecule structure of coal samples on energy parameters variation during methane adsorption under different temperature and pressure. Fuel 2021, 289, 119804. [Google Scholar] [CrossRef]
- Ettinger, I.; Eremin, I.; Zimakov, B. Natural factors influencing coal sorption properties. I. Petrography and sorption properties of coals. Fuel 1966, 45, 267–275. [Google Scholar]
- Langmuir, I. The constitution and fundamental properties of solids and liquids. Part I.-Solids. J. Am. Chem. Soc. 1916, 38, 2221–2295. [Google Scholar] [CrossRef]
- Mandelbrot, B. The Fractal Geometry of Nature; WH Freeman: New York, NY, USA, 1983. [Google Scholar]
- Zhang, Z.; Liu, G.; Lin, J.; Barakos, G.; Chang, P. Fractal Evolution Characteristics on the Three-Dimensional Fractures in Coal Induced by CO2 Phase Transition Fracturing. Fractal Fract. 2024, 8, 273. [Google Scholar] [CrossRef]
- Ottiger, S.; Pini, R.; Storti, G.; Mazzotti, M. Competitive adsorption equilibria of CO2 and CH4 on a dry coal. Adsorption 2008, 14, 539–556. [Google Scholar] [CrossRef]
- Zhou, S.; Xue, H.; Ning, Y.; Guo, W.; Zhang, Q. Experimental study of supercritical methane adsorption in Longmaxi shale: Insights into the density of adsorbed methane. Fuel 2018, 211, 140–148. [Google Scholar] [CrossRef]
- Mandelbrot, B. Stochastic models for the Earth’s relief, the shape and the fractal dimension of the coastlines, and the number area rule for islands. Proc. Natl. Acad. Sci. USA 1975, 72, 3825–3828. [Google Scholar] [CrossRef]
- Luo, Y.; Xia, B.; Li, H.; Hu, H.; Wu, M.; Ji, K. Fractal permeability model for dual-porosity media embedded with natural tortuous fractures. Fuel 2021, 295, 120610. [Google Scholar] [CrossRef]
- Tian, J.; Liu, J.; Elsworth, D.; Leong, Y.K.; Li, W. An effective stress-dependent dual-fractal permeability model for coal considering multiple flow mechanisms. Fuel 2023, 334, 126800. [Google Scholar] [CrossRef]
- Zhang, Z.; Liu, G.F.; Wang, X.M.; Wang, M.S.; Li, B.L.; Liu, H. Fractal Characterization on Three-dimensional Fractur Tortuosity in Coal based on CT Scanning. Fractals 2023, 30, 2350034. [Google Scholar] [CrossRef]
- Liu, G.F.; Zhang, Z.; Cao, Y.X.; Wang, X.M.; Liu, H.; Li, B.L.; Si, N.; Guan, W.B. An analogical method on fractal dimension for Three-Dimensional fracture tortuosity in coal based on CT scanning. Fractals 2023, 31, 2350072. [Google Scholar] [CrossRef]
- Ning, S.; Xia, P.; Hao, F.; Tian, J.; Fu, Y.; Wang, K. Pore Fractal Characteristics between Marine and Marine–Continental Transitional Black Shales: A Case Study of Niutitang Formation and Longtan Formation. Fractal Fract. 2024, 8, 288. [Google Scholar] [CrossRef]
- Li, Y.; Lin, B.; Zhang, X. Effect of temperature on structural evolution and breakdown electrical characteristics of bituminous coal subjected to plasma breakage. Fuel 2022, 328, 125346. [Google Scholar] [CrossRef]
- Liu, D.; Zou, Z.; Cai, Y.; Qiu, Y.; Zhou, Y.; He, S. An updated study on CH4 isothermal adsorption and isosteric adsorption heat behaviors of variable rank coals. J. Nat. Gas Sci. Eng. 2021, 89, 103899. [Google Scholar] [CrossRef]
- Deng, J.; Kang, J.; Zhou, F.; Li, H.; Zhang, D.; Li, G. The adsorption heat of methane on coal: Comparison of theoretical and calorimetric heat and model of heat flow by microcalorimeter. Fuel 2019, 237, 81–90. [Google Scholar] [CrossRef]
- Zhang, L.; Aziz, N.; Ren, T.X.; Wang, Z. Influence of temperature on coal sorption characteristics and the theory of coal surface free energy. Procedia Eng. 2011, 26, 1430–1439. [Google Scholar] [CrossRef]
- Wu, S.; Tang, D.; Li, S.; Chen, H.; Wu, H. Coalbed methane adsorption behavior and its energy variation features under supercritical pressure and temperature conditions. J. Pet. Sci. Eng. 2016, 146, 726–734. [Google Scholar] [CrossRef]
- Wang, Z.; Li, Y.; Wang, Z.; Zhou, L. Factors influencing the methane adsorption capacity of coal and adsorption heat variations. Energy Fuels 2023, 37, 13080–13092. [Google Scholar] [CrossRef]
- Yang, Y.; Liu, S.; Zhao, W.; Wang, L. Intrinsic relationship between Langmuir sorption volume and pressure for coal: Experimental and thermodynamic modeling study. Fuel 2019, 241, 105–117. [Google Scholar] [CrossRef]
- Krooss, B.M.; Van, B.; Gensterblum, Y.; Siemons, N.; Pagnier, H.; David, P. High-pressure methane and carbon dioxide adsorption on dry and moisture-equilibrated Pennsylvanian coals. Int. J. Coal Geol. 2002, 51, 69–92. [Google Scholar] [CrossRef]
- Zhao, L.; Guanhua, N.; Yan, W.; Hehe, J.; Yongzan, W.; Haoran, D.; Mao, J. Semi-homogeneous model of coal based on 3D reconstruction of CT images and its seepage-deformation characteristics. Energy 2022, 259, 125044. [Google Scholar] [CrossRef]
- Liang, H.; Qi, Z.; Wang, S.; Huang, X.; Yan, W.; Yuan, Y.; Li, Z. Adsorption Models for Shale Gas: A Mini-Review. Energy Fuels 2022, 36, 12946–12960. [Google Scholar] [CrossRef]
- Zhang, M.; Fu, X. Influence of reservoir properties on the adsorption capacity and fractal features of shales from Qinshui coalfield. J. Pet. Sci. Eng. 2019, 177, 650–662. [Google Scholar] [CrossRef]
- Cheng, Y.W.; Shi, X.H.; Wen, J.S.; Wei, C. Fractal dimension of coal particles and their CH4 adsorption. Int. J. Min. Sci. Technol. 2012, 22, 855–858. [Google Scholar] [CrossRef]
- Yao, Y.; Liu, D.; Tang, D.; Tang, S.; Huang, W. Fractal characterization of adsorption-pores of coals from North China: An investigation on CH4 adsorption capacity of coals. Int. J. Coal Geol. 2008, 73, 27–42. [Google Scholar] [CrossRef]
- Levy, J.H.; Day, S.J.; Killingley, J.S. Methane capacities of Bowen Basin coals related to coal properties. Fuel 1997, 76, 813–819. [Google Scholar] [CrossRef]
- Ryan, B.; Lane, B.; Gentzis, T. Controls on methane adsorption capacity of lower cretaceous coals from Northeastern British Columbia, Canada: Part 2—Effect of temperature, pressure, maceral composition, and mineral matter on adsorption. Energy Sources 2003, 25, 1155–1170. [Google Scholar] [CrossRef]
- Jing, T.; Zhang, J.; Zhu, M.; Zhao, W.; Zhou, J.; Yin, Y. Methane adsorption in anthracite coal under different pressures and temperatures-A study combining isothermal adsorption and molecular simulation. Geofluids 2023, 2023, 1–15. [Google Scholar] [CrossRef]
- Altowilib, A.; Alsaihati, A.; Alhamood, H.; Alafnan, S.; Alarifi, S. Reserves estimation for coalbed methane reservoirs: A review. Sustainability 2020, 12, 10621. [Google Scholar] [CrossRef]
- Kirmani, F.; Raza, A.; Akram, M.; Gholami, R. Assessment of parameters effectiveness in the reserve estimation methods applicable to coal bed methane reservoirs. Pet. Res. 2023, 8, 44–53. [Google Scholar] [CrossRef]
- Qin, Y.; Moore, T.A.; Shen, J.; Yang, Z.; Shen, Y.; Wang, G. Resources and geology of coalbed methane in China: A review. Coal Geol. China 2020, 247–282. [Google Scholar] [CrossRef]
- Li, Y.; Wang, Z.; Tang, S.; Elsworth, D. Re-evaluating adsorbed and free methane content in coal and its ad-and desorption processes analysis. Chem. Eng. J. 2022, 428, 131946. [Google Scholar] [CrossRef]
- Ren, Z.L.; Zhang, S.; Gao, S.L.; Cui, J.P.; Xiao, Y.Y.; Xiao, H. Tectonic thermal history and its significance on the formation of oil and gas accumulation and mineral deposit in Ordos Basin. Sci. China Ser. D Earth Sci. 2007, 50, 27–38. [Google Scholar] [CrossRef]
Disclaimer/Publisher’s Note: The statements, opinions and data contained in all publications are solely those of the individual author(s) and contributor(s) and not of MDPI and/or the editor(s). MDPI and/or the editor(s) disclaim responsibility for any injury to people or property resulting from any ideas, methods, instructions or products referred to in the content. |
© 2024 by the authors. Licensee MDPI, Basel, Switzerland. This article is an open access article distributed under the terms and conditions of the Creative Commons Attribution (CC BY) license (https://creativecommons.org/licenses/by/4.0/).